


1. Introduction
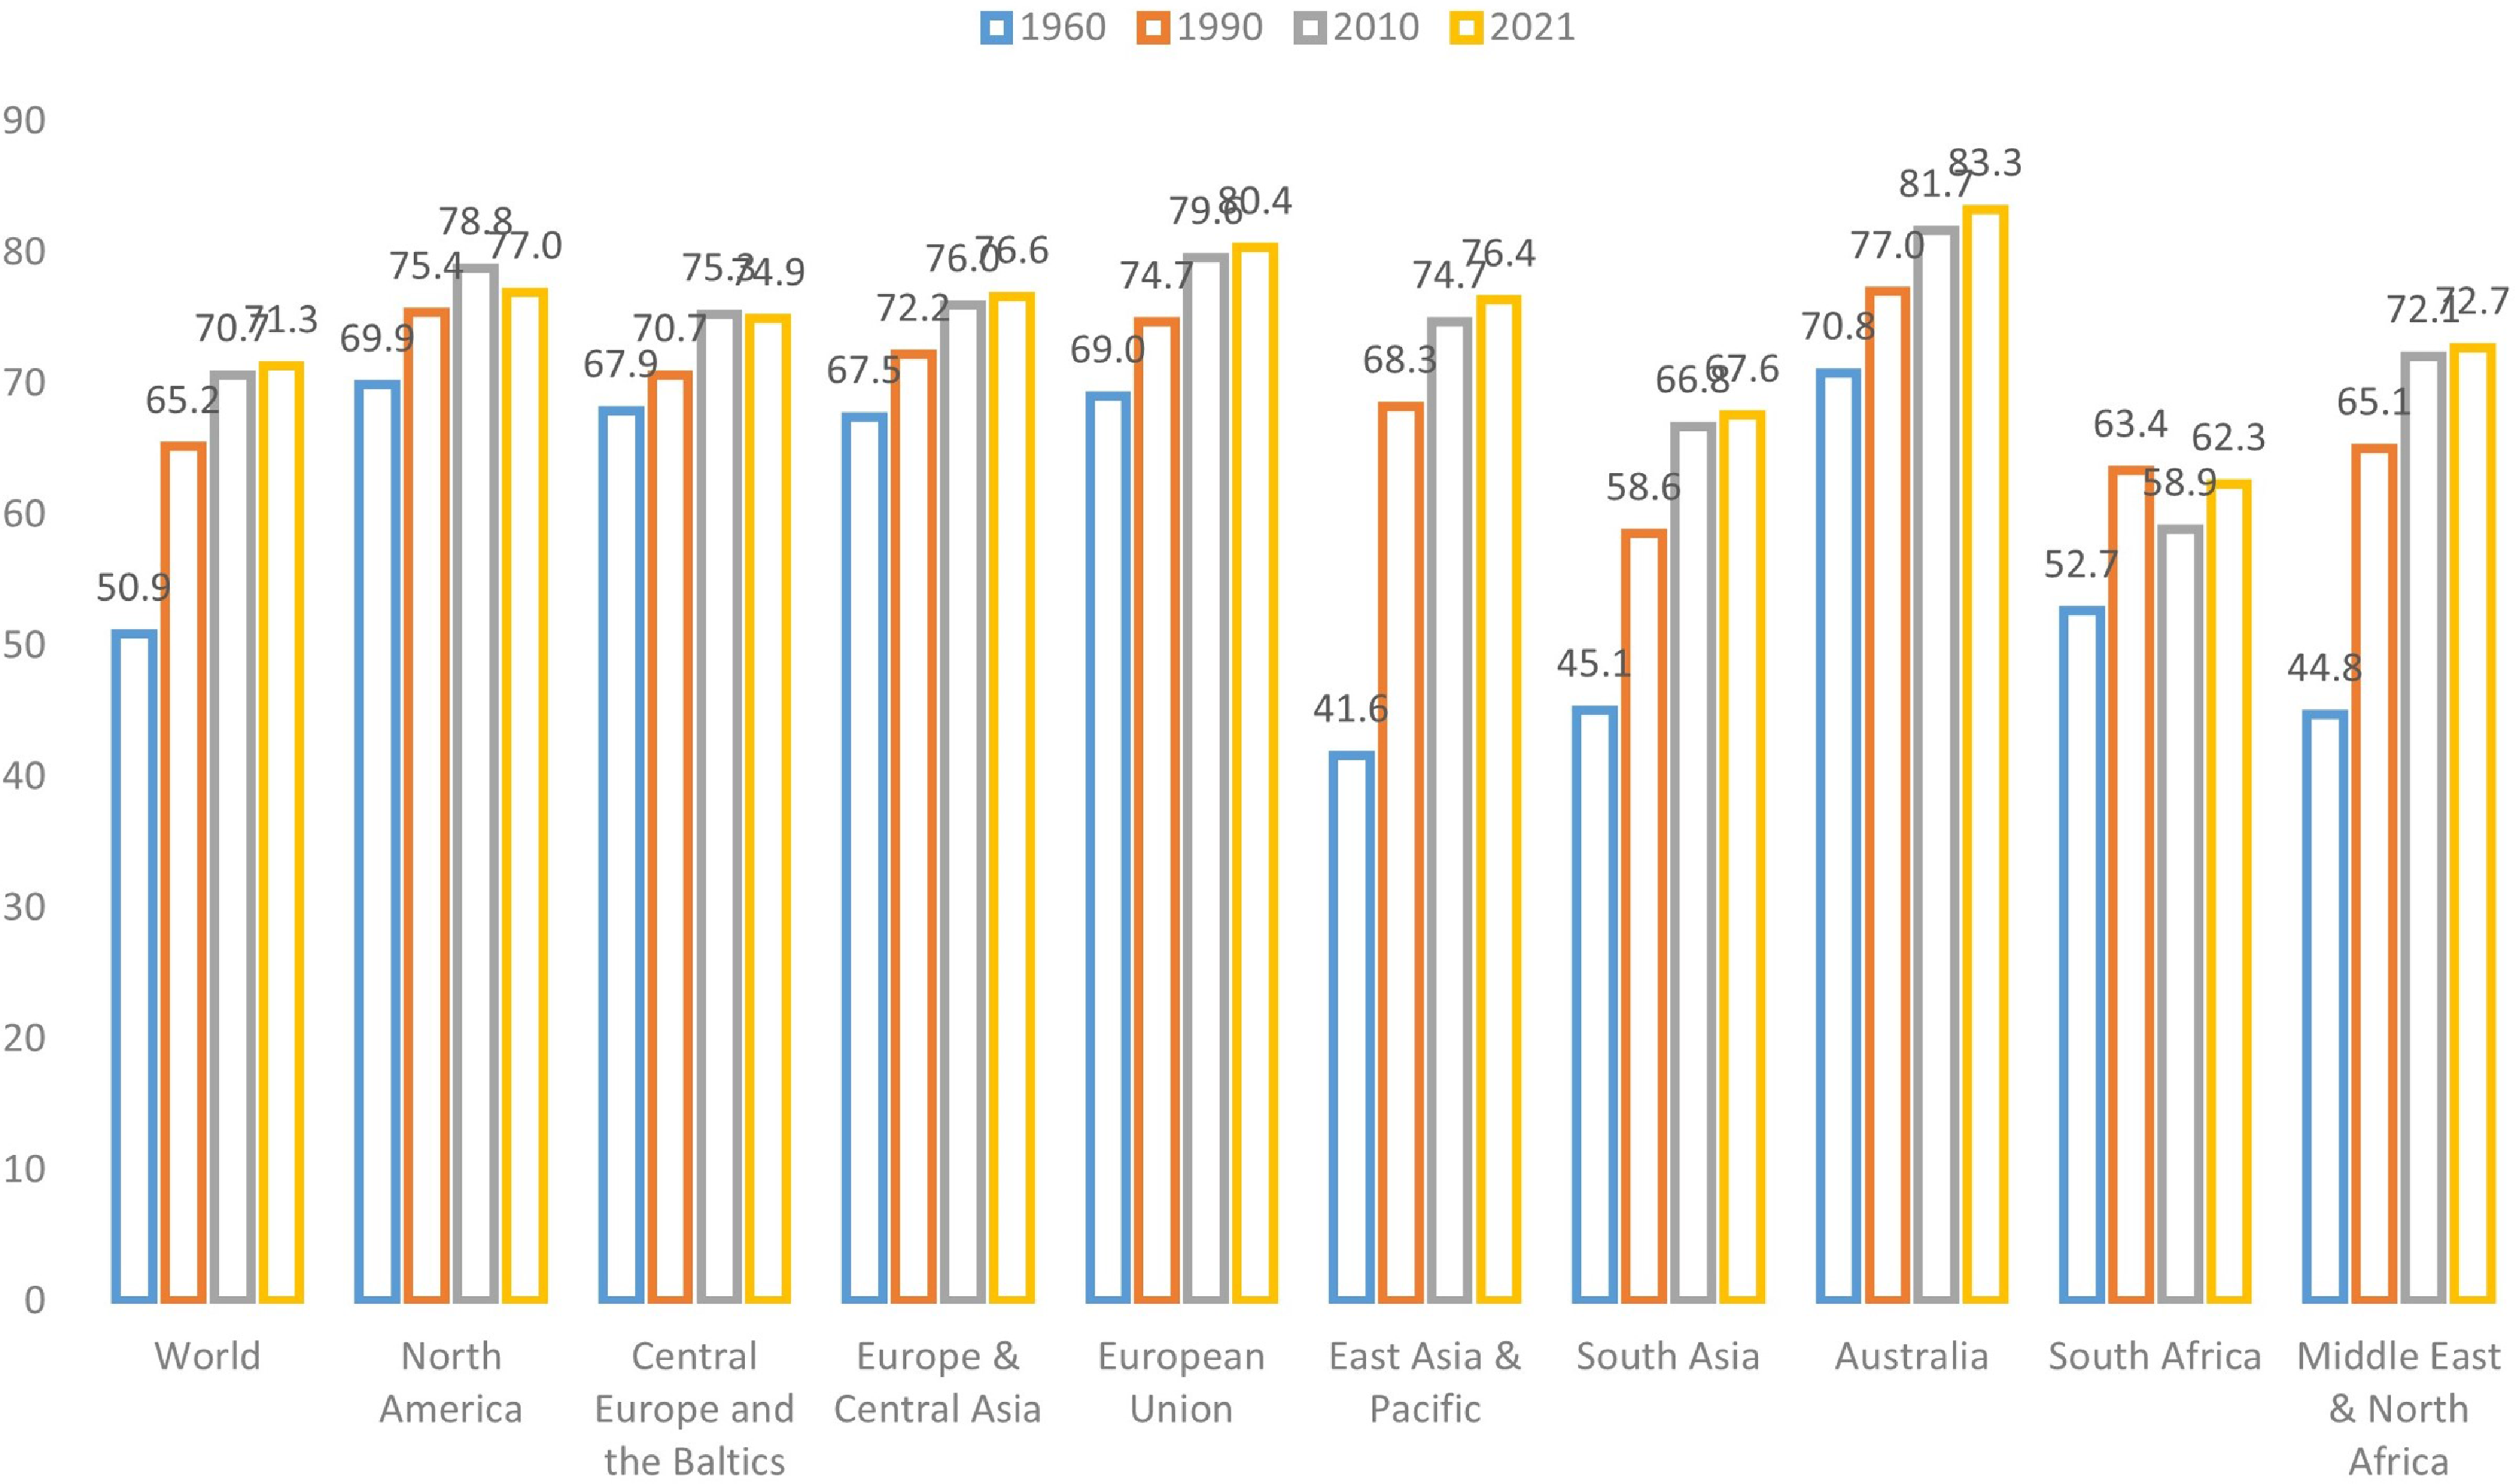
The aging of populations around the globe has elevated the importance of longevity risk management (World Bank, 2024). This challenge underscores the need for accurate and reliable mortality forecasting, a fundamental prerequisite for various stakeholders such as governments, pension funds, insurance and reinsurance companies, and individuals (Cairns et al., Reference Cairns, Blake, Dowd, Coughlan, Epstein, Ong and Balevich2009; Gaille & Sherris, Reference Gaille and Sherris2011; Blake et al., Reference Blake, Cairns, Coughlan, Dowd and MacMinn2013). As depicted in Figure 1, which illustrates global and regional life expectancy at birth, it is evident that life expectancy has been steadily rising across all regions. Notably, developed regions such as North America, the European Union, and Australia exhibit the highest life expectancy levels. This remarkable global phenomenon has triggered a surge of interest in machine learning techniques within the field of actuarial science, particularly concerning the intricate domain of mortality prediction (LeCun et al., Reference LeCun, Bengio and Hinton2015; Richman, Reference Richman2021a, Reference Richman2021b).
Life expectancy at birth (total) of the world and different regions (Source: World Bank).
The extended life expectancy observed in more developed regions and income classes can be attributed to a confluence of environmental, healthcare, and socioeconomic factors, most notably characterized by economic progress and improved healthcare access, resulting in a significant decline in mortality rates among older age groups (Rau et al., Reference Rau, Soroko, Jasilionis and Vaupel2008; Maier et al., Reference Maier, Gampe, Jeune, Vaupel and Robine2010; Desjardins & Bourbeau, Reference Desjardins and Bourbeau2010; Woolf & Schoomaker, Reference Woolf and Schoomaker2019). High-income regions have experienced a substantial increase in the old-age dependency ratio, defined as the proportion of the population aged above 65 in comparison to the working-age population, surpassing the global average. Take Hong Kong as an example: approximately 19.1% of the population in Hong Kong is aged over 65, with nearly 45% aged over 50. As a result, forecasting mortality has become a pivotal task in demographic analysis, exemplifying the challenges and financial obligations faced by pension plans and related institutions along with the ongoing global increase in life expectancy.
Nevertheless, accurately predicting mortality rates presents a formidable challenge. The complexity arises from intricate nonlinear effects inherent in mortality rates, exacerbated by external factors like pandemics (e.g., COVID-19) and climate change. For instance, for the period of January 2020 to December 2021, the overall excess deaths are estimated to be 14.83 million, 2.74 times higher than the COVID-19 deaths reported to the WHO (Msemburi et al., Reference Msemburi, Karlinsky, Knutson, Aleshin-Guendel, Chatterji and Wakefield2023), underscoring the complexity of mortality dynamics.
However, traditional mortality models, including the seminal work by Lee and Carter (Reference Lee and Carter1992), primarily rely on linear extrapolation methods, often overlooking these nonlinear effects. In recent years, there is an evolving landscape of machine learning applications in different fields of actuarial science (e.g., (Wüthrich, Reference Wüthrich2017; Gabrielli & V. Wüthrich, Reference Gabrielli and Wüthrich2018; Lally & Hartman, Reference Lally and Hartman2018; Lee & Lin, Reference Lee and Lin2018; Gao et al., Reference Gao, Meng and Wüthrich2019; Ghahari et al., Reference Ghahari, Newlands, Lyubchich and Gel2019; Brock Porth et al., Reference Brock Porth, Porth, Zhu, Boyd, Tan and Liu2020; Noll et al., Reference Noll, Salzmann and Wuthrich2020; Devriendt et al., Reference Devriendt, Antonio, Reynkens and Verbelen2021; Henckaerts et al., Reference Henckaerts, Côté, Antonio and Verbelen2021; Lee, Reference Lee2021; Gomes et al., Reference Gomes, Jin and Yang2021; Wuthrich & Buser, Reference Wuthrich and Buser2021; Gao et al., Reference Gao, Wang and Wüthrich2022; Hu et al., Reference Hu, Quan and Chong2022; Meng et al., Reference Meng, Gao and Huang2022; Xin & Huang Reference Xin and Huang2024; Fissler et al., Reference Fissler, Merz and Wüthrich2023; Chen et al., Reference Chen, Lu, Zhang and Zhu2023; Debener et al., Reference Debener, Heinke and Kriebel2023)), particularly in the context of mortality modeling and forecasting. Pioneering research by Deprez et al. (Reference Deprez, Shevchenko and Wüthrich2017) demonstrated the application of machine learning techniques for the analysis and evaluation of stochastic mortality models, shedding light on the potential of machine learning to enhance our understanding of mortality models. Subsequent studies expanded on this foundation by incorporating tree-based models to improve prediction accuracy (Levantesi and Nigri, Reference Levantesi and Nigri2020; Bjerre, Reference Bjerre2022). Hainaut (Reference Hainaut2018) introduced an innovative framework that used auto-encoders to capture nonlinearities in mortality data, extending the traditional Lee–Carter model. Richman and Wüthrich (2019) proposed a neural network extension of the Lee–Carter model for multiple populations, allowing neural networks to automatically select optimal structures for improved mortality forecasting. Since then, numerous studies have delved into improving mortality prediction performance through various neural network architectures (Nigri et al., Reference Nigri, Levantesi, Marino, Scognamiglio and Perla2019; Petneházi & Gáll, Reference Petneházi and Gáll2019; Richman & Wuthrich, Reference Richman and Wuthrich2019; Bravo, Reference Bravo2021a, Reference Bravo2021b; Nigri et al., Reference Nigri, Levantesi and Marino2021; Perla et al., Reference Perla, Richman, Scognamiglio and Wüthrich2021; Wang et al., Reference Wang, Zhang and Zhu2021; Chen & Khaliq, Reference Chen and Khaliq2022; Lindholm & Palmborg, Reference Lindholm and Palmborg2022; Zhang et al., Reference Zhang, Chen and Liu2022; Marino et al., Reference Marino, Levantesi and Nigri2023). Some studies employed tensor-based approaches for mortality modeling (Dong et al., Reference Dong, Huang, Yu and Haberman2020; Cardillo et al., Reference Cardillo, Giordani, Levantesi and Nigri2022). Most recently, transformer models have emerged as a powerful tool for mortality prediction in major countries (Wang et al., Reference Wang, Wen, Xiao and Wang2024). Furthermore, researchers have explored the uncertainty associated with machine learning models for mortality forecasting (Schnürch & Korn, Reference Schnürch and Korn2022; Marino et al., Reference Marino, Levantesi and Nigri2023).
This paper contributes to the dynamic field of mortality modeling and forecasting by introducing a novel framework that leverages machine learning techniques, specifically Kernel Principal Component Analysis (KPCA), to enhance the accuracy of mortality predictions. This innovation holds the potential to address the growing challenges posed by increasing life expectancy, volatile mortality risks, and population dependencies. By surpassing the limitations of traditional linear extrapolation models, our research empowers stakeholders with a more accurate tool for decision-making in the face of evolving mortality dynamics.
The rest of the paper proceeds as follows. Section 2 introduces the KPCA modeling methodology. Section 3 presents the empirical test results. Section 4 tests the robustness of the proposed method. Section 5 concludes the paper.
2. Modeling methodology
2.1 The Lee–Carter model
In their seminal paper, Lee and Carter (Reference Lee and Carter1992) proposed the following model that has become the standard model for the mortality forecast literature and the preferred methodology for the U.S. Census Bureau. Let $m_{xt}$
be the central death rate at age
$m_{xt}$
be the central death rate at age $x$
and year
$x$
and year $t$
,
$t$
, $x_0 \leq x \leq X,\,\, 0\leq t \leq T$
, then
$x_0 \leq x \leq X,\,\, 0\leq t \leq T$
, then
 \begin{equation} \text{log}\left (m_{xt}\right ) = \alpha _x+\beta _x\kappa _t+\epsilon _{xt}, \end{equation}
where $\alpha _x$
is a static age function specifying the general shape of mortality by age;
$\alpha _x$
is a static age function specifying the general shape of mortality by age; $\beta _x\kappa _t$
captures the age-period effect, with
$\beta _x\kappa _t$
captures the age-period effect, with $\kappa _t$
reflecting overall mortality trend (period-related effect) and
$\kappa _t$
reflecting overall mortality trend (period-related effect) and $\beta _x$
modulating its effect across ages (age-related effect). In particular,
$\beta _x$
modulating its effect across ages (age-related effect). In particular, $\kappa _t$
is commonly known as the mortality index, contributing to capturing the overall level of mortality improvement.
$\kappa _t$
is commonly known as the mortality index, contributing to capturing the overall level of mortality improvement.
The Lee–Carter model is only identifiable up to a transformation. As a result, in the literature, it is conventional to impose the following parameter constraints to circumvent the identification problem:
 \begin{equation} \begin{cases} \sum _t \kappa _t = 0, \\[4pt] \sum _x \beta _x = 1. \end{cases} \end{equation}
2.2 Estimation of mortality trend
In this section, we introduce two well-established methods to estimate the Lee–Carter coefficients to build the context: the singular value decomposition method (SVD) and the maximum-likelihood estimation method (MLE). They are closely related to the KPCA Lee–Carter model proposed in this paper.
2.2.1 Singular value decomposition
The SVD method is a conventional approach to estimate the parameters in Model (1), as proposed by Lee and Carter (Reference Lee and Carter1992). This method first forms the centered logarithms of the mortality rates matrix, denoted as $\mathbf{A}_{X \times T}$
, where each element of the matrix is the age-specific intercept
$\mathbf{A}_{X \times T}$
, where each element of the matrix is the age-specific intercept $\hat{\alpha _x}$
adjusted logarithm of the mortality rates.
$\hat{\alpha _x}$
adjusted logarithm of the mortality rates. $\hat{\alpha _x}$
is estimated as the long-term mean of the logged mortality for each age. Specifically:
$\hat{\alpha _x}$
is estimated as the long-term mean of the logged mortality for each age. Specifically:
 \begin{equation} \begin{aligned} \hat{\alpha _x} = \frac{1}{T} \sum _{t=1}^{T} \ln (m_{xt}). \end{aligned} \end{equation}
The logic behind this is that
 \begin{equation} \begin{aligned} \sum _{t=1}^{T} \ln (m_{xt}) & = \sum _{t=1}^{T}(\alpha _x + \beta _x\kappa _t + \epsilon _{xt}) \\ & \approx T\alpha _x + \beta _x \sum _{t=1}^{T} \kappa _t = T\alpha _x, \end{aligned} \end{equation}
where the identification constraint $\sum _{t=1}^{T} \kappa _t = 0$
is used (see Constrants (2))
$\sum _{t=1}^{T} \kappa _t = 0$
is used (see Constrants (2))
The centered logarithms of the mortality rates matrix $\mathbf{A}_{X \times T}$
are formed as follows:
$\mathbf{A}_{X \times T}$
are formed as follows:
 \begin{equation} \mathbf{A}_{X \times T} = \begin{pmatrix} \ln (m_{11}) - \hat{\alpha _1} & \quad \ln (m_{12}) - \hat{\alpha _1} & \quad \cdots & \quad \ln (m_{1T}) - \hat{\alpha _1} \\ \ln (m_{21}) - \hat{\alpha _2} & \quad \ln (m_{22}) - \hat{\alpha _2} & \quad \cdots & \quad \ln (m_{2T}) - \hat{\alpha _2} \\ \vdots & \quad \vdots & \quad \ddots & \quad \vdots \\ \ln (m_{X1}) - \hat{\alpha _X} & \quad \ln (m_{X2}) - \hat{\alpha _X} & \quad \cdots & \quad \ln (m_{XT}) - \hat{\alpha _X} \\ \end{pmatrix} \end{equation}
Applying SVD method to matrix $\mathbf{A}_{X \times T}$
, the factorization form is
$\mathbf{A}_{X \times T}$
, the factorization form is $\mathbf{A}_{X \times T}=U\Sigma V^T$
, where the columns of
$\mathbf{A}_{X \times T}=U\Sigma V^T$
, where the columns of $U$
and
$U$
and $V$
are orthonormal and the matrix
$V$
are orthonormal and the matrix $\Sigma$
is diagonal with positive real entries. Thus,
$\Sigma$
is diagonal with positive real entries. Thus, $\mathbf{A}_{X \times T}$
is decomposed with right singular vectors
$\mathbf{A}_{X \times T}$
is decomposed with right singular vectors $\vec{v}_1, \vec{v}_2,\cdots, \vec{v}_r$
, left singular vectors
$\vec{v}_1, \vec{v}_2,\cdots, \vec{v}_r$
, left singular vectors $\vec{u}_1, \vec{u}_2,\cdots, \vec{u}_r,$
and corresponding singular values
$\vec{u}_1, \vec{u}_2,\cdots, \vec{u}_r,$
and corresponding singular values $\lambda _1, \lambda _2, \cdots, \lambda _r$
. Then
$\lambda _1, \lambda _2, \cdots, \lambda _r$
. Then $\mathbf{A}_{X \times T}$
can be written as
$\mathbf{A}_{X \times T}$
can be written as
 \begin{equation} \mathbf{A}_{X \times T}=\lambda _1 \vec{u}_1 \vec{v}_1^T +\lambda _2 \vec{u}_2 \vec{v}_2^T + \cdots + \lambda _r \vec{u}_r \vec{v}_r^T \end{equation}
The first left and right singular vectors, along with leading value of the SVD, provide the approximation of $\beta _x$
and
$\beta _x$
and $\kappa _t$
, respectively. Specifically,
$\kappa _t$
, respectively. Specifically,
 \begin{equation} \begin{aligned} \hat{\beta _x} = \frac{u_{1x}}{\sum _{i=1}^{X} u_{1i}}, \end{aligned} \end{equation}
 \begin{equation} \begin{aligned} \hat{\kappa _t} = \lambda _1\left (v_{1t} - \frac{1}{T}\sum _{t=1}^Tv_{1t}\right ). \end{aligned} \end{equation}
Notably, weighting and adjustments are applied to $\hat{\beta }_x$
and
$\hat{\beta }_x$
and $\hat{\kappa }_t$
to satisfy the conventional Constraints (2).
$\hat{\kappa }_t$
to satisfy the conventional Constraints (2).
2.2.2 Maximum-likelihood estimation
Besides the SVD method, using MLE to estimate the Lee–Carter coefficients is another classic approach (Wilmoth, Reference Wilmoth1993). The MLE method requires specifying a probabilistic model. Following Wilmoth, we assume the number of deaths, denoted as $D_{xt}$
, at age
$D_{xt}$
, at age $x$
and year
$x$
and year $t$
follows a Poisson distribution, with the mean parameter
$t$
follows a Poisson distribution, with the mean parameter $\lambda _{xt}$
set to the product of the number of lives at risk (
$\lambda _{xt}$
set to the product of the number of lives at risk ( $E_{xt}$
) and the mortality rate (
$E_{xt}$
) and the mortality rate ( $m_{xt}$
) for the corresponding age and year. That is:
$m_{xt}$
) for the corresponding age and year. That is:
 \begin{equation} \begin{aligned} & D_{xt}\sim Poisson(\lambda _{xt}) \\ & \lambda _{xt} = E_{xt} m_{xt} \\ \end{aligned} \end{equation}
Assuming $D_{xt}$
is independent across time-age, we sum over all time-age to obtain the full log-likelihood:
$D_{xt}$
is independent across time-age, we sum over all time-age to obtain the full log-likelihood:
 \begin{align} l(\theta ) & = \sum _{xt}D_{xt}log(\lambda _{xt}))-\lambda _{xt}-log(D_{xt})\nonumber \\ & = \sum_{xt}D_{xt}log(E_{xt})+D_{xt}log(m_{xt})-E_{xt} m_{xt}-log(D_{xt}) \nonumber\\ & = \sum _{xt}\left\{ D_{xt}log(m_{xt})-E_{xt} m_{xt}\right\} + C \nonumber \\& = \sum _{xt}\left\{ D_{xt}(\alpha _x+\beta _x\kappa _t)-E_{xt} e^{\alpha _x+\beta _x\kappa _t}\right\} + C. \end{align}
Here, we substitute the Lee–Carter model (Equation 1) into the log-likelihood function to obtain the optimization maximizer. The term $C$
is a constant that aggregates the non-variable terms. By finding the parameter set
$C$
is a constant that aggregates the non-variable terms. By finding the parameter set $\theta = (\alpha _x, \beta _x, \kappa _t)$
that maximizes the log-likelihood function
$\theta = (\alpha _x, \beta _x, \kappa _t)$
that maximizes the log-likelihood function $l(\theta )$
, we estimate the Lee–Carter coefficients.
$l(\theta )$
, we estimate the Lee–Carter coefficients.
A notable advantage of MLE method is that it is flexible in including additional covariates or explanatory variables to account for other factors affecting mortality rates, making it a more adaptable method for complex models, while SVD method is limited to the structure of the decomposition and does not easily accommodate additional covariates.
2.3 KPCA Lee–Carter model
KPCA extends traditional Principal Component Analysis (PCA) into nonlinear feature spaces, offering a means to better capture the intricate spatial structures and nonlinear patterns present in high-dimensional mortality data. While traditional PCA is effective for capturing linear relationships and patterns in data, it may underperform when data exhibits nonlinear structures. KPCA addresses this limitation by using a kernel trick to project the data into a higher-dimensional space where the linear relationships are more easily captured. By applying PCA in this transformed space, KPCA effectively captures nonlinear patterns present in the original data.
As discussed previously, nonlinearity may exist in the mortality data. KPCA excels at capturing these nonlinear structures and enables the estimation of the time-varying mortality index $\kappa _t$
through the use of kernel function. The estimation stage of the Lee–Carter model using SVD can be viewed as a specific instance of PCA. It involves summarizing the log-mortality data by only considering the first principal component (PC), which is
$\kappa _t$
through the use of kernel function. The estimation stage of the Lee–Carter model using SVD can be viewed as a specific instance of PCA. It involves summarizing the log-mortality data by only considering the first principal component (PC), which is $\kappa _t$
in Equation (1), while the variance of other PCs is encapsulated within the error term
$\kappa _t$
in Equation (1), while the variance of other PCs is encapsulated within the error term $\epsilon _{xt}$
.
$\epsilon _{xt}$
.
In this section, we illustrate how the conventional SVD based solution of Lee–Carter models can be extended to the KPCA context. Section 2.3.1 briefly introduces the kernel transformation and the kernel functions used in this paper. Section 2.3.2 illustrates the estimation of Lee–Carter coefficients with KPCA method.
2.3.1 Kernel functions
KPCA is a statistical learning algorithm that allow us to study the data in the feature space $\mathcal{F}$
using kernel function
$\mathcal{F}$
using kernel function $k$
.
$k$
.
Theorem 1. (Aronszajn, Reference Aronszajn1950) Let k be a kernel function in some space $\mathcal{X}$
, where
$\mathcal{X}$
, where $\vec{x}_i, \vec{x}_j\in \mathcal{X}$
. Then, there exists a Hilbert space of functions
$\vec{x}_i, \vec{x}_j\in \mathcal{X}$
. Then, there exists a Hilbert space of functions $\mathcal{H}$
and a mapping
$\mathcal{H}$
and a mapping $\phi$
:
$\phi$
: $\mathcal{X}\rightarrow \mathcal{H}$
such that
$\mathcal{X}\rightarrow \mathcal{H}$
such that $ k(\vec{x}_i,\vec{x}_j) = \langle \phi (\vec{x}_i), \phi (\vec{x}_j) \rangle _{\mathcal{H}}.$
Here, the Hilbert space $\mathcal{H}$
is what we referred as feature space
$\mathcal{H}$
is what we referred as feature space $\mathcal{F}$
. Theorem1 says that
$\mathcal{F}$
. Theorem1 says that $k(\vec{x}_i, \vec{x}_j)$
can be obtained without explicitly calculating
$k(\vec{x}_i, \vec{x}_j)$
can be obtained without explicitly calculating $\phi (\vec{x})$
. This implicit mapping helps us construct kernel matrix without knowing what
$\phi (\vec{x})$
. This implicit mapping helps us construct kernel matrix without knowing what $\phi$
is. The kernel functions that we tested in this paper include:
$\phi$
is. The kernel functions that we tested in this paper include:
-
• Gaussian Radial Basis Function (RBF) Kernel:
(11) \begin{equation} k\left(\vec{x}_i, \vec{x}_j\right) = \exp \left(-\sigma \left \| \vec{x}_i - \vec{x}_j \right \|^2\right), \sigma \gt 0, \sigma \in \mathbb{R} \end{equation}
-
• Laplace Kernel:
(12)
\begin{equation} k\left(\vec{x}_i, \vec{x}_j\right) = \exp \left(-\gamma \left \| \vec{x}_i - \vec{x}_j \right \|\right), \gamma \gt 0, \gamma \in \mathbb{R} \end{equation}
-
• Polynomial Kernel:
(13)
\begin{equation} k\left(\vec{x}_i, \vec{x}_j\right) = \left(\vec{x}_i^T\vec{x}_j+c\right)^q, c \geq 0, q \in \mathbb{N}^+ \end{equation}


All three kernels are effective for handling nonlinear data, each excelling in different scenarios. The Gaussian RBF kernel is particularly well-suited for capturing smooth, continuous variations, whereas the Laplace kernel demonstrates greater robustness to noise and outliers, making it ideal for data characterized by sharp transitions (Wang et al., Reference Wang, Zhao and Tian2015). The polynomial kernel, on the other hand, is strong at capturing feature interactions and modeling global structures, making it effective for data that can be made linearly separable through polynomial (Weiße et al., Reference Weiße, Wellein, Alvermann and Fehske2006).
In untabulated analyses, we found that the Gaussian RBF kernel performed best, as measured by the minimum error in predicting mortality data in validation set, which will be illustrated in detail in Section 3. This superior performance is likely due to the kernel’s ability to handle the nonlinear relationships and local variations present in the mortality data, aligning with the theoretical strengths of the Gaussian RBF kernel. Therefore, in our empirical analyses, we use the Gaussian RBF kernel function as the default setting to compare the performance of KPCA relative to other well-established mortality models.
2.3.2 Kernel PCA
The procedure of using KPCA to estimate the Lee–Carter coefficients from log-mortality rate is as below:
Step 1: Estimate $\hat{\alpha }_x$
and form the centered mortality vectors.
$\hat{\alpha }_x$
and form the centered mortality vectors.
Given that KPCA will transform the log-mortality data to a higher dimension, we first need to estimate the age-specific intercept term $\hat{\alpha }_x$
for each age
$\hat{\alpha }_x$
for each age $x$
, following the method described in Equation (3). After estimating
$x$
, following the method described in Equation (3). After estimating $\hat{\alpha }_x$
, we subtract it from the log-mortality rate to obtain the centered log-mortality rate.
$\hat{\alpha }_x$
, we subtract it from the log-mortality rate to obtain the centered log-mortality rate.
For the sake of discussion, we denote the centered log-mortality vector for time $t$
as
$t$
as $\vec{A}_t = (A_{1t}, \ldots, A_{Xt})^T$
, where the element
$\vec{A}_t = (A_{1t}, \ldots, A_{Xt})^T$
, where the element
 \begin{equation} A_{xt} = \log (m_{xt}) - \hat{\alpha }_x. \end{equation}
The vector $\vec{A}_t$
corresponds to the
$\vec{A}_t$
corresponds to the $t$
-th column of the matrix
$t$
-th column of the matrix $\mathbf{A}_{X \times T}$
in Equation (5). We will then transform the set
$\mathbf{A}_{X \times T}$
in Equation (5). We will then transform the set $\lbrace \vec{A}_t \rbrace _{t=1}^T$
from its original space to the extended space. We note that this approach is transforming the log-mortality data over time for each age group rather than the other way around since we intend to capture the time-varying patterns of the mortality nonlinearity.
$\lbrace \vec{A}_t \rbrace _{t=1}^T$
from its original space to the extended space. We note that this approach is transforming the log-mortality data over time for each age group rather than the other way around since we intend to capture the time-varying patterns of the mortality nonlinearity.
Step 2: Construct centered kernel matrix in featured space.
The data points should be centered in the feature space, that is, $\sum _{t=1}^{T}\phi (\vec{A}_t)=0$
. We denote the centered mapping of
$\sum _{t=1}^{T}\phi (\vec{A}_t)=0$
. We denote the centered mapping of $x_i$
in the feature space as
$x_i$
in the feature space as $\phi ^{c}\big(\vec{A}_i\big)$
and calculated as:
$\phi ^{c}\big(\vec{A}_i\big)$
and calculated as:
 \begin{equation} \phi ^{c}\big(\vec{A}_i\big) = \phi \big(\vec{A}_i\big) - \frac{1}{T}\sum _{j=1}^{T}\phi (\vec{A}_{j}). \end{equation}
The expression of the $i,j$
-th element of centered kernel matrix
$i,j$
-th element of centered kernel matrix $\mathbf{K}^c$
is calculated as:
$\mathbf{K}^c$
is calculated as:
 \begin{align} K^{c}_{ij} & = \left\langle \phi ^{c}\big(\vec{A}_i\big), \phi ^{c}\big(\vec{A}_j\big) \right\rangle _{\mathcal{H}} \nonumber \\ & = \left\langle \phi \big(\vec{A}_i\big) - \frac{1}{T}\sum _{l=1}^{T}\phi \big(\vec{A}_l\big), \phi \big(\vec{A}_j\big) - \frac{1}{T}\sum _{l=1}^{T}\phi \big(\vec{A}_l\big) \right\rangle _{\mathcal{H}}\nonumber \\ & = \left\langle \phi \big(\vec{A}_i\big), \phi \big(\vec{A}_j\big) \right\rangle _{\mathcal{H}} - \frac{1}{T}\sum _{l=1}^{T}\left\langle \phi \big(\vec{A}_i\big), \phi \big(\vec{A}_l\big) \right\rangle _{\mathcal{H}} \nonumber \\& - \frac{1}{T}\sum _{l=1}^{T}\left\langle \phi \big(\vec{A}_j\big), \phi \big(\vec{A}_l\big) \right\rangle _{\mathcal{H}} + \frac{1}{T^2}\sum _{l=1}^{T}\sum _{l^\prime =1}^{T}\left\langle \phi \big(\vec{A}_l\big), \phi \big(\vec{A}_{l^\prime }\big) \right\rangle _{\mathcal{H}} \nonumber \\& = K_{ij} - \frac{1}{T}\sum _{l=1}^{T}K_{il} - \frac{1}{T}\sum _{l=1}^{T}K_{jl} + \frac{1}{T^2}\sum _{l=1}^{T}\sum _{l^\prime =1}^{T}K_{ll^\prime }. \end{align}
Here, $K_{ij}$
represents the
$K_{ij}$
represents the $i,j$
-th element of the uncentered kernel matrix
$i,j$
-th element of the uncentered kernel matrix $\mathbf{K}$
. Let
$\mathbf{K}$
. Let $\mathbf{1}_T$
denote a
$\mathbf{1}_T$
denote a $T\times T$
matrix with all elements equal to
$T\times T$
matrix with all elements equal to $\frac{1}{T}$
, the relationship between
$\frac{1}{T}$
, the relationship between $\mathbf{K}^c$
and
$\mathbf{K}^c$
and $\mathbf{K}$
is:
$\mathbf{K}$
is:
 \begin{equation} \mathbf{K}^c = \mathbf{K} - \mathbf{1}_T\mathbf{K} - \mathbf{K}\mathbf{1}_T + \mathbf{1}_T\mathbf{K}\mathbf{1}_T. \end{equation}
Step 3: Perform PCA to the centered kernel matrix.
In this step, we perform PCA on $\mathbf{K}^c$
. Since PCA is a well-established method, we will not delve into the details of the procedure (see comprehensive procedures in (Jolliffe, Reference Jolliffe2002) and (Shlens, Reference Shlens2014)). Given that
$\mathbf{K}^c$
. Since PCA is a well-established method, we will not delve into the details of the procedure (see comprehensive procedures in (Jolliffe, Reference Jolliffe2002) and (Shlens, Reference Shlens2014)). Given that $\mathbf{K}^c$
is real and symmetric, it can be eigendecomposed as follows:
$\mathbf{K}^c$
is real and symmetric, it can be eigendecomposed as follows:
 \begin{equation} \mathbf{K}^c = \mathbf{Q}\mathbf{\Lambda } \mathbf{Q}^T, \end{equation}
where $\mathbf{Q}$
is the matrix of
$\mathbf{Q}$
is the matrix of $\mathbf{K}^c$
’s eigenvectors (or PCs), and
$\mathbf{K}^c$
’s eigenvectors (or PCs), and $\mathbf{\Lambda }$
is a diagonal matrix of the corresponding eigenvalues. In the eigendecomposition, the eigenvalues are ranked from the largest to the smallest, with the leading PCs capturing more variance of
$\mathbf{\Lambda }$
is a diagonal matrix of the corresponding eigenvalues. In the eigendecomposition, the eigenvalues are ranked from the largest to the smallest, with the leading PCs capturing more variance of $\mathbf{K}^c$
.
$\mathbf{K}^c$
.
Step 4: Estimate $\hat{\beta }_x$
and
$\hat{\beta }_x$
and $\hat{\kappa }_t$
.
$\hat{\kappa }_t$
.
The KPCA method of obtaining the Lee–Carter coefficients is similar in form to the SVD method (see Section 2.2.1). However, due to the properties of the matrix $\mathbf{K}^c$
, the left and right singular matrices are identical. Denote the
$\mathbf{K}^c$
, the left and right singular matrices are identical. Denote the $t$
-th column of
$t$
-th column of $\mathbf{Q}$
as
$\mathbf{Q}$
as $\vec{v}_t$
, where
$\vec{v}_t$
, where $\vec{v}_t = (v_{1t},\ldots, v_{Tt})^T$
To estimate the age-specific sensitivity $\hat{\beta }_x$
for age
$\hat{\beta }_x$
for age $x$
, we project the centered log-mortality for age
$x$
, we project the centered log-mortality for age $x$
onto the first PC (i.e.,
$x$
onto the first PC (i.e., $\vec{v}_1$
):
$\vec{v}_1$
):
 \begin{equation} \hat{\beta }_x^{(1)} = \frac{\sum _{t=1}^T A_{xt}v_{t1}}{\sum _{t=1}^T v_{t1}}, \end{equation}
where $A_{xt}$
is calculated as described in Equation (14), and the weighting
$A_{xt}$
is calculated as described in Equation (14), and the weighting $\sum _{t=1}^T v_{t1}$
is applied to meet the conventional Constraints (2). The estimated
$\sum _{t=1}^T v_{t1}$
is applied to meet the conventional Constraints (2). The estimated $\hat{\beta }_x^{(1)}$
is labeled with a superscript to indicate it is derived from the first PC. The Lee–Carter model can incorporate more than one pair of
$\hat{\beta }_x^{(1)}$
is labeled with a superscript to indicate it is derived from the first PC. The Lee–Carter model can incorporate more than one pair of $\beta _x$
and
$\beta _x$
and $\kappa _t$
estimated from different principal components (Booth et al., Reference Booth, Maindonald and Smith2002).
$\kappa _t$
estimated from different principal components (Booth et al., Reference Booth, Maindonald and Smith2002).
The calculation of $\hat{\beta }_x$
by projecting the centered log-mortality data onto the eigenvectors allows us to quantify how each age group’s mortality rates respond to the primary time-varying factors captured by KPCA. This makes
$\hat{\beta }_x$
by projecting the centered log-mortality data onto the eigenvectors allows us to quantify how each age group’s mortality rates respond to the primary time-varying factors captured by KPCA. This makes $\hat{\beta }_x$
a valid representation of age-specific sensitivity, aligning with the objectives of the Lee–Carter model in capturing the dynamics of mortality rates over time.
$\hat{\beta }_x$
a valid representation of age-specific sensitivity, aligning with the objectives of the Lee–Carter model in capturing the dynamics of mortality rates over time.
The estimated time-varying mortality trend $\hat{\kappa }_t$
under the KPCA framework is the first principal component adjusted by the long-term mean and then weighted by the corresponding eigenvalue. Since the transformation was done over time, the time variation is preserved, and no additional projection is required:
$\hat{\kappa }_t$
under the KPCA framework is the first principal component adjusted by the long-term mean and then weighted by the corresponding eigenvalue. Since the transformation was done over time, the time variation is preserved, and no additional projection is required:
 \begin{equation} \hat{\kappa }_t^{(1)} = \lambda _1 \left (v_{t1} - \frac{1}{T}\sum _{t=1}^T v_{t1}\right ). \end{equation}
For the same reason as $\hat{\beta }_x^{(1)}$
, we label the estimated
$\hat{\beta }_x^{(1)}$
, we label the estimated $\hat{\kappa }_t^{(1)}$
with a superscript to indicate it is derived from the first principal component.
$\hat{\kappa }_t^{(1)}$
with a superscript to indicate it is derived from the first principal component.
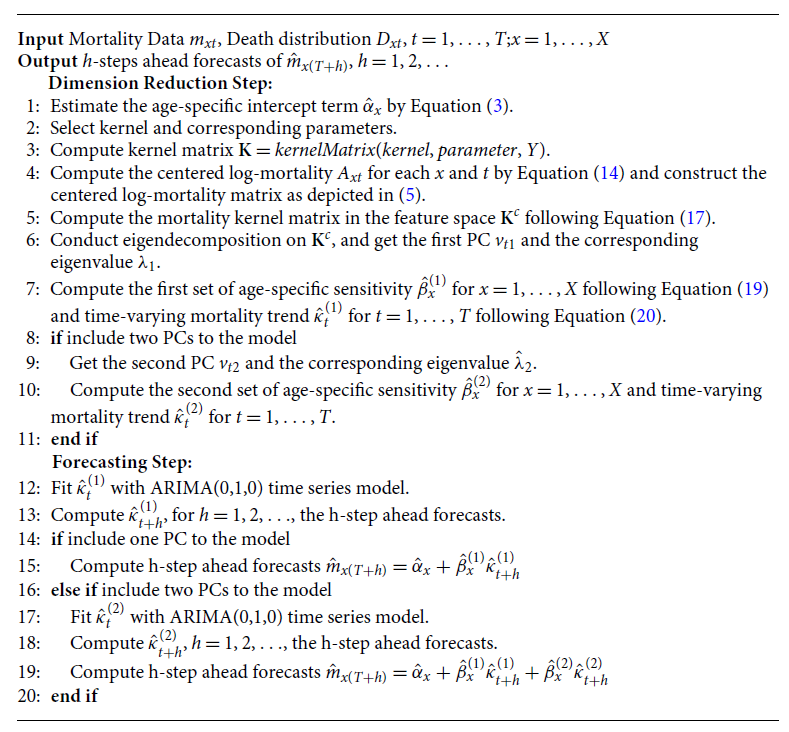
Thus, the KPCA is constructed using the obtained eigenvectors and eigenvalues. We can then select the kernel PCs that explain the most variance in the data. For future mortality projections, we fit $\hat{\kappa }_t^{(1)}$
with an ARIMA(0,1,0) model to project future trends and calculate the future mortality using the Lee–Carter Model (1). The procedure of the KPCA Lee–Carter model is summarized in Algorithm1.
$\hat{\kappa }_t^{(1)}$
with an ARIMA(0,1,0) model to project future trends and calculate the future mortality using the Lee–Carter Model (1). The procedure of the KPCA Lee–Carter model is summarized in Algorithm1.
KPCA Lee–Carter Algorithm for Mortality Forecasting
3. Empirical analysis
3.1 Data description
In this section, the proposed KPCA Lee–Carter method is applied to the U.S. mortality data from the Human Mortality Database (HMD),Footnote
1
a database that provides detailed mortality and population data. All the death numbers $ (D_{xt})$
, exposure-to-risk
$ (D_{xt})$
, exposure-to-risk $ (E_{xt})$
and central mortality rates
$ (E_{xt})$
and central mortality rates $ (m_{xt})$
are derived from the dataset to facilitate the analysis of mortality patterns across age
$ (m_{xt})$
are derived from the dataset to facilitate the analysis of mortality patterns across age $(x)$
and time
$(x)$
and time $(t)$
. The sample period is from 1952 to 2021 and we use total population mortality data between age 51 and 90.
$(t)$
. The sample period is from 1952 to 2021 and we use total population mortality data between age 51 and 90.
The logarithmic patterns of mortality rates over time and across age groups are represented in Figure 2. In the year-specific plot on the left, distinct colors are employed to distinguish between various age groups, with the oldest age group depicted in violet and the youngest in red. Conversely, in the age-specific plot on the right, the color scheme denotes different years, with the most recent years represented in violet and the earliest in red.
The year-specific plot illustrates a consistent decline in mortality rates across all ages spanning from 1959 to 2019, then increased due to COVID-19 from 2020 to 2021. Notably, the decline exhibits varying trajectories for different age groups, highlighting the importance of our task to forecast mortality rates as a means of managing longevity risk, while the COVID-19 period poses new challenges for researchers to deal with excess life expectancy calculation. Conversely, the age-specific plot reveals a predictable trend of increasing mortality rates with advancing age, aligning with conventional wisdom regarding age-related mortality patterns.
Log-mortality rate by year and age, with different colors representing age groups. The oldest age group is shown in violet, while the youngest is highlighted in red.

3.2 Prediction results
We split the U.S. mortality data with time period from 1952 to 2021 into three subsets, training-validation-test, preserving the temporary order. The training set contains observations of a total of 50 years from 1952 to 2001, the validation set contains observations of a total of 10 years from 2002 to 2011, and the test set contains observations of a total of 10 years from 2012 to 2021 for model forecast.
The proposed KPCA Lee–Carter method is applied to the mortality data. Standard SVD and MLE methods are natural benchmarks to assess the prediction performance of KPCA Lee–Carter method. In addition, we also include auto-encoder method proposed by Hainaut (Reference Hainaut2018) as benchmarks for performance assessment comparison, as auto-encoder model is able to incorporate nonlinearity as well. To evaluate the forecast performance, we consider the mean absolute percentage error (MAPE) between the forecast mortality rates and actual mortality rates. More specifically,
 \begin{equation} \begin{aligned} MAPE = \frac{1}{XT_f} \sum _{t=1}^{T_f} \sum _{x=1}^{X} \left\lvert \frac{m_{xt}-\hat{m}_{xt}}{m_{xt}} \right\rvert, \end{aligned} \end{equation}
where $T_f$
is the number of forecast years.
$T_f$
is the number of forecast years.
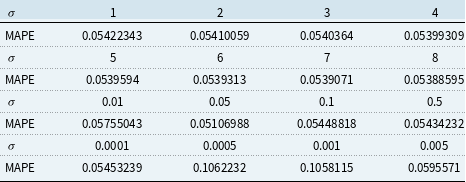
The validation set result shown in Tables 1 and 2 is used for choosing the hyper-parameters of KPCA 1 PC and 2 PC model. We choose the parameters that give the lowest validation MAPE. More specifically, for 1 PC Gaussian RBF kernel, we choose $\sigma = 40$
, and for 2 PC Gaussian RBF kernel, we choose
$\sigma = 40$
, and for 2 PC Gaussian RBF kernel, we choose $\sigma = 0.05$
.
$\sigma = 0.05$
.
Validation result for Kernel Principal Component Analysis 1 principal component model

Validation result for Kernel Principal Component Analysis 2 principal component model
The MAPE for the KPCA method with RBF kernel and chosen hyper-parameter, in comparison with MAPE of benchmark models, are shown in Table 3. For the auto-encoder model, we use three neurons in both the input and output layers and two neurons in the intermediate layer. The model is trained with a learning rate of 0.001, over 800 epochs, and the MSE loss function. The auto-encoder 1 PC model extracts a single-dimensional factor, while the auto-encoder 2 PC model extracts two-dimensional factors from the constructed model.
Mean absolute percentage error (MAPE) for out-sample test set on all models
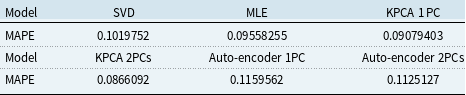
When compared to all other models, it is evident that the 1 PC and 2PCs KPCA approach yields the lowest MAPE, indicating the efficacy of our proposed KPCA Lee–Carter model. Notably, the root mean squared error (RMSE) and MAPE values obtained from the 1 PC and 2PCs KPCA methods are quite similar. Based on the calculation of proportion of variance for KPCA 2 PC model shown in Table 4, this similarity is attributed to the fact that the first PC can effectively capture a substantial portion of the variance in the data, rendering the inclusion of the second PC less impactful in enhancing our KPCA model’s performance.
Proportion of variance for Kernel Principal Component Analysis 2 principal component model

The fitted value of $\alpha _x$
is the same across all models, as it represents the long-term mean of logged mortality for each age and follows the same formula across different models. The fitted
$\alpha _x$
is the same across all models, as it represents the long-term mean of logged mortality for each age and follows the same formula across different models. The fitted $\beta _x$
based on different models are plotted in Figure 3. Estimation results of
$\beta _x$
based on different models are plotted in Figure 3. Estimation results of $\kappa _t$
from different models are displayed in Figure 4. Figure 5 shows the corresponding fan charts.
$\kappa _t$
from different models are displayed in Figure 4. Figure 5 shows the corresponding fan charts. $\beta _x$
estimated across models.
$\beta _x$
estimated across models.

Analyzing Figure 3 and Figure 4, we can discern consistent trends in all three parameters when employing the SVD and MLE methods. These methods primarily capture the linear trend present in the mortality data. However, the KPCA method stands out by estimating a distinct mortality index $\kappa _t$
and different age interactions with mortality index
$\kappa _t$
and different age interactions with mortality index $\beta _x$
, in contrast to the SVD and MLE methods. This distinction arises from the KPCA’s ability to uncover underlying nonlinear patterns within the mortality data through kernel methods in the feature space.
$\beta _x$
, in contrast to the SVD and MLE methods. This distinction arises from the KPCA’s ability to uncover underlying nonlinear patterns within the mortality data through kernel methods in the feature space.
Furthermore, Figure 5 reveals that the width of the fan chart corresponds to the level of uncertainty around the baseline forecast, and Table 5 shows the confidence intervals of out-of-sample predictions for the year 2021. The SVD method produces the narrowest confidence interval for $\kappa _t$
, due to its overly optimistic estimation of the upper bound, which is driven by the excessive information reduction inherent in the SVD approach. In contrast, the KPCA-estimated
$\kappa _t$
, due to its overly optimistic estimation of the upper bound, which is driven by the excessive information reduction inherent in the SVD approach. In contrast, the KPCA-estimated $\kappa _t$
has a similar range to the MLE and auto-encoder methods. Notably, the KPCA method exhibits the lowest level of uncertainty when compared to the other two methods.
$\kappa _t$
has a similar range to the MLE and auto-encoder methods. Notably, the KPCA method exhibits the lowest level of uncertainty when compared to the other two methods.
Projected $\kappa _t$
at 2021
$\kappa _t$
at 2021
 $\kappa _t$
estimated across models.
$\kappa _t$
estimated across models.

Fan chart of $\kappa _t$
estimated across models, 95% CI.
$\kappa _t$
estimated across models, 95% CI.

For 2PCs KPCA model, the fitted results of $\beta ^{(1)}_x$
and
$\beta ^{(1)}_x$
and $\beta ^{(2)}_x$
are displayed in Figure 6, and prediction results of
$\beta ^{(2)}_x$
are displayed in Figure 6, and prediction results of $\kappa ^{(1)}_x$
and
$\kappa ^{(1)}_x$
and $\kappa ^{(2)}_x$
are shown in Figure 7. From Figure 6, we can see that the estimated
$\kappa ^{(2)}_x$
are shown in Figure 7. From Figure 6, we can see that the estimated $\beta ^{(1)}_x$
and
$\beta ^{(1)}_x$
and $\beta ^{(2)}_x$
follow similar decreasing trend as the original Lee-Carter model. From Figure 7, we can identify that the estimated
$\beta ^{(2)}_x$
follow similar decreasing trend as the original Lee-Carter model. From Figure 7, we can identify that the estimated $\kappa _t^{(2)}$
hovers near zero with a small variance, indicating its small impact on the overall model. This observation aligns with the findings in Table 3 and Table 4, where the forecasting error of the 1 PC and 2 PCs KPCA Lee–Carter model reveals that including the second PC doesn’t yield a substantial improvement (only 0.4% improvement).
$\kappa _t^{(2)}$
hovers near zero with a small variance, indicating its small impact on the overall model. This observation aligns with the findings in Table 3 and Table 4, where the forecasting error of the 1 PC and 2 PCs KPCA Lee–Carter model reveals that including the second PC doesn’t yield a substantial improvement (only 0.4% improvement).
Our empirical results lead us to the conclusion that the KPCA method effectively enhances the forecast performance of the Lee–Carter model. $\beta ^{(1)}$
and
$\beta ^{(1)}$
and $\beta ^{(2)}$
estimated by 2 principal components Kernel Principal Component Analysis model.
$\beta ^{(2)}$
estimated by 2 principal components Kernel Principal Component Analysis model.

Fan plots of $\kappa _t^{(1)}$
and
$\kappa _t^{(1)}$
and $\kappa _t^{(2)}$
estimated by 2 principal components Kernel Principal Component Analysis model, 95% CI.
$\kappa _t^{(2)}$
estimated by 2 principal components Kernel Principal Component Analysis model, 95% CI.

4. Robustness analysis
In this section, we test the robustness of KPCA in mortality prediction. Section 4.1 extends our analyses from the U.S. to Canada and Australia to ensure the geographical robustness of our empirical results. Section 4.2 compares the models analyzed in the empirical analyses using COVID-19 as a case study.
4.1 Geographical robustness
We apply the 1 PC KPCA model to mortality data from Canada and Australia using the same prediction procedure and age groups as the U.S. data and compare it with the SVD and MLE methods. The MAPE results in Table 6 demonstrate that KPCA is applicable to populations across different geographical locations.
Model comparison for other countries

4.2 Impact of COVID-19 mortality disruption on life expectancy projections
To evaluate the robustness of the KPCA model in extreme cases, in this subsection, we conduct an analysis of the model’s performance during the COVID-19 pandemic, which presented an unprecedented disruption in mortality rates. The objective of this analysis is to assess how a disruption in mortality would affect the model’s prediction performance. We created two sets of training datasets: (1) COVID-exclusive, using pre-COVID mortality data from 1952 to 2019; (2) COVID-inclusive, which includes mortality data from the COVID years, spanning from 1952 to 2021. To make the results of different models more tangible, we transformed the mortality projections into remaining life expectancy projections using the life table method (Dickson et al., Reference Dickson, Hardy and Waters2019).
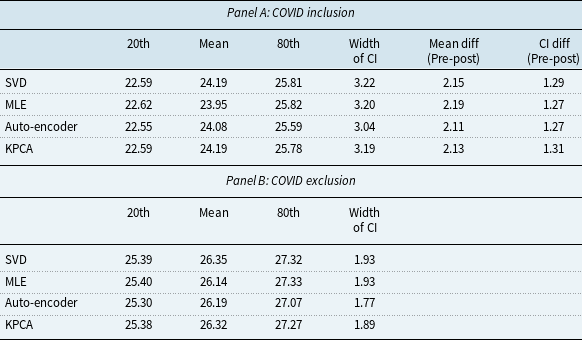
Figure 8 depicts the projection of life expectancy under the two training sets. Table 7 presents summary statistics of these projections, including the mean, and the 20th and 80th quantiles of the life expectancy projections at age 60, with the two training sets across different models. We have the following interesting observations. First, the differences between predictions of average remaining life expectancy from samples including and excluding the COVID period are large and economically significant. In particular, the inclusion of the COVID period in the training sample significantly reduces the projected remaining life expectancy by about 2 years on average, ranging from 2.11 years (auto-encoder model) to 2.19 years (MLE model). The projections from KPCA and SVD are similar. However, the average reduction from the KPCA model is 2.13 years, slightly higher than auto-encoder model while lower than SVD model (2.15 years). The confidence interval width of the auto-encoder model remains the smallest both before and after the inclusion of the COVID period. Second, after including the COVID period, confidence intervals from all models are widened, but the width of the 20th-80th confidence interval from the KPCA model increases by 1.31 years, compared to 1.29 years (SVD) and 1.27 years (MLE & auto-encoder) from benchmarks. Although the KPCA model’s confidence interval widens the most, we also notice that it remains narrower than those of traditional models such as SVD and MLE. This indicates that while the KPCA model maintains narrower prediction intervals, it effectively captures the increased uncertainty during the pandemic.
Projected remaining life expectancy at age 60
Projected remaining life expectancy based on COVID inclusion and exclusion datasets.

Moreover, the discrepancies between future life expectancy projections from different models are smaller in COVID-exclusive cases. In contrast, after including the COVID sample, the life expectancy predictions deviate more between different models. For example, the standard deviation of mean projection between different models is 0.10 years without the COVID data and increases to 0.12 years after the COVID period is included. This highlights the increased variability and uncertainty introduced by the pandemic. Finally, from our analysis, we can see that while the KPCA model maintains narrower prediction intervals, it effectively captures the increased uncertainty during the pandemic. This indicates that KPCA is more robust in extreme cases. In particular, KPCA model provides conservative and realistic projections even when faced with extreme disruptions. The model’s predictions remain robust, with the intervals appropriately widening to reflect the increased variability during the COVID-19 period.
We acknowledge that due to the limited post-COVID sample, there are some limitations to our analysis in this subsection. It is interesting to include more observations after COVID when more data are available, to see the long-term impact of nonlinear disruptive events and the performance of different models. It’s also interesting to develop new model that can incorporate the shocks from extreme events, e.g., an extension of the model in Zhou and Li (Reference Zhou and Li2022).
5. Conclusion
In this study, we introduced an extension of classic Lee–Carter model to enhance mortality forecasting by incorporating KPCA. Our empirical results demonstrate that the KPCA-enhanced Lee–Carter model significantly improves the accuracy of mortality rate predictions. Both RMSE and MAPE are consistently lower for the KPCA model compared to SVD and MLE. This enhancement in forecasting performance is due to the ability of KPCA Lee–Carter model to capture nonlinear patterns and complex relationships in mortality data. In addition, we observed that including more PCs beyond the first one in KPCA does not lead to substantial improvements in forecasting accuracy. The first PC effectively characterizes a significant portion of the variance in mortality data, highlighting the efficiency and practicality of our proposed KPCA Lee–Carter model. Moreover, our analysis indicates that our KPCA model is more robust to nonlinear disruptions in the extreme case and provides more reliable mortality forecasts with lower uncertainty. This robustness makes the KPCA model a reliable tool for stakeholders managing longevity risk, ensuring they can make well-informed decisions even during significant mortality shocks like the COVID-19 pandemic.
Our research highlights the potential of KPCA as a valuable tool for enhancing mortality forecasting. As global populations continue to age, and the challenges of longevity risk intensify, accurate mortality predictions are essential for governments, pension funds, insurance companies, and individuals. Our findings contribute to the growing body of literature where actuarial science intersects with statistical learning, offering practical solutions to the challenges posed by an aging world population. We acknowledge that due to the limited sample of post-COVID, there are some limitations to our analysis. It will be beneficial to include more observations as more data become available to better understand the long-term impact of nonlinear disruptive events and the performance of different models. Additionally, it is worth exploring the development of new models that can incorporate shocks from extreme events, e.g., an extension of the model in Zhou and Li (Reference Zhou and Li2022). We leave discussions of these interesting topics for future research.
Data availability statement
Replication materials are available on request from the authors. The data and code that support the findings of this study are available from the corresponding author, [Wenjun Zhu], upon reasonable request.
Funding statement
This work received no specific grant from any funding agency, commercial, or not-for-profit sectors.
Competing interests
The authors declare none.


 Open access