


1. Introduction
Glaciers located in high mountains are essential reserves of fresh water for high and lowland inhabitants around the world. Snow and ice meltwater from these high mountains play a vital source for the local river systems such as the Himalaya where the glaciers support a significant proportion of Asia's population (Immerzeel and others, Reference Immerzeel, van Beek and Bierkens2010). Himalaya is the largest reservoir of glaciers outside the polar region. It is the highest and the youngest mountain range and plays a crucial role in various socio-economic aspects around the Indian sub-continent. Various studies from the region have reported different retreat rates (Azam and others, Reference Azam2012; Bolch and others, Reference Bolch2012; Kääb and others, Reference Kääb, Berthier, Nuth, Gardelle and Arnaud2012; Gardelle and others, Reference Gardelle, Berthier, Arnaud and Kääb2013) with most of the glaciers retreating in the past century (Kulkarni and others, Reference Kulkarni2002; Bhambri and Bolch, Reference Bhambri and Bolch2009). However, changes are less pronounced in the Western Himalaya (Bhambri and Bolch, Reference Bhambri and Bolch2009; Schmidt and Nüsser, Reference Schmidt and Nüsser2009; Pandey and others, Reference Pandey, Ghosh and Nathawat2011; Chand and Sharma, Reference Chand and Sharma2015; Rashid and others, Reference Rashid, Abdullah, Glasser, Naz and Romshoo2018), and the recent studies in Karakoram region have found that the glaciers are either stable or have grown in past years (Bhambri and others, Reference Bhambri2013; Kääb and others, Reference Kääb, Treichler, Nuth and Berthier2015).
Higher altitude regions of Himalaya lack long-term field-based investigations (Armstrong, Reference Armstrong2010) with existing studies mostly focused on area/length and snout changes (Kulkarni, Reference Kulkarni1992; Berthier and others, Reference Berthier2007; Dobhal and others, Reference Dobhal, Gergan and Thayyen2008). Although glacier studies in Himalaya have increased in recent years, the mass-balance (MB) observations are still sparse and lacking, more so in western Himalaya (Cogley, Reference Cogley2011; Bolch and others, Reference Bolch2012) because of the tough terrain, harsh climate and political reasons (Baghel and Nüsser, Reference Baghel and Nüsser2015).
MB of mountain glaciers is an excellent indicator of climate change (Oerlemans and Fortuin, Reference Oerlemans and Fortuin1992; Haeberli and Hoelzle, Reference Haeberli and Hoelzle1995). Therefore, assessment of glacier MB is essential to understand water resources outlook as it reflects short- and long-term climatic fluctuations (Ohmura and others, Reference Ohmura, Bauder, Müller and Kappenberger2007) as well as a direct and immediate response to climate change (Huss and others, Reference Huss, Bauder, Funk and Hock2008). Glacier retreat increases the runoff until a maximum is reached (also known as ‘peak water’) and beyond this, the runoff declines due to reduced glacier area (Huss and Hock, Reference Huss and Hock2018). Thus, understanding glacier changes in the past and present are necessary for a reliable prediction of ‘peak water’ scenarios. Unfortunately, the in-situ MB of <1% (24 glaciers) of the total Himalayan glaciers has been studied so far (Bolch and others, Reference Bolch2012) with a majority from the Indian Himalaya, mostly initiated and conducted by Geological Survey of India (GSI). Only 12 glaciers have been studied in the Indian western Himalayan region since 1978, mostly discontinued after a few years.
Ladakh, sandwiched between Himalayan ranges and the Karakoram, is one of the heavily glaciated high altitude regions of India. It houses nearly 5000 glaciers (~50% glaciers of India) covering an area and volume of 3187 km2 and 815.62 km3, respectively (Koul and others, Reference Koul2016). Because of the rain shadow effect, the majority (79%) of the glaciers in Ladakh region are quite small (<0.75 km2) typically restricted to high altitudes above 5200 m a.s.l, with only 4% being >2 km2 (Schmidt and Nüsser, Reference Schmidt and Nüsser2017). These small glaciers are a good indicator of climate change because of their direct response to climate fluctuations (Paul and others, Reference Paul, Kääb, Maisch, Kellenberger and Haeberli2004; Kargel and others, Reference Kargel2005). On the contrary, some studies also point out that small glaciers do not necessarily shrink as the climate warms because of their favourable topographical locations in shadowed cirques and niches (DeBeer and Sharp, Reference DeBeer and Sharp2009; Brown and others, Reference Brown, Harper and Humphrey2010). Despite being smaller in size, glaciers in the Ladakh region are vital in sustaining agricultural activities which form the basis for regional food security and socio-economic development (Labbal, Reference Labbal and Kreutzmann2000; Nüsser and others, Reference Nüsser, Schmidt and Dame2012). During a low precipitation year, glaciers and snowmelt are the only sources of water supply to the region (Thayyen and Gergan, Reference Thayyen and Gergan2010).
Ladakh is one of the least studied regions in terms of glaciological studies and lacks meteorological data which further limits scientific research at glaciological front. One of the key areas in the knowledge gap over the region is the understanding of glacier MB. There is no documentation of MB except one study by GSI on Rulung glacier (~60 km south from Leh city), which found a near balance condition of −0.1 m w.e. in 1980/81 (Srivastava and others, Reference Srivastava, Sangewar, Kaul and Jamwal1999b). Presently, Stok glacier is the only glacier in Ladakh region having continuous in-situ MB measurements of five hydrological years from 2014 to 2019 (and continuing). Therefore, to document glacier retreat and its consequences, it is necessary to further explore the MB of the past with the available information. With data scarcity and limited information about glacier retreat in mind, the following objectives have been conceived for the present study (i) to present in-situ MB of Stok glacier, (ii) to reconstruct a long-term MB at different temporal scale between 1978 and 2019 based on a temperature index and accumulation model, and (iii) to understand the glacier sensitivity to temperature and precipitation change. The study presents new information on Stok glacier, aiming at providing baseline data for further research on glacier dynamics in the Ladakh region.
2. Study area
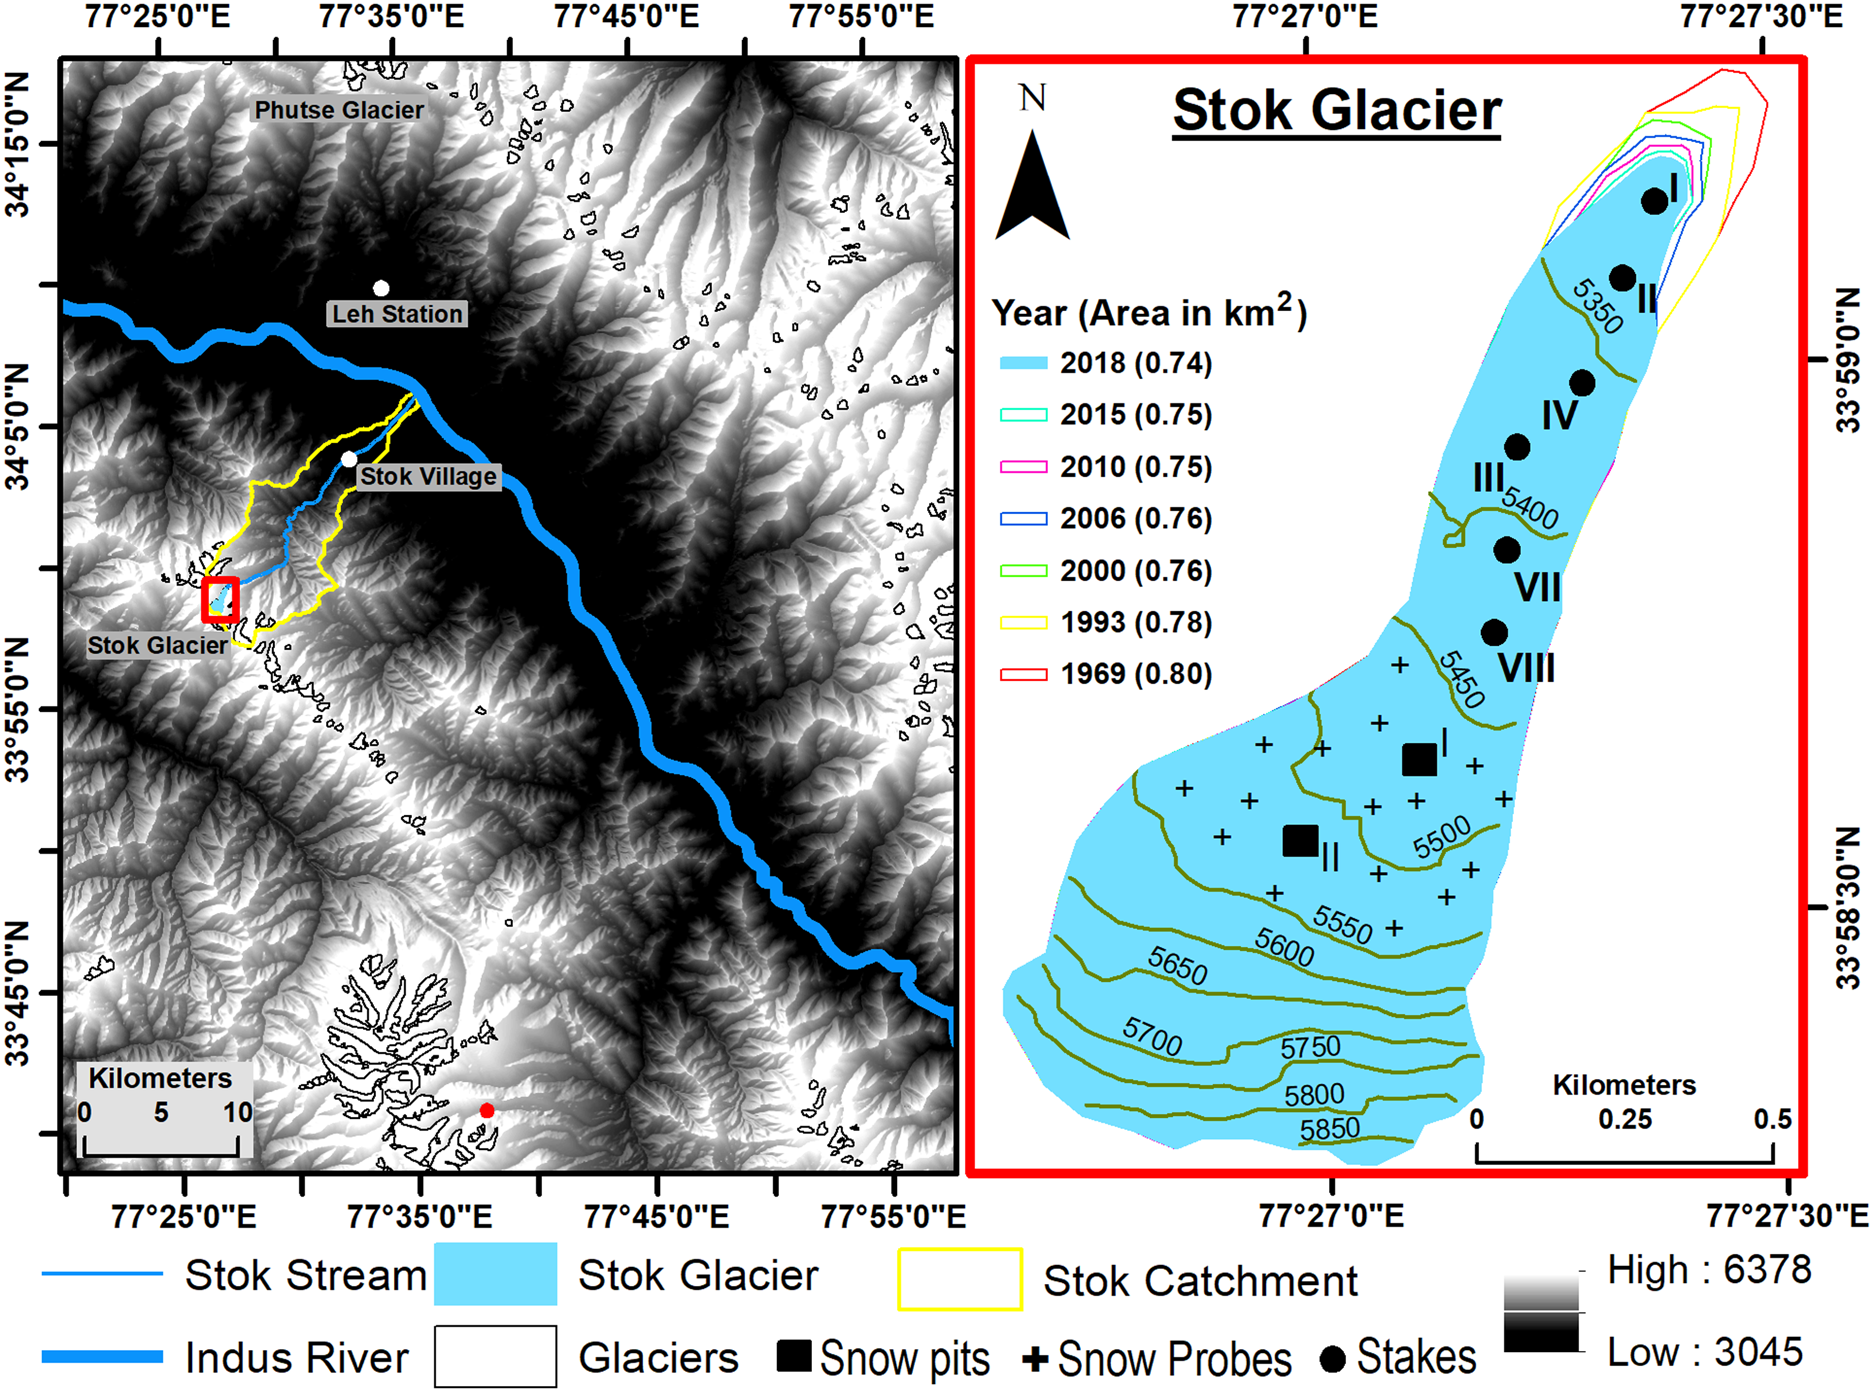
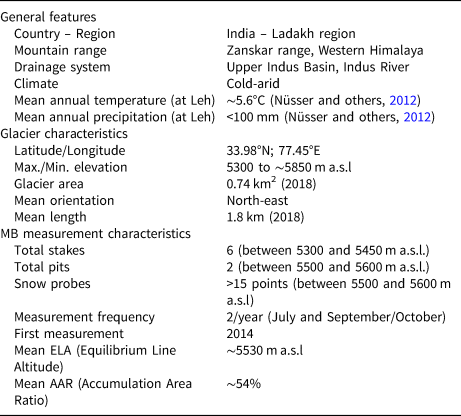
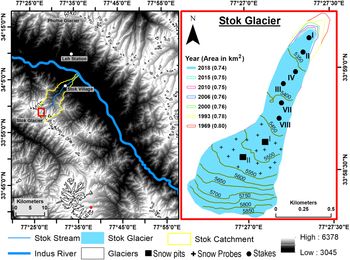
Stok glacier (33.98°N, 77.45°E) is located in Hemis National Park, ~20 km south of Leh city (3500 m a.s.l), Union Territory of Ladakh, India (Fig. 1). It is a small glacier which extends from 5300 to ~5850 m a.s.l, with an area and length of 0.74 km2 and 1.8 km, respectively. Stok is a north-east oriented debris-free glacier and has been monitored since 2014. It is one of the glaciers of Stok village catchment lying at the base of Stok Kangri (a very popular and nontechnical summit, ~6140 m a.s.l.). The catchment is a part of Upper Indus Basin with an area of ~80 km2 ranging in elevation from ~3000 to ~6140 m a.s.l. It consists of seven small glaciers (<2 km2) covering an area of 4.25 km2, equivalent to 5.3% of the catchment area. Majority of the glaciers in the catchment have a north-east orientation. The glaciers are characteristically small, high in altitude and free from debris, which make them similar to the rest of the glaciers in Northern Zanskar and immediate Ladakh range (Schmidt and Nüsser, Reference Schmidt and Nüsser2012). The stream from the Stok catchment feeds entire Stok village (~300 households; ~1471 individuals) and a portion of Chuchot village (LAHDC: Ladakh Autonomous Hill Development Council, Leh) before merging with the Indus River. The total utilized area of the Stok village is ~5 km2 dominated by agricultural land (>50%), tree cover (~10%) and fodder plants (Nüsser and others, Reference Nüsser, Schmidt and Dame2012). Meltwater from snow cover and glaciers of this catchment is the only source of water to the village for irrigation and domestic use (Nüsser and others, Reference Nüsser, Schmidt and Dame2012). Table 1 lists general, glacier and MB information of the study area.
Location map of Stok glacier, Ladakh region, India. Glacier outlines of different years with the area (in km2). The red dot represents newly installed automatic weather station at Lato catchment (5050 m a.s.l.).
Geographical and glacial details of the study area
3. Data
3.1. Temperature and precipitation
Temperature and precipitation data were obtained from the nearest Indian Meteorological Department (IMD) weather station located in the central administrative centre of Leh (3500 m a.s.l; hereafter called ‘Leh station’) ~20 km north of the study area (Fig. 1). The temperature data were collected at an hourly interval by an automatic weather station and converted into a daily interval for analysis, whereas precipitation data were collected manually at the same location on a daily basis. Ladakh region experiences snowfall events during winter months, and the precipitation data used in this study contains both solid and liquid precipitation. IMD uses a conventional method to convert the solid precipitation to liquid by adding a known amount of hot water to the collected snow and subtract the same afterwards to get the actual precipitation in terms of water equivalent (in general, 1 cm of fresh snow is equivalent to 1 mm w.e.). These observations are first manually scrutinized before going through a quality check for anomalies, errors etc. at National Data Centre (NDC) Pune, Govt. of India as per the World Meteorological Organisation (WMO) guidelines (refer Jaswal and others, Reference Jaswal, Narkhede and Shaji2014, Reference Jaswal, Bhan, Karandikar and Gujar2015 for more information on data collection by IMD, Govt. of India).
3.1.1. Data gaps
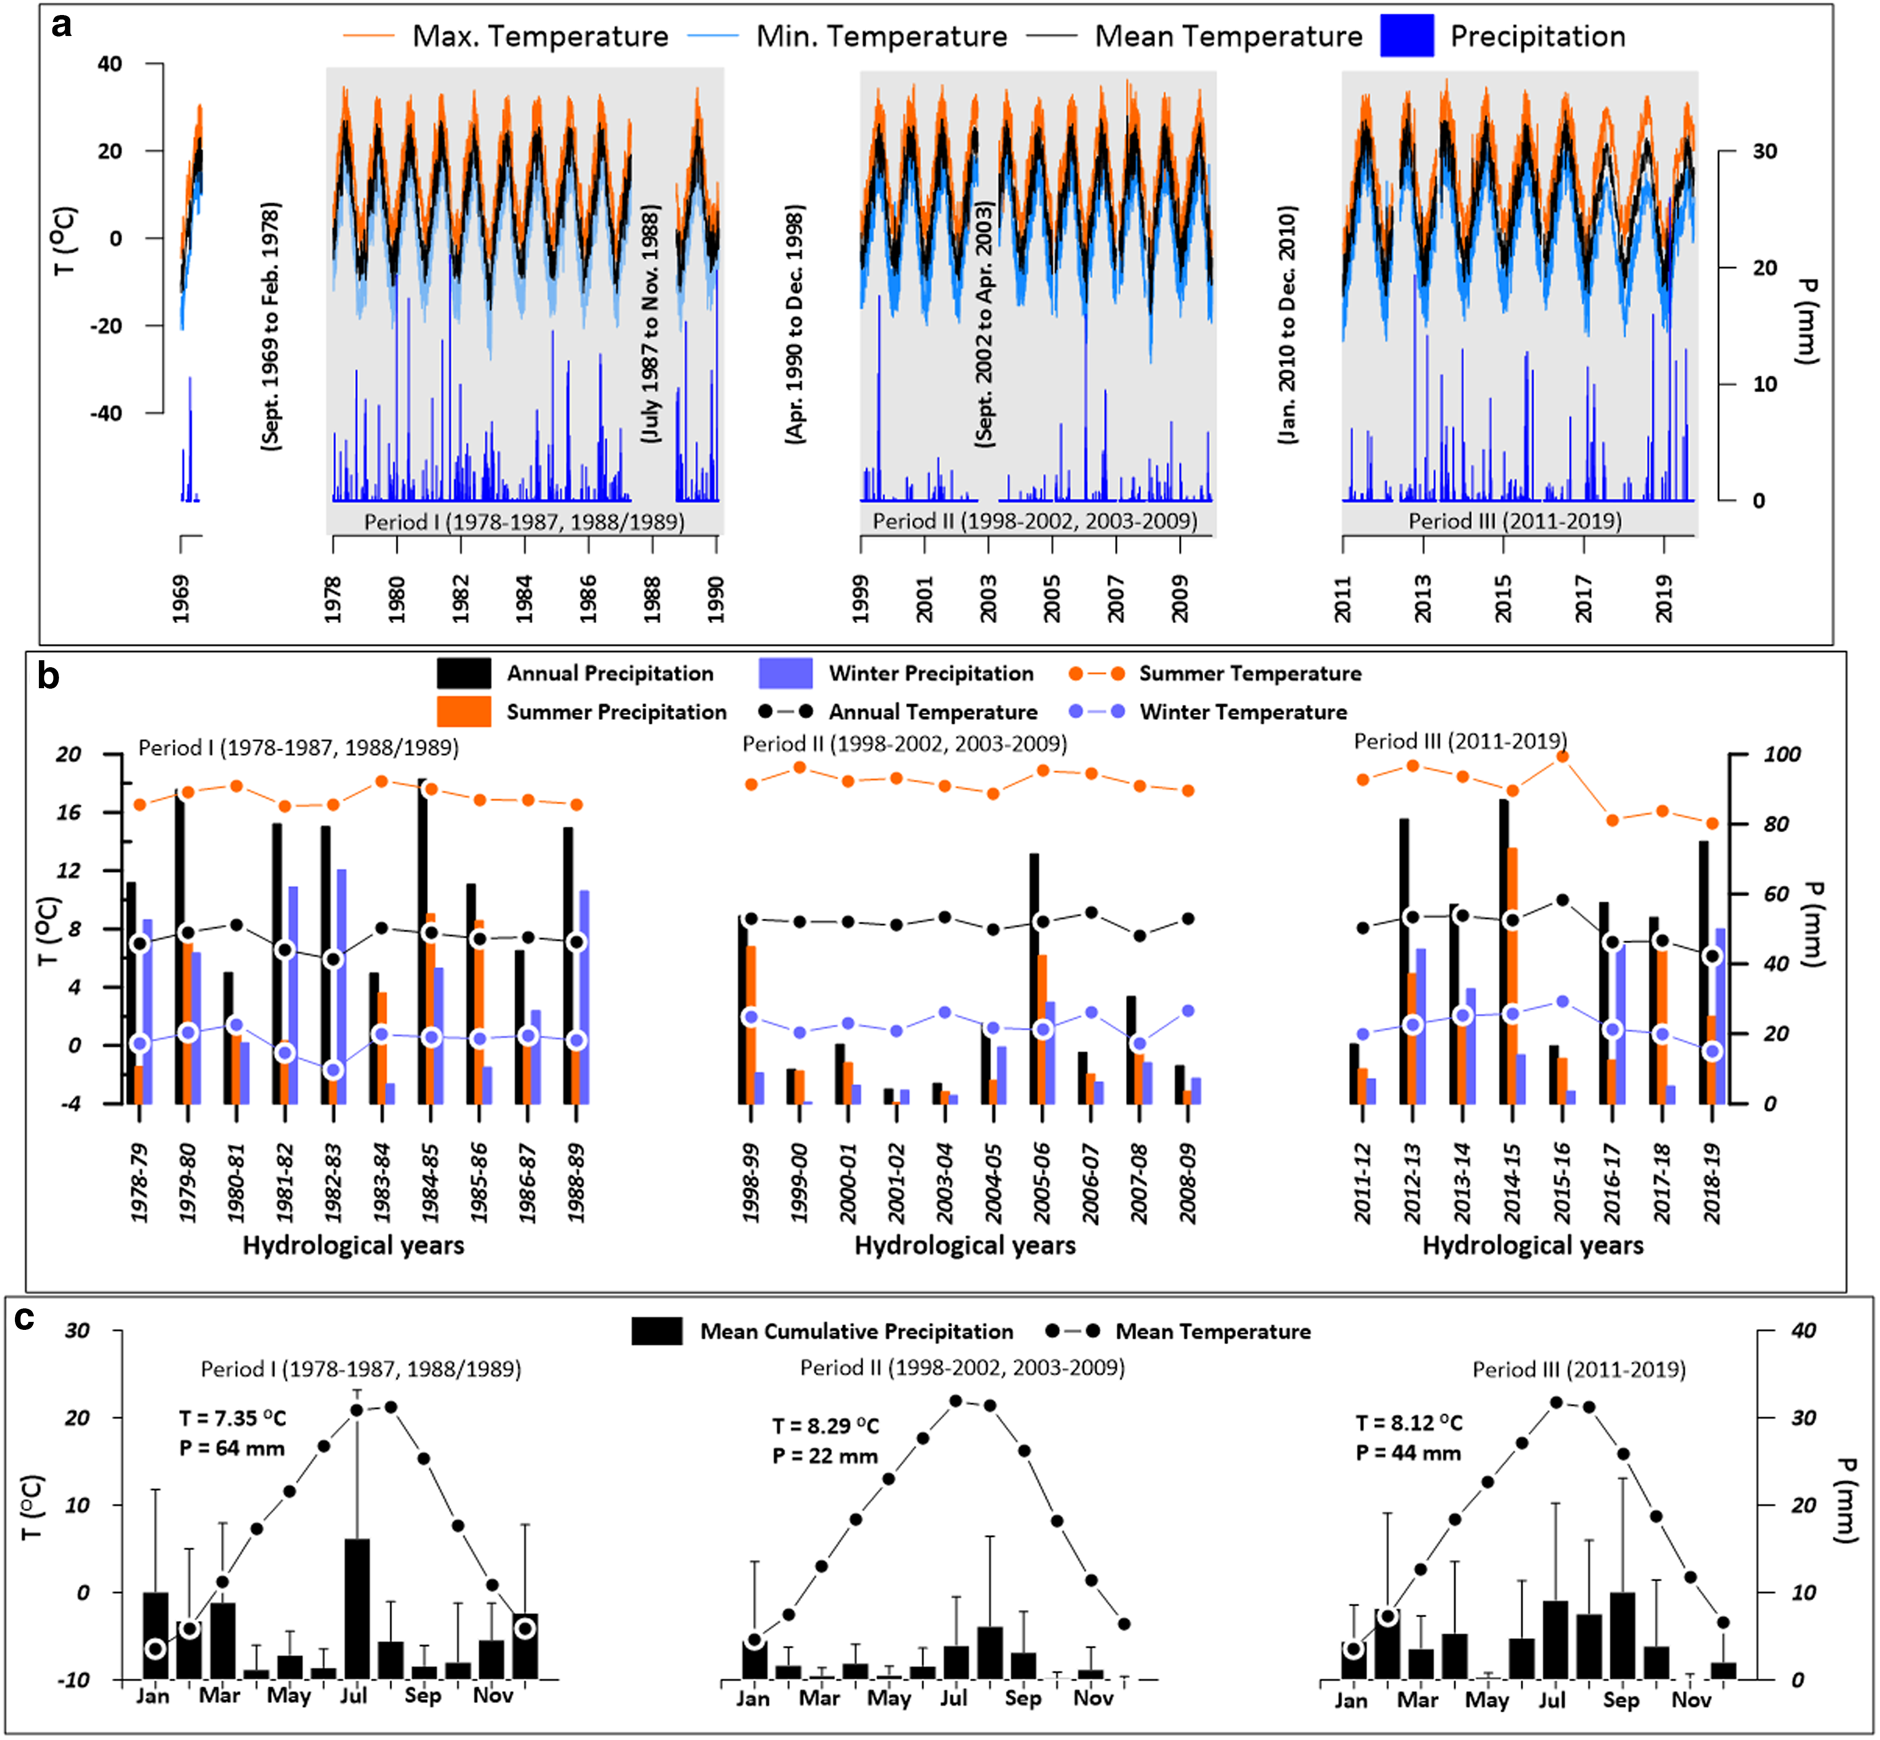
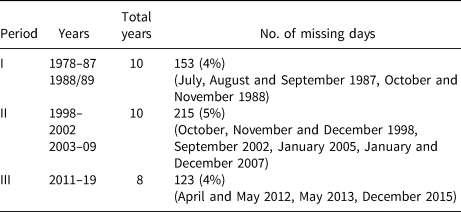
Leh station carries long-term meteorological data (daily temperature and precipitation) since 1969 with significant data gaps in between, Figure 2a. Therefore, the dataset was classified into three different periods, having maximum gaps of upto 3 months, for further analysis (Table 2). The gaps in the selected periods ranged from few days upto 3 months; thus, the dataset has sufficient data to understand and describe annual local climate cycles. Out of 10 229 d (Table 2), only 491 d were found missing (~4% data gap). The smaller gaps (<5 d) were filled by linear interpolation method using data from the immediately preceding and following days (Azam and others, Reference Azam2014). Larger gaps (>5 d) were filled by applying a regression using 12 years (2006–09, 2011–19) of the available dataset from Leh station and Intermediate Complexity Atmospheric Research model (ICAR; 5 km × 5 km; Gutmann and others, Reference Gutmann, Barstad, Clark, Arnold and Rasmussen2016). No attempts have been made to fill the gaps of more than 3 months, i.e. September 1969–February 1978 (~8 years), October 1987–September 1988 (~1 year), April 1990–September 1998 (~8 years), September 2002–April 2003 (~1 year) and January–December 2010 (~1 year).
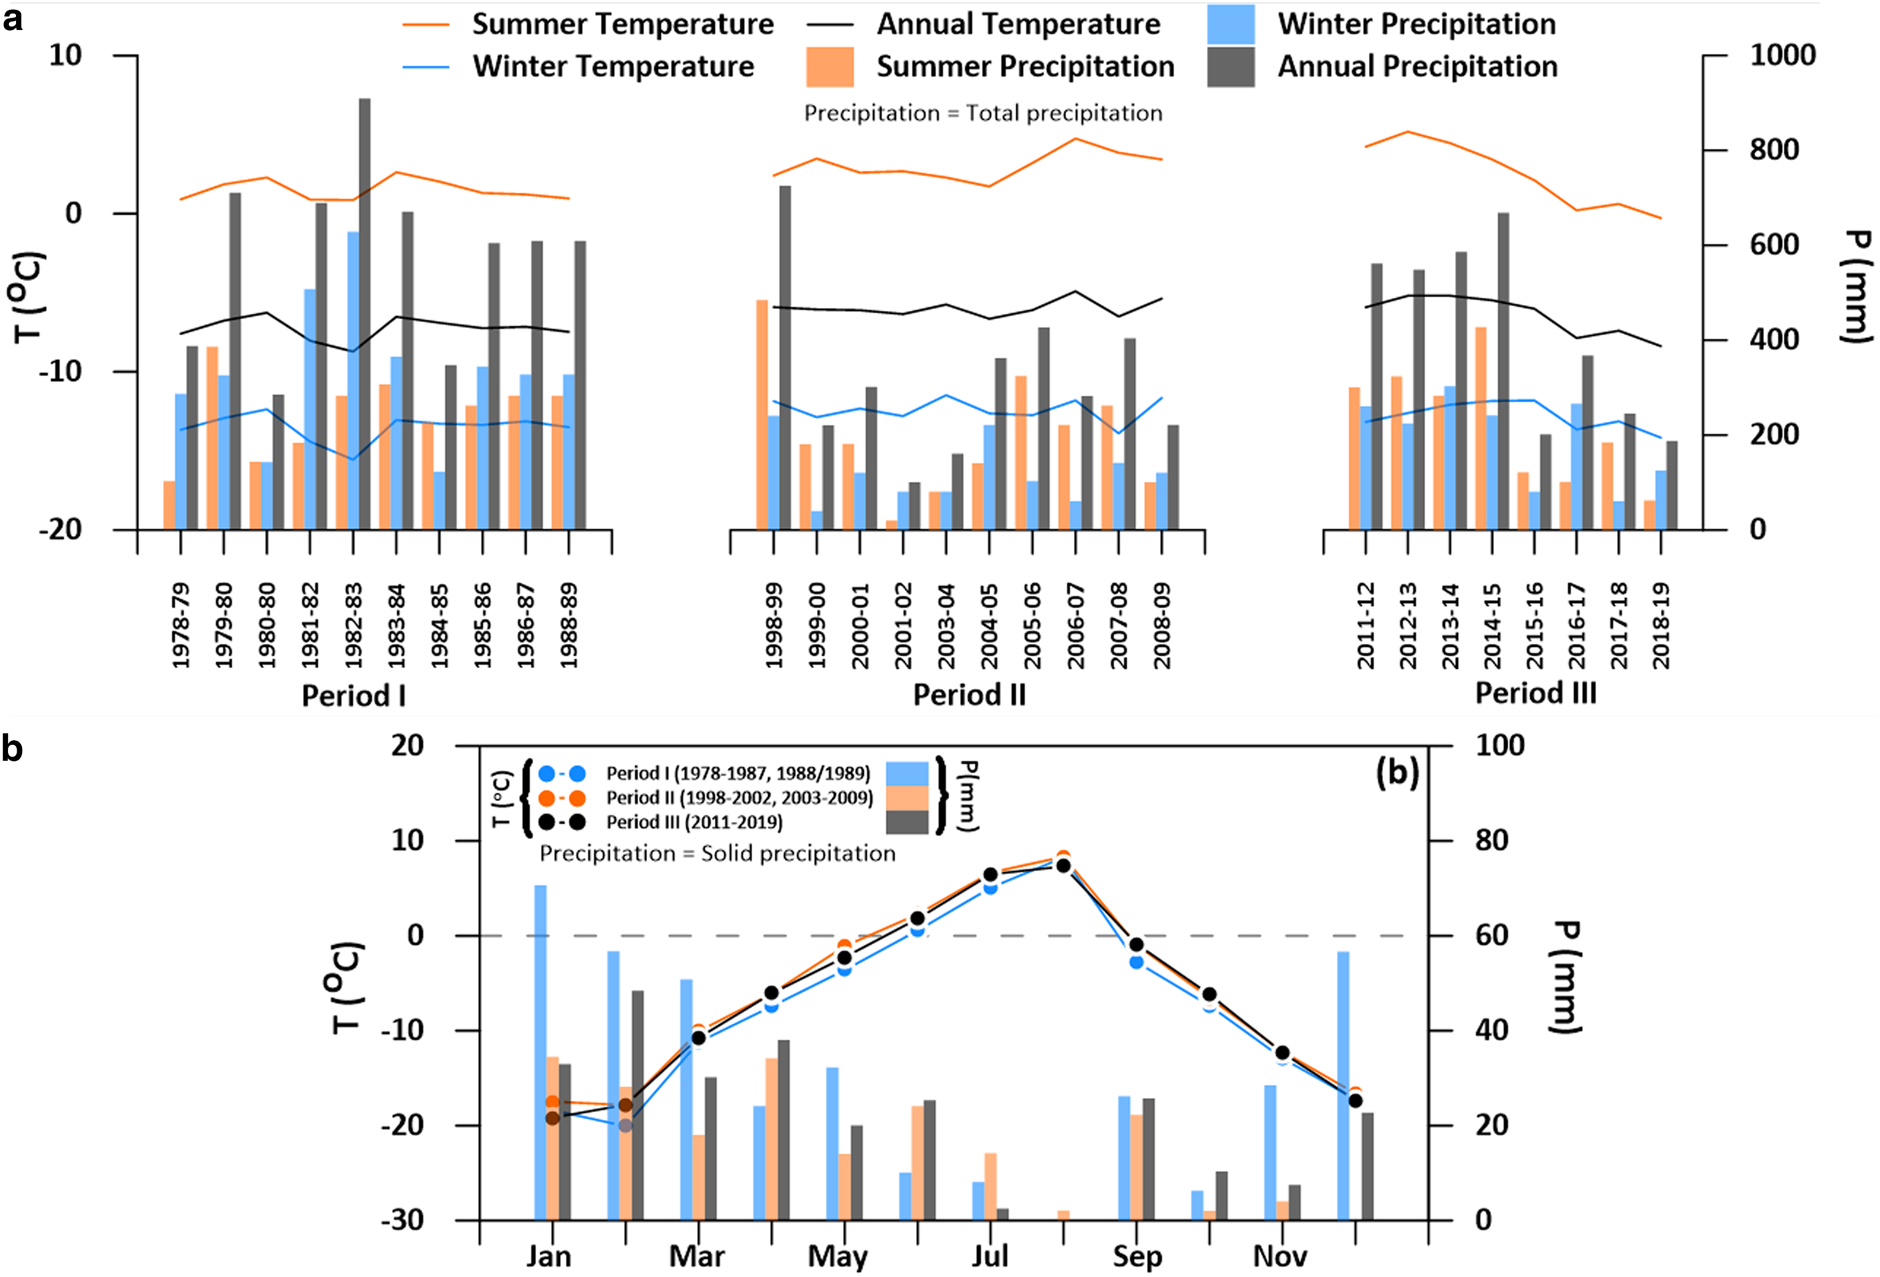
(a) Entire temperature and precipitation record available at Leh station (3500 m a.s.l.) including data gaps between 1969 and 2019. (b) Mean annual, summer and winter temperature and precipitation of the study periods (I, II and III). (c) Annual cycle of mean monthly temperature and cumulative precipitation of the same periods. T and P are the mean temperature and mean cumulative annual precipitation, respectively.
Details of the periods studied between 1978 and 2019
3.2. Satellite data
The study utilizes freely available satellite imageries (Table 3) to delineate the glacier boundaries of different years (Fig. 1). Orthorectified and georeferenced images from 1993, 2000, 2006, 2010 and 2015 of Landsat series (TM, ETM+ and OLI) were used to derive glacier boundaries using a standardized semi-automatic approach based on Red and shortwave infrared band ratio with additional manual corrections (Paul, Reference Paul2001; Racoviteanu and others, Reference Racoviteanu, Paul, Raup, Khalsa and Armstrong2009). Unfortunately, no suitable Landsat imagery is available before 1993 due to either cloud or snow cover. Therefore, 1969 aerial imagery of the declassified US Corona mission was used to find out the glacier extent before 1993. Declassified Corona image from the early US military reconnaissance survey dating back to 1969 has complex image geometry, and the missing camera parameters (inner and outer orientation) were calculated by using ground control points (GCP) and estimated focal length and pixel size; thus, the ortho-rectification of Corona image was quite tricky. In order to orthorectify the image, required GCP were selected on the Landsat 1993 image, and the corresponding height values were derived from the Advanced Spaceborne Thermal Emission and Reflection Radiometer Digital Elevation Model (ASTER DEM; https://earthdata.nasa.gov/). Because of the panoramic view, the ortho-rectification of two times or more was required for smaller segments of the Corona image. Ortho-rectification of the image was carried out using ENVI software 5.1. using several GCP and other parameters (Camera Type: Digital (Frame Central); Focal length: 609.680; Pixel Size: 0.007 mm). GCP were taken on stable locations, for example Stupas, Monasteries, bridges, road junctions, Palaces, stable boulders etc. with DGPS (Differential GPS). Only one corona strip (DS1107-1104DA015-a) was used for the study, and the location of the present study was at the centre of the scene. And finally, manual digitization of PlanetScope imagery (https://www.planet.com/) of 2018 (28 August 2018) was carried out to get the present extent of Stok glacier. Band ratio approach was not applicable because the shortwave infrared band is not available in PlanetScope imagery. ASTER DEM was used for further accuracy of the glacier outline in the higher accumulation zone, catchment delineation and glacier hypsometry. ASTER DEM has one arc second horizontal resolution with a vertical accuracy of 17 m on a global scale and 11 m on Himalayan terrain (Fujita and others, Reference Fujita, Suzuki, Nuimura and Sakai2008). Details of the imageries used in the study are listed in Table 3.
Details of satellite imagery used
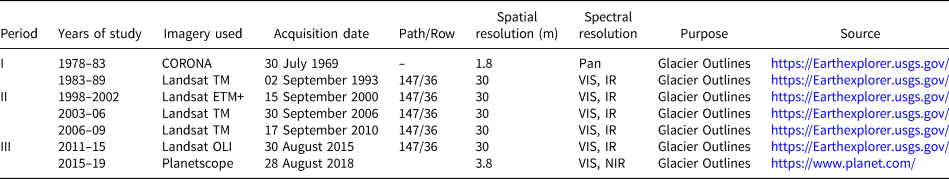
Pan = panchromatic, VIS = visible, IR = infrared, NIR = near infrared.
4. Methodology
4.1. In-situ MB
MB measurements of Stok glacier started in 2014 using the direct glaciological method (Cuffey and Paterson, Reference Cuffey and Paterson2010). The measurements for total accumulation and ablation were performed at the end of every ablation season, i.e. September end or early October. Accumulation is the deposition of solid precipitation, which is measured through snow pits and snow probing, and ablation is measured using a network of stakes on the glacier. MB per unit area is the specific MB of glacier expressed in m w.e.
In the ablation area, measurements were obtained from a network of six bamboo stakes (Fig. 1) inserted 8 m deep in the ice with Heucke steam drill (Heucke, Reference Heucke1999) at different elevations (30–50 m interval). Ice density was assumed to be 900 kg m−3 (Wagnon and others, Reference Wagnon2007, Reference Wagnon2013; Azam and others, Reference Azam2012) and in the presence of snow, the density was measured in the field. In the accumulation area between 5450 and 5600 m a.s.l, snow pits 28–55 cm deep were excavated at two locations depending upon snow depth at the end of each hydrological year (Fig. 1). To measure the density and determine water equivalent of snow, a known volume of snow was scooped out at every 10–20 cm stratigraphic layer (e.g. new snow, old snow, refreeze layer, etc.). The snow was then measured for mass required to calculate density and snow water equivalent. Additional snow probing (>15 points) was also carried out at random locations throughout the accessible accumulation zone to measure the snow depth (Fig. 1). However, above ~5600 m a.s.l. the glacier is difficult to reach and inaccessible for measurements. The density, snow water equivalent and depth measurements were integrated to the entire accumulation area to obtain the total accumulation.
MB of Stok glacier was calculated using the specific accumulation and ablation measurements. The sum of accumulation and ablation was then integrated over the entire glacier surface area, and MB was obtained using the following equation:

where bi is the MB of an altitudinal area (si) obtained from the corresponding ablation and accumulation measurements, and S is the total surface area of the glacier (Wagnon and others, Reference Wagnon2007; Cuffey and Paterson, Reference Cuffey and Paterson2010). The glacier area was delineated using the approaches mentioned in Section 3.2. Additional correction of the glacier outlines (wherever required) was done with the help of photographs taken during several field surveys. The hypsometry of the glacier was extracted using ASTER DEM.
4.2. MB reconstruction
4.2.1. MB model
Melt models majorly fall into four categories depending on the data requirement as well as the level of sophistication. (i) Classical temperature index model and (ii) enhanced temperature index model with a radiation component (Braithwaite and Zhang, Reference Braithwaite and Zhang1999; Hock, Reference Hock2003, Reference Hock2005; Azam and others, Reference Azam2014; Pellicciotti and others, Reference Pellicciotti2015) where the data requirement (temperature, precipitation and radiation) is quite less while the full energy-balance model (iii) applied to the surface and (iv) with a treatment of upper layers are the sophisticated ones where a complete set of meteorological data (temperature, radiations, wind speed and directions, snow depth, relative humidity etc.) is required (Gustafsson and others, Reference Gustafsson, Stahli and Jansson2001; Hock, Reference Hock2005; Pellicciotti and others, Reference Pellicciotti, Carenzo, Helbing, Rimkus and Burlando2009; Luce and Tarboton, Reference Luce and Tarboton2010). For the present study, only temperature and precipitation dataset were available. Therefore it was appropriate to use the classical temperature index model combined with an accumulation model to compute annual glacier-wide MB of Stok glacier (Hock, Reference Hock2005; Azam and others, Reference Azam2014; Zhang and others, Reference Zhang, Li, Zhou, Zhu and Wang2018). The temperature index model is based on a strong correlation between air temperature and surface melt. Ablation and accumulation were computed using Eqns (2 and 3).


where, m and a are the melt and accumulation, respectively. DDF snow/ice represents the degree-day factor (for snow/ice) in mm °C−1 day−1. T, T m and T p are the air, melting threshold and precipitation threshold temperatures (°C), respectively. p and Ti are the precipitation and temperature (°C) at the elevation band i, respectively.
Computations of DDFs were performed at various elevations using the ablation stakes distributed over the surface of the glacier and the extrapolated temperature data from Leh station (see section 4.2.2). The extrapolated temperature and precipitation data at a daily time step were the required input for the model, together with corresponding DDF of snow and ice surface. The model calculates MB at each elevation band of 50 m on a daily time step for a complete hydrological year starting from 1 October until 30 September of the following year (e.g. 1 October 2018 to 30 September 2019). Daily melt on the surface of the glacier is calculated when the air temperature of a respective elevation band is above the threshold temperature for melt (T m). Precipitation only contributes to mass gain when the air temperature is below the threshold temperature for precipitation (T p), which separates solid and liquid precipitation. The model is also sensitive to account for the solid precipitation occurring during the ablation period. In such cases, DDF snow is applied by the model in the ablation zone until the surface snow is melted away. The model does not account the impact of liquid precipitation and refreezing as it is negligible for temperate glaciers (Braithwaite and Zhang, Reference Braithwaite and Zhang2000). Present study includes the changes occurring in glacier area during the entire modelling period (Fig. 1) from 1969, 1993, 2000, 2006, 2010, 2015 and 2018 imageries (Table 3).
4.2.2. Parameter analysis
A classical temperature index model, together with an accumulation model, was used to reconstruct MB of Stok glacier between 1978 and 2019. The model is robust and ideal for Ladakh region as it uses fewer parameters to run. Table 4 lists all the parameters required by the model where some of the parameters are derived using the in-situ observation (DDFs for snow and ice, Lapse rate) from the region. T m and T p are the commonly used ones chosen from the literature. The only adjusted parameter in MB reconstruction was precipitation gradient due to lack of data.
Details of the parameters used in the present study

a Monthly slope environmental lapse rate (SELR) from Thayyen and Dimri (Reference Thayyen and Dimri2014).
4.2.2.1. Temperature lapse rate
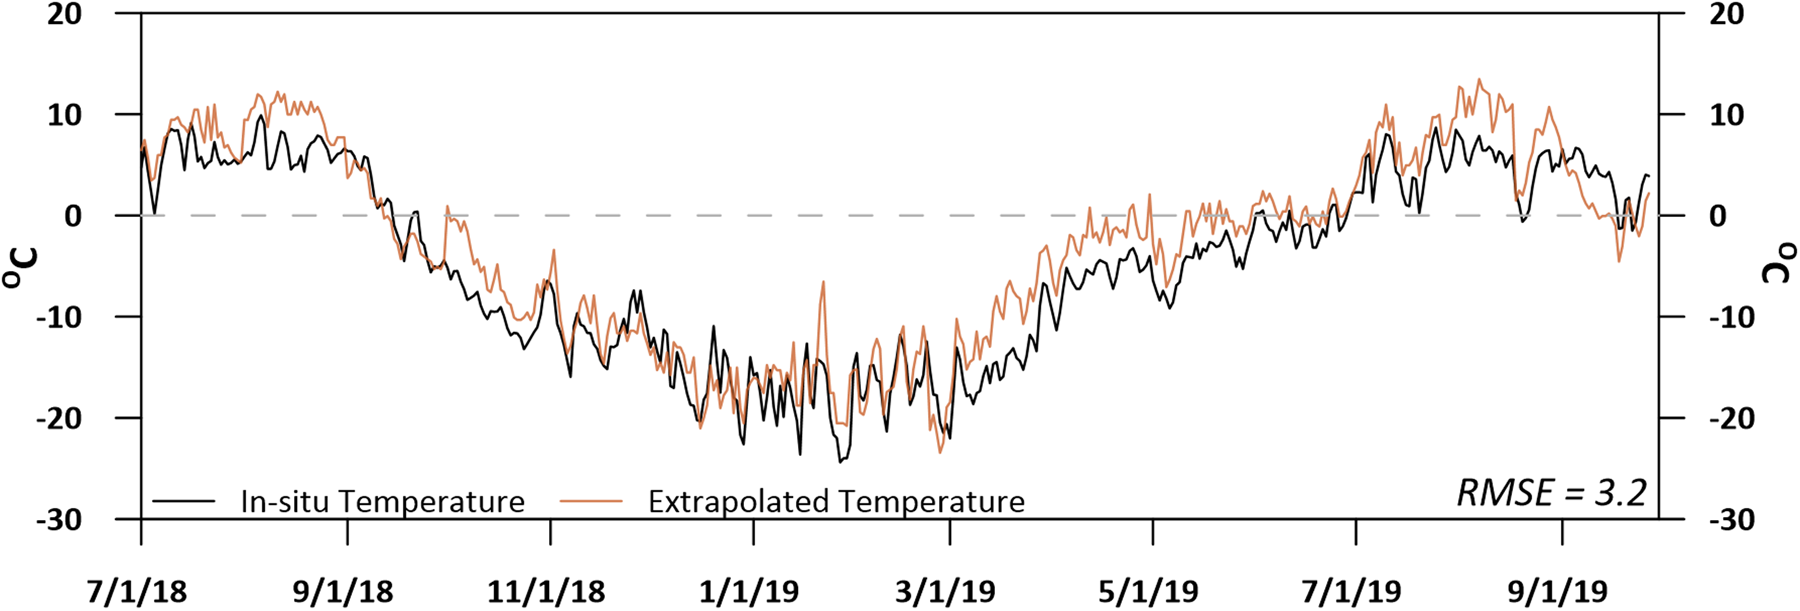
In order to check the reliability of temperature extrapolation method, extrapolation was first performed on Leh station data using monthly Slope Environmental Lapse Rate (SELR) (Thayyen and Dimri, Reference Thayyen and Dimri2014) and compared with data from the newly installed automatic weather station at Lato catchment (5050 m a.s.l.). This newly installed station lies in the same region at ~30 and ~55 km south of Stok glacier and Leh station, respectively (Fig. 1). Figure 3 presents the extrapolated and in-situ temperatures at 5050 m a.s.l. for a period of 423 d (~14 months: 1 July 2018 to 27 September 2019). The extrapolated temperature was found to be in agreement with the in-situ one with an RMSE of 3.2°C. To estimate SELR, Thayyen and Dimri (Reference Thayyen and Dimri2014) used data from three weather stations, i.e. Leh station (3500 m a.s.l.), South Pullu (4700 m a.s.l.) and Phutse glacier (5600 m a.s.l.), which lie in the same valley (~40 km) towards the northern side of the present study area (Fig. 1). Since, both the study areas (Thayyen and Dimri, Reference Thayyen and Dimri2014 and present study) lie in the same climatic zone, therefore, monthly SELR were used for temperature extrapolation to the Stok glacier area.
In-situ and extrapolated air temperatures at 5050 m a.s.l for a period of 14 months (1 July 2018 to 27 September 2019). The extrapolation was carried out on Leh station dataset using monthly SELR (Thayyen and Dimri, Reference Thayyen and Dimri2014). In-situ data are taken from the newly installed automatic weather station at Lato catchment (5050 m a.s.l). The red dot in Figure 1 represents the location of the newly installed station.
4.2.2.2. Precipitation gradient
Understanding precipitation distribution over the mountainous region is more tricky than temperature since precipitation amounts are not spatially uniform and have strong vertical dependence (Immerzeel and others, Reference Immerzeel, Pellicciotti and Shrestha2012, Reference Immerzeel, Petersen, Ragettli and Pellicciotti2014). Limited data and no information on precipitation gradient over the Ladakh region further complicates the understanding of precipitation variability. Therefore, it was decided to use the nearest available precipitation gradient of 0.2 m km−1 (Azam and others, Reference Azam2014) with caution and make further adjustments during MB reconstruction. Since the adopted precipitation gradient is from a different region (Lahaul and Spiti) which has influence from Indian summer monsoon (Bookhagen and Burbank, Reference Bookhagen and Burbank2010), therefore, the gradient is probably over-estimated for the present study. Considering the large spatial variability in precipitation, adjustment of precipitation gradient was carried out in Section 4.2.3.
The gradient has been applied to all the elevation bands of the glacier area to compute precipitation at every band assuming that it linearly increases with altitude (Wulf and others, Reference Wulf, Bookhagen and Scherler2010; Immerzeel and others, Reference Immerzeel, Petersen, Ragettli and Pellicciotti2014). A threshold temperature (T p) of 1°C (Jóhannesson and others, Reference Jóhannesson, Sigurdsson, Laumann and Kennett1995; Lejeune and others, Reference Lejeune2007) was used to separate solid precipitation from liquid precipitation.
4.2.2.3. Degree day factor
Computations of DDFs were performed with the help of ablation stakes installed on each elevation band during summer (August–September) of 2015, 2016 and 2019 between 5300 and 5450 m a.s.l. For each stake, corresponding cumulated positive degree-days (CPDD) were obtained using extrapolated temperature from Leh station. Stake readings from August to September were chosen as no significant fresh snowfall have been observed during this period. DDFs were calculated for snow and ice only as the glacier is free from debris.
4.2.3. Model calibration
At first, MB of Stok glacier was calculated using the obtained parameters and probably over-estimated precipitation gradient of 0.2 m km−1. Recalculation of the MB was carried out by gradually implementing a decrease of 0.01 m km−1 in precipitation gradient until a minimum RMSE between in-situ and modelled MB was achieved. In-situ glacier-wide annual MB and altitudinal MB measurements between 2014/15 and 2018/19 have been used for calibration of the model. The model was tuned to minimize differences between both in-situ and modelled annual glacier-wide MBs and altitudinal MBs. Only precipitation gradient has been adjusted to achieve the best agreement between the in-situ and modelled MBs.
4.3. Uncertainty analysis
Uncertainties in direct glaciological MB arise from point observations and extrapolation process. To assess uncertainty related to the extrapolation method in the accumulation zone, three different approaches i.e. (i) constant accumulation value for all the elevation bands in the accumulation zone, (ii) linear gradient in accumulation values and (iii) inverse gradient in the highest two elevation bands of accumulation zone were used each year to obtain the annual accumulation following Kenzhebaev and others (Reference Kenzhebaev2017). The standard deviation in results of the three approaches is interpreted as the uncertainty of accumulation zone. For the ablation zone, the uncertainty is estimated using one-sigma confidence interval of the regression coefficient (Sold and others, Reference Sold2016). The combination of these uncertainties results in total annual uncertainty of glacier-wide MB. Overall, combined annual glacier-wide MB uncertainty was found to be ± 0.38 m w.e. a−1 with the majority of the uncertainty arising because of high variation in the melt on Stok glacier. Since the region receives very little precipitation and the glacier is comparatively small; the variation of precipitation (snow) on the glacier is not making much of a difference in the annual glacier-wide MB.
The quantification of the uncertainty in modelled MB was carried out by re-running the model with a new set of parameters (DDF snow/ice, LR, PG) within the limit bounds for DDF snow/ice (±0.18 for DDF snow and ± 0.14 for DDF ice) as calculated by Taylor (Reference Taylor1997). The values for LR and PG were adjusted by ± 20% and ± 25%, respectively (Azam and others, Reference Azam2014; Zhang and others, Reference Zhang, Li, Zhou, Zhu and Wang2018). The highest standard deviation between the new series generated using the modified parameters and initial modelled MB was taken as the uncertainty of the modelled MB. The uncertainty was found to be± 0.35 m w.e. a−1. The error associated with semi-automatic digitisation of glacier outlines was estimated to be one pixel (Congalton, Reference Congalton1991; Hall and others, Reference Hall, Bayr, Schöner, Bindschadler and Chien2003). The glacier area uncertainties were calculated by using buffer method (Granshaw and Fountain, Reference Granshaw and Fountain2006), given that the level 1 T Landsat images was corrected to sub-pixel geometric accuracy (Bhambri and others, Reference Bhambri2013). The uncertainty in the glacier area was found to be <10% (1.26–9.82%).
5. Results
5.1. Temperature and precipitation
Meteorological conditions at Leh station are presented in Figure 2. Daily mean air temperature ranges between −17 and 30°C with a mean temperature of ~6°C for the study period of 28 years (1978–87, 1988/89, 1998–2002, 2003–09, 2011–19). The coldest and the warmest month was January and August with a mean temperature of ~−6 and 21°C, respectively. Leh is one of the most arid places in India with annual cumulative precipitation of <100 mm (Nüsser and others, Reference Nüsser, Schmidt and Dame2012) and maximum daily precipitation of ~26 mm (February 2019) recorded at Leh station. Figure 2b presents annual, summer and winter mean temperature and cumulative precipitation at Leh station. Period I (1978–87, 1988/89) observed comparatively lower temperature and high precipitation, whereas period II (1998–2002, 2003–09) recorded higher temperature and lower precipitation. However, meteorological conditions during period III (2011–19) were found to be similar to both period I (during 2011–16) and II (during 2016–19); but with moderate cumulative precipitation during most of the years. Figure 2c presents the mean annual cycle of monthly temperature and cumulative precipitation for the three studied periods. It was obtained using the dataset of different periods by averaging all the monthly temperature (or precipitation) available for each month of the year (e.g. all the records of January months were averaged together to obtain the monthly temperature of January). Seasonality of temperature was almost identical, but a shift in precipitation from winter to summer was observed, i.e. summer precipitation of ~38% in Period I to ~63% and ~58% during Period II and III, respectively. The increase in summer precipitation supports the ongoing rise in cloudburst and flashflood events around Ladakh region in recent years due to influence from Indian Summer Monsoon (Thayyen and others, Reference Thayyen, Dimri, Kumar and Agnihotri2013; Dimri and others, Reference Dimri2017; Priya and others, Reference Priya, Krishnan, Mujumdar and Houze2017). Figure 4 presents the extrapolated temperature and precipitation at Stok glacier (5500 m a.s.l.) between 1978 and 2019. Annual temperature at Stok glacier ranges between −4.9 and −8.7°C with a mean temperature of −6.6°C (Fig. 4a). Whereas, monthly mean temperature ranges between −20 (January) and 8°C (August) with a mean temperature of −3.8°C. The ablation time on Stok glacier is ~4 months, whereas accumulation (solid precipitation) mostly happens during winter (Fig. 4b).
Extrapolated temperature and precipitation at Stok glacier (5500 m a.s.l.) between 1978 and 2019: (a) Mean annual, summer and winter temperature and precipitation of the study periods (I, II and III). (b) Annual cycle of mean monthly temperature and cumulative precipitation of the same periods.
5.2. In-situ MB
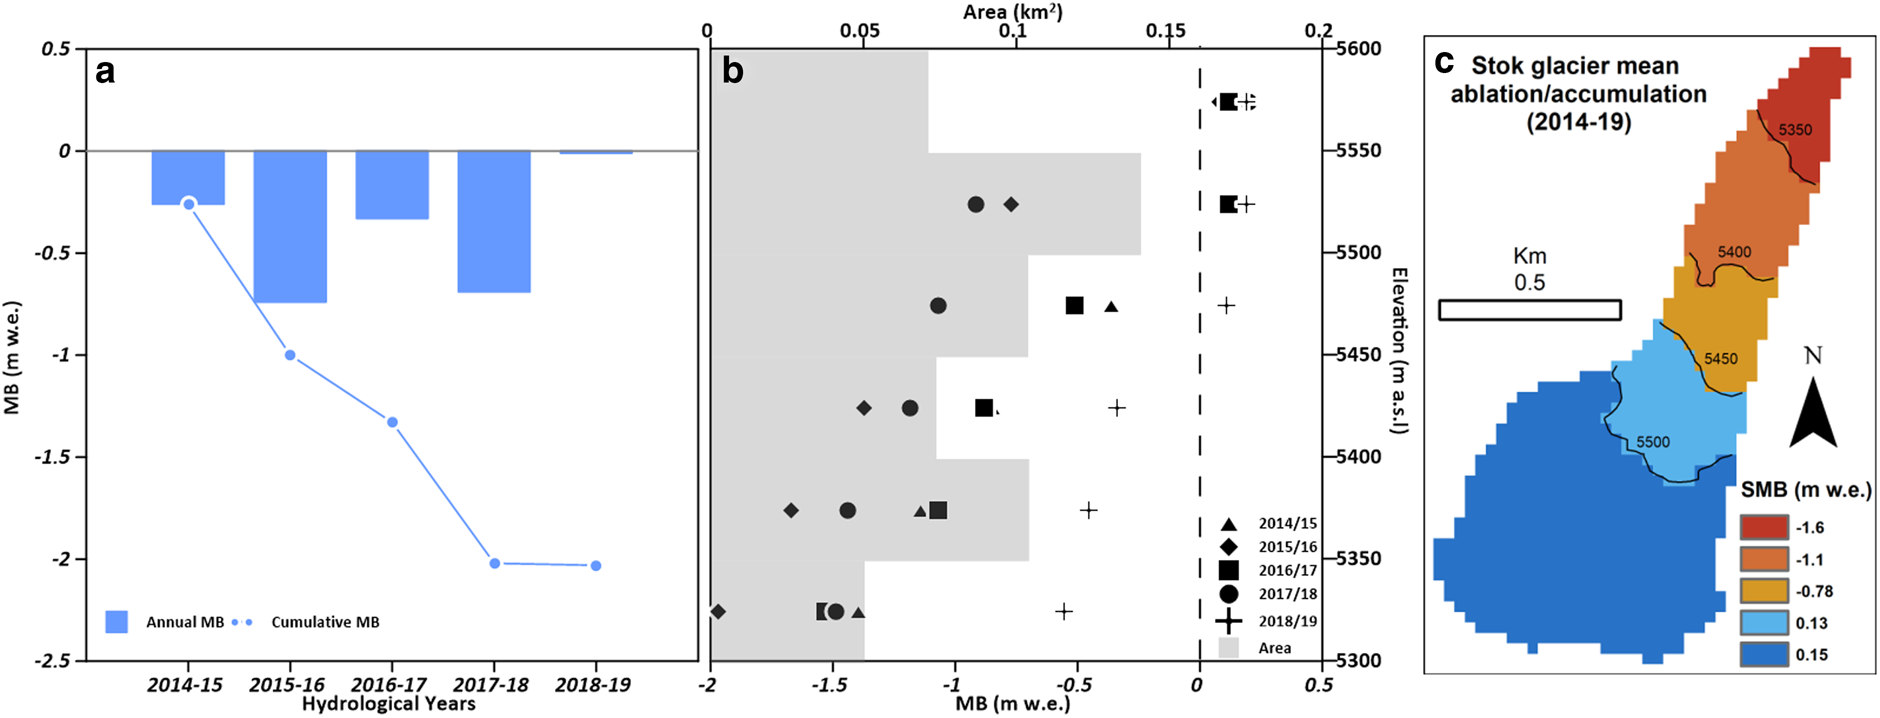
Annual MB, cumulative MB and altitudinal variation of the in-situ single point MB using stakes and snow pits of Stok glacier in five hydrological years (2014–19) are shown in Figure 5. The in-situ MB of Stok glacier was negative throughout the study period except 2018/19 where it experienced a balanced condition (−0.01 ± 0.38 m w.e.) due to comparatively lower temperature (annual and summer) and higher precipitation (annual, summer and winter). The glacier witnessed a higher loss in 2015/16 (−0.73 ± 0.38 m w.e.) and 2017/18 (−0.63 ± 0.38 m w.e.), while the loss was comparatively less during 2014/15 (−0.26 ± 0.38 m w.e.) and 2016/17 (−0.32 ± 0.38 m w.e.). The highest mass loss observed in 2015/16 (ELA at ~5589 m a.s.l) was due to comparatively high summer temperature (19.8°C) and low winter precipitation (3.6 mm) observed at leh station (Table 5). The hydrological year 2015/16 witnessed the highest mean annual temperature (10°C) and lowest annual cumulative precipitation (16.6 mm) throughout the study period 2014/15 to 2018/19 (Table 5; Fig. 2). The year 2017/18 (ELA at ~5578 m a.s.l) observed similar mass loss due to lack of winter precipitation (5.0 mm at Leh station). However, during the same hydrological year Stok glacier has received majority of its annual precipitation in summer (80%, mostly solid precipitation) which has most probably reduced the excessive melting by changing the albedo of the surface. Similarly, in 2014/15, high summer precipitation (73 mm ≈ 90%) may have again reduced the melt (Table 5). The year 2016/17 received comparatively sufficient winter precipitation (45 mm ≈ 78%) and relatively lower annual temperature (7.1°C) with summer temperature of 15.5°C due to which the glacier witnessed moderate mass loss (ELA at ~5521 m a.s.l) (Fig. 2).
In-situ MB: (a) Annual and cumulative MB, (b) single point MB as a function of altitude and (c) mean ablation/accumulation (map) on Stok glacier for 2014–19 derived from the in-situ measurements.
MB, ELA, AAR and vertical MB gradient (db/dz) of Stok glacier; meteorological conditions at Leh station (3500 m a.s.l). The mean and standard deviation (σ) for each component presented are from the in-situ study period (2014/15 to 2018/19).

Summer = May–September; Winter = October–April.
The single point MBs (2014–19) varied between −1.97 (2015/16) and 0.2 m w.e (2017/18) with a minimum vertical MB gradient (db/dz) of 0.35 m w.e. (100−1 m) in 2018/19 to a maximum of 0.76 m w.e. (100−1 m) in 2015/16 between 5300 and 5600 m a.s.l. The mean vertical MB gradient over the entire study period (2014–19) was found to be 0.61 m w.e. (100−1 m). Overall, Stok glacier is losing mass with a moderate interannual variability in MB (Std dev. of ± 0.26 m w.e. a−1). The cumulative MB was found to be ~−2 m w.e. (mean MB of −0.39 ± 0.38 m w.e. a−1) and the ELA varied from a minimum of 5471 m a.s.l (MB = −0.01 ± 0.38, AAR = 70%) to a maximum of 5589 m a.s.l. (MB = −0.73 ± 0.38 m w.e., AAR = 38%).
5.3. MB reconstruction
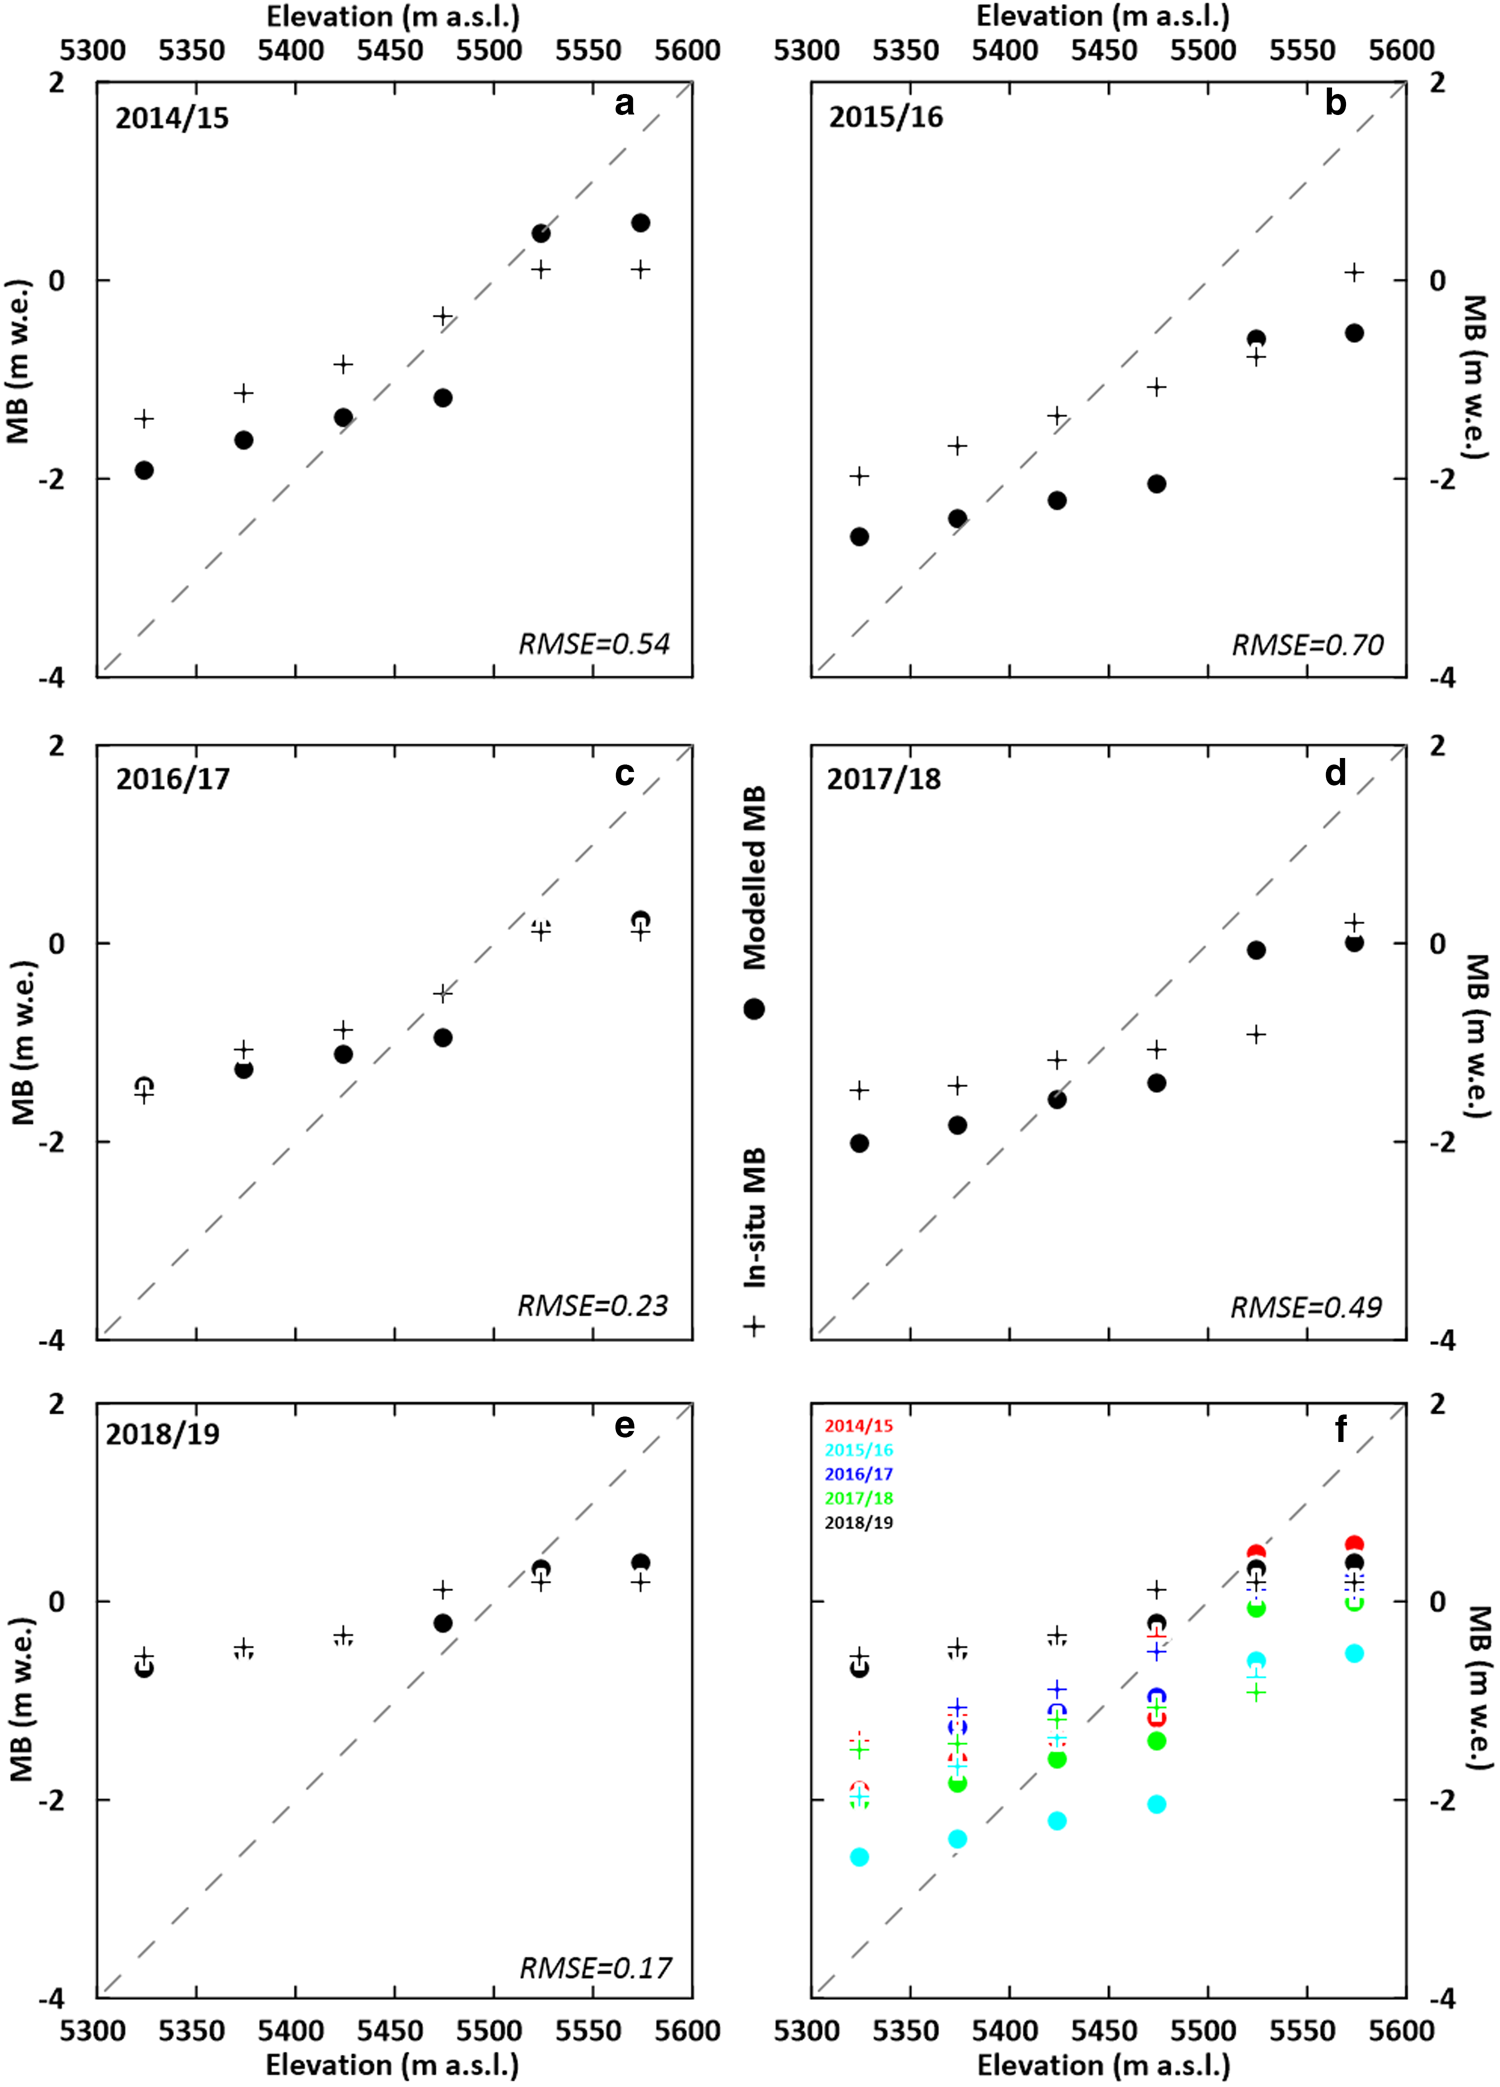
Comparison of annual in-situ MB gradient with the modelled MB gradient (at 50 m elevation bands from 5300 to 5600 m a.s.l) for each hydrological year from 2014–19 is presented in Figure 6. The in-situ and modelled single point MB values as a function of altitude are in good agreement with RMSE ranging from a minimum of 0.17 m w.e. a−1 (2018/19) to a maximum of 0.7 m w.e. a−1 (2015/16) with a mean RMSE of 0.42 m w.e. a−1 between 2014 and 2019. The larger differences were mostly coming from the ablation area. The comparison of annual in-situ and modelled annual MBs (Fig. 7) show a good agreement, with RMSE of 0.23 m w.e. a−1 (R 2 = 0.92, P < 0.05). The best and the poor fit was found in 2016/17 and 2015/16 with RMSE of 0.01 and 0.49 m w.e. a−1, respectively. The in-situ and modelled cumulative MB from 2014 to 2019 was found to be −2.03 and −2.21 m w.e. (−0.41 and −0.44 m w.e. a−1), respectively with RMSE of 0.25 m w.e.
Comparison of in-situ and modelled MB as a function of altitude for five hydrological years from 2014 to 2019 (a, b, c, d, e) and all together (f).
Comparison of in-situ and modelled annual and cumulative MBs from 2014 to 2019.

5.3.1. Annual and cumulative MB
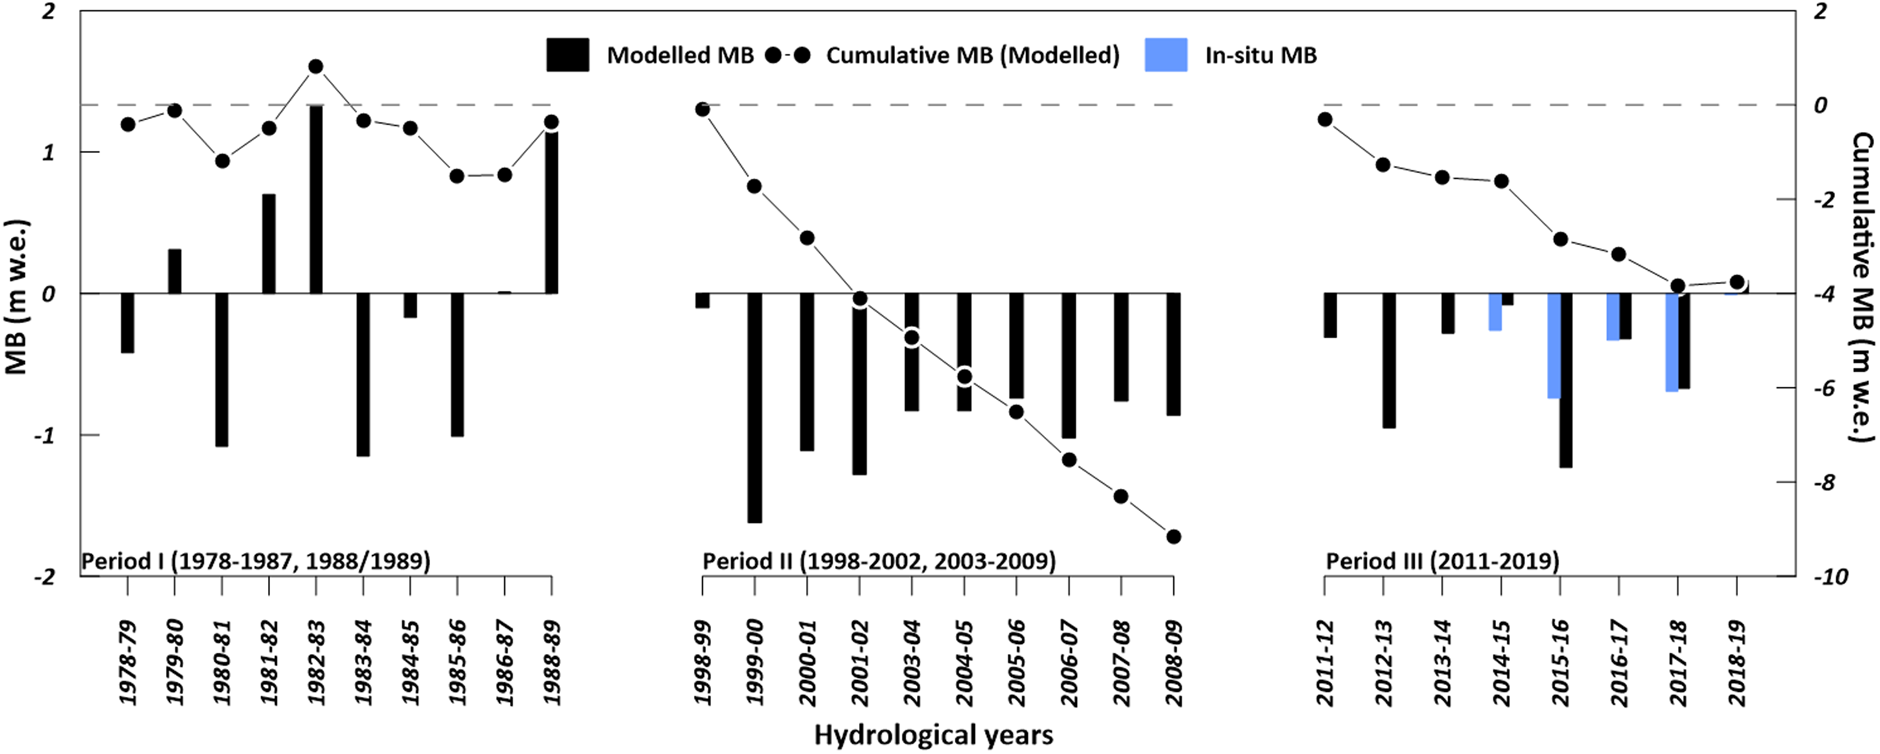
The performance of the model proved to be sufficient (see section 5.2.) for further MB simulation. Therefore, MB of Stok glacier was reconstructed for the selected periods using the available dataset (temperature, precipitation, DDFs, etc.) between 1978 and 2019. DDF computed using melt and CPDD was found to be 5.9 and 3.1 mm °C−1 d−1 for ice and snow, respectively (Table 4). Figure 8 presents the reconstructed annual and cumulative MBs along with the in-situ MBs. Over the simulated periods (Period I, II and III), the annual and cumulative MBs have shown distinct characteristics. Period I (1978–87, 1988/89) was nearly in a balanced condition and witnessed both positive and negative MBs. During positive MB years, precipitation was abundant, and summer temperature was comparatively low (Fig. 2). The hydrological year 1982/83 showed the maximum positive MB of 1.32 ± 0.35 m w.e. followed by 1988/89 and 1981/82 with 1.14 ± 0.35 and 0.7 ± 0.35 m w.e., respectively. The highest negative MB was found in 1983/84 (−1.15 m w.e.) followed by 1980/81 (−1.08 ± 0.35) and 1985/86 (−1.01 ± 0.35). The cumulative MB was found to be −0.35 m w.e. (−0.03 m w.e. a−1). However, during period II (1998–2002, 2003–09), due to comparatively higher summer temperature and extremely low precipitation (Fig 2), the glacier witnessed negative MB throughout the period. The highest negative MB was found in 1999/2000 (−1.62 ± 0.35 m w.e.) followed by 2001/02 (−1.28 ± 0.35 m w.e.) and 2000/01 (−1.11 ± 0.35 m w.e.). The cumulative MB for this period was −9.15 m w.e. (−0.91 m w.e. a−1) which shows comparatively higher mass loss over a decade. MB in period III (2011–19) was also negative (but relatively less negative than period II) throughout the time except 2018/19 where the glacier witnessed positive annual MB (0.09 ± 0.35 m w.e.) due to comparatively high precipitation and low temperature. The hydrological year 2015/16 witnessed the maximum loss (−1.23 ± 0.35 m w.e.) followed by 2012/13 (−0.95 ± 0.35 m w.e.) and 2017/18 (−0.67 ± 0.35 m w.e.). The cumulative MB for period III was found to be −3.75 m w.e. corresponding to a mean MB rate of −0.45 m w.e. a−1. Overall the combined cumulative mass loss was −13.25 m w.e. with an average mass loss of −0.47 m w.e. a−1, which is a moderate mass loss over a 28 years time (between 1978 and 2019). Student's t test has also been performed to see the relationship between the three periods. The test shows that the three periods are statistically different from one another at a 95% confidence level.
Modelled annual and cumulative MB for three studied periods between 1978 and 2019, and the in-situ MB for the year 2014 to 2019.
5.3.2. Seasonal MB
MB reconstruction of summer (May–September) and winter (October–April) for the three periods was carried out in order to understand the factors influencing MB processes in different climatic conditions (Fig. 9). The three periods had distinct MB seasonality where Period I faced similar impact from both winter and summer MBs. During Period I, cumulative winter and summer MBs were found to be 13.01 and −13.35 m w.e. (1.3 and −1.34 m w.e. a−1), respectively. The interannual variation in winter MB was comparatively higher than that in summer MB with maximum and minimum winter MB of 2.27 ± 0.35 (1988/89) and 0.45 ± 0.35 m w.e. (1985/86), respectively, and, maximum and minimum summer MB of −0.87 ± 0.35 (1982/83) and −1.68 ± 0.35 m w.e (1980/81), respectively. During Period II, summer MB was more pronounced with a cumulative MB of −13.3 m w.e. (−1.33 m w.e. a−1) which is around three times lower than the cumulative winter MB of the same period (4.16 m w.e.; 0.42 m w.e. a−1). The interannual variation of period II was higher during summer than winter, with a maximum and minimum summer MB of −0.93 ± 0.35 (1998/99) and −1.77 ± 0.35 m w.e. (1999/2000), respectively, and winter MB of 0.83 ± 0.35 (1998/99) and 0.15 ± 0.35 m w.e. (1999/2000), respectively. Period III experienced similar interannual variation as Period II with higher variation in summer MB than winter. The maximum and minimum winter MB was 1.08 ± 0.35 (2013/14) and 0.23 ± 0.35 m w.e (2017/18); whereas, the same in summer MB was −0.38 ± 0.35 (2018/19) and −1.8 ± 0.35 m w.e. (2012/13), respectively. The winter and summer cumulative MB in period III was found to be 5.66 and −9.37 m w.e. (0.7 and −1.17 m w.e. a−1), respectively.
Seasonal (summer and winter) MB of Stok glacier during the periods studied between 1978 and 2019.

It has been observed that the mean summer MB rate of the Period I (−1.34 m w.e. a−1), II (−1.33 m w.e. a−1) and III (−1.17 m w.e. a−1) were found to be similar. However, the mean winter MB rate of Period I (1.3 m w.e. a−1) was around three and two times more than period II (0.42 m w.e. a−1) and III (0.7 m w.e. a−1), respectively. This shows that precipitation is one of the major drivers of MB of Stok region.
5.3.3. Daily MB
Daily MB helps in an in-depth understanding of the impact of precipitation and temperature on MB evolution at a sub-seasonal level. Figure 10 presents MB on a daily scale for the three periods (I, II and III). Once again, the three periods has shown distinct MB characteristics over the years. Therefore, based on the MB values during winter to summer transition, daily MB was classified into three categories (i.e. High: max. MB > 2 m w.e., Medium: max. MB between 1 and 2 m w.e., and Low: max. MB < 1 m w.e.), to understand the MB extent over the years. During Period I, accumulation started in 1st quarter (October–December) of the hydrological years and continued till early July when ablation dominated accumulation. High daily MB was observed in 1982/83, 1988/89 and 1981/82 followed by medium in 1979/80, 1986/87, 1984/85 and 1978/79 and low in 1980/81, 1985/86 and 1983/84. In period II, daily MBs were all low type except 1998/99 when the glacier received sudden precipitation during early ablation period. Accumulation in period II started comparatively late (2nd quarter; January–March) and ended early (around mid-June), thus resulting in high negative MBs. Significant snowfall events in summer months (June–September) have also been observed during this period. However, daily MBs in period III were both in medium (2011–15 and 2016/17) and low type (2015/16, 2017/18 and 2018/19). Accumulation during this period started in first 4 months of the hydrological year until the end of June, thus giving comparatively lower negative MB than period II. For the hydrological year 2018/19, annual MB was found to be slightly positive despite having a low type of accumulation. It was due to comparatively low temperature (annual −8.3°C, summer −0.2°C and winter −14.1°C) and significant (~34%) summer precipitation (Fig. 4).
Daily MB evolution of Stok glacier during the periods studied between 1978 and 2019. Vertical dash lines represent the onset of summer season. Red (High), green (Medium) and blue (Low) shades represent the maximum extent of daily MB during a hydrological year.
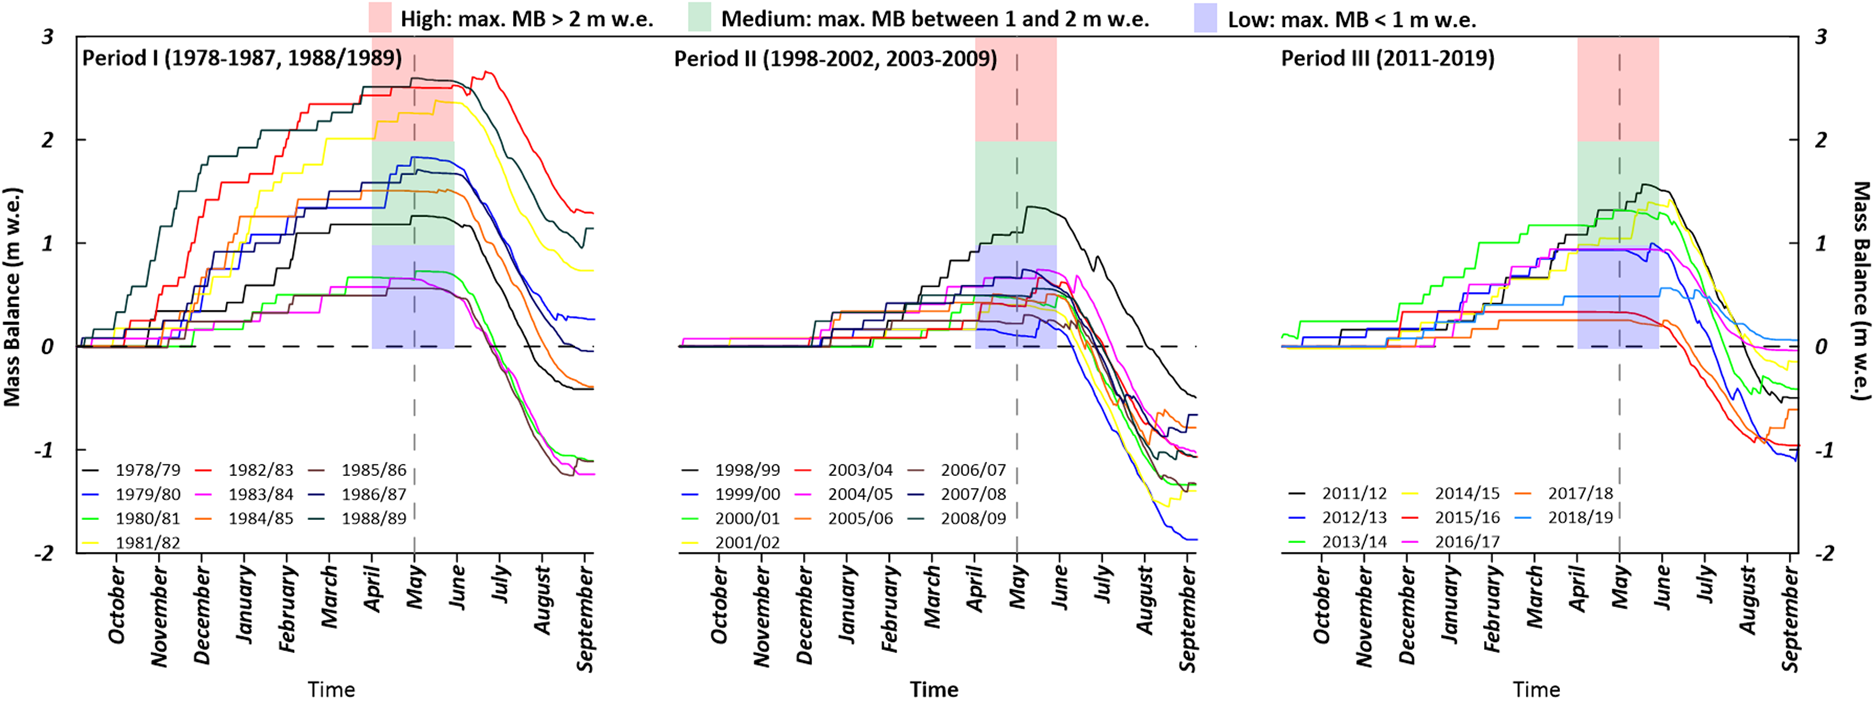
It has been observed that the time of onset and duration of winter precipitation along with summer temperature are important factors in driving annual MB. Late-onset and comparatively short duration drive the MB towards negative except 2018/19, where low temperature with summer precipitation helped the glacier retain its mass. The model also captured summer precipitation (mostly in Period II and III) which might have reduced excessive melting due to sudden albedo change. The results show that without summer precipitation, melting could have been much more intense, thus pushing MB towards more negative value.
6. Discussion
6.1. MB behaviour and potential drivers
The hydrological year 2018/19 experienced a comparatively lower temperature and higher precipitation resulting in a balanced MB condition (−0.01 ± 0.38 m w.e.). Overall in-situ MB over the entire period was negative with a cumulative MB of −2 m w.e. (mean MB of −0.39 ± 0.38 m w.e. a−1). In-situ and modelled MBs were in good agreement with one another in both altitudinal (RMSE = 0.42 m w.e. a−1) and annual (0.23 m w.e. a−1) MBs. The partial over- and under-estimation of MBs was due to summer snowfall events (which prevents excessive melting) and the use of lapse rates/precipitation gradient (extrapolated temperature and precipitation). These are expected limitations which are obvious in a region like Ladakh where the terrain is complex and data are scarce.
The periods studied between 1978 and 2019 were further analysed to understand MB behaviour in relation to summer temperature and winter precipitation. Mean MBs (summer, winter and annual), summer temperature and winter precipitation of each period along with mean summer temperature and winter precipitation of the entire 28 years between 1978 and 2019 are presented in Figure 11 and Table 6. Student's t test performed on these periods suggests that they are statistically different from one another at a 95% confidence level. Period I (1978–87, 1988/89) stayed close to a near balance condition with a mean annual MB of −0.03 m w.e. a−1. This condition was due to 13.6 mm a−1 (~55%) higher winter precipitation and 0.5°C lower summer temperature than the 28-year averages. The period also showed high interannual variability of MB with summer and winter MB of −1.33 and 1.30 m w.e. respectively. The high mass loss during summer was compensated by the high winter MB, thus giving a near balance MB condition. Stok glacier lost mass at different rates in Period II (1998–2002, 2003–09) and III (2011–19) with −0.8 and −0.44 m w.e. a−1, respectively. Period II lost mass at almost twice the rate of Period III due to ~15.7 mm a−1 (~63%) lower winter precipitation and 0.6°C higher summer temperature than the 28-year averages resulting into a comparatively high retreat. The conditions in Period III were moderate with 2.7 mm a−1 (~11%) higher winter precipitation and 0.1°C lower summer temperature than the 28-year averages, thus leading to a moderate retreat of Stok glacier. The comparison between the studied periods shows that winter precipitation and summer temperature are important drivers of MB of Stok glacier and most probably on other glaciers around Leh.
Mean MBs (black lines), mean summer temperature (red lines) and mean winter precipitation (blue lines) for the periods studied between 1978 and 2019. Red and blue dashed lines are the 28 years mean summer temperature and winter precipitation, respectively.

Mean annual, summer and winter MB of the periods studied between 1978 and 2019

The 28-year mean of annual, summer and winter MB and their corresponding summer temperature and winter precipitation at Leh station.
6.2. MB sensitivity
An assessment of glacier MB sensitivity to temperature and precipitation change is very much necessary to understand the glacier–climate interaction. MB sensitivity of Stok glacier was assessed by re-running the model with a uniform change in temperature and precipitation for 28 years (1978–87, 1988/89, 1998–2002, 2003–09 and 2011–19). The annual MB was recalculated by taking ± 1°C and ± 10% change in temperature and precipitation throughout the hydrological year, respectively. The change in temperature and precipitation was first applied to Leh Station data before extrapolating it to the required elevation bands. It should be noted that the higher RMSE (3.2°C) found between newly installed automatic weather station's temperature and extrapolated temperature was most probably due to the use of lapse rate (Thayyen and Dimri, Reference Thayyen and Dimri2014) estimated at a south-facing catchment of Leh and is therefore warmer than Stok (north facing) and Lato (east-facing) catchments. The sensitivity was calculated using Eqns 4 and 5 following Azam and others (Reference Azam2014) and Zhang and others (Reference Zhang, Li, Zhou, Zhu and Wang2018)


The calculated annual MB sensitivity of Stok glacier to ±1°C temperature change was −0.32 m w.e. a−1 °C−1 which is lower than −0.52 m w.e. a−1 °C−1 at Chhota Shigri glacier, western Himalaya (Azam and others, Reference Azam2014), −0.52 m w.e. a−1 °C−1 at Haxilegen glacier No. 51, eastern Tien Shan (Zhang and others, Reference Zhang, Li, Zhou, Zhu and Wang2018) and −0.47 m w.e. a−1 °C−1 at Zhadang glacier, Tibet (Mölg and others, Reference Mölg, Maussion, Yang and Scherer2012). The same test was also conducted for precipitation, and MB sensitivity to a ±10% change in precipitation was 0.12 m w.e. a−1, which is also lower than 0.16 m w.e. a−1 (Azam and others, Reference Azam2014) and 0.14 m w.e. a−1 (Mölg and others, Reference Mölg, Maussion, Yang and Scherer2012) and higher than 0.08 m w.e. a−1 (Zhang and others, Reference Zhang, Li, Zhou, Zhu and Wang2018). To achieve the amount of precipitation that can compensate the mass loss due to 1°C rise in temperature, the model was once again re-run several times keeping all the parameters same except precipitation until the precipitation amount that can offset the mass loss was obtained. It was found that ~27% increase in precipitation is required to compensate for the mass loss due to 1°C rise in temperature. Our result is slightly lower than the reported percentage range (30–40%), required to offset the mass loss due to 1°C rise in temperature, as reported by Braithwaite (Reference Braithwaite2002) and Braithwaite and Raper (Reference Braithwaite and Raper2007).
To understand the sensitivity of seasonal MB, the test was performed separately on winter and summer MBs of Stok glacier. The calculated sensitivity of winter MB to 1°C rise in temperature was found to be negligible in terms of mass loss (<−0.01 m w.e. a−1 °C−1). However, the MB sensitivity for a 10% change in precipitation was found to be 0.08 m w.e. a−1 for the winter period. The sensitivity of summer MB was found to be −0.31 m w.e. a−1 °C−1 for 1°C rise in temperature and 0.03 m w.e. a−1 for 10% change in precipitation. The results show that the MB of Stok glacier is more sensitive to summer temperature and winter precipitation. To offset the mass loss due to 1°C rise in winter temperature, <1% of the increase in precipitation is required, but during summer, around twice the amount of total annual precipitation is needed to compensate the mass loss due to 1°C rise in summer temperature.
6.3. MB comparison in the western Himalaya
Bolch (Reference Bolch2019) reported an average glacier mass loss of −0.24 m (before 2000) and −0.50 m w.e. a−1 (after 2000) in the western Himalaya based on different studies (geodetic and glaciological), respectively. In comparison, average glacier mass loss from the present study was comparatively low before the year 2000 (−0.11 m w.e. a−1) and high (−0.66 m w.e. a−1) after that. This shows that the glacier was nearly in a balanced condition before 2000 and lost significant mass after 2000. The results are in good agreement with the MB rate of adjacent region of Lahaul and Spiti where similar conditions were reported by Vincent and others (Reference Vincent2013) and Azam and others (Reference Azam2014). The mean vertical MB gradient over the entire study period (2014–19) was found to be 0.61 m w.e. (100−1 m), which is similar to the gradients observed in Chhota Shigri Glacier (western Himalaya), glaciers of the Alps and mid-latitude glaciers (Rabatel and others, Reference Rabatel, Dedieu and Vincent2005; Wagnon and others, Reference Wagnon2007). Interestingly, before 2000, MB of Stok glacier fits well with the Karakoram region (−0.10 m w.e. a−1) as reported by Bolch (Reference Bolch2019). However, a hydrological budget-based MB of Siachen glacier for 5 hydrological years (1986–91) revealed a different scenario with a rate of −0.51 m w.e. a−1 (Bhutiyani, Reference Bhutiyani1999) which was later corrected to −0.23 m w.e. a−1 by Zaman and Liu (Reference Zaman and Liu2015).
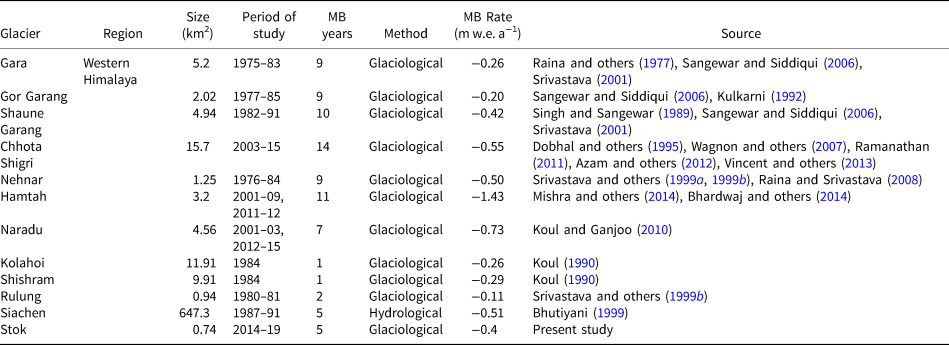
These 28-year (reconstructed) and 5-year (in-situ) are the only MB series in Ladakh; therefore, the comparison was carried out with the glaciers of western Himalayan region having a MB of atleast five hydrological years. Figure 12 and Table 7 presents the available MB information from the western Himalayan region during the periods studied between 1978 and 2019. Period I (1978–87, 1988/89) has the maximum number (nine glaciers) of studied glaciers. Out of which, Shaune Garang glacier has the longest (eight hydrological years) in-situ MB series followed by Gor Garang (7), Nehnar (6) and Gara glacier (5). It was found that the annual modelled MB of Stok glacier has a statistically significant relationship with the MB of Gor Garang, Shaune Garang and Nehnar glacier, with correlation coefficients of 0.78, 0.70 and 0.85, respectively, at 0.05 significance level. In Period II (1998–2002, 2003–09), the number of studied glaciers was quite less in western Himalaya. Therefore, the comparison was made only with Chhota Shigri and Hamtah glacier. The results showed that there was no significant relationship between the MBs. However, in Period III (2011–19) a significant relationship is observed between the modelled MB of Stok glacier and in-situ MB of Chhota Shigri glacier with a correlation coefficient of 0.89 at 0.01 significance level, as well as between modelled and in-situ MB of Stok glacier with a correlation coefficient of 0.96 at 0.05 significant level. A comparison of modelled annual MB of Stok glacier with the modelled annual MB of Chhota Shigri glacier from two different studies (Azam and others, Reference Azam2014; Engelhardt and others, Reference Engelhardt2017) was also carried out, but no significant relationship was observed between the MBs.
Comparison of the in-situ and modelled MB of Stok glacier with other glaciers of the western Himalayan region between 1978 and 2019.

Details of the studied glaciers of the western Himalayan region through in-situ observations
7. Conclusion
First-ever long-term in-situ and modelled MB of Stok glacier from Ladakh region is presented in this study. In-situ MB was computed through the direct glaciological method for the period from 2014 to 2019. Historical MB was reconstructed applying a temperature index model coupled with an accumulation model between 1978 and 2019 using available temperature and precipitation records at Leh station.
In-situ MB of Stok glacier was negative with −0.39 ± 0.38 m w.e. a−1 throughout the study period except 2018/19, when it experienced a slightly balanced condition. The mean MB over the 28-year modelling period was −0.41 ± 0.35 m w.e. a−1 with a nearly balanced condition during 1978–89 followed by a comparatively higher and moderate mass loss in 1998–2009 and 2011–19, respectively. High interannual variation in winter MB was found to be the major reason for mass loss. The mean winter MB during 1978–89 was observed to be around three and two times more than 1998–2009 and 2011–19 winter MBs, respectively. Whereas, the mean summer MB was similar throughout the three periods. In-situ and modelled MBs were in good agreement with RMSE of 0.23 m w.e. a−1 (R 2 = 0.92, P < 0.05).
MB sensitivity of Stok glacier was −0.31 m w.e. a−1 °C−1 for 1°C rise in temperature and 0.12 m w.e. a−1 for a 10% increase in precipitation. It has been estimated that ~27% increase in annual precipitation is required to compensate for the mass loss due to 1°C rise in temperature. However, twice the amount of precipitation is required during summer to compensate for the melt due to a 1°C rise in summer temperature. Thus, summer temperature and winter precipitation were found to be the major drivers of MB variability on Stok glacier, Ladakh region.
Therefore, continuous MB measurements are important to project future scenarios of glacier mass loss. Our study provides baseline data on MB to understand the dynamics of Stok glacier. This new set of information, along with high-resolution climate and remote-sensing data, will help to get a deep insight into glacier dynamics of Ladakh region.
Acknowledgement
We are grateful to Jawaharlal Nehru University, UPoE II grant and UGC, Govt. of India for the lab facilities and financial support provided throughout the study period. We thank National Centre for Polar and Ocean Research (NCPOR) Goa for partial support to the study. We are also thankful to Indian meteorological department for providing the temperature and precipitation data. We also extend our gratitude to USGS and Planet.com for the satellite images. We thank the editor, scientific editor and two anonymous reviewers for their insightful comments which helped to greatly improve this manuscript. We are grateful to those who helped us directly or indirectly throughout the study.
Author contributions
MS and ALR designed the study and wrote the paper. MS performed all the calculations. MS and TA did the field measurements. MS, AM and NP developed the figures. SL provided the temperature and precipitation data.


 Open access