


INTRODUCTION
The Commission for the Conservation of Antarctic Marine Living Resources (CCAMLR) implements the Convention on the Conservation of Antarctic Marine Living Resources, (UNTS: I-22031), which entered into force in 1982. The Convention provides a single governance framework for managing fisheries in 36 × 106 km2 of the Southern Ocean, which is 10% of the Earth's total marine area (Fig. 1). It states three ‘principles of conservation’ (Table 1), which require managers to maintain the productivity of harvested populations, to maintain ecological relationships, and to prevent irreversible change. These requirements are similar to the goals of ecosystem based management (EBM), which are maintaining ecosystem productivity, health and resilience (McLeod & Leslie Reference McLeod, Leslie, McLeod and Leslie2009a).
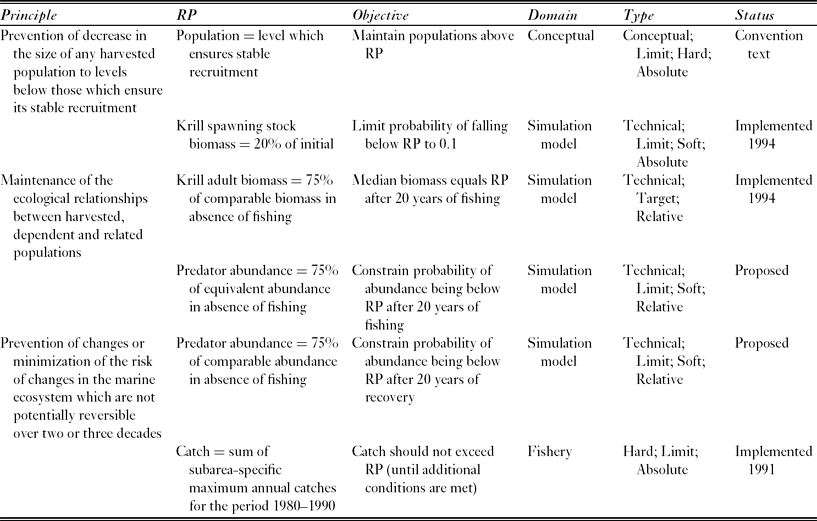
The Convention's principles of conservation and the reference points (RPs) developed to address these for the Antarctic krill fishery in the Scotia Sea and southern Drake Passage. CCAMLR conservation measure 51–01 (CCAMLR 2011) specifies the policy implications of implemented reference points. The last row describes the reference point used to set the current (interim) catch limit, which is lower than the proposed regional catch limit and aims to manage the risk of localized impacts on krill predators.

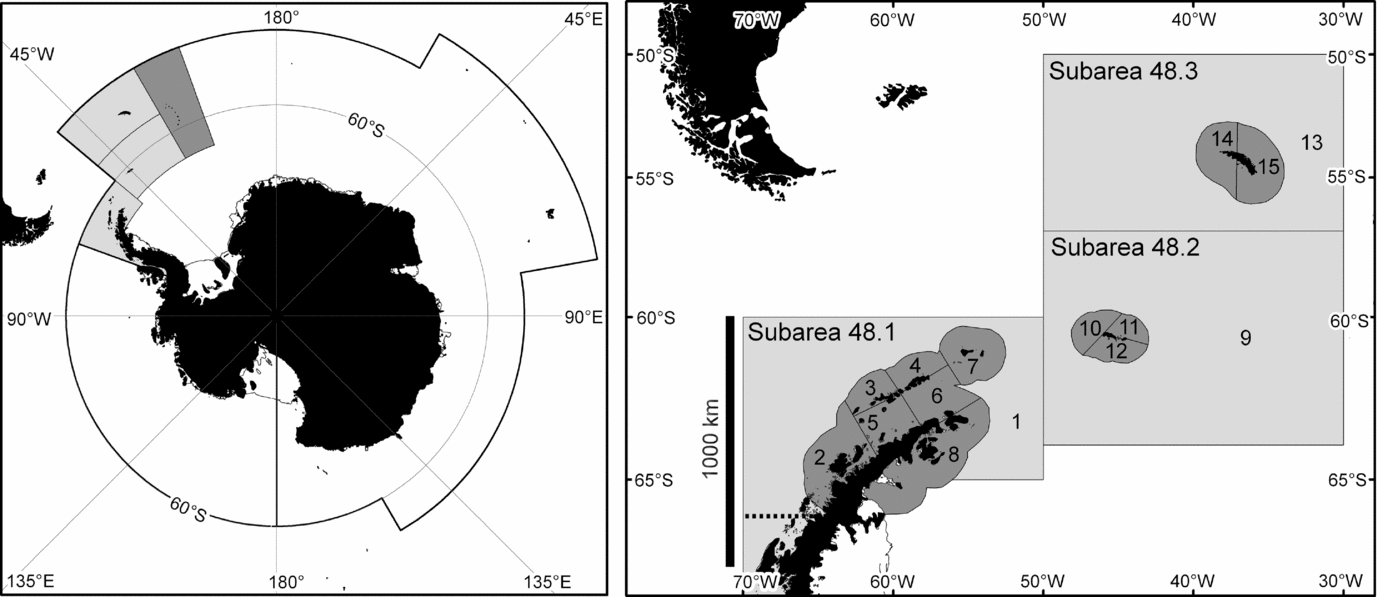
The marine area managed by CCAMLR (left) and the area represented in the simulation model (right). This area consists of three FAO statistical subareas. The regional catch limit also applies to sub-area 48.4 (dark grey in the left panel) but only 61 t of krill have ever been caught there (Hill Reference Hill, De Meester, Watson and Zibadi2013). The modelled area is divided into coastal (dark) and oceanic (light) small-scale management units.
The Convention's principles of conservation and McLeod & Leslie's (Reference McLeod, Leslie, McLeod and Leslie2009a) definition of EBM both seem to be strategically ambiguous. Strategically ambiguous statements intentionally lack specificity in order to achieve an organizational objective (Eisenberg Reference Eisenberg1984). In these examples, the objective was consensus. Eisenberg (Reference Eisenberg1984) argued that strategic ambiguity can be more helpful than clear communication during periods of uncertainty or rapid change.
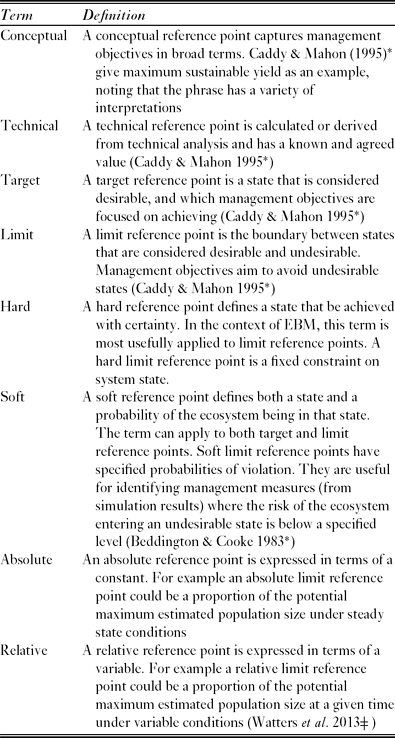
In order to progress from strategically ambiguous principles to operational management objectives, it is useful to identify reference points (de la Mare Reference de la Mare2005). These are states of the ecosystem, or of specific ecosystem components, that are desirable, or at least useful, for achieving management objectives (Caddy & Mahon Reference Caddy and Mahon1995). There are various categories of reference point (Table 2).
A partial glossary of terms used to describe reference points. *Denotes a reference from which the definition was adapted,  denotes a reference which provides an example of the relevant type of reference point.
Once objectives are stated in terms of reference points it becomes feasible to evaluate the likely ability of proposed management measures to meet these objectives. Evaluation approaches often use models to simulate the effect of management measures on the future state of the ecosystem (Rademeyer et al. Reference Rademeyer, Plagányi and Butterworth2007). Such simulations are inevitably uncertain, and the models should therefore provide probabilistic estimates of future state (Hill et al. Reference Hill, Watters, Punt, McAllister, LeQuere and Turner2007a). Soft reference points specify both a desirable state and a probability of the ecosystem being in that state. The combination of probabilistic state estimates and soft reference points is useful for identifying management measures in which the risk of an undesirable state is below a specified level (Beddington & Cooke Reference Beddington and Cooke1983).
CCAMLR uses soft reference points to identify management measures for the fishery harvesting the crustacean Antarctic krill, Euphausia superba, in the Scotia Sea and southern Drake Passage. This fishery accounted for 91% of the total Southern Ocean catch in the 2010–2011 fishing season (CCAMLR 2012). The model used to project the future state of the krill stock performs multiple simulations with random variation in the parameters controlling uncertain processes (Hill et al. Reference Hill, Murphy, Reid, Trathan and Constable2006). CCAMLR uses these simulation results to identify a regional catch limit that has the required probability of satisfying two objectives for the state of the stock (Table 1; Constable et al. Reference Constable, de la Mare, Agnew, Everson and Miller2000).
The regional catch limit (currently 5.61 × 10⁶ t yr−1) might not be sufficient to prevent localized depletion of krill and consequent impacts on the many species that feed on it (Miller & Agnew Reference Miller, Agnew and Everson2000; Hill et al. Reference Hill, Keeble, Atkinson and Murphy2012). CCAMLR therefore imposed a much lower interim catch limit (0.62 × 10⁶ t yr−1 and known within CCAMLR as the ‘trigger level’) until the problem is solved (Miller & Agnew Reference Miller, Agnew and Everson2000). The interim catch limit is approximately equal to the sum of the maximum prior annual catches in each of the FAO (Food and Agricultural Organization of the United Nations) statistical subareas in which the fishery operates (Hill Reference Hill, De Meester, Watson and Zibadi2013).
A number of modelling exercises have explored fishery impacts on predator populations. Butterworth and Thomson (Reference Butterworth and Thomson1995) and Thomson et al. (Reference Thomson, Butterworth, Boyd and Croxall2000) sought to refine the soft reference points for krill to better account for predator requirements. Others evaluated catch allocation options, which are spatial subdivisions of the regional catch limit intended to minimize localized impacts on krill predators (WG-EMM [Working Group on Ecosystem Monitoring and Management] 2008; Plagányi & Butterworth Reference Plagányi and Butterworth2012; Watters et al. Reference Watters, Hill, Hinke, Matthews and Reid2013). The evaluation involved many millions of simulations using spatially resolved ecosystem dynamics models to project the future state of krill, its predators and the fishery. These models are distinct from those used to set the regional catch limit.
CCAMLR's Working Group on Ecosystem Monitoring and Management (WG-EMM) summarized the evaluation results in terms of the risk, for each catch allocation option, of breaching soft reference points for krill and its predators (WG-EMM 2008). Watters et al. (Reference Watters, Hill, Hinke, Matthews and Reid2013) used an illustrative relative depletion reference point of 0.75 (i.e. 75% of the abundance of the same group in comparable simulations without fishing) to assess the risk to 34 predator groups, which were aggregated by taxon and location.
The reliance on an illustrative reference point raises two important questions. Firstly, would the results, and therefore potential management decisions, have been different if the modellers had chosen a different reference point or method for aggregating krill predators? Secondly, do CCAMLR's principles of conservation provide any more specific guidance on appropriate reference points? The requirement to prevent changes that are not potentially reversible (hereafter the reversibility principle) implies objectives that could be stated in terms of recovery reference points. These reference points specify the state of the system two to three decades after the cessation of fishing (Watters et al. Reference Watters, Hill, Hinke, Matthews and Reid2013). However, operational objectives should refer to measurable states such as current abundance (depletion) rather than future abundance (recovery). In this study, I reanalyse the simulation data of Watters et al. (Reference Watters, Hill, Hinke, Matthews and Reid2013) to assess the sensitivity of their results to the choice of reference point and aggregation method. I also assess the relationship between depletion and recovery reference points.
The assessment of sensitivity is relevant to any EBM organizations that might use a risk assessment approach. Also, EBM effectively aims to control the future state of the ecosystems (de la Mare Reference de la Mare2005), but it is only possible to assess the current and past state. It is therefore useful to determine whether objectives for the future state provide any general guidance about appropriate reference points for the current state. There is a general need to progress from strategically ambiguous definitions of EBM to operational objectives based on technical reference points. The example of the krill fishery highlights some of the aids and obstacles to progress.
METHODS
Ecosystem dynamics model
This study uses results from an ecosystem dynamics model (Watters et al. Reference Watters, Hill, Hinke, Matthews and Reid2013) to examine the sensitivity of such results to the choice of depletion reference point and aggregation of modelled ecosystem components. It also uses the results to explore the relationship between recovery and depletion reference points. The model represents interactions between Antarctic krill, four competing krill predator taxa, and the krill fishery in the Scotia Sea and Southern Drake Passage region. This region (FAO statistical subareas 48.1, 48.2 and 48.3) is where 28% of the Southern Ocean krill stock is located (Atkinson et al. Reference Atkinson, Siegel, Pakhomov, Jessopp and Loeb2009) and where 83% of the krill catch to date has been taken (Hill Reference Hill, De Meester, Watson and Zibadi2013).
The model was used to advise CCAMLR on the relative risks associated with a number of candidate catch allocation options proposed by Hewitt et al. (Reference Hewitt, Watters, Trathan, Croxall, Goebel, Ramm, Reid, Trivelpiece and Watkins2004). These catch allocation options subdivide the regional catch limit for krill amongst 15 small-scale management units (SSMUs). Twelve of these SSMUs, with an average area of 29 000 km2, encompass the shelf areas around various island groups and the Antarctic Peninsula; and three, with an average area of 717 000 km2, encompass the remaining oceanic parts of the region.
The model is spatially resolved to represent the SSMUs (Fig. 1). It includes 34 explicit krill predator groups (hereafter referred to as subpopulations). Each predator subpopulation is associated with one SSMU, but can be parameterized to forage in others. The predator subpopulations are modelled using average parameters for the component species in one of four taxa: fish, penguins, seals and whales (Hill et al. Reference Hill, Watters, Punt, McAllister, LeQuere and Turner2007b). Plagányi and Butterworth (Reference Plagányi and Butterworth2012) discussed the caveats associated with this approach. Predator subpopulations in the implemented model were subject to natural mortality, but not to other sources of mortality, such as harvesting. The krill stock is modelled as separate SSMU-specific subpopulations, but the model can explicitly represent the exchange of individuals between each subpopulation. Fishery demand and catch is necessarily resolved to SSMU.
Two of the model's key characteristics, which were developed to meet the requirements of CCAMLR's scientific working groups (WG-SAM [Working Group on Statistics, Assessments and Modelling] 2007), are its ability to replicate a plausible representation of recent ecological dynamics of the modelled region, and the way it deals with uncertainty. The model was implemented with four distinct scenarios to bracket two key uncertainties about ecosystem operation. This bracketing was achieved by modelling two contrasting hypotheses for each uncertainty, and the final set of scenarios included the four possible combinations of these hypotheses. The first uncertainty concerned the exchange of krill between SSMUs. In the contrasting hypotheses, exchange was either zero, or the predicted passive particle transport rate from an ocean circulation model (Hill et al. Reference Hill, Watters, Punt, McAllister, LeQuere and Turner2007b). The second uncertainty concerned the shape of the response of predator reproductive output to the availability of krill. The response was either linear or asymptotic. The asymptotic response implies that reproductive output is relatively insensitive to fluctuations in krill availability except at low levels of availability. The model was also designed to perform multiple simulations, each of which incorporates stochastic interannual variability.
Each of the four scenarios was initialized with a set of parameters that produced stable dynamics for the time step nominally representing 1970. The plausible representation of recent dynamics included reductions in krill and penguin abundance and increases in whale and seal abundance between 1970 and 2006. The reduction in krill was represented in the input parameters. Recruitment parameters for subpopulations of penguins, whales and seals were adjusted, separately for each scenario, so that the emergent dynamics matched the plausible recent dynamics, a process known as conditioning (Rademeyer et al. Reference Rademeyer, Plagányi and Butterworth2007). As a result of conditioning, each scenario had its own unique parameters controlling predator recruitment. These unique parameters, in combination with those bracketing uncertainty, gave rise to distinct differences between scenarios in the dynamics from 2006 onwards.
I analysed the results of multiple stochastic simulations which represented the nominal period 2007–2046, consisting of 20 years of krill fishing followed by 20 years without fishing. I specifically analysed results for predator abundance at the end of the simulated fishing period (2026) and at the end of the recovery period (2046).
Krill fishing was simulated with a range of management measures, each consisting of an allowable catch and a catch allocation option. The allowable catch (and therefore fishery demand) was a fraction (from 0 to 1.2) of the regional catch limit and the three catch allocation options were: (1) ‘catch’, where the subdivision represented the proportion of catch taken in each SSMU, based on data for fishing seasons between 2002/03 and 2006/07 (provided by the CCAMLR Secretariat); (2) ‘demand’, where the subdivision represented proportion, by SSMU, of the total krill consumption requirements of predators, calculated within the model; and (3) ‘stock’ where the subdivision represented the proportion, by SSMU, of the total biomass of krill, calculated within the model. A set of 1001 stochastic simulations was run for each combination of scenario and management measure. The same sequence of random numbers was used to generate each set of 1001 simulations.
Reference point, aggregation method and apparent risk
The model results can be used to estimate the risk of depletion for each modelled predator subpopulation. This risk is the probability of the subpopulation falling below a reference point, which is calculated across the 4004 relevant stochastic simulations (1001 per scenario) for each management measure. I calculated this risk for various depletion reference points and approaches to aggregating modelled subpopulations. I divided the abundance of each modelled subpopulation in the final year of fishing by the abundance of the same subpopulation in no-fishing simulations generated using the same scenario. I then assessed whether this quotient was below one of ten equally spaced depletion reference points (fractions from 0.1 to 1.0 of the comparable subpopulation size from no-fishing simulations), plus 0.25 and 0.75. I calculated the probability of depletion for each management measure (i.e. the proportion of relevant simulations where the quotient was below the reference point). To investigate the consequences of different aggregation methods, I calculated the average of the subpopulation-specific probabilities (retaining the specification of management measure) across: (1) all predator taxa in each SSMU; (2) each taxon in each subarea; (3) all predator taxa in each subarea. This approach equally weights each component subpopulation in calculating the average probability.
Implications of CCAMLR's reversibility principle for depletion reference point
CCAMLR's reversibility principle (Table 1) includes some quantitative specification of policy objectives. Specifically, it requires changes to be ‘potentially reversible over two or three decades’. This principle could, in theory, be translated into an operational objective for each relevant predator subpopulation. Each objective would include a recovery reference point, stated as a proportion of the expected abundance in the absence of fishing. It would also include a probability that the subpopulation will not return to that level within three decades or less after the cessation of fishing.
I used the simulation results to identify corresponding pairs of depletion and recovery reference points. In a corresponding pair, the risk of depletion equals the risk of failing to recover; i.e. the probability of the relevant subpopulation being below the depletion reference point in 2026 is equal to that of the subpopulation being below the recovery reference point in 2046. The depletion reference point also had to be greater than 0.1, to exclude extinction or near-extinction. I considered 10 equally-spaced recovery reference points (recovery to proportions from 0.1 to 1.0 of the comparable abundance from no-fishing simulations).
I analysed simulations with allowable catch equal to the regional catch limit. I searched for corresponding pairs of depletion and recovery reference points for each combination of modelled predator subpopulation and catch allocation option. I assessed the risk of failing to recover for each recovery reference point. I divided this risk by the risk of depletion for each depletion reference point. If this vector of quotients had a minimum ≤ 1 and a maximum ≥ 1, it indicated the existence of a corresponding pair.
RESULTS
Reference point, aggregation method, and apparent risk
The apparent probability of depletion for most of the modelled predator subpopulations increased with the chosen depletion reference point (Fig. 2). Nonetheless, it remained clear that the risk to predator subpopulations increases with allowable catch. Furthermore, there is a clear hierarchy of risk amongst the catch allocation options, where ‘demand’ poses least risk to modelled predator subpopulations and ‘catch’ poses most risk.
Relationship between allowable catch (as a proportion of the CCAMLR regional catch limit) and the probability of taxon-and-SSMU-specific subpopulations of krill predators falling below depletion reference points of (a) 0.25 (b) 0.5 and (c) 0.75. The results are from simulations with three different catch allocation options known as ‘catch’, ‘demand’ and ‘stock’. These allocate allowable catch to SSMUs in proportion to historical catch, predator demand for krill and krill biomass, respectively. Vertical dotted lines indicate allowable catches equivalent to the CCAMLR regional catch limit (1.0) and the lower interim catch limit (0.11). Note that lines are not visible when risk is zero (e.g. for all subpopulations in the central panel of (a)).
This distinction between catch allocation options was less clear when depletion reference points were ≥ 0.90. In these cases, the majority of predator subpopulations were at risk of falling below the reference point if the full regional catch limit was taken using any catch allocation option (Fig. 3). Also, many subpopulations had zero probability of falling below reference points < 0.50. Consequently, with low reference points, the distinctions between catch allocation options were only apparent for a few of the predator subpopulations.
Relationship between depletion reference point (as a proportion of expected abundance in the absence of fishing) and the probability of taxon-and-SSMU-specific subpopulations of krill predators falling below the reference point. The results are from simulations with allowable catch equivalent to the CCAMLR regional catch limit and distributed according to three different catch allocation options known as ‘catch’, ‘demand’ and ‘stock’. The vertical dotted line indicates the 0.75 depletion reference point used to present advice to CCAMLR (WG-EMM 2008; Plagányi & Butterworth Reference Plagányi and Butterworth2012; Watters et al. Reference Watters, Hill, Hinke, Matthews and Reid2013).
With an illustrative depletion reference point of 0.75, the distinctions between catch allocation options were clearest when modelled subpopulations were relatively disaggregated, but they remained reasonably distinct with increased aggregation of subpopulations (Figs 2 and 4). Increasing aggregation reduced the maximum apparent risk as minority vulnerable subpopulations were subsumed into a more general statistic. The different aggregation methods also revealed some of the detail of the distinction between catch allocation options. For example, while the maximum risk was greater for ‘stock’ than ‘demand’, the latter had a higher specific risk to seals in subarea 48.3 and consequently a higher aggregate risk to subarea 48.3 (Fig. 4).
Relationship between allowable catch (as a proportion of the CCAMLR regional catch limit) and the probability of groups of krill predators falling below a depletion reference point of 0.75, when predator groups are aggregated (a) by taxon within subareas, (b) by taxon across all subareas, and (c) across taxa within subareas. The results are from simulations with allowable catch distributed according to three different catch allocation options known as ‘catch’, ‘demand’ and ‘stock’. Vertical dotted lines indicate allowable catches equivalent to the CCAMLR regional catch limit (1.0) and the lower interim catch limit (0.11).
Both the reference point and aggregation level used to summarize simulation results influence the apparent risk that the figures convey to decision makers. In this case study, the ranking of catch allocation options in terms of overall depletion risk was consistent across most reference points and aggregation levels. However, high levels of aggregation in combination with high reference points masked some of these differences (Fig. 5).
Relationship between depletion reference point (as a proportion of expected abundance in the absence of fishing) and the probability of aggregations of krill predators falling below the reference point. Predators were aggregated (a) by taxon within subareas, (b) by taxon across all subareas, and (c) across taxa within subareas. The results are from simulations with allowable catch equivalent to the CCAMLR regional catch limit and distributed according to three different catch allocation option known as ‘catch’, ‘demand’ and ‘stock’. The vertical dotted line indicates the 0.75 depletion reference point used to present advice to CCAMLR.
Implications of the reversibility objective for depletion reference point
The relationship between the probabilities of depletion and failing to recover was complex and varied between modelled predator taxa and between reference points (Fig. 6). When the same reference point was used for both depletion and recovery, the gradient of the relationship was > 1 (i.e. the risk of failing to recover increased faster than depletion risk) for some subpopulations, notably penguins, and near zero (i.e. the risk of failing to recover was low and largely independent of depletion risk) for others, notably fish.
The probability of taxon-and-SSMU-specific subpopulations of krill predators falling below selected depletion reference points, versus the probability of those subpopulations failing to recover to above equivalent recovery reference points. The banner of each panel indicates the relevant depletion and recovery reference point as a fraction of the abundance in comparable simulations without fishing. The probability of depletion was assessed in the final year of simulated fishing. The probability of failing to recover was assessed in the 20th year after the cessation of simulated fishing. The results are for simulations with the catch allocation option known as ‘catch’. These simulations included a variety of allowable catches between 0 and 1.2 times the CCAMLR regional catch limit. The diagonal dotted line indicates a gradient of 1.
The dynamics of each modelled subpopulation result from the combination of input parameters, parameters that were adjusted during conditioning, interactions with other subpopulations, and disturbances to the modelled krill stock. These disturbances were the reduction between 1970 and 2006, and the 20 years of fishing from 2007 to 2026. All of these interacting effects influence the wide range of relationships between depletion and recovery. The broad distinction between penguins and fish mentioned above can be explained in terms of their parameters. Fish were modelled with high population growth rates and short lag times between breeding and recruitment compared to other predators. Consequently, they were generally able to recover faster than their competitors when fishing stopped. Conversely, the penguin recruitment parameters estimated during conditioning are associated with depensation (i.e. reduced reproductive output per individual at low population sizes; Lierman & Hilborn Reference Lierman and Hilborn2001), which impedes recovery.
For most modelled subpopulations, most recovery reference points had a depletion reference point with an equal level of risk with simulated fishing at the full catch limit (Table 3). For example, for fish in SSMU 4, with fishing distributed according to the ‘catch’ catch allocation option, the probability of failing to recover to the 0.9 reference point was 0.009. This was equal to the probability of depletion below the 0.7 reference point. However, the existence of such corresponding pairs varied between catch allocation options. The ‘demand’ option had a corresponding depletion reference point for each considered recovery reference point and each modelled subpopulation; the ‘stock’ option had corresponding depletion reference points for each modelled subpopulation when the recovery reference point was 0.9 or 1.0; and the ‘catch’ option had corresponding reference points for a maximum of 32 of the 34 modelled subpopulations.
Number of corresponding depletion reference points (where depletion risk equals risk of failing to recover) for each recovery reference point within each catch allocation option. Results include the subsets with risk ≤ 0.5, and with risk = 0 . The maximum potential number of corresponding pairs per cell was 34 (one for each simulated predator subpopulation). The final row shows the proportion of comparisons for which a corresponding pair was identified.
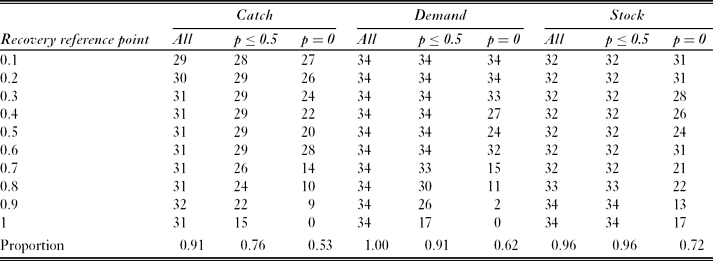
Restricting the definition of corresponding pairs to exclude high risks inevitably reduced the number of pairs identified. For example, when all probabilities (of failing to recover) ≤ 0.5 were excluded, only the ‘demand’ option with recovery reference points ≤ 0.6 had corresponding pairs for each modelled subpopulation. The majority of identified corresponding pairs had zero probability of depletion or failing to recover. These zero-risk pairs were generally associated with low recovery reference points (≤ 0.5), which accounted for 66%, 72% and 67% of identified corresponding pairs in the ‘catch’, ‘demand’ and ‘stock’ options, respectively.
DISCUSSION
Reference points can be used to define tangible objectives for measurable aspects of ecosystem state, which might be based on goals for the future state. However, this analysis demonstrates a lack of generality in the relationship between current and future states, represented respectively by depletion and recovery reference points. Reference points can also be used with simulation results to identify management measures where the risk of an undesirable state is below a specified level. The present analysis demonstrates that the implied risk is sensitive to the choice of reference point and the aggregation of modelled ecosystem components. Nonetheless, the qualitative distinctions between different spatial distributions of a fixed harvest level seem largely insensitive to these factors.
The above conclusions are based on simulations of krill-predator-fishery interactions, but they are broadly applicable to other EBM problems. Firstly, one of the key goals of EBM concerns ecosystem resilience (i.e. the ability to maintain structure, function and identity when disturbed; Leslie & Kinzig, Reference Leslie, Kinzig, McLeod and Leslie2009). However, there is no general reference point for current ecosystem state that ensures resilience of all components. This conclusion seems reasonably robust since real ecosystems are more complex than the analysed model (Plagányi & Butterworth Reference Plagányi and Butterworth2012). It implies a need for resilience objectives that acknowledge the differences between ecosystem components, and the practical constraints on assessing the characteristics of each relevant component. Secondly, the specific objectives of EBM are often uncertain (Link et al. Reference Link, Ihde, Harvey, Gaichas, Field, Brodziak, Townsend and Peterman2012). Consequently scientists may need to evaluate candidate management measures despite ambiguously specified objectives. Scientists, decision makers and other stakeholders need to be aware that the choice of reference point or aggregation method can influence the apparent risk. This, in turn, could bias the choice of management measure.
In the comparison of catch allocation options for the krill fishery, the apparent risk converged towards zero at low reference points and towards one at high reference points. Between these extremes the ‘catch’ option consistently had the highest risk and the ‘demand’ option had the lowest. This suggests that the 0.75 reference point which WG-EMM used to present its advice (WG-EMM 2008; Fig 3) was appropriate. However, an assessment of the sensitivity of apparent risk to the choice of reference point might be a useful accompaniment to such advice.
The comparison was sensitive to interactions between the aggregation method and the chosen reference point. Ideally EBM objectives should be stated in terms of clearly identified ecosystem components, selected for their importance. This importance could be due to the component's role as an indicator of wider ecosystem state, its direct importance to ecosystem services, or its indirect importance via ecosystem structure and functioning (Zacharias & Roff Reference Zacharias and Roff2001; Link Reference Link2010). For example, macaroni penguins in South Georgia seem to be sensitive indicators of krill availability (Waluda et al. Reference Waluda, Hill, Peat and Trathan2012) while mackerel icefish are both a harvested species and an important alternative prey that buffers some penguins and seals through krill shortages (Hill et al. Reference Hill, Reid and North2005). It is appropriate to present unaggregated results for the most important components (deYoung et al. Reference deYoung, Heath, Werner, Chai, Megrey and Monfray2004; Hill et al. Reference Hill, Murphy, Reid, Trathan and Constable2006). Nonetheless, Hill et al. (Reference Hill, Reid, Thorpe, Hinke and Watters2007a) advise using no more than seven separate pieces of information in decision making. Aggregation might therefore be essential, as might weighting components by importance to ensure that they appropriately influence the average.
The aggregation methods explored here were applied to simulation results and so did not affect model performance. However, there is a trade-off between the complexity and performance of ecosystem dynamics models (Fulton et al. Reference Fulton, Smith and Johnson2003). This limits the number of ecosystem components that it is appropriate to model. Early identification of the ecosystem components of importance to management will be a useful guide for model development.
The reversibility principle formalizes the EBM goal of maintaining ecosystem resilience. Any interpretation of the principle must be in the context of a changing ecosystem. The Southern Ocean ecosystem is changing in response to two centuries of largely unregulated harvesting, including the removal of up to 84% of baleen whale biomass (Laws Reference Laws1977; Hill et al. Reference Hill, Murphy, Reid, Trathan and Constable2006), and to the changing climate (Flores et al. Reference Flores, Atkinson, Kawaguchi, Krafft, Milinevsky, Nicol, Reiss, Tarling, Werner, Bravo Rebolledo, Cirelli, Cuzin-Roudy, Fielding, Groeneveld, Haraldsson, Lombana, Marschoff, Meyer, Pakhomov, Rombolá, Schmidt, Siegel, Teschke, Tonkes, Toullec, Trathan, Tremblay, Van de Putte, van Franeker and Werner2012). Translating the reversibility principle into an objective with a relative reference point is a pragmatic approach to managing a single human activity (fishing) in this context. Different interpretations of ‘reversible’ imply different reference points. For example, ‘capable of changing direction’ implies a recovery reference point equal to the depletion reference point, whereas ‘capable of returning to an initial state’ implies a higher recovery reference point.
This analysis suggests that the reversibility principle can indicate objectives for the current state of some predator subpopulations. That is, for a specified recovery reference point there might be a depletion reference point with the same risk of violation. These pairs of reference points are specific to the combination of modelled predator subpopulation and catch allocation option. Not every combination has a pair, and the number of combinations is further reduced if undesirably low reference points or high risks are excluded.
Beddington & Cooke (1983) introduced the use of soft limit reference points to identify appropriate management measures for fisheries. They described 20% of the initial stock of a harvested species as ‘a lower limit where recruitment declines might be expected to be observable’. CCAMLR later adopted both the approach and the reference point for managing krill fisheries. Although the approach specifies the probability of the modelled state falling below the reference point, it does not imply acceptance of this risk in the real ecosystem. Maintaining the state of the real ecosystem within acceptable limits might require tactical adjustments to catch limits or catch allocation options. However, CCAMLR has not yet identified any reference points to inform tactical adjustments. CCAMLR relies on members to donate ecological data and analyses, and to consent to provide fisheries data. This system has not yet produced routine assessments of the krill stock, although some members have smaller-scale krill monitoring programmes (for example the UK's krill survey area covers approximately 0.3% of the 3.5 × 10⁶ km2 that the regional catch limit applies to; Brierley et al. Reference Brierley, Goss, Grant, Watkins, Reid, Belchier, Everson, Jessopp, Afanasyev and Robst2002). de la Mare & Constable (Reference de la Mare and Constable2000) and Hill et al. (Reference Hill, Forcada, Trathan and Waluda2010) have proposed using monitored krill predators to inform fishery management, the latter suggesting that changes in the frequency of observations below a reference point within a fixed time-window can indicate impacts. The reference point and time-window are chosen based on trade-offs between the risks of false negatives, false positives and delayed response.
CCAMLR scientists have used pragmatic reference points, in combination with simulation models that emphasize uncertainty, to identify management measures for the krill fishery. This approach allowed progress from strategic ambiguity in 1982 to a regional catch limit, based on reference points, by 1994. However, the legally effective interim catch limit is only 11% of the current regional catch limit and about 1% of estimated krill biomass. CCAMLR has not implemented a spatial subdivision of the regional catch limit, or any fraction of it, in response to the scientific advice that it requested (SC-CAMLR [Scientific Committee for the Conservation of Antarctic Marine Living Resources] 2004). Instead, a recent conservation measure (CCAMLR 2011, 51–07) subdivides the interim catch limit on the coarse scale of FAO subareas (Hill Reference Hill, De Meester, Watson and Zibadi2013). CCAMLR requires consensus to make decisions (Constable et al. Reference Constable, de la Mare, Agnew, Everson and Miller2000) and the current situation is a compromise that is apparently precautionary without restricting current catch levels (which are about one-third of the interim catch limit). Nonetheless, this arrangement has attracted criticism that it is not sustainable or allows overfishing (Jacquet et al. Reference Jacquet, Pauly, Ainley, Dayton, Holt and Jackson2010; Sovacool & Siman Reference Sovacool and Siman2011). These criticisms rely on interpretations of sustainable and overfishing that are inconsistent with the reference point-based definitions that scientists and legislators commonly use (see Worm et al, Reference Worm, Hilborn, Baum, Branch, Collie, Costello, Fogarty, Fulton, Hutchings, Jennings, Jensen, Lotze, Mace, McClanahan, Minto, Palumbi, Parma, Ricard, Rosenberg, Watson and Zeller2009; Hilborn & Hilborn Reference Hilborn and Hilborn2012; and the USA's Magnuson-Stevens Act, see URL http://www.habitat.noaa.gov/pdf/magnusonstevensact.pdf). The low allowable catch relative to these reference points also exposes CCAMLR to the converse argument that it compromises access to ecosystem services.
Model-based approaches to evaluating management options have developed faster than the identification of EBM reference points. Smith et al. (Reference Smith, Brown, Bulman, Fulton, Johnson, Kaplan, Lozano-Montes, Mackinson, Marzloff, Shannon, Shin and Tam2011) analysed nine models of different fished ecosystems and identified a tentative depletion reference point of 0.75 for harvested species. This provides some retrospective support for CCAMLR's earlier adoption of this reference point. It also demonstrates that ecosystem dynamics models can help to identify reference points. Such models must account for uncertainty and be well constructed and rigorously evaluated. Smith et al (2011) suggested their reference point based on the proportion of trophic groups that were depleted by > 40%. The aggregation of organisms into trophic groups is one of the key issues in ecosystem models (Pinnegar et al. Reference Pinnegar, Blanchard, Mackinson, Scott and Duplisea2005). It would be useful to assess the sensitivity of derived reference points to aggregation assumptions.
The Convention's principles of conservation were an early articulation of EBM goals. CCAMLR's use of pragmatic soft reference points for the krill stock allowed some progress towards defining operational objectives. However reference points for harvested species are not sufficient to achieve all EBM objectives. CCAMLR has not agreed any new reference points or operational objectives since 1994 (Constable et al. Reference Constable, de la Mare, Agnew, Everson and Miller2000). The CCAMLR experience demonstrates the value of soft reference points. It also demonstrates that scientific innovation and commitment to strategically ambiguous principles do not guarantee progress. The fact that the reversibility objective is unlikely to be achievable for some subpopulations raises an important caution about legal text. Such text, even when it is informed by ecological principles, might be inconsistent with later developments in ecological knowledge. This suggests that it is appropriate to maintain strategic ambiguity in legal text.
The main obstacles to progress within CCAMLR seem to be a paucity of information on the state of the krill stock, the need for consensus, and the lack of perceived urgency. There is also considerable polarization amongst stakeholders, but little specification of their objectives (Hill Reference Hill, De Meester, Watson and Zibadi2013). McLeod & Leslie (Reference McLeod, Leslie, McLeod and Leslie2009b) highlight examples where structured dialogue between scientists, decision makers and stakeholders has identified the collective goals that are necessary for progress. This dialogue might be an essential step towards identifying suitable suites of reference points and operational objectives for EBM. Legal text might encourage more rapid progress if it balanced strategic ambiguity with a requirement to identify clear objectives that are consistent with ecological knowledge.
CONCLUSIONS
The Convention has been in force for three decades and implies objectives for the state of krill predators, but the relevant technical reference points remain to be defined. The present analysis shows that the EBM goal of maintaining ecosystem resilience implies different reference points for different ecosystem components, including the various krill predators. The analysis also shows that illustrative reference points and aggregation of ecosystem components affect the implied risk in ecosystem model results and could therefore bias model-based comparisons of candidate management measures. Nonetheless distinctions between spatial catch allocation options were relatively unaffected by these factors. This suggests that it is feasible to make decisions about where to harvest, but not how much to harvest, without first defining technical reference points.
ACKNOWLEDGEMENTS
This paper is a contribution to the British Antarctic Survey's Natural Environment Research Council core-funded Ecosystems programme. I am indebted to George Watters, Jefferson Hinke and Justin Matthews for their work in developing and implementing the simulation model, particularly Justin for guidance in producing the figures. Other ideas presented in this paper have developed as a result of numerous discussions with many colleagues at BAS, in CCAMLR's scientific working groups and beyond, especially Frances Rock and Mark Cannon. Many thanks to Susie Grant who produced Fig 1. Thanks also to two referees and the editors for helpful suggestions.



 Open access

