


Introduction
The identification of long-term spatiotemporal patterns in parasite occurrences is of major importance as it allows us to better understand how parasite interactions vary through time, an area of growing interest in the context of global environmental change (Gandon et al Reference Gandon, Buckling, Decaestecker and Day2008; Kennedy Reference Kennedy2009; Penczykowski et al Reference Penczykowski, A-L and Koskella2016). However, because long-term records are rare, historical samples and repeated sampling across decades provide especially valuable opportunities to detect whether parasite dynamics remain stable, shift, or depend on environmental context. Recent work highlights temporal variation in parasitism as a major frontier in disease ecology, emphasizing the need for data spanning extended timescales and multiple populations (Barroso et al Reference Barroso, Acevedo and Vicente2021; Kennedy Reference Kennedy1997; Kennedy and Rumpus Reference Kennedy and Rumpus1977; Wood Reference Wood2025; Wood et al Reference Wood, Welicky, Preisser, Leslie, Mastick, Greene, Maslenikov, Tornabene, Kinsella and Essington2023). Here we leverage a collection of historical samples to assess spatial and temporal patterns of host-parasite dynamics across multiple wild populations of threespine stickleback fish ( Gasterosteus aculeatus ).
At the end of the last glacial maximum, numerous populations of oceanic threespine stickleback, hereafter referred to as stickleback, independently colonized freshwater lakes and streams, resulting in an adaptive radiation. It was in these freshwater habitats where stickleback populations first encountered the trophically transmitted tapeworm Schistocephalus solidus. This macroparasite is found in lakes across the northern hemisphere and is not viable in marine environments (Simmonds and Barber Reference Simmonds and Barber2016). Like its stickleback host, S. solidus exhibits genetic diversity globally and locally (Shim et al Reference Shim, Weber, Hernandez and Bolnick2022; Strobel et al Reference Strobel, Alda, Sprehn and Heins2016, Reference Strobel, Hays, Moody and Heins2019). Schistocephalus solidus infections can have detrimental effects on stickleback fitness, which should drive the evolution of host genotypes that confer resistance (Heins et al Reference Heins, Baker, Toups and Birden2010; Weber et al Reference Weber, Steinel, Shim and Bolnick2017). However, stickleback freshwater populations exhibit substantial variation in S. solidus susceptibility and prevalence (Heins and Baker Reference Heins and Baker2003, Reference Heins and Baker2014; Kalbe et al 2016; Piecyk et al Reference Piecyk, Roth and Kalbe2019), and the underlying mechanisms of these differences are not yet understood. Infections measured in the laboratory and in the wild have shown that the environment in which hosts and parasites interact substantially affects the strength and specificity of selection. Schistocephalus solidus prevalence in the stickleback host, for example, tends to be negatively correlated with lake pH and positively correlated with lake calcium concentration (Young and Maccoll Reference Young and Maccoll2016). Furthermore, S. solidus plerocercoids grow faster and infect more stickleback in warmer temperatures (Franke et al Reference Franke, Armitage, Kutzer, Kurtz and Scharsack2017; Karvonen et al Reference Karvonen, Kristjánsson, Skúlason, Lanki, Rellstab and Jokela2013). Conversely, stickleback are immunocompromised at high temperatures (Dittmar et al Reference Dittmar, Janssen, Kuske, Kurtz and Scharsack2014), which reduces their ability to prevent/clear infections, providing an excellent example of how the fitness of hosts and parasites can be differentially altered by the environment (Franke et al Reference Franke, Armitage, Kutzer, Kurtz and Scharsack2017; Stutz et al Reference Stutz, Schmerer, Coates and Bolnick2015; Wolinska and King Reference Wolinska and King2009). Host intrinsic factors, including the immune response, physiological barriers, and genetic variation, play a crucial role in shaping infection dynamics as they influence parasite establishment, growth, and transmission. Among these mechanisms, peritoneal fibrosis formation has been identified as a prevalent, heritable defence strategy in stickleback (Flanagan et al Reference Flanagan, Fuess, Vrtílek, Roth-Monzón and Bolnick2025; Fuess et al Reference Fuess, Weber, den Haan, Steinel, Shim and Bolnick2021; Hund et al Reference Hund, Fuess, Kenney, Maciejewski, Marini, Shim and Bolnick2022; Weber et al Reference Weber, Steinel, Peng, Shim, Lohman, Fuess, Subramanian, Lisle and Bolnick2022). This formation of fibrous scar tissue is associated with parasite growth suppression and the formation of granulomas around parasites, frequently killing the parasites (Weber et al Reference Weber, Steinel, Peng, Shim, Lohman, Fuess, Subramanian, Lisle and Bolnick2022). Fibrosis-mediated resistance to S. solidus has only evolved in some freshwater stickleback populations but not in others (Hund et al Reference Hund, Fuess, Kenney, Maciejewski, Marini, Shim and Bolnick2022), further indicating that genetic factors play a crucial role in host response. Multi-year, population-level data from Canadian stickleback suggest a connection between fibrosis and S. solidus prevalence (Hund et al Reference Hund, Fuess, Kenney, Maciejewski, Marini, Shim and Bolnick2022; Weber et al Reference Weber, Steinel, Peng, Shim, Lohman, Fuess, Subramanian, Lisle and Bolnick2022). Recent work on newly founded stickleback populations further shows that reduced S. solidus prevalence in these populations is followed by strong temporal fluctuations in both infection and fibrosis (Bolnick et al Reference Bolnick, Eckert, Barrett, Choi, Haines, Hendry, Kerns, Lind, Milligan-McClellan, Peichel, Sasser, Thornton, Wolf, Steinel and Weber2026). In lakes with initially high infection rates, fibrosis later increased in severity and suppressed infections, whereas low fibrosis was followed by increased parasite prevalence (Bolnick et al Reference Bolnick, Eckert, Barrett, Choi, Haines, Hendry, Kerns, Lind, Milligan-McClellan, Peichel, Sasser, Thornton, Wolf, Steinel and Weber2026). These patterns support transient eco-evolutionary dynamics between host and parasite in newly founded populations.
Despite these new insights into Canadian stickleback, significant gaps remain in our understanding of host-parasite dynamics of the diverse stickleback populations found throughout the northern hemisphere. In particular, long-term data on infection rates and parasite burdens are limited, which hampers our understanding of how these dynamics vary spatially and temporally. Some studies, however, have begun to address this gap. Strobel et al (Reference Strobel, Hays, Moody and Heins2019) analysed S. solidus infection in multiple lakes in the Matanuska-Susitna (MatSu), Kenai, and Bristol Bay drainages (AK, USA) with sampling spanning up to 5 years. Similarly, Young and McColl (Reference Young and Maccoll2017) reported infection data from 14 locations on North Uist (Scotland) over an 8-year period, and Weber et al (Reference Weber, Steinel, Shim and Bolnick2017) reported on two British Columbia (Canada) populations over 12 years, all finding that S. solidus infections were rare or absent in many populations, but consistently present in others. This existing body of work highlights the considerable spatial and temporal heterogeneity in parasite prevalence and suggests that host immune traits, such as fibrosis, contribute to this variation. Together, these studies establish the stickleback–Schistocephalus system as a clear example of spatial and temporal heterogeneity in parasite infection, but also highlight the need for additional long-term, multi-population datasets to resolve the drivers of this variation.
The present study
In the present study, we analysed fibrosis-mediated host resistance and infection patterns in stickleback populations from 4 Alaskan lakes. In addition to the work in the MatSu, Kenai, and Bristol Bay (Strobel et al Reference Strobel, Hays, Moody and Heins2019; Weber et al Reference Weber, Steinel, Shim and Bolnick2017; Young and Maccoll Reference Young and Maccoll2017) mentioned above, long-term tracking of parasite prevalence has been conducted for 2 Alaskan lakes: Walby Lake (Heins et al Reference Heins, Baker, Toups and Birden2010, Reference Heins, Singer and Baker1999) and Scout Lake (Heins and Baker Reference Heins and Baker2011), both of which were selected due to their historically moderate to high levels of S. solidus infections. However, empirical data on long-term infection dynamics remain lacking for most other lakes in the region. To address this gap, we analysed S. solidus infection dynamics over an 11-year period (1996–2006) in four lakes in the MatSu Valley of southcentral Alaska, providing a multi-population, long-term dataset that complements existing shorter-term or single-population studies.
In our study, we examined key host traits and infection parameters, including parasite number, fibrosis formation, and parasite weight, to identify spatial and temporal variations in infection patterns and fibrosis phenotypes and, as a result, uncover population-level differences in measures of host resistance. By providing longitudinal data across multiple lakes, our study offers new insights into temporal variation in the stickleback – S. solidus system and helps clarify how infection patterns differ among populations over time.
Material and methods
Population selection and sample collection
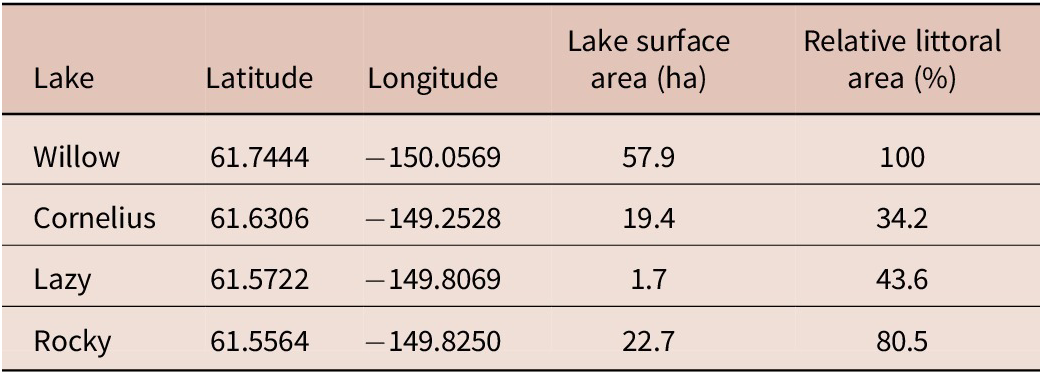
To assess long-term S. solidus infection dynamics, four populations were selected from historical collections that (a) included annual or biannual samples of at least an 11-year period and (b) for which no published long-term infection studies exist. Geographical and ecological details about the lakes are listed in Table 1 and Figure 1. To capture a representative range of S. solidus infection levels, we selected lakes with varying cestode prevalence. Based on knowledge accumulated during a 25-year sampling program of hundreds of Alaskan stickleback populations by Susan Foster and John Baker (personal communication, unpublished data), we expected Willow Lake stickleback to show moderate to high cestode prevalence and the other 3 populations (Cornelius, Lazy, and Rocky lakes) to show moderate to low cestode prevalence.
General information of the four lakes used in this experiment

Table 1 Long description
The table presents general geographic and physical characteristics for four study lakes.
Willow Lake is located at latitude 61.7444 and longitude −150.0569. It has a surface area of 57.9 hectares and a relative littoral area of 100%.
Cornelius Lake is located at latitude 61.6306 and longitude −149.2528. It has a surface area of 19.4 hectares and a relative littoral area of 34.2%.
Lazy Lake is located at latitude 61.5722 and longitude −149.8069. It has the smallest surface area, at 1.7 hectares, and a relative littoral area of 43.6%.
Rocky Lake is located at latitude 61.5564 and longitude −149.8250. It has a surface area of 22.7 hectares and a relative littoral area of 80.5%. Among the four lakes, Willow Lake has both the largest surface area and the highest relative littoral area, while Lazy Lake is the smallest.
Sampling locations of the studied lakes in Alaska. The exact coordinates and further site information are listed in Table 1.

Associates of the Foster-Baker lab collected samples between early May and late June from 1996 to 2006, using 3-to-6-mm wire-mesh minnow traps that were set near shore overnight. They euthanized the fish with MS-222 following animal care protocols (Clark University IACUC, protocol #033R) before fixation and storage in 10% formalin. All collections were approved by annual Aquatic Resource Permits from the Alaskan Department of Fish and Game (SF-96-027; SF-97-052; SF-98-046; SF-99-071; SF2000-071; SF2001-064; SF2002-037; SF2003-078, SF2004-063; SF2005-064; SF2006-095).
Assessing stickleback infections and fibrosis
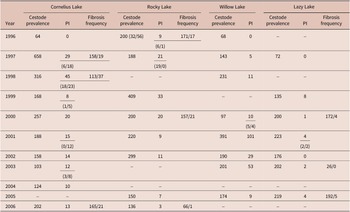
We measured the standard length (body length from the tip of the nose to the last vertebrae) of all preserved fish to the nearest 0.1 mm with a dial caliper (Dial Caliper, 505-647, Mitutoyo, Kawasaki, Japan), and subsequently dissected the fish and examined the body cavity for S. solidus larvae under a dissection microscope (Trinocular Zoom Stereo Microscope, EMZ-TR (0.7×–4.5×), Meiji, Tokyo, Japan). We removed, counted, and weighed all S. solidus with a digital scale (College Precision Balance, B303-S, Mettler Toledo). For instances where individual parasites were too small to be accurately measured, only parasite number was noted. We recorded the fish weight before and after dissection. For all analyses, fish net weight, i.e., eviscerated and not including the weight of tapeworms, was used. Sample sizes for each population and year are shown either in Table 2 or in the figure displaying the results (see Results section). We calculated the cestode prevalence (% infected fish) in each population studied and the Parasite Index (PI; 100*S. solidus weight /net fish weight) for each specimen dissected (Arme and Owen Reference Arme and Owen1967; Kurtz et al Reference Kurtz, Kalbe, Aeschlimann, Häberli, Wegner, Reusch and Milinski2004). PI serves as an indicator for severity of infection and offers key advantages over standard worm intensity (parasites per host), as it directly quantifies the relative parasite biomass burden on the host, better reflecting pathological impact and host fitness cost in cases of size-variable parasites like S. solidus. For fish infected with multiple parasites, we used the sum of the tapeworm weights to calculate the PI. We assessed the level of peritoneal fibrosis on a subset (7) of the Lake-Year combinations under a dissection microscope as either 0 (no fibrosis), 1 (organs are slightly attached to each other), 2 (fibrotic tissue adhering organs together), 3 (organs adhered to each other and to the peritoneal wall) and 4 (difficulties in opening the peritoneal cavity, severe fibrosis formation) (Hund et al Reference Hund, Fuess, Kenney, Maciejewski, Marini, Shim and Bolnick2022).
Sample sizes (n) for stickleback used to calculate Cestode Prevalence, Fibrosis Frequency, and Parasite Index (PI). For years with a dash, no samples were available to us. The numbers in parentheses indicate the sample sizes for calculating the PI in different age groups: (≤1 year old/>1 year old). The two numbers in Fibrosis Frequency are for uninfected/infected stickleback

Table 2 Long description
The table presents annual sample sizes used to calculate cestode prevalence, parasite index (PI), and fibrosis frequency for stickleback populations in the four sampled lakes.
Cornelius Lake contains the most complete dataset across the study period, with cestode prevalence sample sizes ranging from 64 in 1996 to 658 in 1997. Parasite index sample sizes range from 0 to 45. Fibrosis frequency data are available for selected years, including 158 uninfected and 19 infected fish in 1997, 113 uninfected and 37 infected fish in 1998, and 165 uninfected and 21 infected fish in 2006.
Rocky Lake includes prevalence sample sizes ranging from 136 to 409. Data are absent in some years, including 1998, 2003, and 2004. Fibrosis frequency measurements are available in 1996, 2000, and 2006.
Willow Lake has prevalence sample sizes ranging from 97 to 391. The largest prevalence sample size in the table occurs in Willow Lake in 2001, with 391 fish. No data are available for several years, including 1999, 2004, and 2006.
Lazy Lake generally has smaller sample sizes than the other lakes. Prevalence sample sizes range from 135 to 223 where data are available. Fibrosis frequency data are available only in selected years, including 172 uninfected and 4 infected fish in 2000, 26 uninfected and 0 infected fish in 2003, and 192 uninfected and 5 infected fish in 2005.
Overall, sampling intensity and data availability vary substantially among lakes and years, with Cornelius Lake contributing the most consistent long-term dataset.
To determine age-related changes in infection dynamics, we compared the cestode prevalence of ≤1-year-old fish from a given year with >1-year-old fish from the next year in a cohort analysis. For example, the cestode prevalence of ≤1-year-old fish from Rocky Lake 1996 and >1-year-old fish from Rocky Lake 1997 were grouped together as a cohort (‘Rocky Lake – cohort 1996’). Due to low sample size for some years, we were able to perform this cohort analysis only on a subset of samples (Figures S1–S4).
Calculating stickleback age distribution
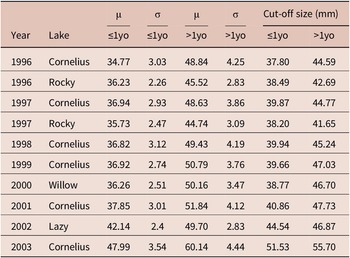
To identify the cestode prevalence of ≤1-year-old vs. >1-year-old stickleback, we first determined the age distribution in our samples. In stickleback, weight increases nearly linearly with age; therefore, age-based growth is commonly estimated using weight (Baker et al Reference Baker, Heins, Foster and King2008). However, considering S. solidus is expected to reduce the host’s weight significantly, we instead used standard length (Barber and Svensson Reference Barber and Svensson2003; Heins and Baker 2011). The increase in stickleback length in adults is not linear and slows after 1 year of age; therefore, we grouped our samples into ‘≤1-year-old’ and ‘>1-year-old’ categories. To estimate the size cutoff between ≤1-year-old and >1-year-old stickleback, we first grouped the stickleback based on their standard length and visually assessed the distribution (Figure S1–S4) (Baker et al Reference Baker, Wund, Heins, King, Reyes and Foster2015; Wohlleben et al Reference Wohlleben, Steinel, Meyer, Baker and Foster2022). We confirmed these initial estimates with a maximum-likelihood-based approach and grouped the data with a combination of a Newton-type and expectation maximization (EM) algorithm (Macdonald and Pitcher Reference Macdonald and Pitcher1979). For ≤1-year-old stickleback, we used the population mean plus the standard deviation as the upper cut-off value; for >1-year-old stickleback, we used the population mean minus the standard deviation as the lower cut-off value (Table 3). While this reduced our sample size for downstream analysis, the probability of incorrect age assignment decreased. Due to low sample sizes for some populations, we only determined age distributions for 10 Lake-Year combinations.
Population parameters and cut-off values for ≤1-year-old (≤1yo) and >1-year-old (>1yo) stickleback. The upper cut-off value for 1yo is the population mean + the standard deviation; The lower cut-off value for >1yo is the population mean – the standard deviation. Population mean and standard deviation were calculated using a maximum-likelihood-based approach. μ = Population mean; σ = Population standard deviation

Table 3 Long description
The table presents population parameters used to distinguish stickleback age classes. Parameters include population means (μ), standard deviations (σ), and calculated cut-off sizes in millimetres for young-of-year fish and fish older than 1 year.
For fish older than 1 year, population means range from 44.74 millimetres in Rocky Lake in 1997 to 60.14 millimetres in Cornelius Lake in 2003. Standard deviations range from 2.83 to 4.44 millimetres.
For young-of-year fish, population means range from 34.77 millimetres in Cornelius Lake in 1996 to 47.99 millimetres in Cornelius Lake in 2003. Standard deviations for this age class range from 2.26 to 3.54 millimetres.
Cut-off sizes for younger fish range from 37.80 millimetres in Cornelius Lake in 1996 to 51.53 millimetres in Cornelius Lake in 2003. Cut-off sizes for older fish range from 41.65 millimetres in Rocky Lake in 1997 to 55.70 millimetres in Cornelius Lake in 2003.
Statistics
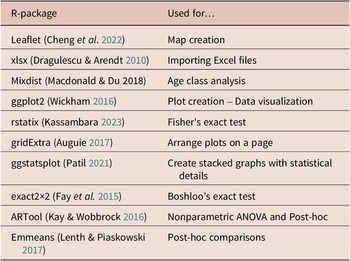
We performed all statistical analyses and created all graphs in RStudio (v. 4.2.1; R Core Team, 2022). We edited all graphs in Inkscape (Inkscape Project, 2020) and GIMP (v. 2.10.22; The GIMP development Team, 2019), respectively. The R packages used are listed in Table 4. To assess differences in cestode prevalence between years and within a lake, we used the Fisher’s exact test. This test is most appropriate when expected frequencies are low (Crawley Reference Crawley2012), as was the case for years where we measured no infections in our samples. Because our contingency tables were larger than 2×2, we computed p-values via Monte Carlo simulation. We calculated a Bonferroni-corrected post-hoc test for pairwise comparisons. Further, we calculated the coefficient of variation (CV; ratio of the standard deviation to the mean) for the cestode prevalence within each lake to compare the variability of cestode prevalence between lakes. To determine if there were differences in cestode prevalence between different age-groups within one cohort, we calculated either a Boschloo exact or a Pearson’s Chi-squared test. First, we tested the expected frequencies in the contingency table. If at least one cell in the contingency table had a frequency below 5, we used the Boschloo exact test; otherwise, we used the Chi-squared test (Boschloo Reference Boschloo1970; Bower Reference Bower2003; McCrum-Gardner Reference McCrum-Gardner2008). We chose the Boschloo exact test over the Fisher’s exact test in this analysis, as the former one is better suited for our unequal sample sizes (Mehrotra et al Reference Mehrotra, Chan and Berger2003). The PI did not fit the assumption of normality (assessed visually and via Shapiro-Wilk test). Therefore, we used the non-parametric Kruskal-Wallis-Test followed by Dunn’s test (pairwise comparison) with a Bonferroni correction to adjust for multiple testing to test for differences in PI between years. We ran a statistical analysis of leverage to test for outliers in PI. To test for differences in PI between age groups, we ran an aligned ranks ANOVA (PI ~ year * age), followed by a post hoc test (aligned rank transform contrasts) with Holm-Bonferroni correction (Abdi Reference Abdi2010; Cabin and Mitchell Reference Cabin and Mitchell2000). We tested whether the likelihood of fibrosis formation in a fish was related to infection status (present/absent) and sample year within each population, using a binomial GLM (Fibrosis Frequency ~ Infection status * Year).
R packages used for statistical analysis and figure creation

Table 4 Long description
The table summarizes R packages used for data analysis and figure creation in the study, along with their primary functions.
Leaflet was used for map creation.
xlsx was used to import Excel files.
Mixdist was used for age-class analysis.
ggplot2 was used for plot creation and data visualization.
rstatix was used for Fisher’s exact tests.
gridExtra was used to arrange plots on a page.
ggstatsplot was used to create stacked graphs with statistical details.
exact2x2 was used for Boschloo’s exact test.
ARTool was used for nonparametric ANOVA and post-hoc analyses.
Emmeans was used for post-hoc comparisons.
Results
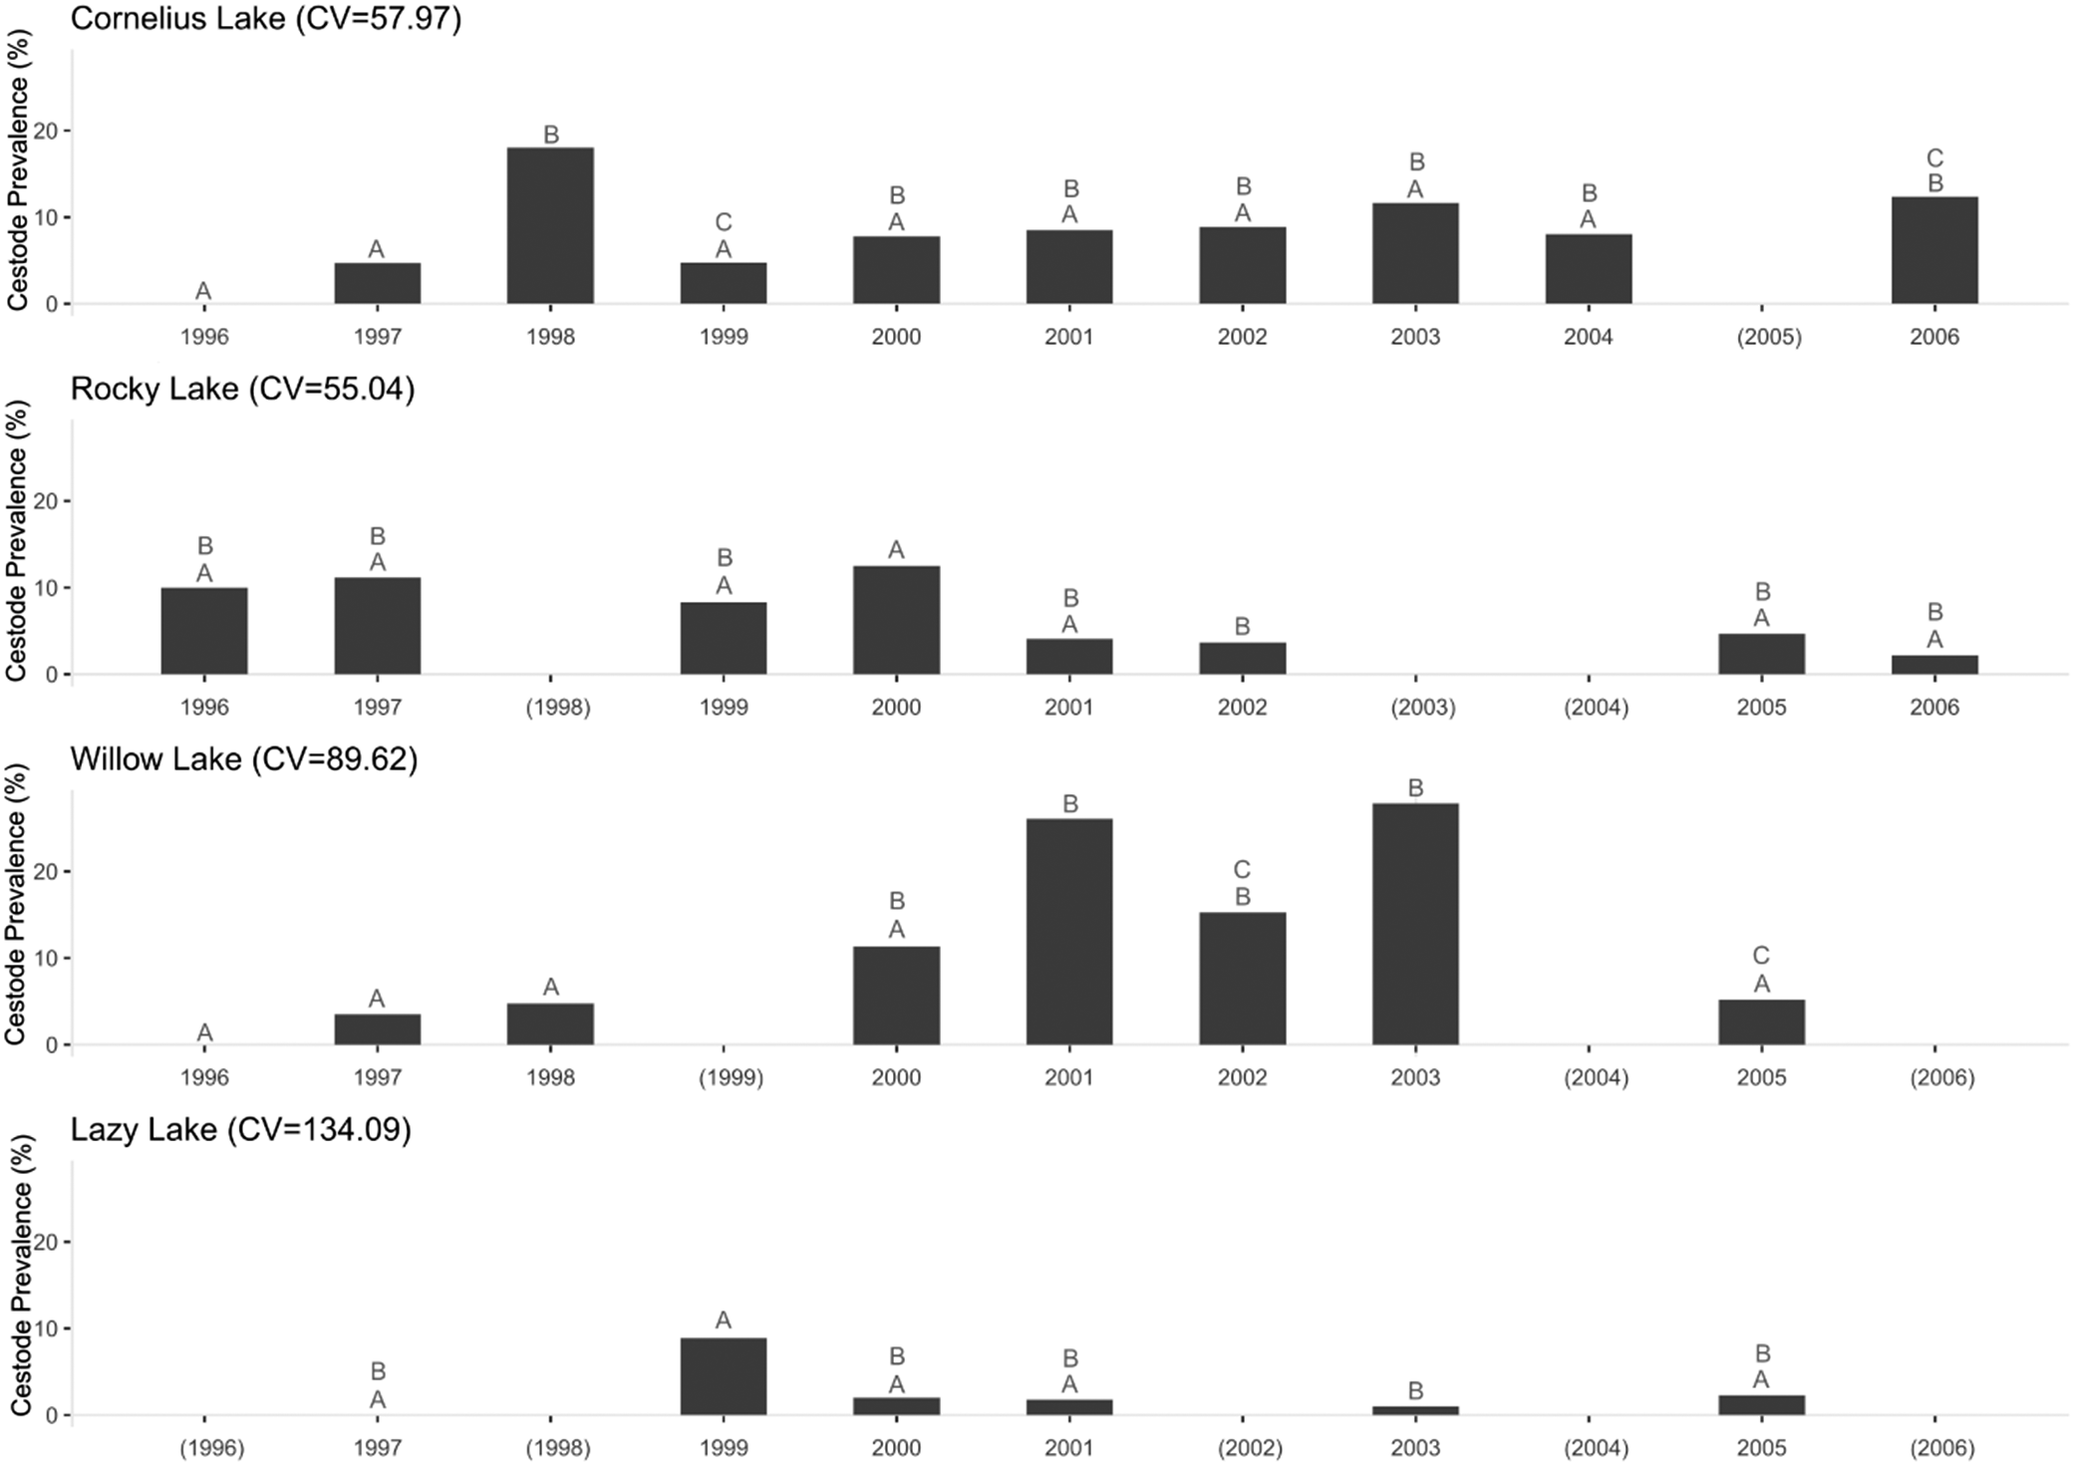
To assess S. solidus prevalence over time, we compared the percentage of infected hosts across the sampling window. Schistocephalus solidus prevalence fluctuated between years in all sampled lakes (Figure 2). We observed the highest variation between years in Lazy Lake (CV = 134.09), followed by Willow Lake (CV = 89.62), Cornelius Lake (CV = 57.97), and lastly Rocky Lake (CV = 55.04). Despite the high variation in Lazy Lake, we found that only 1999 and 2003 differed significantly in their cestode prevalence. Of the lakes assessed, on average Willow Lake fish had the highest cestode prevalence, while Lazy Lake fish had the lowest cestode prevalence.
S. solidus prevalence (% infected fish) for Cornelius, Rocky, Willow, and Lazy lakes over a span of 11 years. We used Compact Letter Display (CLD) to show statistical differences; here, different letters above bars represent statistically significant annual differences within a lake. CV is the Coefficient of Variation for each lake across years. Empty cells without letters and years in parentheses represent years for which we had no samples. Sample sizes are listed in Table 2.

Figure 2 Long description
The figure contains four bar charts showing cestode prevalence percentages across the sampling period for the sampled lakes: Cornelius Lake, Rocky Lake, Willow Lake, and Lazy Lake. Each panel includes the coefficient of variation (CV) for that lake.
Cornelius Lake
Cornelius Lake (CV = 57.97) shows generally low to moderate prevalence across the study period. Prevalence is zero in 1996, increases to approximately 5% in 1997, peaks near 18% in 1998, declines in 1999, and remains between about 8% and 12% from 2000 to 2006. Although no data was available for 2005. Statistical groupings show that prevalence in 1998 and 2006 was higher than in several low-prevalence years, including 1996, 1997, and 1999.
Rocky Lake
Rocky Lake (CV = 55.04) begins with cestode prevalences of about 10% and 11% in 1996 and 1997 respectively. Data for 1998 is missing. Prevalence remains moderate with 8% in 1999 and 12% in 2000. It further declines to below 4% in 2001 and about 3% in 2002. No data was available for 2003 or 2004. A small increase to 5% occurs in 2005, followed by very low prevalence of 2% in 2006. Statistical groupings show that only 2000 and 2002 were significantly different in their prevalence.
Willow Lake
Willow Lake (CV = 89.62) has low prevalence from 1996 to 1998, with values below 5%. No data are shown for 1999. Prevalence increases sharply in 2000 to approximately 11%, rises further to around 26% in 2001, remains elevated around 15% in 2002, and peaks again near 28% in 2003. No is available for 2004. Prevalence declines to approximately 5% in 2005, with no data available for 2006. Statistical groupings show that Willow Lake in 2001 and 2003 differed from several lower-prevalence years, including 1996, 1997, 1998 and 2005.
Lazy Lake
Lazy Lake (CV = 134.09) shows the lowest and most variable prevalence overall. No data was available for 1996 and 1998. The prevalence is 0% in 1997 and peaks near 9% in 1999, then remains below 3% in subsequent years, with 0% in 2002 and no data for 2004 and 2006. Statistical groupings show that only 1999 and 2003 significantly differed in their prevalence.
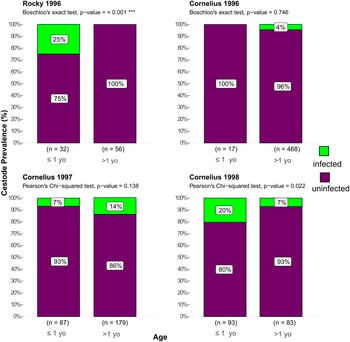
As outlined in the Methods, we conducted a cohort-based analysis by comparing the prevalence of ≤1-year-old fish from a given year with >1-year-old fish from the subsequent year. Within Rocky Lake, we observed a decrease in cestode prevalence in the 1996 cohort (≤1 year old: 25%, >1 year old: 0%). There were no significant differences in cestode prevalence between ≤1-year-old and >1-year-old fish in Cornelius Lake – cohort 1996 or Cornelius Lake – cohort 1997 (Figure 3); however, cestode prevalence decreased in Cornelius Lake – cohort 1998 (≤1 year old: 20%, >1 year old: 7%).
Cestode prevalence (% infected) in fish in two different age groups (≤1 year old and >1 year old) for 4 different cohorts in 2 different Lakes (Rocky Lake 1996, Cornelius Lake 1996, Cornelius Lake 1997, Cornelius Lake 1998). p-values describe the differences in probability of being infected between age groups. Sample sizes are reported in parentheses (n).

Figure 3 Long description
The figure contains four stacked bar charts comparing cestode prevalence (%) between young-of-year fish and fish older than 1 year.
Rocky Lake 1996 (top left panel)
We report a Boschloo’s exact test with p-value less than 0.001. 25% of young-of-year fish were infected, with a sample size of 32. Fish older than 1 year showed 0% infection, with a sample size of 56.
Cornelius Lake 1996 (top right panel)
We report a Boschloo’s exact test with p-value of 0.746. 100% of young-of-year fish were infected, with a sample size of 17. In fish older than 1 year, 4% were infected, with a sample size of 468.
Cornelius Lake 1997 (bottom left panel)
We report a Pearson’s chi-squared test with p-value of 0.138. 7% of young-of-year fish were infected, with a sample size of 87. 14% of fish older than 1 year were infected, with a sample size of 179.
Cornelius Lake 1998 (bottom right panel)
We report a Pearson’s chi-squared test with p-value of 0.022. 20% of young-of-year fish were infected, with a sample size of 93. 7% of fish older than 1 year were infected, with a sample size of 83.
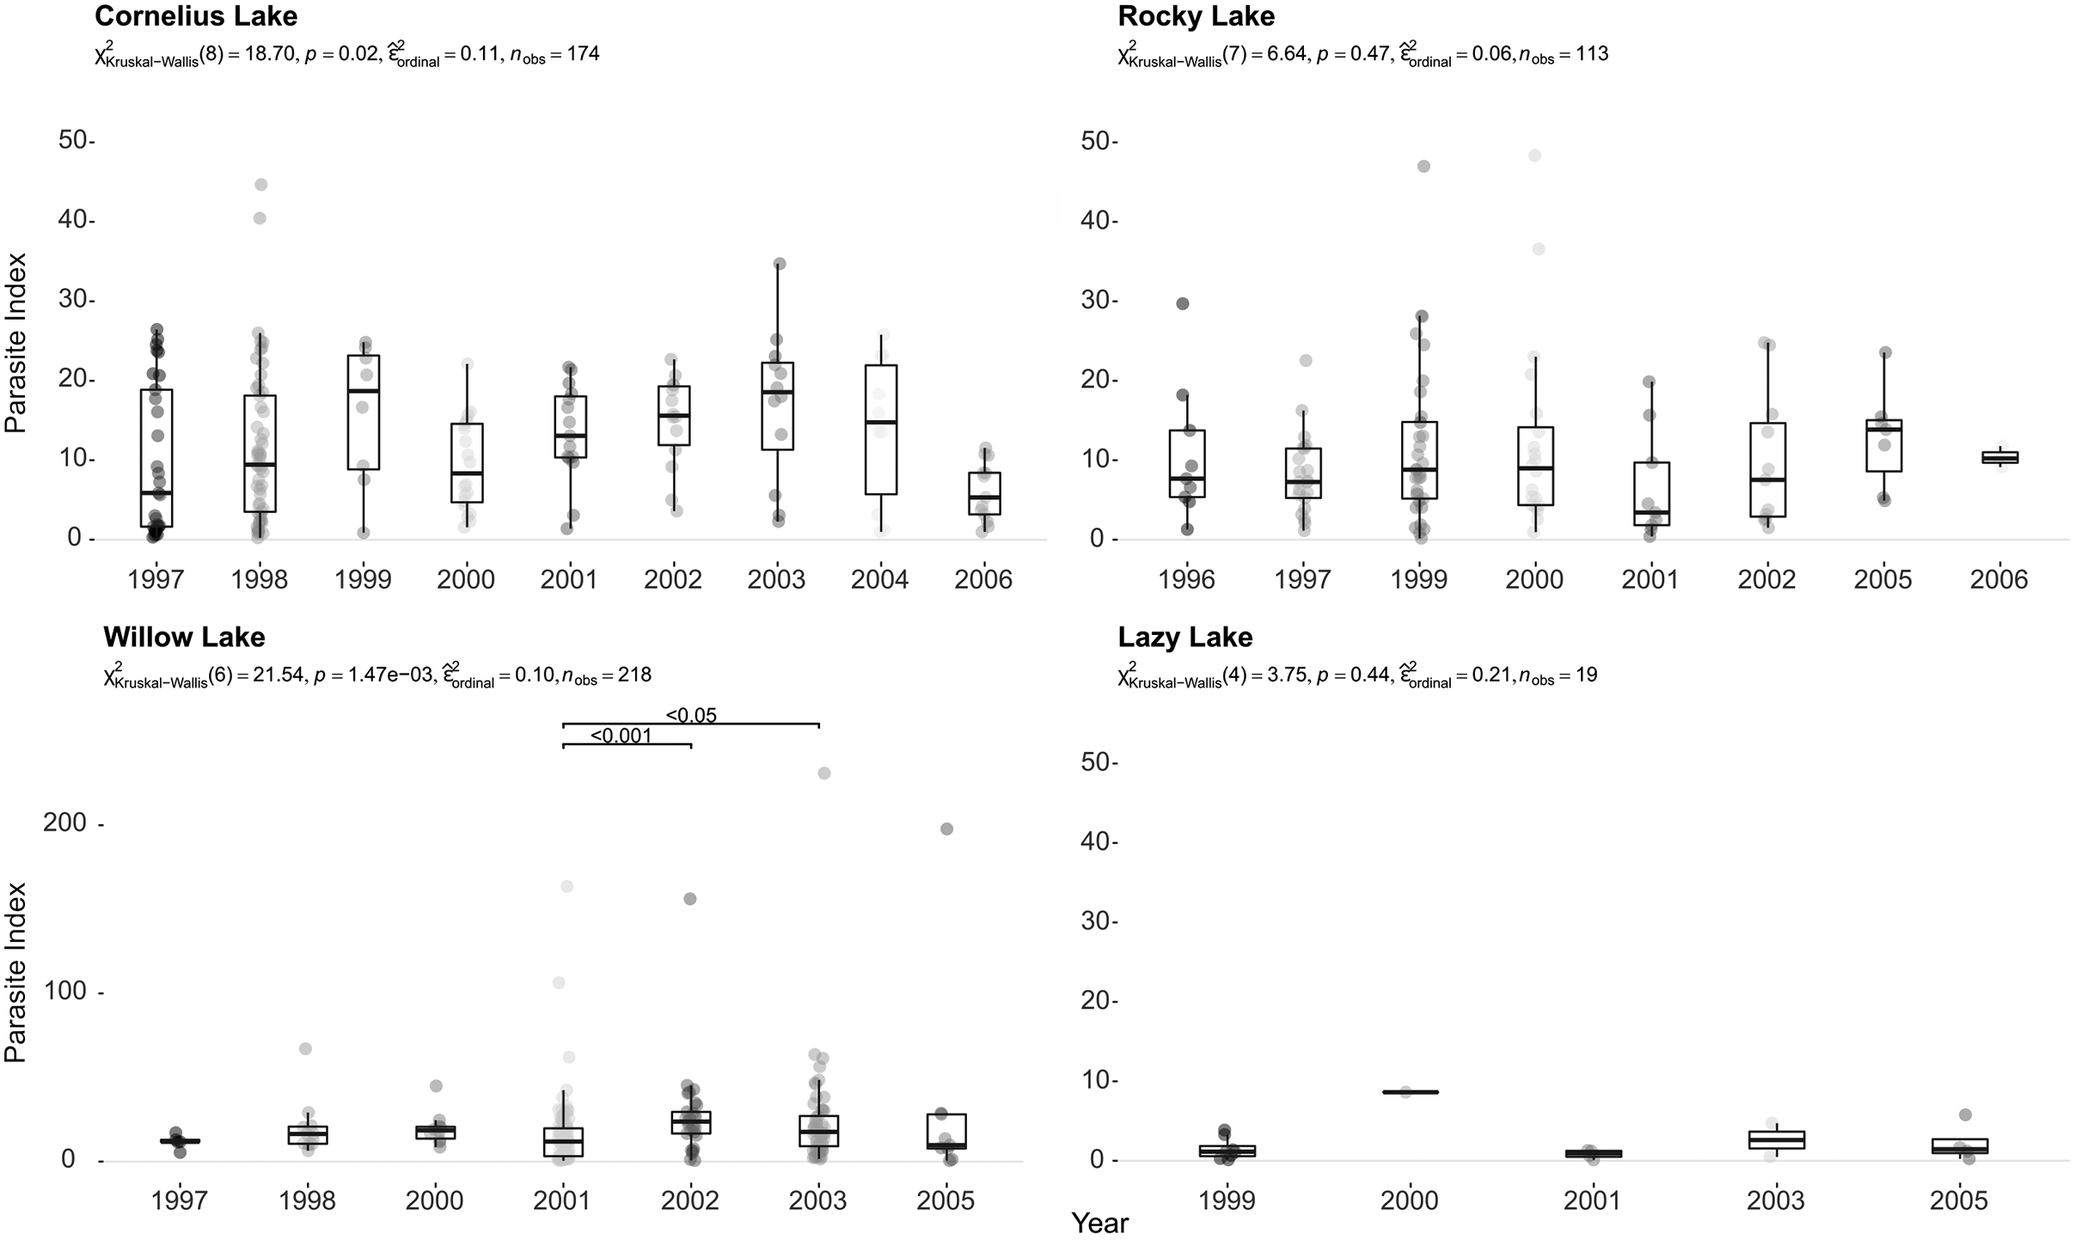
To assess parasite burden per fish, we compared the Parasite Index (PI) across years. In Cornelius Lake, the PI differed between years, and we found a large effect size (eta2 = 0.11) as per Cohen’s (1988) conventions (Figure 4). We found a similar trend in Willow Lake (Figure 4, p = 1.47 e−3, eta2 = 0.1). However, in both Rocky Lake and Lazy Lake, there were no significant differences in PI across years. Overall, Willow Lake showed the highest PI values, while Lazy had the lowest values (Figure 4). We also compared the PI of different age groups, i.e., ≤1 year old and >1 year old, but only found a significant difference between ≤1-year-old and >1-year-old stickleback in Walby Lake in 2000 (Figure 5).
Parasite Index (PI) for Cornelius, Rocky, Willow and Lazy lakes over a span of 11 years. Sample sizes are listed in Table 2. Please note the differences in y-axis interval for Willow Lake.

Figure 4 Long description
Cornelius Lake
The statistics are χ²(8) = 18.70, p = 0.02, ordinal effect size = 0.11, indicating significant differences among years with a small-to-moderate effect size.
Median parasite index values fluctuate over time. Lower medians occur in 1997 and 2006, where median values are near 5. Median values rise in 1999, 2002, 2003, and 2004, generally between 14 and 20. The highest median appears around 2003. Variability is large in several years, especially 1998 and 2004, where boxes and whiskers span broad ranges. Values above 40 occur only in 1998.
Rocky Lake
The statistics are χ²(7) = 6.64, p = 0.47, ordinal effect size = 0.06, indicating no significant differences among years.
Median parasite indices remain relatively stable across years, generally between 4 and 10. Slightly higher medians appear in 2005 and 2006, near 13–15, but variability overlaps strongly among years.
Willow Lake
The statistics are χ²(6) = 21.54, p = 1.47 × 10⁻³, ordinal effect size = 0.10, indicating statistically significant yearly differences.
In 1997 and 1998, median values are approximately 10–15. Median values decline slightly in 2001, then increase sharply in 2002 and 2003, reaching approximately 18–22, the highest among all lakes in the figure. Pairwise comparisons indicate significant differences between 2001 and 2003 (p < 0.05) and 2001 and 2002 (p < 0.001).
Willow Lake shows the most extreme outliers. Several observations exceed 100, and some approach or exceed 200 in 2001–2005.
Lazy Lake
The statistics are χ²(4) = 3.75, p = 0.44, ordinal effect size = 0.21, indicating no statistically significant yearly differences despite a moderate effect size estimate.
Median parasite index values remain consistently low, mostly between 1 and 3. One year, 2000, has a mean around 10. Variability is minimal compared with the other lakes, and there are few outliers due to the small sample size.
Four boxplot panels compare parasite index across years at in the sampling lakes. Cornelius and Willow lakes show significant yearly variation; Willow Lake includes several high outliers. See long description.
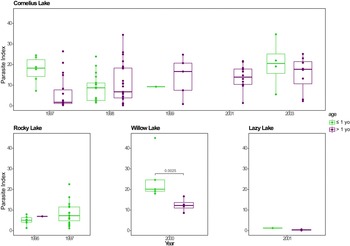
Parasite Index (PI) for Cornelius, Rocky, Willow, and Lazy lakes for different age groups, i.e., ≤1 year old (1yo, green) and >1 year old (purple). Sample sizes are listed in Table 2.

Figure 5 Long description
Figure with four boxplot panels comparing parasite index by fish age group and sampling year across Cornelius, Rocky, Willow, and Lazy lakes. The age groups being compared are young-of-year fish and fish older than 1 year.
Cornelius Lake
Data span multiple years from 1997 to 2003. Parasite indices vary broadly, with both age groups ranging from near 0 to above 30. Younger fish have higher medians in 1997, 1998 and 2003. There is no data for young-of-year fish in 2001. In 1999 fish older than 1 year have higher median (approx. 19) than younger fish (approx. 10).
Rocky Lake
Data only exists for 1996 and1997. There is no data on fish older than 1 year in 1997, younger fish that year have a median Parasite Index of approximately 8. In 1996, older fish have a higher median (approx. 8) than younger fish (approx. 5).
Willow Lake
We only have data for Willow Lake 2000. Younger fish have a statistically significant higher parasite index (approx. 20 to 25) compared to older fish (approx. 10-15) (p=0.0025).
Lazy Lake
We only have data for Lazy Lake 2001. Parasite indices are close to zero for both age groups.
To determine the prevalence of peritoneal fibrosis, we assessed population-level and year-to-year differences in frequency of fibrosis formation. We collected data on fibrosis for 11 Lake-Year combinations and found fibrotic fish in each of those samples (Figure 6, Figure S5). Specifically, we found significant year-to-year variation in fibrosis frequency in Cornelius Lake stickleback. In 1997, only 9% of all fish (regardless of infection status) displayed fibrosis, in contrast to one year later, when 63% of fish displayed fibrosis (Figure S5). We found a similar pattern in Lazy Lake stickleback; In 2000, about 33% of fish showed fibrosis, which increased to 83% in 2005. In contrast, the frequency of fibrosis was relatively stable in Rocky Lake and Willow Lake fish (Figure 6, Figure S5). Both infected and uninfected fish displayed peritoneal fibrosis to an equivalent degree, and we only found a significant difference in frequency of fibrosis in S. solidus-infected vs. uninfected stickleback within the same year in Willow Lake 2000 (p = 0.034), with more uninfected fish showing fibrosis (Figure 6). We also collected data on the severity of fibrosis (scale from 0 to 4, see Methods section), but sample sizes were too small to provide meaningful results.
Frequency of fibrosis (% fibrotic fish/total fish) in stickleback infected with S. solidus or uninfected fish in 4 Alaskan populations for different years. The sample sizes are reported below each graph (n). We used Compact Letter Display (CLD) to show statistical differences; here, different letters above bars represent significant differences within lake but between years and infection status.

Figure 6 Long description
The figure contains eleven bar charts arranged in a grid. Each panel compares fibrosis frequency percentages between uninfected and infected stickleback populations for a specific lake and year.
Cornelius Lake
Cornelius Lake 1997 shows low fibrosis frequencies in both groups, with approximately 10% fibrosis in uninfected fish and approximately 12% in infected fish. Cornelius Lake 1998 shows substantially higher fibrosis frequencies, with approximately 60% fibrosis in uninfected fish and approximately 72% in infected fish. Cornelius Lake 2006 shows intermediate fibrosis frequencies, with approximately 25% fibrosis in uninfected fish and approximately 48% in infected fish. None of the samples showed significant differences in their fibrosis frequency between infected and uninfected fish.
Rocky Lake
Rocky Lake 1996 shows fibrosis frequencies near 50% in uninfected fish and approximately 35% in infected fish. Rocky Lake 2000 shows similar fibrosis frequencies between groups, with uninfected fish near 57% and infected fish near 48%. Rocky Lake 2006 shows fibrosis frequencies near 45% in uninfected fish and approximately 100% in infected fish. Within Rocky Lake, there are no statistically significant differences in fibrosis frequency between years or infection status.
Lazy Lake
Lazy Lake 2000 shows fibrosis frequencies near 35% in uninfected fish and approximately 0% in infected fish. Lazy Lake 2003 includes only uninfected fish, with fibrosis frequency near 55%. Lazy Lake 2005 shows high fibrosis frequencies in both groups, with approximately 82% fibrosis in uninfected fish and approximately 100% in infected fish. None of the samples showed significant differences in their fibrosis frequency between infected and uninfected fish.
Willow Lake
Willow Lake 2000 shows a strong contrast between groups, with approximately 90% fibrosis in uninfected fish and approximately 20% in infected fish. Statistically significantly more uninfected than infected fish showed fibrosis in Willow Lake 2000. Willow Lake 2003 shows moderately high fibrosis frequencies in both groups, with approximately 68% in uninfected fish and approximately 58% in infected fish.
Discussion
To identify spatial and temporal patterns of S. solidus infections in different Alaskan stickleback populations, we analysed infection intensity and host fibrosis in four Alaskan stickleback populations over an 11-year period.
Differences in infection prevalence
Consistent with reports in other stickleback populations (Heins et al Reference Heins, Baker, Toups and Birden2010, Reference Heins, Singer and Baker1999; Heins and Baker 2011; Weber et al Reference Weber, Steinel, Shim and Bolnick2017), we found population-level differences in S. solidus cestode prevalence. On average, cestode prevalence was highest in Willow Lake, lowest in Lazy Lake, and intermediate in Cornelius Lake and Rocky Lake (Figure 2). Several factors may contribute to these differences. First, S. solidus is trophically transmitted, with a three-host life cycle. The encounter rate between cyclopoid copepods, the first intermediate host, and S. solidus coracidia is influenced by the spatial-temporal distribution of the cestode (Wedekind Reference Wedekind1997). The development of S. solidus eggs into free-swimming coracidia requires elevated temperature and sunlight and may only take a few weeks under warm conditions (18°C–20°C) (Hopkins and Smyth Reference Hopkins and Smyth1951). In deep lakes, the eggs deposited into limnetic areas may sink below the hypolimnion, hampering, if not preventing, egg development. Cornelius Lake is deep (maximum depth 16.5 m, average depth 7 m) with a strong thermocline, which likely slows S. solidus embryo development. Therefore, only embryos deposited in the shallow areas of Cornelius Lake are likely to hatch and infect copepod hosts, possibly explaining the relatively low infection prevalence observed (range of cestode prevalence: 0–18%, Figure 2). In contrast, the shallower depths of Willow, Lazy, and Rocky Lakes suggest that other ecological or evolutionary factors must account for the observed variation in cestode prevalence among these sites.
Schistocephalus solidus prevalence differed not only between lakes, but also across years within a single lake. The highest year-to-year variation was in Lazy Lake (CV = 134.09), followed by Willow Lake (CV = 89.62), Cornelius Lake (CV = 57.97), and lastly Rocky Lake (CV = 55.04). These fluctuations did not appear to follow consistent patterns across lakes, and it is possible that they are influenced by biotic and abiotic lake-specific factors. Supporting this notion, Heins et al (Reference Heins, Baker, Toups and Birden2010, Reference Heins and Baker2011) reported three temporally distinct S. solidus epizootics in Walby Lake and Scout Lake in Alaska, suggesting that different regional and lake-specific factors influence cestode prevalence. We observed a potential epizootic in Willow Lake that started in 2000 and ended in 2004/2005 (we are missing data for 2004), when the S. solidus prevalence decreased significantly. Additionally, we found a moderate positive correlation between parasite intensity (mean numbers of parasites per infected host) and cestode prevalence (data not shown here). We found no correlation between the cestode prevalence and PI, mean parasite weight, or heaviest parasite per fish (data not shown here). Surprisingly, the PI, which can be considered a measure of infection severity (Godin and Sproul Reference Godin and Sproul2011; Heins and Baker Reference Heins and Baker2003; Kurtz et al Reference Kurtz, Kalbe, Aeschlimann, Häberli, Wegner, Reusch and Milinski2004; Tierney et al Reference Tierney, Huntingford and Crompton1996) (discussed below), increased steadily from 1997 to 2005, even after the epizootic was over. This observation, however, aligns with previous research indicating an uncoupling of PI and cestode prevalence in the stickleback – S. solidus system (Heins et al Reference Heins, Baker, Toups and Birden2010). It is unclear what caused the potential epizootic in Willow Lake and what ended it. One mechanism that should decrease prevalence in trophically transmitted parasites is a reduction of suitable intermediate and/or terminal hosts (Heins et al Reference Heins, Baker, Toups and Birden2010, Reference Heins and Baker2011). Unfortunately, without copepod, stickleback, and piscivorous bird population density data, we cannot confirm if the end of this epizootic coincided with a crash in one or more host populations. None of the other lakes showed an epizootic during the study period.
Stickleback selectively feed on copepods, the first host of S. solidus, when the fish are still young (Christen and Milinski Reference Christen and Milinski2005; Heins et al Reference Heins, Eidam and Baker2015, 2016; Pennycuick Reference Pennycuick1971), and we would expect cestode prevalence to decrease with time due to mortality of highly parasitized fish. Previous work supports our assumption that S. solidus prevalence should decrease with age. Heins et al (Reference Heins and Baker2011) observed a decline in cestode prevalence, parasite intensity, and PI from ≤1-year-old to >1-year-old stickleback in Scout Lake. In line with this previous report, we did find that cestode prevalence differed between age groups in Rocky Lake – cohort 1996 (p < 0.001) and in the Cornelius Lake – cohort 1998 (p = 0.022) (Figure 3). However, our data suggest that this phenomenon may not be universal in all populations infected with S. solidus, as we did not find differences in cestode prevalence between ≤1-year-old and >1-year-old stickleback for the Cornelius Lake – cohort 1996 and Cornelius Lake – cohort 1997. It is worth noting that the initial cestode prevalence in these cohorts was already very low, which may have influenced the observed trends. Still, more data are needed to understand the generality of these patterns, and we recommend comparing the development of infections for more populations and cohorts.
Differences in the parasite index
To assess fibrosis-mediated resistance in the host, we analysed the PI, which serves as a proxy for infection severity, as S. solidus biomass should correlate with nutrient theft (Godin and Sproul Reference Godin and Sproul2011; Heins and Baker Reference Heins and Baker2003; Kurtz et al Reference Kurtz, Kalbe, Aeschlimann, Häberli, Wegner, Reusch and Milinski2004; Tierney et al Reference Tierney, Huntingford and Crompton1996). We found significant year-to-year differences in PI in Willow Lake stickleback, where the 2001 PI was significantly lower than in 2002 and 2003 (Figure 4). Interestingly, we observed PIs exceeding 100 in Willow Lake stickleback (Figure 4), indicating that the parasites in these cases were larger than the eviscerated hosts themselves. While parasites of this size are uncommon, S. solidus is well-documented for its ability to attain enormous sizes relative to the stickleback host (Arme and Owen Reference Arme and Owen1967; Benesh and Hafer Reference Benesh and Hafer2012; Lüscher and Wedekind Reference Lüscher and Wedekind2002; McPhail and Peacock Reference McPhail and Peacock1983; Pennycuick Reference Pennycuick1971; Tierney et al Reference Tierney, Huntingford and Crompton1996).
In contrast, PI remained consistent between years in Lazy Lake and Rocky Lake (Figure 4), although it is important to note that the small sample sizes in Lazy Lake limited our statistical power. While the cestode prevalence of all sampled lakes changed between years, this change is not reflected in the PI. This is surprising as we expected that factors that favour infection success should also favour parasite growth. However, it is important to keep in mind that various (a)biotic factors influence the transmission of S. solidus. While low encounter rates of host and parasite could lead to low cestode prevalence and PI, intrinsic host factors might influence parasite growth rate and infection success. Previous work supports the idea that PI and cestode prevalence are decoupled in the stickleback – S. solidus system (Heins et al Reference Heins, Baker, Toups and Birden2010). Heins et al (Reference Heins, Baker, Toups and Birden2010) observed an epizootic in Walby Lake stickleback (1998–2002) with cestode prevalence reaching 60%; the PI, however, remained low. Although they observed a significant correlation between infection prevalence and intensity among years, PI showed no correlation with either. We are currently not aware of additional studies that tracked the PI over several years.
The PI was not only consistent between years but also between age groups (Figure 5). This is not surprising, as infected stickleback still allocate resources towards growth (Christen and Milinski Reference Christen and Milinski2005). Previous work has shown that the growth rates of stickleback and their parasites co-vary (Barber Reference Barber2005), resulting in larger parasite masses in larger (or older) fish. The only statistically significant difference we found was in the Willow Lake – 2000 cohort, with younger fish having a higher PI compared to older fish (Figure 5). Unfortunately, we were not able to separate age groups in Willow Lake 1999 (due to low sample sizes), and therefore we do not know if the PI was already low in ≤1-year-old Willow Lake stickleback in 1999 (same cohort as >1-year-old stickleback in 2000). Additionally, the sample size in Willow Lake 2000 is very small (≤1yo: n = 4 and >1yo: n = 5); therefore, this result should be treated with caution. In conclusion, PI was very consistent across years, populations, and between age groups but uncoupled from cestode prevalence.
Differences in S. solidus fibrosis-mediated resistance
We analysed fibrosis formation as a measure of host resistance and detected fibrotic scar tissue in the body cavity of infected and uninfected fish from all four sampled lakes. Although we applied a method originally developed for identifying fibrosis in freshly killed stickleback (Hund et al Reference Hund, Fuess, Kenney, Maciejewski, Marini, Shim and Bolnick2022) and cannot fully rule out potential effects of fixation on scoring, our analyses are restricted to comparisons within this dataset. As all specimens had been fixed in formalin for at least 10 years at the point of dissection, we consider any influence of fixation to be negligible. While the percentage of fibrotic fish in Willow Lake, Rocky Lake and Lazy Lake appeared consistent between years, Cornelius Lake fish exhibited greater variation in fibrosis frequency over time (Figure 6, Figure S5). In 1997, only 9% of Cornelius Lake fish displayed fibrosis in contrast to 1998, where 63% of fish displayed fibrosis. To date, little information exists on year-to-year variation in fibrosis in stickleback, although some variability has also been observed in Alaskan stickleback populations (Bolnick et al Reference Bolnick, Eckert, Barrett, Choi, Haines, Hendry, Kerns, Lind, Milligan-McClellan, Peichel, Sasser, Thornton, Wolf, Steinel and Weber2026). In 1998, Cornelius Lake stickleback not only showed a high frequency of fibrosis but also the highest cestode prevalence in that lake during our sampling period; however, both infected and uninfected stickleback displayed equivalent frequencies of fibrosis. Only in Willow Lake 2000 did more uninfected fish than infected fish show fibrosis. Fibrosis formation has been associated with reduced cestode growth, cyst formation, and even cestode death (De Lisle and Bolnick Reference De Lisle and Bolnick2021; Weber et al Reference Weber, Steinel, Peng, Shim, Lohman, Fuess, Subramanian, Lisle and Bolnick2022) and can persist long after parasite exposure, even in uninfected stickleback (Hund et al Reference Hund, Fuess, Kenney, Maciejewski, Marini, Shim and Bolnick2022). Therefore, it is possible that uninfected, fibrotic fish were able to quickly resolve infection soon after exposure, while still showing signs of fibrosis when caught. However, fibrosis is also linked to injuries (e.g., injection of adjuvants) and other infections in stickleback (Steinel, personal communication; Hund et al Reference Hund, Fuess, Kenney, Maciejewski, Marini, Shim and Bolnick2022), so we cannot definitively make conclusions regarding fibrotic, uninfected stickleback. Unfortunately, due to low sample sizes, we were unable to quantify differences in fibrosis severity between infected and uninfected stickleback, highlighting the need for future research in this area.
Summary
The goal of this project was to identify spatial and temporal patterns in cestode prevalence of stickleback with the cestode S. solidus and to identify variations in measures of stickleback tolerance/resistance (i.e., PI and fibrosis formation) across populations. Overall, Rocky Lake and Cornelius Lake stickleback were very consistent in their responses, apart from fibrosis formation, which varied greatly between years in Cornelius Lake stickleback. In Willow Lake stickleback, we observed a high PI as well as a potential epizootic from 2000 to 2004/2005. Future research should prioritize collecting and correlating ecological data to better understand the factors shaping temporal patterns in S. solidus occurrences, which were not available to us. All 4 stickleback populations displayed fibrosis formation, a highly specialized form of parasite resistance. Moving forward, larger and more extensive long-term datasets are needed to understand population-level differences in fibrosis formation and development. Overall, our results show differences in cestode prevalence and measures of host tolerance between four Alaskan stickleback populations, laying solid groundwork for future research.
Supplementary material
The supplementary material for this article can be found at http://doi.org/10.1017/S0022149X26101734.
Acknowledgements
We extend our heartfelt gratitude to Susan Foster and John Baker for invaluable guidance during the early stages of this project. Their expertise and advice significantly contributed to the development and direction of our research. Special thanks go out to Katie Crowley, Jonathan Krauss, Nancy Vo, Elana Matulis, Anneilia Ottey, and Doreen Sampeur for their exceptional dedication and assistance with the laborious task of dissecting the fish required for this study. Their tireless efforts were indispensable in facilitating the data collection process. We are grateful to Dr. Kaitlyn Mathis and Dr. Robert Drewell for their insightful feedback throughout all stages of this work. We are deeply grateful to the unnamed former members and associates of the Foster/Baker Lab whose diligent work in the field enabled the collection of vital samples used in this study. Lastly, we respectfully acknowledge the Nipmuc people (MA) and Dena’ina Elnana and Dënéndeh tribes (AK) on whose land we conducted our research. We acknowledge their connection to the lands and express our respect for their cultures, traditions, and knowledge.
Financial support
This research was supported by the Department of Biology at Clark University.
Competing interests
There are no competing interests.
Ethical standard
The authors assert that all fish collections were approved by the Alaska Department of Fish and Game: SF-96-027; SF-97-052; SF-98-046; SF-99-071; SF2000-071; SF2001-064; SF2002-037; SF2003-078; SF2004-063; SF2005-064; SF2006-095.



 Open access

