It is well established that “institutions matter” in mitigating the uncertainties and costs of long-distance trade.Footnote 1 Threats of malfeasant and opportunistic behavior, exacerbated by uncertainty in the enforcement of property rights and contracts, are significant deterrents.Footnote 2 Institutions that increase trust, strengthen property rights, and improve contract enforcement make transactions in international trade increasingly secure and predictable.Footnote 3 However, the provision and effectiveness of these institutions is widely debated. Informal institutions, such as kinship networks, and formal state-enforced legal institutions are both shown to be historically important in enabling trade.Footnote 4 The growth of international trade is often explained by the strengthening of state capacity to enforce property rights and support the enforcement of multilateral agreements to promote free trade.Footnote 5 However, the effectiveness of national legal systems in enabling coherent and enforceable international commercial law is shown to be limited.Footnote 6 Economists and legal scholars have, instead, argued that private-order legal systems are, in many circumstances, more effective at promoting commercial exchange than are systems enforced by the state owing to their more flexible, expedient, and nuanced adjudicatory practices.Footnote 7
A critical limitation ascribed to private-order institutions is their lack of scalability, as they only govern those who subscribe to them. Yet private actors, in the form of self-governed voluntary organizations, have been shown to play an important role in the provision of scalable institutional frameworks to monitor and enforce commitments.Footnote 8 In the arena of international trade, this role is often fulfilled by trade associations, which have developed institutional frameworks that support market coordination and governance.Footnote 9 These can mitigate the effects of opportunistic behavior enabled by asymmetric information, and problems with standardization and contract enforcement, leading to improvements in the efficiency of exchange.Footnote 10
This literature raises important questions about the role and relative importance of nonstate actors and private-order institutional frameworks in the governance of international trade.Footnote 11 In this article, we examine the role of the Liverpool Cotton Brokers' Association (CBA), a private-order trade association, in facilitating the expansion of the global market for raw cotton in the nineteenth century. “King Cotton” remains of particular interest to business and economic historians as its production and use in textile manufacture is central to discussions of the Industrial Revolution and the first wave of globalization.Footnote 12 The trade for raw cotton linked global producers with brokers and merchants in the key market of Liverpool, who then supplied spinners and manufacturers in Lancashire. By the middle of the nineteenth century, Liverpool had become the largest raw cotton market in the world.Footnote 13 The growth of the cotton industry required a governance framework to reduce instability and improve the efficiency of exchange in a volatile commodity market.
Sven Beckert claims that the cotton trade depended on “a legal infrastructure devised and enforced by states.”Footnote 14 However, focusing on states neglects the vital role played by private organizations, particularly in Liverpool, its key node.Footnote 15 Specifically, Liverpool's cotton-broking community was instrumental in developing extensive and effective mechanisms for facilitating trade.Footnote 16 Formally constituted in 1841, the CBA emerged as the key body governing the market and evolved to establish and enforce the rights and duties of merchants and brokers.Footnote 17 Today, the majority of the world's raw cotton is still traded internationally under the bylaws and rules first established by the CBA in the nineteenth century.Footnote 18
This article documents the dramatic tenfold expansion of the Liverpool raw cotton market across the nineteenth century and identifies the major institutional innovations developed by the CBA from its inception in 1841 to those implemented to govern futures trade in the 1880s. Specifically, the article examines the following questions: How did participants in the Liverpool cotton market address the challenges of market exchange? What role did the CBA play in these processes? And what effect did it have on the coordination between supply and demand and on price volatility in the cotton market?
We show that the CBA improved the provision of information, standardized quality, contracting, and arbitration mechanisms, and created exchange platforms. This institutional framework enabled convergence around the association's laws, enhanced positive network effects, improved market coordination, and enabled rapid adaptation to technological change and exogenous shocks. We construct a long-run data set of cotton prices, imports, consumption, and stocks from 1811, when accurate data becomes available, to 1900, a number of years after the major innovations are completed. This allows analysis of the effects of the framework on the market. This data shows that market coordination, in terms of correlation between supply and demand, the amount of stock held in the market, and volatility of prices, improved significantly after the intervention of the CBA.
This analysis contributes to a number of debates. First, by identifying and quantifying the role of the CBA in improving market coordination and efficiency, the findings support claims of the importance of private-order institutions in the expansion of global trade and, further, highlight the importance of nonstate actors in explaining the processes of globalization.Footnote 19 The analysis also redresses concerns that explanations of the growth of the cotton market have marginalized the roles of merchants, brokers, and the Liverpool market.Footnote 20 Second, the article contributes to debates that identify the capacity of associations such as the CBA to exploit complementarities between market functions and negotiate convergence on standards, deepening our understanding of how private-order institutions achieve scale.Footnote 21 Finally, we show that at the crux of the CBA's success was its ability to develop and enforce a widely accepted cotton grading system. This was a pioneer of private-order standardization, which underpins many international industry and commodity standards today.
The article proceeds as follows: Section 2 explains the structure and evolution of the Liverpool cotton trade, the CBA, and our data. Section 3 discusses problems with trade in commodity markets and the mechanisms implemented to address these challenges in the Liverpool cotton market from 1811 to 1900. Section 4 discusses the effects of the intervention of brokers and the CBA on the cotton market. Section 5 provides a brief conclusion and suggestions for future research.
Evolution of the Liverpool Cotton Trade, circa 1800–1900
The second half of the eighteenth century was a period of rapid and sustained mercantile growth in Liverpool. Before the advent of the slave trade, Liverpool had been trading with the West Indies and Virginia in sugar and tobacco, so transatlantic links were well established. As a center of trade, the city was also well placed owing to its river and canal connections to Manchester, Lancaster, Yorkshire, and the Midlands. Liverpool came to importing cotton relatively late; for two hundred years the major source of raw cotton had been the Middle East, which predominantly traded via London through the Levant Company.Footnote 22 However, as demand for raw cotton increased from the Lancashire cotton industry, and could not be met by traditional sources, merchants began to look elsewhere for supplies.
At the end of the eighteenth century, the growing demand for cotton led to increased cultivation in Brazil, the West Indies, and the United States.Footnote 23 Brazil initially became an important source of cotton to Liverpool.Footnote 24 However, more importantly, Liverpool became the main destination for American cotton. The newly independent United States undertook a huge increase in cotton production, and Liverpool was able to exploit its links with the cotton-producing regions of the southern states to access these supplies.Footnote 25 By 1795, Liverpool had established itself as the leading center of cotton imports in Britain, linking international producers of raw cotton with consumers in the Lancashire cotton industry.Footnote 26
In this period, Manchester-based dealers were the principal buyers of cotton shipped to Liverpool and the primary middlemen in the market. Spinners would buy directly from dealers via public auctions or private sales after inspecting all the available bales at various warehouses in Manchester. Only occasionally were brokers involved, when commissioned by dealers or spinners to buy on their account or, as was predominantly the case, sell cotton on their behalf.Footnote 27
By the nineteenth century, as the cotton trade grew in size, spinners began to look directly to Liverpool importers, who now congregated daily outside the exchange building, rather than Manchester-based dealers. This soon led to an increased number of Liverpool-based cotton brokers facilitating the trade from 1810 onwards and a fall in the number of dealers. In 1815 there were 100 cotton dealers in Manchester, but by 1841 there were 112 Liverpool brokers and just 17 dealers.Footnote 28 In 1851 there were 161 cotton broking firms in Liverpool and by 1860 the figure had risen to 322.Footnote 29 By 1833, Liverpool received 90 percent of British imports of cotton, and by the middle of the nineteenth century, the Liverpool brokers had organized the largest raw cotton market in the world.Footnote 30
Cotton remained a highly disaggregated industry, with little vertical integration.Footnote 31 Hundreds of brokers intermediated exchange between thousands of producers and buyers. Coordinating and regulating exchange among these diverse and geographically dispersed participants became increasingly important. As the number of cotton brokers in Liverpool grew, they began to meet regularly, exchanging information on the market. From these weekly meetings the Liverpool Cotton Brokers’ Association was founded in April 1841, with the first president and vice president of the association elected in February 1842. Over time, the organization expanded to include a secretary and various committees.
Members had to have been active cotton brokers for at least three years, proposed and seconded by existing members, and subsequently voted on to gain entry. They paid an entrance fee of £50 and an annual subscription of £10.Footnote 32 In 1841, the membership comprised ninety cotton broker firms; however, the number of member firms was fluid and expanded over the century. Firms took on apprentices and family members joined as partners. Over time, partners often left to set up their own firms, resulting in many common family names appearing in the lists of brokers. Significant firms in the industry, such as Bateson, Buchanan, Holt, and Kearsley, encompassed numerous family members over several generations. However, there were also large numbers of new entrants.Footnote 33
On its launch in 1841, around 80 percent of brokers were members of the CBA. By 1882, 74 percent of brokers were members; the slight decline was due in part to the rapid expansion in the market resulting in the entrance of many new brokers, some of whom were ineligible for membership.Footnote 34 Still, across this period a majority of brokers were members of the association and bound by its contracts and bylaws relating to exchange.
Cotton market data. Changes in the structure of the raw cotton market in Liverpool and the emergence of the brokers' association needs to be contextualized with changes in the scale and stability of the market during the nineteenth century. These developments can be examined through annual market data collated by the brokers. We have constructed a new data set, from 1811 to 1900, with data on total cotton imported into Liverpool; total cotton sold to consumers; total cotton re-exported; total stock of cotton; and average prices of cotton. The figures from 1811 to 1870 are collected from George Holt & Co. Cotton Brokers’ reports; data from 1871 to 1884 are from Thomas Ellison; and data from 1885 to 1900 are from cotton circulars of the Liverpool Cotton Association.Footnote 35
In these sources, import and export figures were calculated from the returns published by the Custom House. Stocks were determined at the end of each year by collecting data from merchants, brokers, and dealers who were known to have imported cotton or facilitated the trade of imported cotton. For a number of years at the start of the century these returns were incomplete, but in 1811, George Holt announced that all problems had been overcome and that the accuracy of figures could not be questioned. Statistics were collected on a weekly basis; brokers that specialized in selling cotton gave an account of all the cotton sold, while those that specialized in buying cotton gave an account of purchases for export and speculation, the difference being cotton bought for consumption.Footnote 36
Figure 1 highlights the significant growth in scale of the Liverpool raw cotton market over the nineteenth century. This figure shows that annual imports of cotton to Liverpool grew tenfold between 1811 and 1900, from 323,231 packages in 1811 to 3,577,000 in 1900, while the market value of these imports rose from approximately £5.2 million to approximately £41.3 million in the same period.Footnote 37 However, it is also clear that this growth was accompanied by periods of significant volatility, with downturns in the 1840s, 1860s, 1870s, 1880s, and 1890s. Figure 2 shows the average annual price of cotton sold in Liverpool, revealing an overall decrease in the price across the century. However, it also highlights the volatility in the market, particularly in the first few decades of the period and during the American Civil War (1861–1865).
Liverpool annual cotton imports and sales, 1811–1900
Notes: Packages are the number of packages or bales of cotton. Consumption is the amount directly bought by spinners. The export data is for re-exports predominantly to Europe. (Sources: 1811–1870 figures from George Holt & Co. Cotton Brokers’ Reports, MD 230, LRO; 1871–1884 figures from Thomas Ellison, Cotton Trade of Great Britain [London, 1886], statistical table 1; 1885–1900 figures from Cotton Circulars of the Liverpool Cotton Association, 380 COT/2/48, LRO.)

Liverpool cotton prices (annual, per lb), 1811–1900
Notes: Upland is the average annual price of American Upland cotton. Pernam is the average annual price of Brazilian Pernam cotton. Surat is the average annual price of Indian Surat cotton. (Sources: 1811–1870 figures from George Holt & Co. Cotton Brokers’ Reports, MD 230, LRO; 1871–1884 figures from Thomas Ellison, Cotton Trade of Great Britain [London, 1886], statistical table 1; 1885–1900 figures from Cotton Circulars of the Liverpool Cotton Association, 380 COT/2/48, LRO.)

Variation in Liverpool Cotton Trade, 1811–1900

Source: 1811–1870 figures from George Holt & Co. Cotton Brokers’ Reports, MD 230, LRO; 1871–1884 figures from Thomas Ellison, Cotton Trade of Great Britain (London, 1886), statistical table 1; 1885–1900 figures from Cotton Circulars of the Liverpool Cotton Association, 380 COT/2/48, LRO.
Notes: Imports are the number of bales of cotton imported; consumption is the number of bales bought by consumers, such as spinners. St.Dev is the standard deviation of annual imports and consumption. CV is the coefficient of variation.
The extent of the fluctuations in supply and prices, evident in Figures 1 and 2, reveal the challenges with market coordination faced by the Liverpool cotton market. In order to facilitate its growth and development, demand and supply of cotton needed to be efficiently coordinated, to avoid market gluts or famine and subsequent increases in trading costs and volatility in prices.
The changes in the location, organization, and scale of the market raise various questions. How did specialist Liverpool brokers and the privately organized CBA govern the cotton trade? How did the change in market organization correspond to the evolution of the market? To address these questions the article identifies four key challenges faced by participants in coordinating exchange—information, standardization, contracting, and mechanisms of exchange—and examines the functions that Liverpool brokers and the CBA developed to address these challenges.
Institutional Solutions: Evidence of Market Coordination in the Liverpool Cotton Market
Information. The coordination of global commodity markets was dependent on the exchange of information between the participants. Beckert describes exchanging information as “the core of most merchants’ activities. A vast swath of information was potentially relevant to any merchant.”Footnote 38 Levels of production, quality, demand, and prices were all crucial pieces of data, as was information about who was reliable and trustworthy in the supply of goods and credit.Footnote 39 In the early nineteenth century, flows of information were constrained by the slow speed of travel, poor-quality reporting, and a lack of trust in the veracity of the data. The resultant information asymmetries complicated market coordination and increased opportunism.Footnote 40 Across the nineteenth century, a range of innovations, including improvements in transportation, the invention of the telegraph, and developments in commercial media, increased and sped up flows of information.Footnote 41 Merchants experimented with organizational forms and networks to improve the quality of and trust in transmission.Footnote 42 As the scale of markets increased, the need for more formalized channels for collecting and disseminating information grew.Footnote 43
It is notable that the CBA emerged from efforts to collect and disseminate accurate information on raw cotton. At the end of the eighteenth century, individual brokers had started to collate details on Liverpool commodity markets, which were sent to their clients. In 1805, the brokers Ewart and Ruston included cotton data in their general circular, while Samuel Hope produced the first cotton-specific publication. It drew on government statistics and data provided by other brokers and merchants to include quantities of imports from different regions and their spots prices. These reports were expanded over time to include quantities re-exported and the volume of trade held for speculation.Footnote 44
The gathering of data for these reports was increasingly systematized through cooperation among the larger brokers.Footnote 45 They collaborated in the collation of the data, using the same statistics in their reports, but each broker provided their own interpretation of market conditions and prospects. Ellison claims that it was from the practice whereby “every Friday morning the brokers met together in the saleroom of the firm whose turn it was to collect the sales, and at this meeting the figures were called out” that the association was born.Footnote 46
From 1850, data collation was formally undertaken by the association, with the secretary appointed to oversee collation and publication. Of the initial ninety members, eighteen were appointed to collect and report on the weekly raw cotton sales.Footnote 47 A system of pro forma return sheets detailed the information required from each broker.Footnote 48 Any firm that failed to submit the return sheet was fined.Footnote 49 The accuracy of this information was of paramount importance, so much so that no weekly figures were published when one prominent firm temporarily left the association and therefore did not forward its data to the CBA.Footnote 50
There were periodic investigations to ascertain the data's accuracy—one report noted that at times negligence in reporting had affected the data—but the reporting system was regarded as robust.Footnote 51 Similarly, there was ongoing debate among the membership as to how to calculate the statistics to most accurately reflect the market.Footnote 52 The CBA rejected calls to abolish the publication of speculation statistics, stating that circulars would be incomplete without this data and that the association was eager to publish “the most correct and reliable statistics.”Footnote 53 By the 1860s, alongside the weekly circular, daily tables of sales and imports were also published, which in 1874 became the daily circular. These were accompanied by an annual report in December, an American crop report in September, and the daily advices cable from the United States issued each morning.Footnote 54 Through these developments, the CBA centralized the supply of information to the Liverpool cotton market, improving the quality, speed, and veracity of supply. Critical information on all aspects of the market was available to all participants, significantly reducing information asymmetries.
The importance of the information published by the CBA spanned far beyond Liverpool. Merchants in Bombay, New Orleans, and New York eagerly awaited news on Liverpool prices, while Liverpool prices were the single most significant piece of news, “bordering on obsession,” on plantations throughout the American South.Footnote 55
Standardization. Today, standards apply to many goods, industries, institutions, and markets and are critical to most economic transactions.Footnote 56 Thousands of standard-setting organizations set hundreds of thousands of industrial standards and grading systems internationally.Footnote 57 Standardization has been proven to have a positive impact on a number of key economic outcomes. For example, the adoption of international standards has been shown to increase trade and innovation, and connections have been established between standardization within economies and overall productivity and economic growth.Footnote 58 The majority of these industrial standards have been developed relatively recently, and many have been developed and managed by private-order initiatives, including many of those most familiar, as evidenced by standards such as USB, Wi-Fi, HTML, MP3, and hotel ratings.Footnote 59
In commodity markets such as raw cotton, in which quality was heterogeneous, a lack of quality assurance meant that participants were susceptible to opportunistic behavior and the threat of being sold a “lemon.”Footnote 60 This increased the cost of contracting and discouraged buyers and sellers from entering the market, limiting participation and reducing the market's value.Footnote 61 Quality of raw cotton was primarily determined by the length and uniformity of the staples, with longer staples proving more efficient for spinning, as well as by color. The diversity among qualities was a major determinant of the price; therefore, to ensure that buyers and sellers could accurately identify the quality of cotton in the market, classification and standardization of the different grades was required.Footnote 62 Yet achieving convergence on standards often required negotiation and conciliation between competing interests.Footnote 63
As early as 1775, raw cotton in England began to be categorized by its place of growth, such as American, Indian, or West Indian. It is suggested that Joshua Holt attempted the first systematic grading of cotton in England around 1775.Footnote 64 By 1800, grades such as “middling” and “common,” similar to those found in other commodities like indigo, first appeared in Liverpool.Footnote 65 However, these categories were approximations, not widely used, and not precisely defined or enforced.
For standardization to work, purchasers had to be able to verify the quality of the cotton they had purchased. Conventions regarding the more careful packing of bales in the United States allowed Liverpool brokers to establish selling by sample, eliminating the need for the inspection of all bales in the warehouses of Manchester. However, as the scale of the trade expanded, informal rules and conventions used to define and verify quality became less effective. There was growing demand from manufacturers and traders for formalized institutions to oversee these processes and for rules with “some sense of permanence.”Footnote 66
In response to these demands, soon after its formation the CBA quickly moved to put in place formal rules detailing specific mechanisms for defining and enforcing standardized grades. All cotton sold by sample had to be graded for quality.Footnote 67 Standards for “fair” and “middling” cotton were explicitly defined by elected officials of the association, who also regularly examined samples to verify their grade.Footnote 68 Throughout the nineteenth century, the association undertook the periodic revision of the standards and processes for grading cotton.Footnote 69
Standardization of the weight of cotton bales was also necessary. Inconsistent bale weights made contracting difficult, as did the opportunistic practice of “false packing,” which saw sellers pad out the weight of raw cotton with crushed seeds and other detritus. In 1842, the CBA reported on these issues and specified that bales should be standardized at 400 lbs and that “all the buyers in the United States enforces the marking of every bale of cotton with the names and address of the planters” to reduce the threat of false packing.Footnote 70 In August 1843, the association stipulated that sellers had to state on tickets attached to cotton samples whether the cotton was stored in a warehouse, cellar, or shed, as this could also potentially affect weight and value.Footnote 71
Classifications were of limited value in and of themselves unless enforced. Upholding the new standards required systems of assurance and arbitration. As early as October 1842, the CBA established a dispute mechanism that used a committee drawn from the membership to assess claims relating to misclassification of quality and weights.Footnote 72 The process of arbitration was later codified in the association's constitution and laws. The decisions made by the arbitrators were binding after the exhaustion of appeals to the association's committee.Footnote 73
The influence of the CBA's efforts to standardize trade was not limited to Liverpool. There were further efforts to ensure that these new standards were applied internationally. In 1846, the American Chamber of Commerce in Liverpool, founded by Liverpool merchants trading with the United States, requested that brokers “cause samples of the several classes of American cotton to be taken, to be placed at the disposal of the American chamber so as to form a standard for reference in all questions as to quality of cotton.”Footnote 74 In 1848, the New Orleans Chamber of Commerce contacted the American Chamber of Commerce to propose that a mutual set of quality classifications be maintained on both sides of the Atlantic, citing problems in New Orleans caused by the lack of “fixed standard of quality uniform with that in Liverpool” and recognized as such by the trade in both ports.Footnote 75 The New York Exchange, the other major market for cotton in the United States, also adopted the Liverpool standards in 1853 and was eventually followed by all other U.S. cotton exchanges.Footnote 76
The development of a standardized grading system in the Liverpool cotton market preceded that of the famous Chicago Board of Trade (CBOT), whose grading system for wheat was developed in the decades after its establishment in 1848, seemingly independent of events in Liverpool and, in contrast with the Liverpool cotton market, with the help of state and federal legislation.Footnote 77 There were no consistent market reports or standard grades in the early days of the CBOT.Footnote 78 It was not until 1856 that a resolution attempting to identify standard grades was passed.Footnote 79 However, the board and grain associations failed to enforce consistent standards, and as a result, state legislation was introduced to enforce grading from 1871.Footnote 80 After persistent problems, federal control of grade standards finally ensured uniformity in grading and inspection, with the Grain Standards Act 1917.
By developing an internationally used cotton grading system in the 1840s, the CBA was among the pioneers of the private-order standardization that underpins many industries today. Within the cotton trade, further private-order institutions emerged such as those to standardize yarn developed by the Manchester Chamber of Commerce.Footnote 81 In contrast to the CBOT, the CBA was able to successfully influence and manage the majority of market participants to rapidly converge on their goal of consistent standards in the cotton market, without direct intervention of the state.
Contracting. Issues of enforcement became more pressing in Liverpool as the scale of the market grew across the nineteenth century and the number of participants increased. Between the planters and spinners, the range of intermediaries expanded, with import and export merchants joined by brokers acting for both buyers and sellers. As a result, uncertainty grew, particularly as the scope for opportunistic and malfeasant behavior increased with the number of participants and transactions. To reduce these costs, improve coordination, and converge on consistent standards, the market required enforceable contracts.
Informal conventions underpinned by reputational effects could provide mechanisms to control the activities of market participants, determining acceptable behavior, without the need for costly legal enforcement. Contemporary commentator Thomas Ellison noted that for some years after the formation of the CBA, “the business of the market was conducted on the lines of an unwritten code, which clearly defined the functions, and plainly set forth the rights and duties, of both merchants and brokers, in their individual capacities and in their conduct towards each other.”Footnote 82 Conventions delineated the role and responsibilities of brokers and merchants and included the separation of brokers into those that specialized in buying and those that specialized in selling, to reduce conflicts of interest.
Ellison claimed that “there was universal trustfulness; all transactions were plain, honest and above board.”Footnote 83 While this claim is almost certainly overblown, these conventions, including the restriction of membership in the CBA to experienced cotton brokers or those who had served an apprenticeship with a cotton broker, built trust among participants through socialization, owing to their shared experiences and background. Likewise, the fact that numerous cotton broking firms had family ties is also likely to have helped monitor and enforce acceptable behavior. Those who failed to conform risked their reputation and possible exclusion from the market by other participants. These factors potentially allowed contracting disputes to be resolved through unwritten “gentlemanly” etiquette.Footnote 84
However, as the market continued to grow, rather than rely on unwritten moral codes, the CBA sought to formally define the rules and conventions of the market. Alongside the efforts to standardize qualities and weights, early meetings of the association were devoted to establishing the remit of brokers and the rates they should charge for their services.Footnote 85 Indeed, discussions were undertaken in 1843 with the various Chambers of Commerce in the key cotton markets to establish regulations “eligible for the governance of all.”Footnote 86
Ellison suggests that the functioning of the market changed fundamentally in the early 1860s. The American Civil War and subsequent cotton famine led to “gigantic” speculative transactions resulting in numerous disputes.Footnote 87 In light of these developments, the CBA sought to further officially formulate the organization of the trade. To support the regulation and standardization of transactions, a committee was appointed on January 16, 1863, to draw up “The Constitution, Laws, and Usages of the Liverpool Cotton Brokers’ Association.” The resulting publication documented market governance over a whole range of issues, including arbitration and appeals, brokerage, circulars, “to arrive” contracts, delivery, insurance and fire risks, invoices, payments, returns for false packing, sampling, short weight, standards, stock taking, tare, and draft.Footnote 88 The extent to which the constitution introduced new regulations is unclear; it is likely that it formally codified many existing practices.
While the Civil War brought about an increase in the trade of cotton “to arrive” forward contracts, it was the reduction in communication times brought about by the newly operational transatlantic telegraph cable established in July 1866 that led to a rapid increase in the trade of cotton for future delivery and a fundamental change in how cotton was traded. The volume of this new method of trading resulted in practical difficulties that required more comprehensive rules and mechanisms to facilitate the settlement of futures transactions.Footnote 89 Soon the CBA produced a much more comprehensive set of rules of business to govern the rapid expansion in the use of futures contracts.Footnote 90
These rules were accompanied by the introduction of various pro forma contracts “to arrive” and “to deliver.” The contracts were a standardized form to be completed by the participants, with the specific CBA rules governing different transactions on the reverse.Footnote 91 This laid out the processes for completion and payment, as well as the rights of the buyers and sellers. Further pro forma contracts were introduced for freight and insurance.Footnote 92 The structure of the contracts was negotiated with the American Chamber of Commerce and the United Cotton Association in a further effort to ensure standardization across the market.Footnote 93
These contracts were only useful if they could be enforced. As with the adjudication and enforcement of standards, after a right of appeal, directed to the committee, the decisions were final and binding. The right to the arbitration and appeals process was only available when both parties to a transaction were members of the association, and it was a condition of membership to abide by the decisions; failure to do so could result in expulsion from the association.Footnote 94
The CBA took enforcement of the regulations seriously. In 1843, an extensive investigation was launched into the behavior of two brokers, Mr. Wood and Mr. Briddon, following accusations that they had purchased cotton in the name of a buyer, Mr. Pilkington, without his knowledge.Footnote 95 The brokers defended themselves by claiming they had a standing agreement with the buyer to undertake purchases for him when they thought market conditions expedient. However, they were unable to produce letters or contracts to confirm the arrangement. Although this was claimed to be standard operating practice, the members of the association deemed it a breach of regulations and expelled the brokers.
Private-order contracting solutions were adjudged to be preferable to state-supplied ones as they avoided the need for enforcement through the courts and lowered the costs of going to law.Footnote 96 Those defining them knew and understood the market and its participants and were more responsive to market changes. The complexities and ambiguities arising from disputes could be settled more effectively and efficiently by mercantile experts than by lawyers and judges.Footnote 97 Although the CBA's constitution retained a clause that allowed enforcement to be referred to courts of law, in instances when disputes were taken to court it typically resulted in the recommendation that the CBA settle the matter.Footnote 98 In late 1882, the association's president noted that it had been a very long time since a dispute relating to cotton had been heard in the Liverpool Crown Court, and it was anticipated that this would remain the case.Footnote 99 When disputed, courts around the world continue to defer to the rulings of the association today.Footnote 100 These private-order contracting solutions implemented by the CBA increased the ability of the association to coordinate and manage all market participants, including related international trade bodies.Footnote 101
Mechanisms of exchange. Without centralized structures and mechanisms to coordinate exchange in commodity markets, market participants are dependent on individually finding buyers or sellers when required. A lack of these structures increases information asymmetries and makes it difficult to establish standardized prices for goods, raising the costs of exchange. In addition, when the needs of market participants are not perfectly synchronized, price uncertainty can increase. These problems were exacerbated in the early Liverpool cotton market because producers of raw cotton in the southern U.S. states and consumers of cotton in the Lancashire cotton industry were separated by distance and time. Cotton production was also affected not only by the prevailing harvest conditions but also by war. Such a dispersed and changing trading structure, where market participants have little certainty as to whom the buyers and sellers are at any point in time or their exact requirements, can dramatically increase transaction costs.Footnote 102
The Liverpool cotton market faced the challenges of organizing exchange to enable producers and consumers to easily identify each other, synchronize demand and supply, allow accurate price discovery, and therefore reduce inefficiencies and encourage trade. During the infancy of the cotton market, Manchester-based dealers were the primary middlemen in what initially operated as an auction or over-the-counter market.Footnote 103 Spinners would make their purchase from dealers after the costly process of inspecting all the available bales at various warehouses in Manchester.Footnote 104 As the market increased in size, Liverpool cotton brokers increasingly organized trade on the behalf of importers and consumers and soon became the main intermediaries. The import merchant (seller) benefited from employing a broker who could communicate the needs of manufacturers and was better able to find buyers. Likewise, for the buyer, the broker was able to improve access to all the cotton for sale, reducing search costs. Selling by sample, brokers could have as many as 150 samples available for inspection, eliminating the need to visit several dealers to inspect cotton.Footnote 105 Brokers also extended credit by paying freight, import duties, and insurance, as well as processing bills of exchange.Footnote 106
Significantly, in the second half of the century, the Liverpool cotton market saw two further adaptations to the modes of exchange. The first was the expansion in the use of forward contracts, which had slowly grown in importance since the early nineteenth century.Footnote 107 Improvements in ship speed enabled news, samples, and buying decisions to flow faster than the passage of the cotton. Some cotton cargos, therefore, were traded in advance of arrival, creating what was known as the “arrivals market.” Although this type of contract was still rare before the American Civil War, the CBA soon established formal rules to govern this trade.Footnote 108
The second and more significant development in exchange was the emergence of a futures market in the mid-1860s, enabled by the convergence of two factors. First, the cotton famine and American Civil War increased production uncertainty and led to increased price volatility. Second, communication between Liverpool and the main U.S. markets was dramatically improved by the completion of the transatlantic telegraph cable in 1866. The possibility of near instantaneous pricing of cotton in the United States and the growing desire to “hedge” against movements in the price of cotton in transport led enterprising brokers to develop futures contracts on raw cotton that had yet to be shipped.
Futures trading led to a major change in exchange and the method of moving raw cotton from America to Europe, allowing market participants to synchronize trade requirements and reduce price uncertainty.Footnote 109 Brokers could purchase U.S. cotton at the prevailing price for future delivery while at the same time issuing a futures contract in the arrivals market in Liverpool. This mechanism allowed both producers and consumers of cotton to hedge risk more effectively by ensuring price certainty; however, it also attracted participants purely focused on speculation.Footnote 110
While the development of futures trading facilitated exchange by enabling price certainty in advance of delivery, inefficiencies developed because of the sharp increase in the volume of trade. Contracts often changed hands multiple times before the date of delivery, which made it increasingly difficult to close transactions between the original seller and final buyer. At any step of the chain, delays in passing invoices or payments could seriously inconvenience other participants, and delays of between fifteen days and six weeks were common.Footnote 111 Recourse to law was expensive and time consuming. Similarly, brokers would have to settle and chase up numerous invoices requiring cash settlements, further reducing the efficiency and increasing the costs of using the futures market.
Recognizing these emerging challenges, the CBA developed new exchange mechanisms to increase the efficiency of futures trading and lower the costs of completing these contracts. The Cotton Clearing House was established in 1876 to provide a centralized exchange where all futures transactions could be reconciled efficiently. In effect, this process linked the first seller to the last buyer, with balances certified by clerks and cash payments made on the balance.Footnote 112 The reduction in the risk made possible by hedging with futures contracts also led to increases in the margins of credit offered by brokers.Footnote 113
The success of the clearinghouse for contract settlement led directly to the next step in the institutional organization of the CBA: the establishment of the Liverpool Cotton Brokers’ Bank in 1878. Prior to the bank, all settlements were finalized in cash, meaning £100,000 to £150,000 was carried around the market each day, with losses through misadventure and embezzlement common.Footnote 114 The bank reduced this risk and inefficiency by introducing a system of “credit vouchers,” eliminating the need for cash to change hands. Spinners, too, were able to benefit from the system by making their payments to Liverpool brokers and merchants via their own banks, all of which had accounts with the Bank of England, which linked to the Cotton Brokers' Bank.Footnote 115 The bank and clearinghouse were amalgamated so that all payments for futures were paid through the bank and distributed by credit vouchers instead of cash, over the counter of the clearinghouse.
The final adaptation to the exchange mechanisms in this period was the introduction of a Settlement Association, formed in 1882 and formally adopted by the CBA in 1884.Footnote 116 This further reduced risk of exchange by preventing brokers from taking positions beyond their available capital, which occurred in attempts to corner or squeeze the market. Periodic settlement required margin calls to ensure all brokers had capital reserves proportionate to their positions. Although clear issues with efficiency existed in the nascent futures market, the futures contracts and the associated infrastructure developed by cotton brokers enabled greater price certainty for market participants and massively increased the volume of overall trade in the market.Footnote 117 While some trading for future delivery occurred in the Liverpool cotton market as well as in other commodity markets in the United States and Europe long before the American Civil War, the CBA was very early in adopting formal rules and creating institutions to regulate this trade—features that remain central to modern commodity markets.Footnote 118
The CBA was able to adapt and use these platforms of exchange to further extend its influence over the market. Initially, access to the clearinghouse and the use of futures contracts had been restricted to members of the CBA. This had seriously affected the profitability of the merchants, who threatened to launch a rival association and exchange in response. Instead, negotiations led to the amalgamation of the two groups under a new name, the Liverpool Cotton Association. This increased the number of participants using the platform of exchange and bound by the laws of the original association, further deepening the network effects and the authority of the association.Footnote 119
Effects of the CBA on the Liverpool Cotton Market
The Liverpool brokers and the CBA emerged as an effort to reduce market inefficiencies arising from the large and growing uncertainty and informational asymmetries between participants in the cotton market. From its inception in 1841, the CBA established an institutional framework that sought to improve the coordination of the market. If the mechanisms introduced by the CBA did reduce problems of exchange and improve market coordination and efficiency, this should be reflected in a more highly correlated relationship between supply and demand. Figure 3 shows the year-on-year percentage change in the levels of imports and consumption. Fluctuations in the change of imports can be driven by variation in the annual crop and exogenous shocks but also by efforts to stabilize supply and synchronize it with demand. Between 1811 and 1840, there were thirteen years when the change in import levels in either direction exceeded 20 percent. It took the remainder of the century for this scale of variation to occur in a further thirteen years, of which four were during the American Civil War. Before 1841, the correlation between consumption change and import change was 0.43; this increased to 0.70 in the period after 1841.Footnote 120
Annual change (%) in consumption and imports in Liverpool cotton, 1811–1900
(Source: 1811–1870 figures from George Holt & Co. Cotton Brokers’ Reports, MD 230, LRO; 1871–1884 figures from Thomas Ellison, Cotton Trade of Great Britain (London, 1886), statistical table 1; 1885–1900 figures from Cotton Circulars of the Liverpool Cotton Association, 380 COT/2/48, LRO.)

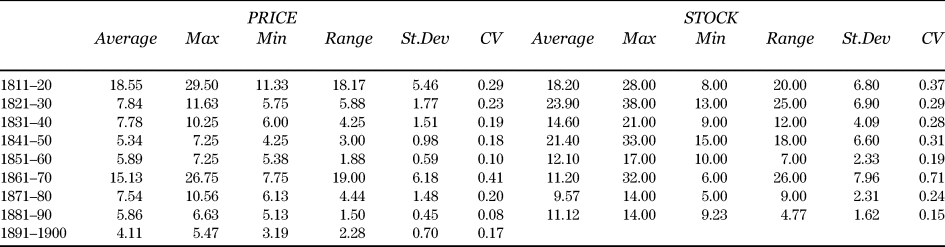
Table 1 shows that while the volatility of imports and consumption, expressed as a coefficient of variation, remained approximately the same or even increased in the decades before the establishment of the CBA, this volatility decreased consistently in each decade after 1841. The American Civil War caused a significant spike, but the following decade saw a further rapid decline in volatility.
A second indicator of improved coordination is the level of stock held in the market. Although raw cotton was not perishable and thus could be stored for some time without a decline in quality, an efficient market would operate with a minimal level of stock to reduce the tying up of capital by participants. Figure 4 shows the average level of stock held in the market measured in weeks of supply. The stock of American cotton declined from an average of 18.2 weeks in the decade from 1811 to 1820 to 11.12 in the decade from 1881 to 1890 (Table 2). In the same two decades the volatility in the level of stock, expressed as a coefficient of variation, also declined, from 0.37 to 0.15, respectively (Table 2). The decadal period including the American Civil war saw the mean stock decrease but volatility significantly increase—an expected result in light of the dramatic shifts in supply. As with the data on imports and consumption, the decade after the Civil War saw a decline in levels and volatility.
Average weekly stocks of American cotton in Great Britain, 1811–1890
Note: Figures are the annual average of reported weekly stocks. (Source: 1811–1870 figures from George Holt & Co. Cotton Brokers’ Reports, MD 230, LRO; 1871–1884 figures from Thomas Ellison, Cotton Trade of Great Britain (London, 1886), statistical table 1; 1885–1900 figures from Cotton Circulars of the Liverpool Cotton Association, 380 COT/2/48, LRO.)

Liverpool Cotton (Upland) Prices and Stock Volatility, 1811–1900
Source: 1811–1870 figures from George Holt & Co. Cotton Brokers’ Reports, MD 230, LRO; 1871–1884 figures from Thomas Ellison, Cotton Trade of Great Britain (London, 1886), statistical table 1; 1885–1900 figures from Cotton Circulars of the Liverpool Cotton Association, 380 COT/2/48, LRO.
Notes: St.Dev is the standard deviation of annual average prices and stock. CV is the coefficient of variation of annual average prices and stock. Stock data after 1891 was not disaggregated by region, reporting instead a total market figure.
Finally, a hallmark of a well-functioning market is low price volatility. It would be expected that improvements in the institutions that facilitate market coordination and trade would be reflected in improved price stability, as the costs associated with exchange fall and the market becomes more efficient. Table 2 documents average prices and price volatility of the Liverpool cotton market at decadal intervals across our period of study.
The trends shown in Table 2 are similar to those already identified, with a steady decline in average prices and volatility prior to 1861, a sharp increase in response to the American Civil War, and subsequent rapid reduction in the following decades. The volatility of prices for American uplands cotton, as expressed by the coefficient of variation, fell from 0.29 in the decade from 1811 to 1820 to 0.19 in the decade from 1831 to 1840. Following the establishment of the CBA, price volatility fell even further, to 0.10 in the decade prior to the Civil War. Price volatility falls to 0.20 in the decade following the war. Although this coefficient of variation is slightly higher than prewar levels, it reflects a number of shocks that affected the cotton market in the 1870s, including the Franco-Prussian war, the failure of some cotton firms, and a provincial banking crisis, leading to a period between 1873 and 1878 that Ellison described as “an uninterrupted struggle.”Footnote 121 This may also be indicative of the increased frictions associated with the early futures market, counteracting some of the potential benefits of the telegraph and futures trade in terms of price stability, as discussed above.
Table 3 compares the price volatility of cotton before and after the establishment of the CBA. Tests for the equality of variances show that price volatility was lower in the period after the establishment of the CBA. This difference is statistically significant at the 5 percent level including the war and at the 1 percent level excluding the war and in the period before the war.
Liverpool Cotton (Upland) Price Volatility before and after the CBA

Source: 1811–1870 figures from George Holt & Co. Cotton Brokers’ Reports, MD 230, LRO; 1871–1884 figures from Thomas Ellison, Cotton Trade of Great Britain (London, 1886), statistical table 1; 1885–1900 figures from Cotton Circulars of the Liverpool Cotton Association, 380 COT/2/48, LRO.
Notes: St.Dev is the standard deviation of annual average prices and stock. War = 1861–1865. *, **, and *** indicate statistical significance at the 10%, 5%, and 1% levels following F-tests for equal variances.
In total, the data suggests a significant improvement in market coordination across the nineteenth century. These improvements coincide with dramatic growth in the scale of the market (Figure 1). From 1811 to 1841, the number of bales of cotton imported annually increased by over one million. Between 1841 and 1900, the number of bales imported annually further increased by approximately three million. Although geographical advantages of Liverpool and technological factors related to the Industrial Revolution undoubtedly played an important role in driving the growth of this market, growth was aided by market improvements introduced by Liverpool brokers.
Improvements prior to 1841 were facilitated by the shift to a market structured around the Liverpool brokers and the informal arrangements they developed to mitigate exchange problems. As Liverpool cotton brokers became the key middlemen in the market, they centralized exchange and made important improvements to the flow of information. Buyers and sellers were no longer required to undertake the costly process of visiting numerous Manchester dealers before organizing their trades, while the publication of brokers’ circulars and attempts to define quality standards, although informal, both reduced information asymmetries.
The additional market improvements after the establishment of the CBA in 1841 stemmed from further improvements to information flows, the introduction of standardization and contracting regimes, and the development of exchange mechanisms to reduce price uncertainty. Yet, to successfully impact the market, the CBA had to overcome the issue of scalability associated with private ordering, as it required a significant number of market participants to subscribe to these institutions and converge on standards and platforms. Analysis of how the CBA extended its reach and influence over a large number of market participants deepens our understanding of how private-order institutions achieve scale and provides insights into their success and persistence.Footnote 122
It is notable that the CBA emerged from the desire among brokers to cooperate in the processes of data collection and information dissemination. In the case of information reporting and dissemination, the CBA improved the quality but more importantly standardized and extended the reach of a key market function. Similarly, innovations in quality standardization and exchange platforms were developed through purposeful interaction with similar bodies in Manchester, New York, and New Orleans and groups representing interests in continental Europe, Brazil, and India, while engaging with other market participants including merchants and spinners, to converge on these standards and platforms. From its inception, members of the CBA explicitly sought “to establish by general consent of the trade such regulations as shall be deemed eligible for the governance of all.”Footnote 123
This raises the question, Why was the CBA so successful in encouraging market participants to converge on these rules and standards? As a self-organized association, it was able to exploit both formal and informal mechanisms to enforce and influence market participants. Informal reputational mechanisms, strengthened by the CBA's ability to exclude brokers from the market, were effective incentives and deterrents among a self-selecting group of participants, while mechanisms of arbitration formalized the association's capacity to enforce standards and contracts. The CBA also possessed the key advantage of private actors and the requisite expertise and knowledge to define practices and standards. This would have accumulated over time and further strengthened the informal reputational strength of the CBA among other market participants.
The success and persistence of the CBA can also be attributed to its development of a range of complementary institutional functions, which, when combined within the same framework, reinforced positive network externalities. This made access to these institutions particularly valuable and encouraged adherence to the association's rules. The combination of functions related to information provision, standardization, and contracts gave the association a deep understanding of the market and the capacity to motivate market participants to adopt new standards and innovations. This also enhanced the CBA's ability to adapt to exogenous shocks.
Adaptability was notable in the CBA's response to the American Civil War, the subsequent cotton famine, and the introduction of the transatlantic cable. The volatility caused by the war incentivized innovation through futures contracts to limit price risk, yet efficient implementation required the infrastructure of a market exchange, clearinghouse, and settlement system for contract completion. In less than twenty years, the association moved from introducing basic regulations to coordinate forward trade in cotton to establishing the centralized exchange and associated infrastructure for the first modern futures market.
The growth in the use of futures and related exchange platforms led to fundamental changes in the market toward the end of our period of study. Beckert notes, “The importance of old-fashioned importers, brokers, and factors within the empire of cotton declined even more as the global cotton trade was increasingly dominated by a small number of cotton exchanges.”Footnote 124 The formalized exchange platforms that emerged in Liverpool, New York, and New Orleans allowed participants specializing in futures speculation to become increasingly dominant. Yet the association continued to adapt, remaining central to the development of the institutional framework that regulates the raw cotton trade to the present day. Indeed, the capacity of such private-order institutions to understand and adapt to market needs, while enabling and enforcing standards and contracts across borders, was a significant advantage over more cumbersome state-led public institutions.
Conclusion
Institutions have been critical in enabling the expansion of international trade, yet debates continue over which institutions matter, particularly around the relative importance of public-order and private-order institutions. In this article, we examined the role of the CBA, a private-order trade association, in the expansion of the raw cotton market in the nineteenth century. The article identifies four key mechanisms that the CBA implemented to facilitate trade in the cotton market: the enhancement of information flows; standardization of quality; strengthening of contract enforcement mechanisms; and the development of exchange platforms. Together, these created an institutional framework to govern the world's largest raw cotton market, in Liverpool.
Using new data from broker reports and CBA circulars, we quantify the effects of this institutional framework on market coordination and price volatility. This analysis shows that the CBA enabled improved market coordination, as evidenced by three key indicators: the correlation between imports and consumption rose, the level of stock held in the market declined and stabilized, and price volatility fell. These changes coincided with significant growth in both the volume and value of the trade, supporting the expansion of gross product of the British cotton industry in the nineteenth century from £46.7 million in 1841 to £104.9 million in 1871.Footnote 125 The CBA created institutions central to dramatic improvements in the raw cotton market that contributed to the importance of the crowning of “King Cotton” in the processes of British industrialization and the first wave of globalization.
The persistence of this institutional framework to the present day demonstrates the adaptive capacity of such associations.Footnote 126 The importance of private-order institutions is emphasized by the CBA's pioneering innovation of a cotton grading system replete with arbitration and enforcement mechanisms, an antecedent of systems that underpin many international industries and commodities today.
These findings challenge us to rethink and nuance the conventional state-centric explanations of globalization by underscoring the importance of private-order institutions in facilitating the expansion of international trade in the nineteenth century. The growth of the international raw cotton market was not driven by a transition toward formal public-order institutions enforced by states. Rather, private-order institutional solutions, devised by a voluntary, self-governed organization, were central to the establishment, development, and governance of global trade in one of the most important commodities of the nineteenth century.
While explanations of nineteenth-century market integration have highlighted the importance of technological and trade policy innovations in improving integration, these findings show the need to account more fully for institutional innovations in market exchange and standardization. Without these developments, uncertainty and opportunism would continue to reduce the efficiency of exchange, potentially limiting the benefits of the transport and communication revolution. It is also notable that improvements in standardization and contract enforcement were contemporary to those in transportation and trade policy, while exchange platforms rapidly evolved in response to communication innovations. Studies of globalization and the expansion of trade should focus on the interactions between private actors and institutional and technological innovations, to better specify explanations of the process and timing.
Finally, these findings contribute to debates on institutional development. Analysis shows how the CBA was able to exploit formal and informal mechanisms, and complementarities between functions, to increase the proportion of market participants converging on standards and exchange platforms. The CBA was able to mitigate the major limitation of scalability and “entry barriers” associated with private ordering systems. Conversely, other major contemporary commodity exchanges, such as the CBOT, initially appeared to fail in this regard and ultimately depended on slow-moving and cumbersome state enforcement. This opens questions as to why trajectories of institutional development differed in ostensibly similar markets. Further comparative research on standardization and convergence in commodity markets would be a fruitful avenue to deepen understanding of the development and relative importance of private and state institutional frameworks in international trade.


