


1. Introduction
The transition towards a Circular Economy (CE) is a key strategy to reduce resource consumption and environmental pressures. CE seeks to replace the linear “take-make-dispose” model by keeping products and materials in closed loops for as long as possible. A major conceptual foundation is the Cradle-to-Cradle framework, which designs products to return either as biological nutrients to natural systems or as technical nutrients in continuous cycles. (Reference McDonough and BraungartMcDonough & Braungart, 2002)
Advancing the CE requires synthesis methods for circular product development and analytical methods to evaluate the circularity of existing and emerging products (Reference Corona, Shen, Reike, Rosales Carreón and WorrellCorona et al., 2019). Various indicators and methods have been developed to measure progress towards CE. However, there is no commonly accepted way of measuring the circular performance of products, which limits reproducibility and comparability across assessments (Reference Kristensen and MosgaardKristensen & Mosgaard, 2020). The ISO 59020 standard provides a framework for circularity measurement, assessment and reporting, including boundary setting, indicator selection, and requirements for data acquisition and data quality (ISO 59020, 2024). This creates a practical research gap, as circularity progress reporting still lacks standardized reporting principles and procedures, motivating explicit reporting rules and a consistent data logic for product-level circularity assessment (Reference Opferkuch, Caeiro, Salomone and RamosOpferkuch et al., 2021).
This paper contributes an operationalization of HPCA for product-level assessment through explicit system boundaries and calculation and reporting rules. It further structures the required product dataset in a Digital Product Datasheet (DPD) including data source and data quality. Finally, it derives decision-relevant design and system levers from the balance-bike case.
The Circular Assessment and Sustainability Analysis (CASA) proposed an initial structured methodology for evaluating product-level circularity (Reference Neumann, Vielhaber, Kohl, Seliger, Dietrich and MurNeumann & Vielhaber, 2023). Building on CASA, the Holistic Product Circularity Analysis (HPCA) was developed to provide a more comprehensive, ISO 59020-aligned methodology (Reference Neumann, Mörsdorf and VielhaberNeumann et al., 2025).
2. State of the art
Product-level circularity assessment has evolved rapidly, yet gaps remain in standardization and comparability, life-cycle coverage, and practical operationalization (Reference Jerome, Helander, Ljunggren and JanssenJerome et al., 2022). HPCA was proposed to address these deficits by coupling qualitative ratings with quantitative analysis across the product life cycle (PLC), making size, efficiency and closure of material cycles visible and enabling hotspot-driven optimization for closing material cycles rather than a single composite score (Reference Neumann, Mörsdorf and VielhaberNeumann et al., 2025). ISO 59020 specifies a three-step procedure that requires to first define the system and functional unit, then measuring resource inflows and outflows with selected indicators, and finally reporting results after review (ISO 59020, 2024). This improves transparency but leaves methodology choices to practitioners. Recent reviews emphasize the diversity and limitations of existing product circularity indicators and note missing coverage of resource consumption in the use-phase and lifetime extension strategies and context (Reference Jerome, Helander, Ljunggren and JanssenJerome et al., 2022).
2.1. Circularity indicators and assessment methods
The review of de Oliveira et al. shows a wide landscape of indicators at product and company level. Most indicators emphasize resource and material recovery in the environmental dimension. Many indicators remain incomplete, which can lead to superficial assessments of CE performance (Reference de Oliveira, Dantas and Soaresde Oliveira et al., 2021).
The Material Circularity Indicator (MCI) measures circularity as a single score based on virgin material use, unrecoverable waste, and a utility factor that accounts for the length and intensity of the product’s use. Applicable to materials, products, and companies, it ranges from zero to one, with higher scores indicating higher circularity. The indicator supports product design and internal decision making and requires structured input on reused, recycled, and renewable content and on end of use collection and recovery assumptions. (Ellen MacArthur Foundation, 2015)
The Product Circularity Indicator responds to limitations of MCI at product level. It accounts for losses during feedstock and component production and for reuse effects at component level. It emphasizes durability, component reuse, and material value retention across life cycles and provides a more detailed view of product circularity than a single material balance. (Reference Bracquené, Dewulf and DuflouBracquené et al., 2020)
The Longevity Indicator measures how long resources remain in use. It aggregates initial lifetime, refurbishment cycles, recycling contributions and supports decision making in situations where material retention over time is the main objective. (Reference Franklin-Johnson, Figge and CanningFranklin-Johnson et al., 2016)
Circular Life Cycle Sustainability Assessment integrates circularity indicators with life cycle-based methods. The framework combines Life Cycle Assessment (LCA), Life Cycle Costing, and Social Life Cycle Assessment and uses indicators such as material circularity, product circularity, and longevity. It supports the identification of trade-offs between circularity gains and environmental, economic, and social effects and gives guidance for data and comparability. (Reference Luthin, Traverso and CrawfordLuthin et al., 2024)
Hackenhaar et al. propose a comprehensive sustainability framework that couples Life Cycle Sustainability Assessment with resource circularity and criticality, providing integration across environmental, economic, and social dimensions but without an operational product-level circularity procedure aligned to ISO 59020. (Reference Hackenhaar, Moraga, Thomassen, Taelman, Dewulf and BachmannHackenhaar et al., 2024)
Boyer et al. defined a three-dimensional product circularity that jointly considers material recirculation, utilization, and endurance. This clarifies design levers but does not prescribe fixed system boundaries and indicator mapping for reproducible product assessments. (Reference Boyer, Mellquist, Williander, Fallahi, Nyström, Linder, Algurén, Vanacore, Hunka, Rex and WhalenBoyer et al., 2021)
Lachnit et al. developed a structured assessment of remanufacturing suitability with an Excel tool and decision logic focused on retention pathways for upgrade and recovery, offering depth for remanufacture but not a full PLC indicator set or ISO-based reporting rules. (Reference Lachnit, Deckert, Hörger, Gleich, Bail, Benfer, Lanza, Kohl, Seliger, Dietrich and VienLachnit et al., 2025)
Vimal K.E.K et al. present a framework to assess circularity across all PLC stages and demonstrate a case, however comparability is limited due to flexible boundaries and the absence of a standardized indicator taxonomy and review procedure. (Reference K.E.K, Kandasamy and GiteK.E.K et al., 2021)
2.2. Retention options
Drawing on a broad literature review, Reike et al. propose a 10R typology. It contains two preventive options and eight Retention Options (RO). Short loops keep the original function and include Refuse (R0), Reduce (R1), Re-use and Re-sell (R2), and Repair (R3). Medium loops involve upgrades by producers or third parties and include Refurbish (R4), Remanufacture (R5), and Repurpose (R6). Long loops do not preserve the original function and include Recycle materials (R7), Recover energy (R8), and Re-mine (R9). Choice depends on whether function, resources, or energy content are prioritized. Short loops are preferred when function dominates. (Reference Reike, Vermeulen and WitjesReike et al., 2018)
ISO 59004 standardizes these actions and aligns them with the RO set. In addition, it includes rethink, circular sourcing, and cascade. In HPCA, the overlapping actions map directly to the corresponding RO. This makes HPCA consistent with ISO while keeping fixed boundaries and indicators for comparability. (ISO 59004, 2024; Reference Neumann, Mörsdorf and VielhaberNeumann et al., 2025)
3. HPCA methodology
This section summarizes HPCA only to the extent required to understand the case implementation. In addition to the previously published methodology, this paper details the operational setup used here, including the qualitative assessment sequence that guides the optimization of product circularity.
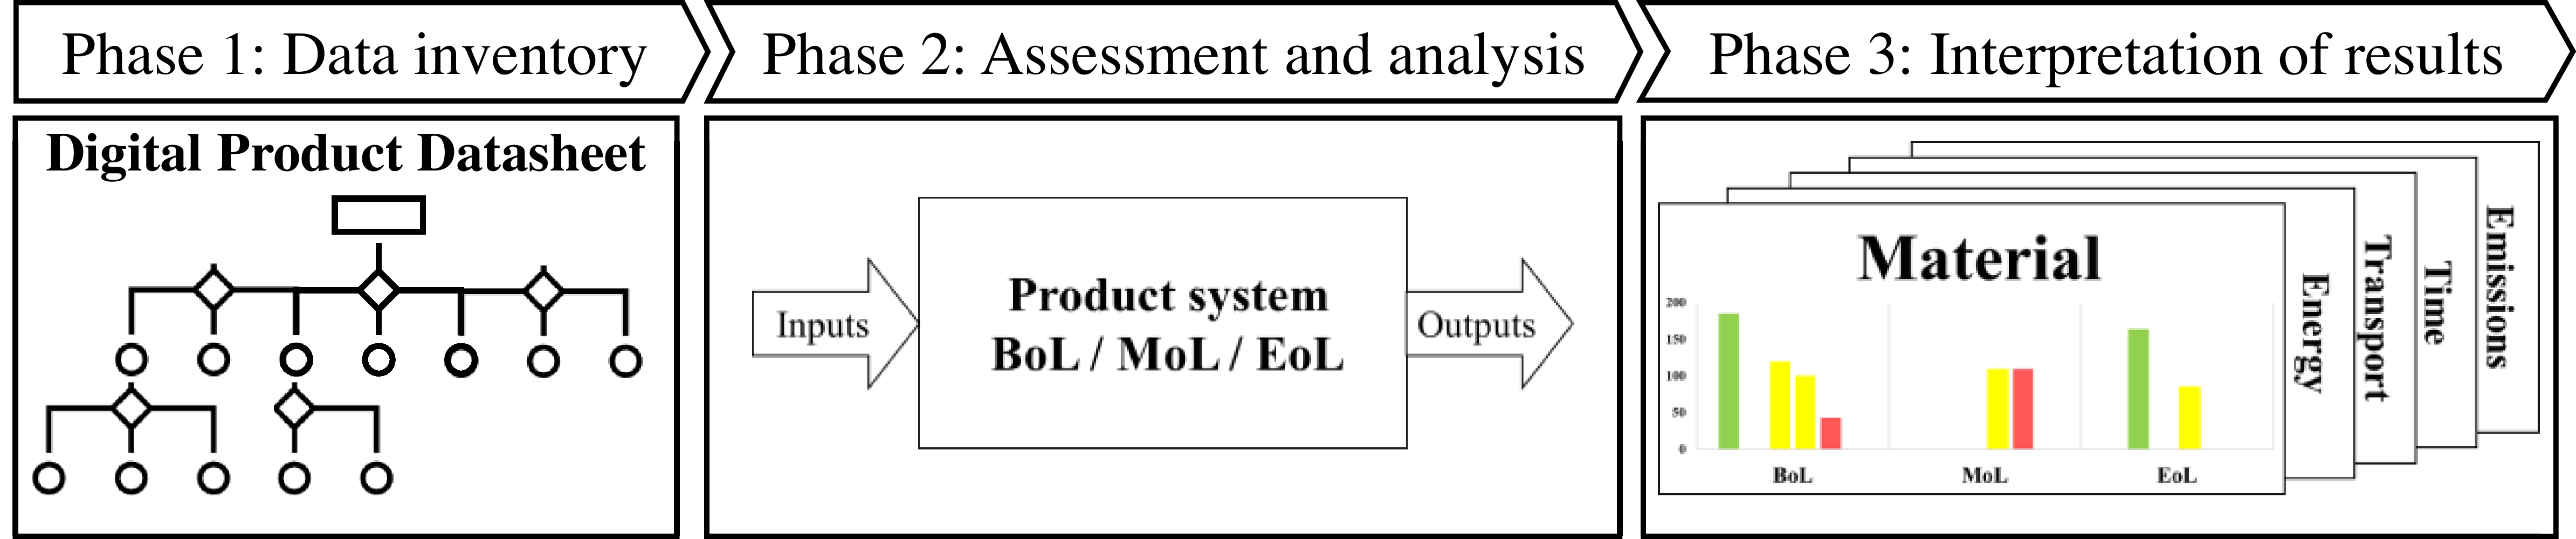
The HPCA methodology sets the goal of an ISO 59020 aligned product level circularity assessment for designers, engineers, decision makers, and final customers across all stages of the PLC. It is structured in three phases, shown in Figure 1. In Phase 1 data inventory, the product developer compiles a DPD. At this stage of development, the DPD is an Excel spreadsheet. It tracks the product across the PLC and records material, energy, time, transport, material joining and process data. When values are unknown, estimates from literature and databases are used and later replaced by validated data. A knowledge repository consolidates external databases and internal knowledge from developers, the company, and prior products. It supports estimation when specific values are missing. A concept for graph-based aggregation is shown by Schweitzer et al. (Reference Schweitzer, Mörsdorf, Bitzer and VielhaberSchweitzer et al., 2022), which can be used further development of the knowledge repository. In Phase 2 assessment and analysis, an automated procedure processes the DPD and determines circularity for beginning of life (BoL) production, middle of life (MoL) product-use, and end of life (EoL) deproduction. In Phase 3 interpretation of results, outcomes are presented in a dashboard. The dashboard combines a qualitative assessment with a quantitative analysis of material and energy and reports transport distance and transport energy together with time and costs for all PLC stages. (Reference Neumann, Mörsdorf and VielhaberNeumann et al., 2025)
Overview of the HPCA methodology (Reference Neumann, Mörsdorf and VielhaberNeumann et al., 2025)

Companies can apply the methodology during development to estimate, evaluate, and improve circularity and later validate the results with operational data. The approach develops the product and its material cycles and enables monitoring after sale to check whether realized outcomes follow the intended circular strategies. Sharing the DPD with customers increases transparency and shows how use decisions in MoL affect circular performance. Customers see their influence on the planned material cycles and are made aware of their impact on circularity. (Reference Neumann, Mörsdorf and VielhaberNeumann et al., 2025)
The assessment can be used for new products during development or for existing products to compare with similar products. It provides a holistic product level circularity analysis across all PLC stages, but does not claim holistic sustainability assessment. The environmental dimension is central because product circularity is described by material cycles and their efficiency. Data already stored in the DPD supports complementary assessments of economic and social aspects with life cycle sustainability assessment. (Reference Neumann, Mörsdorf and VielhaberNeumann et al., 2025)
3.1. Alignment with ISO 59020
HPCA operationalizes ISO 59020 for product-level circularity assessment by defining fixed boundaries across BoL, MoL, and EoL and applying them consistently to the product system. Structure comprises subsystems, functional units, processes, locations, and stakeholders including developer, manufacturer, user, and the actor executing RO. Actions cover product design and the RO R0 to R9. Resource inflows and outflows include material, energy, time, processes, data, parts, and assemblies and are rated by origin as circular or primary. All resource inflows and outflows are quantified and balanced using the mandatory core indicators. Inflows are average reused content, average recycled content, and average renewable content. Outflows are percent reused products and components, percent recycled material, and percent biological recirculation. Documentation covers system definition, boundary setting, indicator selection, data sources, modeling choices, and reporting rules to enable verification, comparability, and harmonization. (ISO 59020, 2024)
Operationalization is data driven via the DPD. The DPD compiles material, energy, time, transport, and emissions and maps the ISO 59020 core indicators to dedicated DPD fields so that inflow and outflow balances are reproducible at product level. Estimates are traceable and replaced by validated values. Data is normalized to a common denominator and completeness is checked before assessment. The functional unit in the ISO 59020 corresponds to the functional output (FO) in HPCA, which describes the products utility, such as runtime, distance, processed volume or weight. HPCA adds supplementary key performance indicators (KPI) allowed as additional indicators for design decisions. These include cumulative energy demand (VDI 4600, 2012) per FO, specific production energy at BoL in J/kg, specific deproduction energy at EoL in J/kg, and MoL energy per FO in J/FO. Energy KPIs are reported net of exported energy; exported energy is listed as an outflow for transparency. HPCA does not apply weighting and does not compute a composite score. Indicators are reported separately to preserve objectivity and traceability. Operationalization follows fixed equations, units, and boundary rules mapped to DPD fields so that inflow and outflow balances are reproducible at product level. Reporting complies with ISO 59020 and enables transparent comparison of reference and circular scenarios. (Reference Neumann, Mörsdorf and VielhaberNeumann et al., 2025)
3.2. Phase1: data inventory
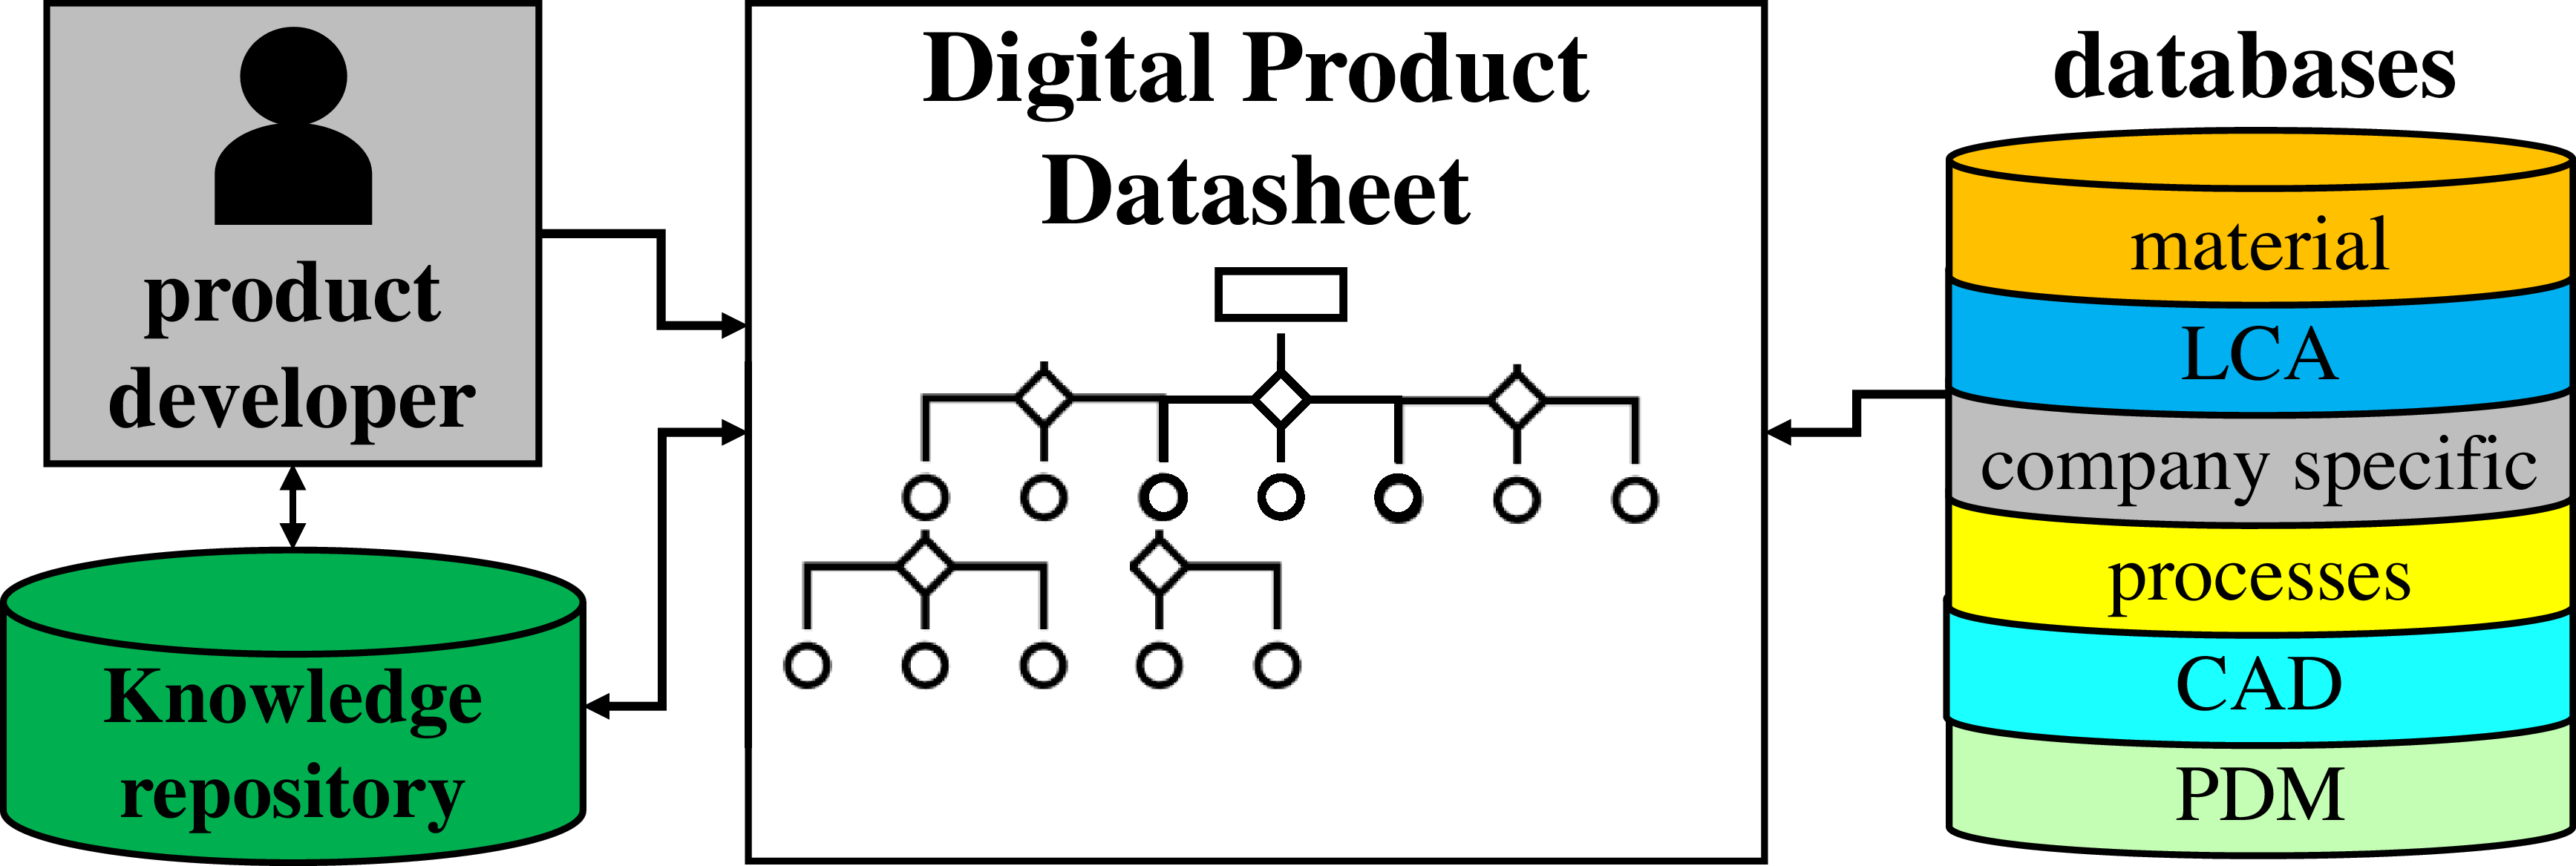
The necessary data for the DPD are derived from diverse sources. These include material databases such as Ansys Granta EduPack (Ansys, 2025), LCA databases, process databases, computer aided design systems, product data management systems, and the knowledge repository, as shown in Figure 2. The sources provide information on materials, parts, assemblies, and manufacturing processes. Self-generated data such as measured energy consumption during manufacturing processes enrich the DPD with observations from real operation. The collected data cover material composition and weights, process details, human and machine working time, energy consumption, transport distances with required energy, and associated monetary costs. Across the PLC, inputs and outputs of the product system are recorded in the DPD to provide a complete trace from BoL to EoL.
Phase 1 – data inventory (Reference Neumann, Mörsdorf and VielhaberNeumann et al., 2025)

The DPD also serves as a centralized repository that stores and organizes inputs and outputs at each stage of the PLC. Its structure supports effective data management and enables integration of heterogeneous sources, from material databases to real time energy consumption measurements. By consolidating data on material use, manufacturing processes, energy consumption, and transport routes, the DPD provides all information required for a holistic view of the product’s circularity performance. The ability to express parameters as costs enables an evaluation of the economic impacts of circularity strategies at each stage of the PLC. No weighting is applied to KPIs to preserve objectivity. Each indicator is interpreted on its own and in relation to FO and the PLC stages.
3.3. Phase 2: assessment and analysis
Assessment and analysis distinguish a qualitative assessment from a quantitative analysis of the parameters. The qualitative assessment uses three categories in the context of circular performance: positive in green, neutral in yellow, and negative in red. Material, energy, and emissions undergo qualitative assessment and quantitative analysis. Time, monetary, and transport parameters are analyzed quantitatively to show efficiency and scale of cycles without implying circular quality. Data quality is rated by source and verification status. Positive: measured primary data from supplier or operator with documented method and date. Neutral: literature or database values with stated provenance and applicability. Negative: missing data or unverified estimates. Estimates are flagged and replaced by validated values in subsequent iterations. The DPD records source, method, uncertainty, and validation date for each entry. (Reference Neumann, Mörsdorf and VielhaberNeumann et al., 2025)
Figure 3 summarizes the qualitative assessment across inputs and outputs for BoL, MoL, and EoL. BoL requires materials for production, MoL uses materials for spare parts and operation, and EoL involves materials needed for disassembly, such as solvents. During BoL, production generates waste as the main output. In MoL, spare parts and operational materials leave the system. At EoL, the disassembled product and its constituent materials form the primary outflows. (Reference Neumann, Mörsdorf and VielhaberNeumann et al., 2025)
Qualitative rated parameters (on the basis of Reference Neumann, Mörsdorf and VielhaberNeumann et al., 2025)

Joining is inventoried in the DPD and rated for reversibility and material homogeneity to reflect the feasibility of repair, disassembly, and recycling. The qualitative classification of joints uses categories defined by König et al. and are displayed in Figure 3 (Reference König, Mörsdorf and VielhaberKönig et al., 2025). The classification is integrated into the qualitative results and interpreted together with the quantitative flows. (Reference Neumann, Mörsdorf and VielhaberNeumann et al., 2025)
Figure 3 also shows the evaluation of energy inputs and outputs by the renewable or non-renewable nature of their sources. Compensation in energy and emissions means that greenhouse gas (GHG) emissions from non-renewable energy use are offset by supporting projects that reduce or capture an equivalent amount of emissions according to ISO 14064 (ISO 14064-1, 2018). Energy in BoL is required for production, in MoL is required for operation and for producing spare parts, and in EoL is required for disassembly and recycling. Products that produce energy in MoL or that are incinerated in EoL can also export energy from the product system. (Reference Neumann, Mörsdorf and VielhaberNeumann et al., 2025)
Emissions are defined as outflows of materials and operating materials that leave the product system and are no longer retained in biological or technical cycles. They represent mass losses that are not recirculated and therefore reduce circularity. A positive rating is assigned when no emissions are released into the environment. A neutral rating applies when operating media or material abrasion from biological cycles, or GHG from renewable sources or compensated fossil sources, enter the environment. A negative rating is given when operating materials or material abrasion from technical cycles, substances listed on the restricted substances list, or uncompensated GHG are emitted into the environment. No impact assessment of the emitted substances is conducted; only the quantities are reported according to their respective quality categories.
Figure 4 depicts the system boundaries and the main inputs and outputs across the three stages of the PLC: BoL, MoL, and EoL. At the BoL stage, inputs include a newly created DPD that records materials, parts, assemblies, process steps, and the required energy and time from humans and machines for part manufacturing and assembling. The BoL system outputs the finished product together with its populated DPD to MoL, while production-related waste materials and energy losses leave the system boundary.
Inputs and outputs of the product system in all stages of the PLC

Figure 4 Long description
A diagram of the product system illustrating the inputs and outputs across different stages of the product life cycle. Panel A: The product system at the beginning of life (BoL) during production. It includes inputs such as design and product data (DPD), material, part, assembly, energy, time, and processes. These inputs are used to produce the product. Panel B: The product system in the middle of life (MoL) where the product is in use. The product is depicted as a bicycle. Panel C: The product system at the end of life (EoL) during disassembly and recycling. It includes outputs such as material, part, assembly, energy, time, and processes. The functional output (FO) is also indicated.
In the MoL product system, Figure 4 shows that inputs include materials, parts, assemblies, machine time, human time, energy, processes, and the product with its DPD from the BoL product system. Operating processes include product use, maintenance and repair. Outputs are materials such as wear and energy such as waste heat or produced energy by the product system. The obsolete product and its DPD are outcomes of the MoL assessment which enter the EoL product system. Parts and assemblies enter the product system to repair and maintain the product and leave it as used ones which can be fed to a suitable RO. Time is required to assemble and disassemble them. Repair and maintenance processes enable an extension of the product lifetime. The principal output is the FO, representing the product’s service provision. (Reference Neumann, Mörsdorf and VielhaberNeumann et al., 2025)
For EoL, Figure 4 indicates that inputs comprise the DPD, the product, and the required materials, energy, and time for disassembly and for ROs. Outputs are used parts, assemblies, and materials for recirculation or disposal and energy in the form of energy losses or usable energy if R8 is applied. (Reference Neumann, Mörsdorf and VielhaberNeumann et al., 2025)
3.4. Phase 3: interpretation of results
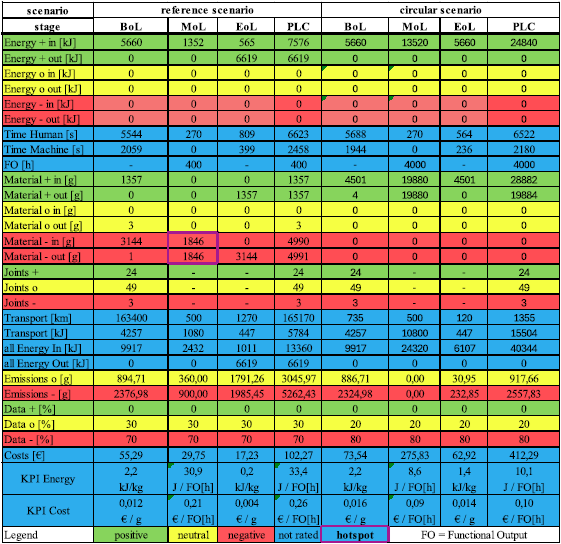
The final stage interprets the collected and evaluated data. Table 1 and a dashboard with diagrams present the results. The analysis reveals parts and materials that leave the product system without viable circularity strategies. These flows may require incineration or landfill disposal. Quantitative records in the DPD identify assemblies with disassembly that is not economical because time requirements are too high. The findings guide developers to improve circularity in current and future product generations. (Reference Neumann, Mörsdorf and VielhaberNeumann et al., 2025)
Overview of HPCA case study with different scenarios

Table 1 Long description
The table compares different scenarios and stages for energy, time, material, transport, and emissions data. It has 12 rows and 12 columns. The columns are labeled as scenario, stage, reference scenario BoL, reference scenario MoL, reference scenario EoL, reference scenario PLC, circular scenario BoL, circular scenario MoL, circular scenario EoL, and circular scenario PLC. The rows are labeled as Energy in, Energy out, Time Human, Time Machine, FO, Material in, Material out, Material in, Material out, Material in, Material out, Transport km, Transport kJ, All Energy In, All Energy Out, Emissions, Data in percent, Data out percent, KPI Energy, and KPI Cost. Each cell contains specific values related to the respective scenario and stage. The table provides a detailed comparison of various metrics across different stages and scenarios.
Optimization targets the conversion of neutral and negative qualitative ratings to positive rating. However, for energy the primary objective is demand reduction before energy source substitution, to avoid burden shifting through longer transport distances or less efficient processes justified only by renewable energy availability at remote sites.
The evaluation delineates PLC stages and material inputs and outputs with the highest improvement potential and identifies major cost drivers. Different EoL scenarios allow comparison of RO. The results show which option closes material cycles most efficiently in terms of time and energy. (Reference Neumann, Mörsdorf and VielhaberNeumann et al., 2025)
4. Case study: childrens balance bike
This case study applies the HPCA methodology to a children’s balance bike, which is depicted in Figure 4 in the middle. The FO is defined as product use time. The reference scenario represents common use in Germany with production in China and disposal through the German dual waste system. The circular scenario targets a fully circular product and shortens and regionalizes supply chains so that loops are local and resilient. It aims to bring all material and energy inputs and outputs to a positive assessment. Costs are made explicit in energy and monetary terms. The circular scenario increases loop efficiency by enabling local production, repair, maintenance, and recycling.
4.1. Data inventory and assumptions
The DPD captures all parameters at product level for BoL, MoL and EoL. For this case study the balance bike was disassembled, all assemblies and parts were weighed, and process times were measured with a stopwatch. Joining types were noted. Material specifications, process energies and emission factors were taken from literature values and supplier information where available. Where primary data were not available, inputs were derived from reasoned estimates based on expert judgement, supported by structured searches and plausibility checks using publicly available information. This is reflected in the data rating in the DPD. Process energy was calculated from unit energy coefficients per material and process multiplied by the recorded masses and times. Transport distances were derived from estimated supplier locations and logistics routes and converted to transport energy using mode specific intensities. Human time and machine time were recorded from teardown, assembly trials and standard cycle time assumptions. Costs reflect part prices, labour rates, machine rates and logistics.
In the reference scenario the product is manufactured and assembled in China, shipped by sea to Germany, distributed nationally and used in Germany. During use two tires are replaced once. At EoL the German dual system manages collection, sorting and treatment. Material inputs are primarily virgin feedstock. Spare parts represent additional primary materials. At EoL, several fractions exit the system as residuals, and a large share is incinerated, reflecting common practice in the German dual waste system. Energy demand includes production and assembly in BoL, replacement of tires and operation in MoL, and disassembly and sorting in EoL. Transport is dominated by intercontinental shipping plus inland distribution.
In the circular scenario production, assembly, repair and recycling are located at European sites to minimize transport and increase resilience. Virgin material inputs are shifted towards recycled or recirculated materials. Negative outflows at EoL are eliminated where feasible and metals and other recoverable fractions are routed to recycling. Material joints were not changed because this would require engineering redesigning of the product and thus it would be another scenario. This is the next step to further increase circularity and can also be modeled and assessed with HPCA. The FO is extended by a factor of ten through scheduled tire replacement. Tires are sourced with recycled content and are recycled at each replacement. KPI Energy includes specific production energy in BoL and specific deproduction energy in EoL. Human time and machine time reflect shorter logistics chains, more repair, and planned disassembly for recovery. Costs include localized manufacturing, repeated tire replacement and European recycling.
The circular scenario is defined as an optimized variant of the reference scenario. Optimization is applied stepwise by converting neutral and negative qualitative ratings to positive ratings, prioritizing material, then energy, then emissions, and finally joining. First, system-level measures are implemented, including supplier localization, improved EoL routes, and demand reduction for energy to avoid burden shifting, followed by energy source substitution where appropriate. Second, an additional redesign scenario can address constructive changes such as improved joining and geometry-enabled material improvements.
4.2. Results of the analysis
The analysis compares the balance bike across BoL, MoL, EoL and the total PLC, using one consistent reporting layout for both scenarios. Energy, time, materials, transport, emissions, costs and the derived indicators are read together so that shifts in one block can be traced to their causes in the others.
In the reference scenario energy use concentrates in BoL and MoL. Manufacturing and final assembly dominate BoL, while spare part provision and operation drive MoL. Transport distance and transport energy are high because production and assembly take place in China and the product is shipped to Germany and distributed nationally. At EoL, material outflows include incineration with subsequent landfilling. These flows leave the system and receive a negative material rating. Human time peaks in assembly and in EoL handling where separation is slow and yields are low. The main cost drivers are international logistics, tire replacement and EoL management.
In the circular scenario material outflows move toward positive pathways. Metals and other recoverable fractions are routed to recycling. European sourcing, assembly, repair and recycling cut transport distance and transport energy sharply. MoL shows higher energy usage because tires are replaced more often, yet the FO is increased by a factor of ten so the KPI Energy per FO improves. Specific production energy is reported in BoL and specific deproduction energy is reported in EoL, which makes the effort per kilogram transparent. Human time and machine time shift from long distance logistics toward planned disassembly and repair. Although total costs rise in the circular scenario, costs per FO decrease. Transport effort and residual losses are lower, and the longer lifetime spreads effort across much more use time. Similarly, total energy can increase even as the energy per FO declines.
Table 1 presents the dashboard with both scenarios side by side. Columns list BoL, MoL, EoL and PLC totals. Rows list energy in and out, human time and machine time, material in and out with positive, neutral and negative ratings, transport distance and transport energy, totals of energy in and out, emissions, data quality and costs. At the bottom the indicators report the KPIs energy per FO and cost per FO together with specific production and deproduction energies. The table makes hotspots and improvements visible and shows how localization, and recovery measures transform the reference scenario into a fully circular and more resilient setup. In the reference scenario, the dominant hotspot is the tire replacement in MoL, where primary material is used for each change and the spent tire is deposited in a landfill.
Stage contributions show BoL dominates energy through manufacturing and final assembly. MoL adds replacement and operation. EoL losses are driven by incineration. In the circular scenario, transport energy decreases while MoL energy increases due to planned replacement, yet energy per FO declines because FO increases by an order of magnitude. The main improvements stem from supply-chain localization and shifting outflows to recycling; the trade-off is higher MoL effort. Cost per FO follows energy per FO because lifetime extension spreads effort over more use time. Joining quality matters: reversible and homogeneous joints reduce disassembly time and increase recovery quality; non-reversible joints keep EoL energy high and create negative outflows. Results are robust to moderate variation of lifetime, recycled content, and energy mix; FO and transport distance show the strongest leverage. Under fixed ISO 59020 conditions the circular scenario delivers lower energy per FO and cost per FO while converting negative outflows to positive pathways, establishing a reproducible template for product-level comparisons.
5. Conclusion and outlook
This work presents HPCA as a product level methodology that makes circular performance measurable and design relevant across the stages of the PLC. The approach combines a qualitative assessment of materials, energy, emissions, data, and joining with a quantitative analysis of these parameters and additionally considers time, processes, transport and costs. A structured DPD and a consistent dashboard enable transparent reporting for BoL, MoL and EoL and a direct comparison of reference and circular scenarios. Indicators such as energy per FO, specific production energy and specific deproduction energy make the required effort visible and comparable.
The case study demonstrates how localization of supply chains and planned recovery shift material outflows toward positive pathways, reduces transport effort and improve normalized indicators. Joining choices support repair and disassembly and raise recovery quality but need a structural revision. Extending the FO through planned maintenance spreads effort across a longer use time and lowers energy per FO and cost per FO. The PLC view helps to identify hotspots and to prioritize design and system interventions. The mapping to ISO 59020 ensures clear boundaries, documented data provenance and reproducible results.
HPCA transfers across product types because boundaries, indicators, and the DPD structure are fixed. Only FO, process sets, and scenario parameters change. The assessment steps remain identical and ISO-conformant, enabling benchmarking under the same conditions.
Future work will extend the contribution in four directions. First, data quality will be improved by replacing estimates with supplier and operator primary data, expanding the DPD with automated imports, and adding uncertainty and sensitivity analysis. Second, scenario creation will be refined by adding an additional redesign scenario that includes qualitative joining improvements through structural changes and by linking HPCA outputs to design rules and decision support so that improvement options can be ranked by cost, time, and energy. Third, system scaling will be addressed by testing HPCA on additional product types with different FO definitions, connecting the knowledge repository to regional repair and recycling infrastructure, and preparing the data in the DPD for import to Digital Product Passports so that circularity evidence can move with the product. Fourth, the HPCA operational setup will be validated in an industrial field application by integrating company-specific process data and operational use data and by evaluating practical usability for development decisions and communication via the DPD.
With these steps HPCA can evolve into a robust foundation for managing product circularity in development and operation. The methodology supports consistent reporting, reveals concrete levers for closing material cycles and provides a practical path to design products that are fully circular and locally resilient.
Acknowledgements
The authors thank the European Regional Development Fund (ERDF) for supporting their research within the project PSS4CE.



 Open access

