





1. Introduction
Hydropower typically accounts for more than 90% of Norway’s total energy production, with 15% of the exploited runoff originating from glacierized river basins (Pelto, Reference Pelto, Singh, Singh and Haritashya2011). Southwestern Norway is particularly mountainous, with 4.2% of its area covered by glaciers. By 2022, approximately 1355 hydropower plants were developed, under construction, or planned in this region, according to the Norwegian Water Resources and Energy Directorate (NVE, 2025). Many of these plants receive snow and glacier meltwater from areas covered by glaciers and permanent ice. The variability of these meltwaters has a profound impact on socioeconomic activities in downstream human settlements (Immerzeel et al., Reference Immerzeel, Lutz, Andrade, Bahl, Biemans, Bolch, Hyde, Brumby, Davies, Elmore, Emmer, Feng, Fernández, Haritashya, Kargel, Koppes, Kraaijenbrink, Kulkarni, Mayewski and Baillie2020).
To understand how hydropower production in southwestern Norway is currently vulnerable and may become increasingly so in the future, it is essential to improve our understanding of recent spatial and temporal glacial-hydrological variability in the region, particularly in the context of climate change. Because in heavily glacierized mountain regions, the spatiotemporal characteristics of river runoff are influenced by snow and glaciers, creating patterns distinct from those in regions where runoff depends solely on rainfall and baseflow (Azam et al., Reference Azam, Kargel, Shea, Nepal, Haritashya, Srivastava, Maussion, Qazi, Chevallier, Dimri, Kulkarni, Cogley and Bahuguna2021).
A deeper understanding of the buffering effect of meltwater and the roles played by glacierized and non-glacierized regions in offsetting precipitation deficits is crucial for effectively adapting hydropower production to the impacts of climate change. Although precipitation is projected to increase in southwestern Norway throughout the 21st century (Hanssen-Bauer et al., Reference Hanssen-Bauer, Førland, Haddeland, Hisdal, Mayer, Nesje, Nilsen, Sandven, Sandø, Sorteberg and Ådlandsvik2017), dry periods, such as the summer–autumn of 2021 (Smith-Isaksen Holdhus, Reference Smith-Isaksen Holdhus2021), can still occur and impact hydropower production. Meltwater from glacierized areas could compensate for the lack of precipitation in non-glacierized areas during warm, dry periods (Koboltschnig et al., Reference Koboltschnig, Schöner, Holzmann and Zappa2009; Zappa & Kan, Reference Zappa and Kan2007), providing a buffer against the negative impacts of excessive heat and drought (Van Tiel et al., Reference Van Tiel, Van Loon, Seibert and Stahl2021). Previous studies of glacierized river basins in the European Alps have shown that discharge can exceed normal levels in dry periods, as observed during the drought and heat wave events of August 2003 (Koboltschnig et al., Reference Koboltschnig, Schöner, Holzmann and Zappa2009; Zappa & Kan, Reference Zappa and Kan2007).
Van Tiel et al. (Reference Van Tiel, Van Loon, Seibert and Stahl2021) introduced a metric of the compensation level provided by glacier meltwater, defined as the ratio of streamflow during short-term Warm and Dry events to the long-term streamflow regime. Their study aimed to assess the extent to which glacier runoff can compensate for reduced precipitation during such events (i.e., the compensation level). By analyzing discharge measurements, they sought to isolate the contribution of glaciers to streamflow, minimizing the influence of other hydrological processes. However, the measured discharge values reflect only total runoff and do not distinguish between individual components, such as glacier and snow meltwater, baseflow, and other types of flow. In this study, we quantified the contributions of each runoff component using a glacio-hydrological model and differentiated between glacierized and non-glacierized regions, providing more detail.
Finally, how local institutional and economic stakeholders perceive the role of glaciers in hydropower production provides insight into their understanding of the vulnerability and resilience of hydropower systems to streamflow variability. It is an important factor in shaping effective local and regional climate adaptation strategies. Reduced inflows to hydropower reservoirs have previously increased electricity prices, particularly during dry summers, and jeopardized energy security, i.e., the uninterrupted availability of affordable energy (International Energy Agency, 2023), in the region. While earlier economic studies (e.g., Bye, Reference Bye2003; Bye & Hope, Reference Bye and Hope2005) examined how rainfall deficits affect hydropower operations and electricity markets in Norway, most research on glacier contributions to hydropower focused on regions such as High Mountain Asia and the European Alps (e.g., Puspitarini et al., Reference Puspitarini, François, Zaramella, Brown and Borga2020; Schaefli et al., Reference Schaefli, Manso, Fischer, Huss and Farinotti2019; Shakti et al., Reference Shakti, Pun, Talchabhadel and Kshetri2021; Stucchi et al., Reference Stucchi, Bombelli, Bianchi and Bocchiola2019). In contrast, the Norwegian context remains largely unexplored.
In this study, we conducted simulations using a series of computer models, including a snow evolution model, soil balance model, and runoff routing model, to estimate the volumetric streamflow of water at hydropower intakes located within a highly glacierized river basin in southwestern Norway, the Jostedøla River Basin (Fig. 1). The contribution of glacier meltwater to the total runoff and the level of compensation it provides during Warm and Dry days at the hydropower intakes were then analyzed. These analyses were conducted for the first decade of the 21st century, when glaciers in southwestern Norway began to recede rapidly (Andreassen et al., Reference Andreassen, Elvehøy, Kjøllmoen and Belart2020). Furthermore, quantitative glacio-hydrological findings were complemented with qualitative interviews with key local stakeholders. Through the investigations mentioned above, we aim to achieve the following research objectives:
• to quantify the contribution of glacier meltwater at the water intakes of each hydropower plant as well as its temporal distribution;
• to investigate the compensation level of glacier meltwater for each hydropower plant during the Warm and Dry days at the beginning of the 21st century;
• to understand the perceptions of local institutional and economic stakeholders on the role of meltwater from glacier-covered areas in hydropower production and potential societal impacts of reduced glacier meltwater in a warmer climate.
This paper is structured as follows. Section 2 describes the study area and the data, models, and methods used in the quantitative and qualitative analyses. Section 3 presents the results of glacier meltwater contributions to hydropower production as well as stakeholder perceptions. Section 4 discusses the implications for glacier meltwater compensation and hydropower climate resilience, followed by a concluding section (Section 5).
2. Methodology
2.1. Study area
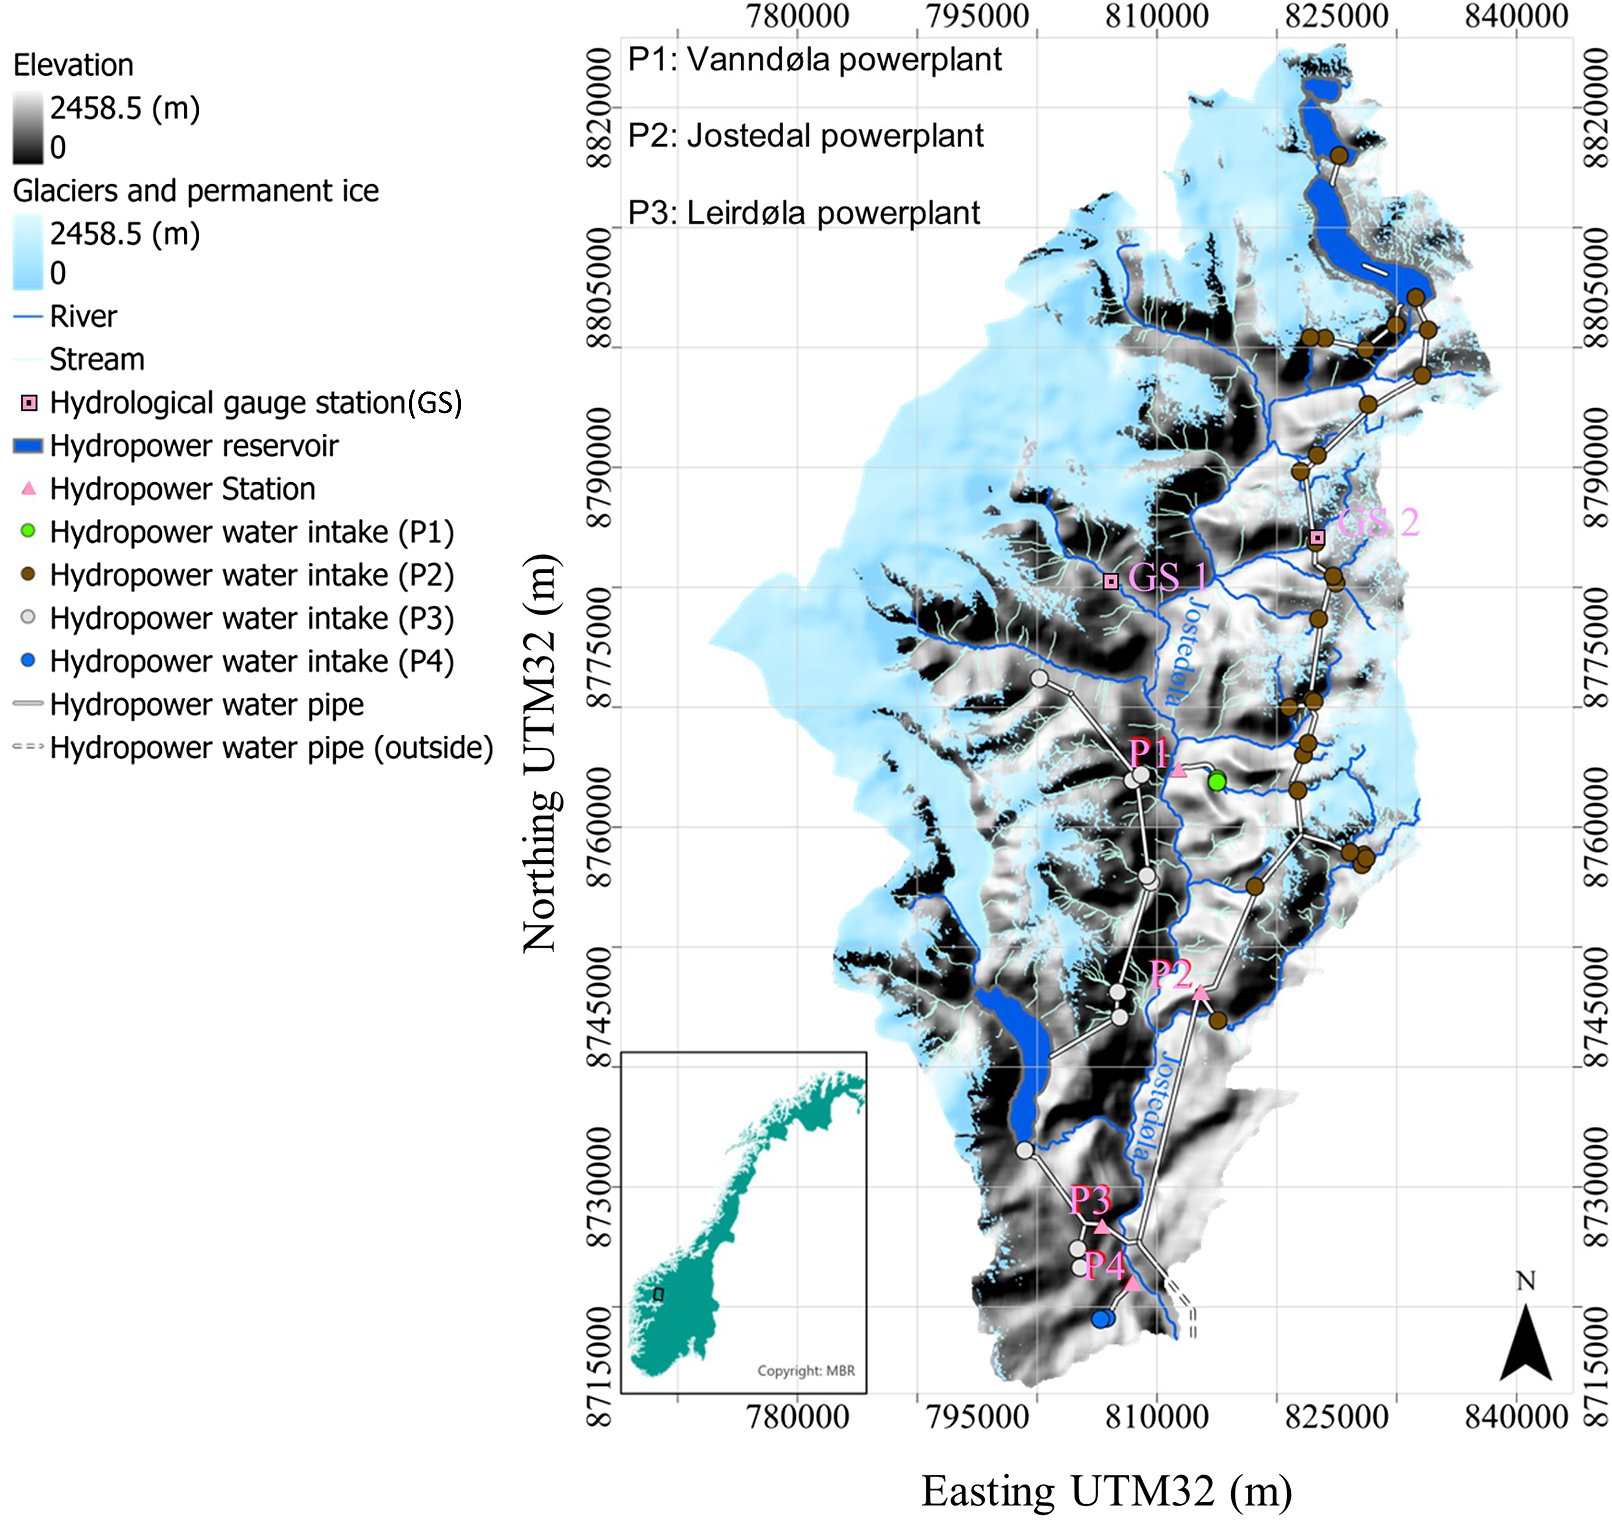
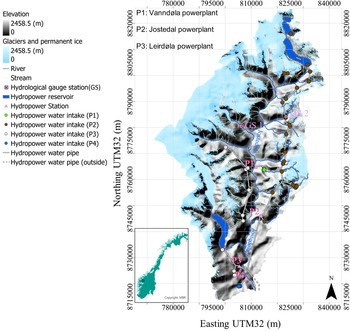
The study area, the Jostedøla River Basin, is located in the Jostedøla Valley of Luster Municipality, Vestland County, in southwestern Norway (Fig. 1). Since the 1970s, the Jostedøla River and its tributaries have served as vital sources for hydropower generation, supporting both regional energy needs and Norway's national renewable energy goals (Fischer, Reference Fischer2024; Mostue et al., Reference Mostue, Taule, Borgen and Jebsen2022).
The elevation map of the Jostedøla River Basin is superimposed on the distribution of glaciers and permanent ice, displayed in light blue. The insert in the lower-left corner indicates the location of the river basin in Norway, framed in black. The outline of Norway in the insert is based on a map created by Michael Bauer Research (MBR).
1 Long description
The map illustrates the Jostedøla River Basin with elevation marked at 2458.5 meters. Glaciers and permanent ice are highlighted. Rivers and streams are depicted, along with hydropower facilities. These include hydrological gauge stations, hydropower reservoirs, stations and water intakes of Hydropower Stations 1-4 (P1 to P4). The map also shows hydropower water pipes, both inside and outside the basin. An insert in the lower-left corner indicates the location of the river basin in Norway. The map uses Easting UTM32 meters for the x-axis and Northing UTM32 meters for the y-axis.
The electricity generated by the major hydropower plants in the Jostedøla River Basin enters Norway's integrated power grid, which is organized into five regional bidding zones (Statnet, 2025). The Jostedøla River Basin falls within the bidding zone of western Norway (NO5) (Statnet, 2025). As for all Norwegian bidding zones, electricity produced in the western area is traded through the Nord Pool Exchange, which connects the Nordic and Baltic countries (Nord Pool, n.d.). Although electricity can flow between zones, these transfers are limited by transmission capacity. This results in each zone operating somewhat independently with respect to supply and demand issues. Once traded on Nord Pool, electricity becomes part of the broader European energy market, supporting domestic consumption and international energy flows. Electricity generated in the western Norway bidding zone serves households, commercial enterprises, and industrial users. While most electricity is sold on the open market, Statkraft, the primary producer in this region, enters into agreements with large industrial clients and energy companies providing direct power supply (Statkraft, n.d.).
In municipalities with hydropower generation, such as Luster, local governments benefit from revenue linked to energy production, including natural resource taxes, license fees, and property taxes (Ministry of Local Government and Regional Development, 2021). These revenues help support public services such as nursing and care, nursery schools, education, and technical services, including waste disposal, sewage, and water. They also support local development initiatives, including start-up grants, and planning and construction initiatives (Ministry of Local Government and Regional Development, 2021).
Most headwaters of the Jostedøla River and its tributaries are connected to the outlet glaciers of the Jostedalsbreen Icecap. This highly glacierized river basin is characterized by steep topography, high plateaus, and rugged mountains, as summarized in Table 1. Like other river basins in southwestern Norway, the Jostedøla River Basin receives precipitation from large-scale delivery of atmospheric moisture from the west, which is then locally enhanced by steep topography (Azad & Sorteberg, Reference Azad and Sorteberg2017; Ketzler et al., Reference Ketzler, Römer, Beylich and Beylich2021).
Physiographic characteristics of the Jostedøla River Basin

Table 1 Long description
The table provides physiographic characteristics of the Jostedøla river basin, including basin area, glacier coverage, average elevation, slope distribution, and slope orientation. The basin covers 864.9 km² with 38.3% glacier coverage and an average elevation of 1298.6 meters above sea level. Slope distribution is categorized into flat (45.0%), moderate (31.2%), and steep (23.7%) slopes. Slope orientation is primarily eastern (31.5%), followed by southern (30.0%), western (19.6%), and northern (18.9%). The data suggests a diverse topography with significant glacier presence and varied slope orientations.
Notes: In the current work, four classes of exposure were defined (always considering North = 0° and increasing in a clockwise direction): ‘Northern’ (315°–360° and 0°–45°), ‘Eastern’ (45°–135°), ‘Southern’ (135°–225°), and ‘Western’ (225°–315°). Regarding the distribution of slopes for each watershed, three classes were considered: ‘Flat’ (<15°), ‘Moderate’ (15°–29°), and ‘Steep’ (>29°) slopes.
At the start of the 21st century, most glaciers in the Jostedøla River Basin, including Bergsetbreen, Fåbergstølsbreen, Nigardsbreen, and Austdalsbreen, entered a phase of rapid retreat following a period of advance during the 1990s (Andreassen et al., Reference Andreassen, Elvehøy, Kjøllmoen and Belart2020). However, significant spatial variations persist; for example, between 1964 and 2013, Tunsbergdalsbreen, which did not advance during the 1990s, experienced a reduction in surface area approximately 18 times that of Nigardsbreen during the same period.
This study focuses on four hydropower plants (Fig. 1) for which publicly available information was accessible and interviews with the staff operating the plants could be conducted. Vanndøla (P1) and Røneid (P4) are small run-of-river power plants that withdraw water directly from rivers without big reservoirs. They are operated by two small-scale entities, Luster Småkraft AS and Småkraft Green Bond 1 AS, respectively. These plants have only short-term storage capabilities (i.e., pondage) to meet occasional spikes in electricity demand. The Jostedal (P2) and Leirdøla (P3) power plants, on the other hand, receive water from both dammed reservoirs and natural watercourses via water intakes. These two power plants, owned by the national company Statkraft AS, can store water in their reservoirs and release it when needed for later energy generation to supply both the base and peak energy loads (Kaunda et al., Reference Kaunda, Kimambo and Nielsen2012; NVE, 2025).
2.2. Model description
The discharge hydrograph and different water components were simulated through a modeling chain similar to that used by Beamer et al. (Reference Beamer, Hill, Arendt and Liston2016). All simulations were conducted from 1 September 2000 to 31 August 2014 at daily temporal and 100 × 100 m spatial resolutions. Here, we provide only a brief description of the models’ components and their setups for this study (Section 2.4). Further details are available in their original publications.
A snow evolution model (SnowModel; Liston & Elder, Reference Liston and Elder2006) was used in a previous study (Gong et al., Reference Gong, Tomar, Rogozhina and Basso2025) to produce a gridded total runoff for southwestern Norway. For this study, additional components were added to calculate the potential evapotranspiration (PET). The distributed, process-based model downscaled coarse-resolution climate forcing to account for local topography and estimated snow and ice meltwater by simulating the full energy balance, snowpack depth and density changes, and wind-driven snow redistribution. PET was calculated using the Priestley–Taylor equation (Priestley & Taylor, Reference Priestley and Taylor1972), based on the daily air temperature and modeled top-of-canopy net radiation.
The gridded total runoff and PET were then used in a soil moisture model (SoilBal; Beamer et al., Reference Beamer, Hill, Arendt and Liston2016) to calculate actual evapotranspiration (ET) and soil water storage, and thus estimate surface and baseflow runoff based on the soil water balance (Flint et al., Reference Flint, Flint, Thorne and Boynton2013). Calculations were performed for areas not covered by glaciers or permanent ice. The resulting surface and baseflow runoff were used in a runoff routing model (HydroFlow) to calculate discharge hydrographs in a subset of the SnowModel domain, including the Jostedøla River Basin.
HydroFlow (Liston & Mernild, Reference Liston and Mernild2012) routed the total runoff across glaciers and land to downstream areas and calculated a gridded volumetric discharge across the basin. It treated each grid cell in the model domain as a linear reservoir that transfers water from itself and the upslope cells to the downslope cells, which forms a routing network. Two types of transfer mechanisms (i.e., slow and fast responses) were represented by different transfer functions with different timescales. The slow timescale accounted for the time it takes for runoff at each grid cell to enter the routing network, thus representing transport within the snow, ice, and soil matrices. The fast timescale instead accounted for channel flow occurring when runoff enters the routing network, such as discharge in channels on the surface of (supraglacial) and within (englacial) the glacier and discharge in rivers. Fast and slow flow speeds (V f and V s, respectively) were used to account for the different transfer timescales.
2.3. Data
Here, we present the data used in the study to set up the model (Section 2.3.1), drive the simulations (Section 2.3.2), and evaluate the model outputs (Section 2.3.3). All datasets are publicly available and were standardized to a spatial resolution of 100 × 100 m for use in the simulations conducted in this study. This standardization was achieved either by reducing the number of data points through computing the mean or sum, or by interpolating coarser-resolution data to increase spatial resolution.
2.3.1. Data for model setup
A 50 × 50 m resolution Digital Terrain Model (DTM) from the Norwegian Mapping Authority was used in both SnowModel and HydroFlow to set up the model domain and topography. The 30 m resolution SatVeg digital vegetation map, created by the Norwegian Directorate for Nature Management (Johansen et al., Reference Johansen, Aarrestad and Øien2009), was used to determine snow-holding depth for different vegetation types and to simulate wind-driven redistribution of snow in SnowModel. A 250 × 250 m resolution soil texture map from the SoilGrids global digital soil mapping (Poggio et al., Reference Poggio, de Sousa, Batjes, Heuvelink, Kempen, Ribeiro and Rossiter2021) was used to calculate the soil water content in SoilBal. The drainage basin boundary of the Jostedøla River Basin used in HydroFlow was derived from the 1:50,000 Norwegian N50 map, which was downloaded from NVE Temakart.
2.3.2. Climate forcing
SnowModel required five different climate-forcing inputs to drive its energy-balance and wind-redistribution calculations. These datasets are distributed on grids of varying spatial resolutions, with the distance between grid points varying across datasets to represent weather conditions across the simulation domain. Air temperature and precipitation were obtained from the 1 × 1 km resolution seNorge2018 dataset of the Norwegian Meteorological Institute (Lussana et al., Reference Lussana, Tveito, Dobler and Tunheim2019). This dataset was produced by interpolating observations from weather stations across Norway and combining broad regional patterns with local data to improve accuracy in the original study. Relative humidity, wind speed, and wind direction were obtained from the bias-adjusted 2.5 × 2.5 km-resolution Norwegian Reanalysis Archive hindcast (NORA10; Haakenstad & Haugen, Reference Haakenstad and Haugen2017; Reistad et al., Reference Reistad, Breivik, Haakenstad, Aarnes, Furevik and Bidlot2011), which was developed specifically for southwestern Norway.
2.3.3. Data used for tuning model parameters and evaluating simulations
This study utilized discharge data from two gauge stations operated by the NVE, available on sildre.nve.no: Nigardsbrevatn (GS 1, ID: 76.5.0) and Bruvollelvi (GS 2, ID: 76.15.0) (Fig. 1). These data are directly comparable to our model results because neither gauge station is regulated nor located downstream of reservoirs or water intakes where discharge is influenced by water management. Discharge data from Nigardsbrevatn were used to constrain HydroFlow and tune its parameters, whereas those from Bruvollelvi were used to evaluate the simulated outputs.
2.4. Model configuration and parameter tuning
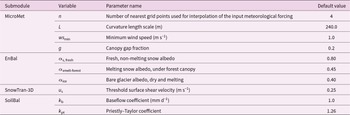
Several parameters were involved in the modeling chain described in Section 2.2. The default values of well-constrained parameters, calibrated in the original publication of the models (Liston & Mernild, Reference Liston and Mernild2012) and adopted in many other similar studies (e.g., Beamer et al., Reference Beamer, Hill, Arendt and Liston2016), were also used in this study. These are described in Table 2.
The primary model parameter variables, names, default values, and the submodule in which they are used
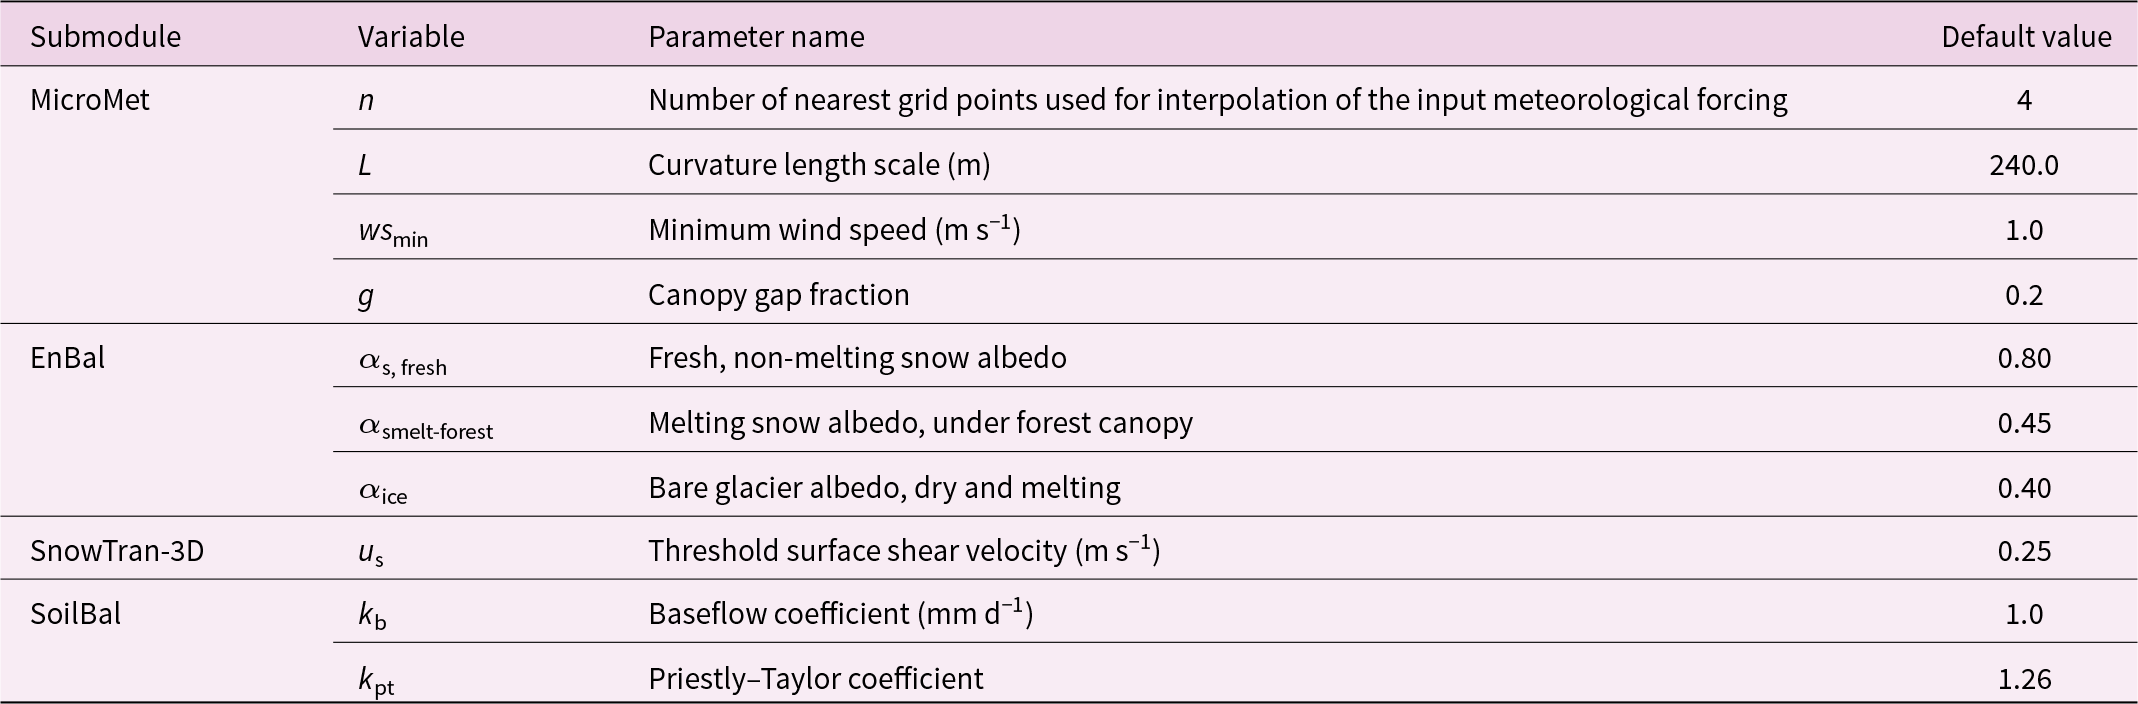
Table 2 Long description
The table details primary model parameters, including their names, default values, and the submodules they are used in. Key parameters include the fresh and non-melting snow albedo with a default value of 0.80 in the EnBal submodule, and the minimum wind speed set at 1.0 m/s in the MicroMet submodule. The table also notes a canopy gap fraction of 0.2 and a baseflow coefficient of 1.0 mm/d in the SoilBal submodule. These parameters are crucial for understanding the model's behavior. The data provides a comprehensive overview of the default settings used in various submodules, which are essential for accurate glacial-hydrological modeling.
Some parameters were site-specific and dependent on local glacial meteorological conditions. For the SnowModel simulation of southwestern Norway (Gong et al., Reference Gong, Tomar, Rogozhina and Basso2025), we calculated the mean monthly air temperature lapse rate and precipitation adjustment factor using the DTM (Section 2.3.1) and air temperature and total precipitation data from 1957 to 2019 from the seNorge2018 gridded observational datasets (Section 2.3.2). Various schemes to compute fractions of rainfall and snowfall were tested. The values of ice albedo and melting snow albedo in forest-free areas were adjusted to produce outputs that best matched the measurements. Specifically, modeled glacier-averaged winter and summer surface mass balances from 2000 to 2014 for 15 glaciers in the region were compared to measurements to calibrate the model. Details regarding the calibration and evaluation of SnowModel’s performance in the study region can be found in Gong et al. (Reference Gong, Tomar, Rogozhina and Basso2025).
In this study, we tuned the fast and slow flow speeds (V f and V s, respectively), which were used in HydroFlow to account for different transfer timescales (Section 2.2). Following Liston and Mernild (Reference Liston and Mernild2012), we used 0.12, 0.20, 0.10, and 0.08 m s−1 as V s for snow-covered ice, snow-free ice, snow-covered land, and snow-free land, respectively, in this study. V f was calculated as a function of V s, adjusted by a terrain-slope scaling factor to account for topographic influence, and further modified by an additional scaling factor α that controls its overall magnitude while preserving the field-measured value. The terrain slope scaling factor provided corrections of 0.4 for a slope of 5°, 1.0 for a slope of 15°, and 2.4 for a slope of 45° (Liston & Mernild, Reference Liston and Mernild2012). The scaling factor α accounted for all flow-speed-affecting factors not explicitly considered, such as snow and ice porosity and channel flow. It was an adjustable parameter that optimized the match between observed and modeled discharge outputs. In this study, the scaling factor α was tuned through a series of sensitivity tests by incrementing its value by 1. The coefficient of determination (R 2) of the linear regression, Nash–Sutcliffe efficiency (NSE), and the root mean square error (RMSE) between the modeled and observed hydrograph at GS 1 were compared (Section 3.1). Finally, a value of 20 was chosen for the scaling factor α.
2.5. Analyses of results
2.5.1. Runoff components
The composition of the runoff available at each cell is as follows:
 \begin{equation}{Q_{{\text{totl}}}} = {Q_{{\text{gl}}}} + {Q_{{\text{s}} - {\text{ngl}}}} + {Q_{\text{r}}},\end{equation}
 \begin{equation}{Q_{\text{r}}} = P - ET + {Q_{\text{b}}},\end{equation}
where Q totl is the total runoff, Q gl (glacier melt water) is the snow and ice meltwater from glacierized areas, Q s-nogl is snow meltwater from areas that are not covered by glaciers, and Q r is the residual, which consists of contributions from rainfall (P) and baseflow (Q b). As seasonal and perennial snow conditions significantly influence glacier surface melt and runoff (van Pelt et al., Reference van Pelt, Pohjola and Reijmer2016), we followed Azam et al. (Reference Azam, Kargel, Shea, Nepal, Haritashya, Srivastava, Maussion, Qazi, Chevallier, Dimri, Kulkarni, Cogley and Bahuguna2021). We used overall glacier meltwater runoff to investigate the contribution of both snow- and glacial-ice meltwater from glacierized areas, rather than only glacial-ice meltwater.
2.5.2. Selection of Warm and Dry days
To understand the buffering effect of meltwater from glacierized and non-glacierized regions on compensating for precipitation deficits, we focused our analysis on the Warm and Dry events during our study period. We adapted the approach of Van Tiel et al. (Reference Van Tiel, Van Loon, Seibert and Stahl2021) to select the Warm and Dry events for which we examined the level of glaciers’ compensation during the warm season (Section 3.3). Accordingly, only days that fulfilled the following three criteria were selected: (1) the mid-date of the 7-day precipitation moving sum was below a specified precipitation threshold; (2) the mid-date of the 7-day positive degree-day (DD7) moving sum exceeded a specified temperature threshold; and (3) these mid-dates fell between June and September. Warm and Dry events included all 7 days within the 7-day window. When the mid-dates of the 7-day window were consecutive, the Warm and Dry events consisted of 3 days before the first mid-date and 3 days after the last mid-date. This selection ensured a minimum of 7 days.
To identify Dry days according to criterion 1 in this study, we initially applied the criterion outlined by Van Tiel et al. (Reference Van Tiel, Van Loon, Seibert and Stahl2021), selecting days when the 7-day moving mean precipitation was less than 2 mm d−1. However, this approach occasionally includes days with precipitation exceeding 3 mm d−1, surpassing the thresholds used in other studies (Chen et al., Reference Chen, Fan, Niu and Zheng2014; Hall, Reference Hall2007; Osmani et al., Reference Osmani, Kim, Jun, Sumon, Baik and Lee2022; Silva et al., Reference Silva, Carvalho, da Silva Dias and Xavier2006; van Wagner, Reference van Wagner1987). Consequently, we refined our criteria to a 7-day precipitation moving sum below 2 mm, limiting the maximum daily precipitation to 2 mm d−1 (Hall, Reference Hall2007; Osmani et al., Reference Osmani, Kim, Jun, Sumon, Baik and Lee2022; Silva et al., Reference Silva, Carvalho, da Silva Dias and Xavier2006). Daily precipitation data spanning from September 2000 to August 2014 were used to calculate the 7-day moving sum of precipitation. This absolute threshold, rather than a relative one, was adopted to highlight the responses of other water sources, such as glacier meltwater, to minimal or no precipitation within the drainage basin.
To identify temperature anomalies and select Warm days according to criterion 2, we applied a relative temperature threshold based on Van Tiel et al. (Reference Van Tiel, Van Loon, Seibert and Stahl2021). For each year, we calculated a DD7 moving sum time series from the daily temperature data. The threshold for selecting Warm days was defined as the 80th percentile of a 30-day moving window, derived from the DD7 time series across all simulation years.
Both NORA10 and seNorge2018 (Section 2.3.2) precipitation and temperature datasets were used to identify Warm and Dry days. Only days that were selected as warm and dry by using both the NORA10 and seNorge2018 datasets were considered as Warm and Dry events.
2.5.3. Gross theoretical hydropower potential
The gross theoretical hydropower potential (GTHP) (in GWh) represents the total electricity generation that could be achieved, assuming that all water flowing at the water intakes could be utilized for this purpose (Hoes et al., Reference Hoes, Meijer, van der Ent and van de Giesen2017). It is calculated as:
 \begin{equation}{\text{GTHP}} = \mathop {{\mathop \sum}}\limits_t \left( {Q \times \Delta t \times \rho \times g \times h} \right) \times {10^{ - 9}},\end{equation}
where Q (m3) is the routed total runoff, Δt is the time step (hour), ρ is the density of water (kg m−3), g is the standard acceleration of gravity (m s−2), and h is the hydraulic head between the water intakes and the hydropower plant (m).
2.5.4. Glaciers’ compensation
For the selected Warm and Dry events, a compensation metric C is calculated following van Tiel et al. (Reference Van Tiel, Van Loon, Seibert and Stahl2021):
 \begin{equation}C = \frac{{{\mathop \sum}_i^jq}}{{{\mathop \sum}_i^j{q_n}}} \times 100\% ,\end{equation}
where C (%) represents the level of compensation, q (m3 d−1) is the 7-day mean discharge during the Warm and Dry events, qn is the 7-day moving mean of the intra-annual mean daily discharge from the long-term (2000–2014) record, and i and j are the start and end of a Warm and Dry event (or the corresponding day-of-year for qn). A 7-day time window was chosen to be consistent with the criteria for selecting Warm and Dry events, assuming that a clear response to low precipitation and high temperature occurred within this period.
The compensation metric C indicates the level of discharge availability on Warm and Dry days relative to a multiyear normal. A value of C greater than 100% indicates that meltwater runoff overcompensates for the rainfall deficit; conversely, when C is less than 100%, snow and ice meltwater cannot fully offset the rainfall deficit, and evaporation and ET increase. The qn used here, based on a 14-year record, represents only the normal state of discharge at the beginning of the 21st century, when the rapid thinning and retreat of glaciers in the Jostedøla basin began to accelerate, as we are interested in knowing the state of compensation during this period rather than analyzing its trend over a long period. The compensation metric is plotted against the contribution level of glacier meltwater (the percentage of glacier meltwater in total runoff) to investigate compensation specifically from the glacier-covered area in Section 3.3.
2.6. Qualitative interviews and survey with stakeholders
To better understand stakeholder perceptions on the role of meltwater from glacier-covered areas in hydropower production, as well as the potential societal impacts of climate-driven changes in hydropower production in southwestern Norway, we conducted semi-structured interviews. Participants included one representative from the local municipality of Luster and one representative from each of two hydropower production companies operating in the region, Småkraft and Statkraft. The municipal participant is a planner in Luster municipality, the host municipality for the hydropower plants, and is closely involved in spatial planning and local decision-making processes that intersect with energy infrastructure. The Småkraft participant is a project manager, while the Statkraft participant is a hydrologist. Together, these roles provide a complementary overview of the socioeconomic, practical, and technical dimensions of hydropower development in the region. Additional information about the hydropower plants and their ownership is detailed in Section 2.1. These interviews aimed to capture insights typically absent from quantitative modeling approaches, such as local knowledge, values, and concerns related to water resource management and energy security. To prepare for the interviews, a questionnaire guide was created to ensure the interviews consistently addressed relevant topics while still allowing participants the flexibility to explore issues they considered important. The interviews were conducted via Zoom and lasted between 30 and 90 minutes. The recorded interviews were transcribed and analyzed thematically (Aronson, Reference Aronson1995) using the qualitative analysis software NVivo.
In addition to the interviews, a targeted survey was sent to the two employees of Småkraft and Statkraft to gather more in-depth information on the importance of different water sources to their hydropower production. This survey was not meant to gather the general public’s perception on this matter but rather the opinion of a limited number of key experts. It also served as a point of comparison to the results generated by our model. The survey was distributed via Nettskjema, a secure online data-collection platform developed by the University of Oslo. A total of three surveys were distributed and completed by the interview participants, each containing a mix of five open-ended and closed-ended questions. Participants received detailed information about the study's purpose, specifics, privacy, and their rights to anonymity, as well as how their data would be used. This communication occurred via email, at the beginning of each interview, and was clearly outlined before respondents began the survey. The interview guides and the survey questions are both available in the Supplementary Material.
To complement the qualitative dataset, we conducted a content analysis (Bowen, Reference Bowen2009) of relevant online documents, including production and sustainability reports from the hydropower production companies (Småkraft, Reference Småkraft2024; Statkraft, Reference Statkraft2020) and official documents on hydropower taxation policies from the Norwegian Tax Authorities (Skatteetaten, n.d.). This approach allowed for the integration of stakeholder perspectives into both local and national discourses, providing a more comprehensive understanding of the societal dimensions of hydropower production. The data from both interviews and surveys were analyzed deductively, guided by predetermined themes outlined in the interview guide in the Supplementary Material, which was derived from the research objectives and the existing literature on hydropower production, energy security, and climate adaptability and resilience.
3. Results
3.1. Evaluation of the model's capability to simulate discharge
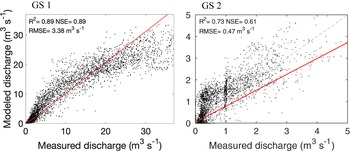
We compared the modeled results with observations to evaluate the performance of our simulations. Despite consistent biases in estimating low and high flows, the model effectively captured discharge dynamics at both the calibration and validation sites. The model’s ability to simulate observed discharge was assessed using Figure 2, which compared daily modeled and observed total discharge at Nigardsbrevatn (GS 1) and Bruvollelvi (GS 2).
Scatterplot of modeled and observed daily streamflow discharge in September 1, 2000 to August 31, 2014 for gauge stations 1 and 2 (GS 1 and GS 2). The linear regression line is shown in red. The dashed gray line is the diagonal line. The coefficient of determination (R 2) of the linear regression, Nash–Sutcliffe efficiency (NSE) coefficient, and root mean square error (RMSE) are shown at the upper-left corner.
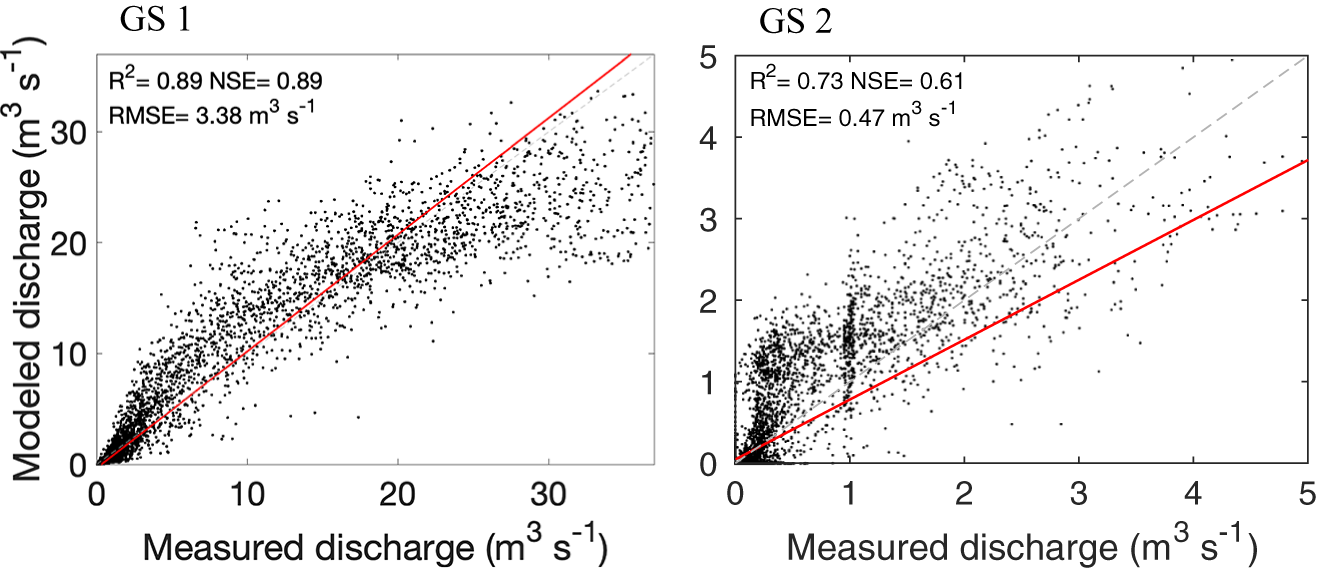
Figure 2 Long description
The left panel shows a scatterplot for gauge station GS 1, comparing modeled discharge on the y-axis (m superscript 3 s superscript -1) and measured discharge on the x-axis (m superscript 3 s superscript -1). The plot includes a linear regression line in red. Statistical metrics are displayed: coefficient of determination (R superscript 2) equals 0.89, Nash-Sutcliffe Efficiency coefficient (NSE) equals 0.89 and Root Mean Squared Error (RMSE) equals 3.38 m superscript 3 s superscript -1. The right panel shows a scatterplot for gauge station GS 2, with modeled discharge on the y-axis and measured discharge on the x-axis. A linear regression line is shown in red, along with a dashed grey diagonal line. Statistical metrics are provided: R superscript 2 equals 0.73, NSE equals 0.61 and RMSE equals 0.47 m superscript 3 s superscript -1.
The observed discharge at Nigardsbrevatn was utilized to calibrate the model's parameters. Observed discharge at Nigardsbrevatn was used to calibrate the model parameters. Performance metrics – the NSE and the coefficient of determination (R 2), both 0.89, calculated from daily outputs over the entire study period – indicated that the model accurately reproduced observed discharge. However, the model tended to overestimate low flows and underestimate high flows, resulting in an RMSE of 3.38 m3 s−1. Discharge at Bruvollelvi was excluded from parameter tuning and instead served as an independent test for model performance. Here, the NSE decreases to 0.61, and the R 2 is 0.73. While the agreement between modeled and observed discharge remained reasonable, the model similarly overestimates low discharges.
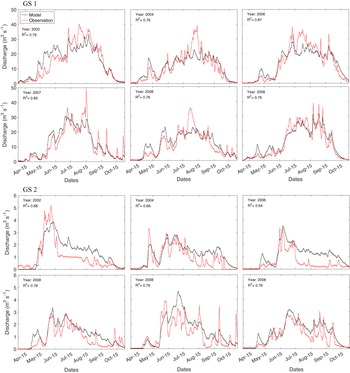
We further compared modeled and observed hydrographs at both gauge stations for years with Warm and Dry events (Fig. 3). The model reproduced discharge seasonality well at both stations. However, the linear relationship between modeled and observed hydrographs at the validation station Bruvollelvi was not as strong as that at the calibration station Nigardsbrevatn (see R 2 in Fig. 3). Nigardsbrevatn is located by a river with a significantly higher discharge compared to Bruvollelvi. The former typically peaks between July and September, whereas the latter peaks between June and July. Similarly, low discharge values are often overestimated by the model, particularly for Bruvollelvi and outside the peak discharge period for Nigardsbrevatn.
Comparison between modeled and observed daily discharge at gauge stations 1 and 2 (GS 1 and GS 2) in years when Warm and Dry days are detected.
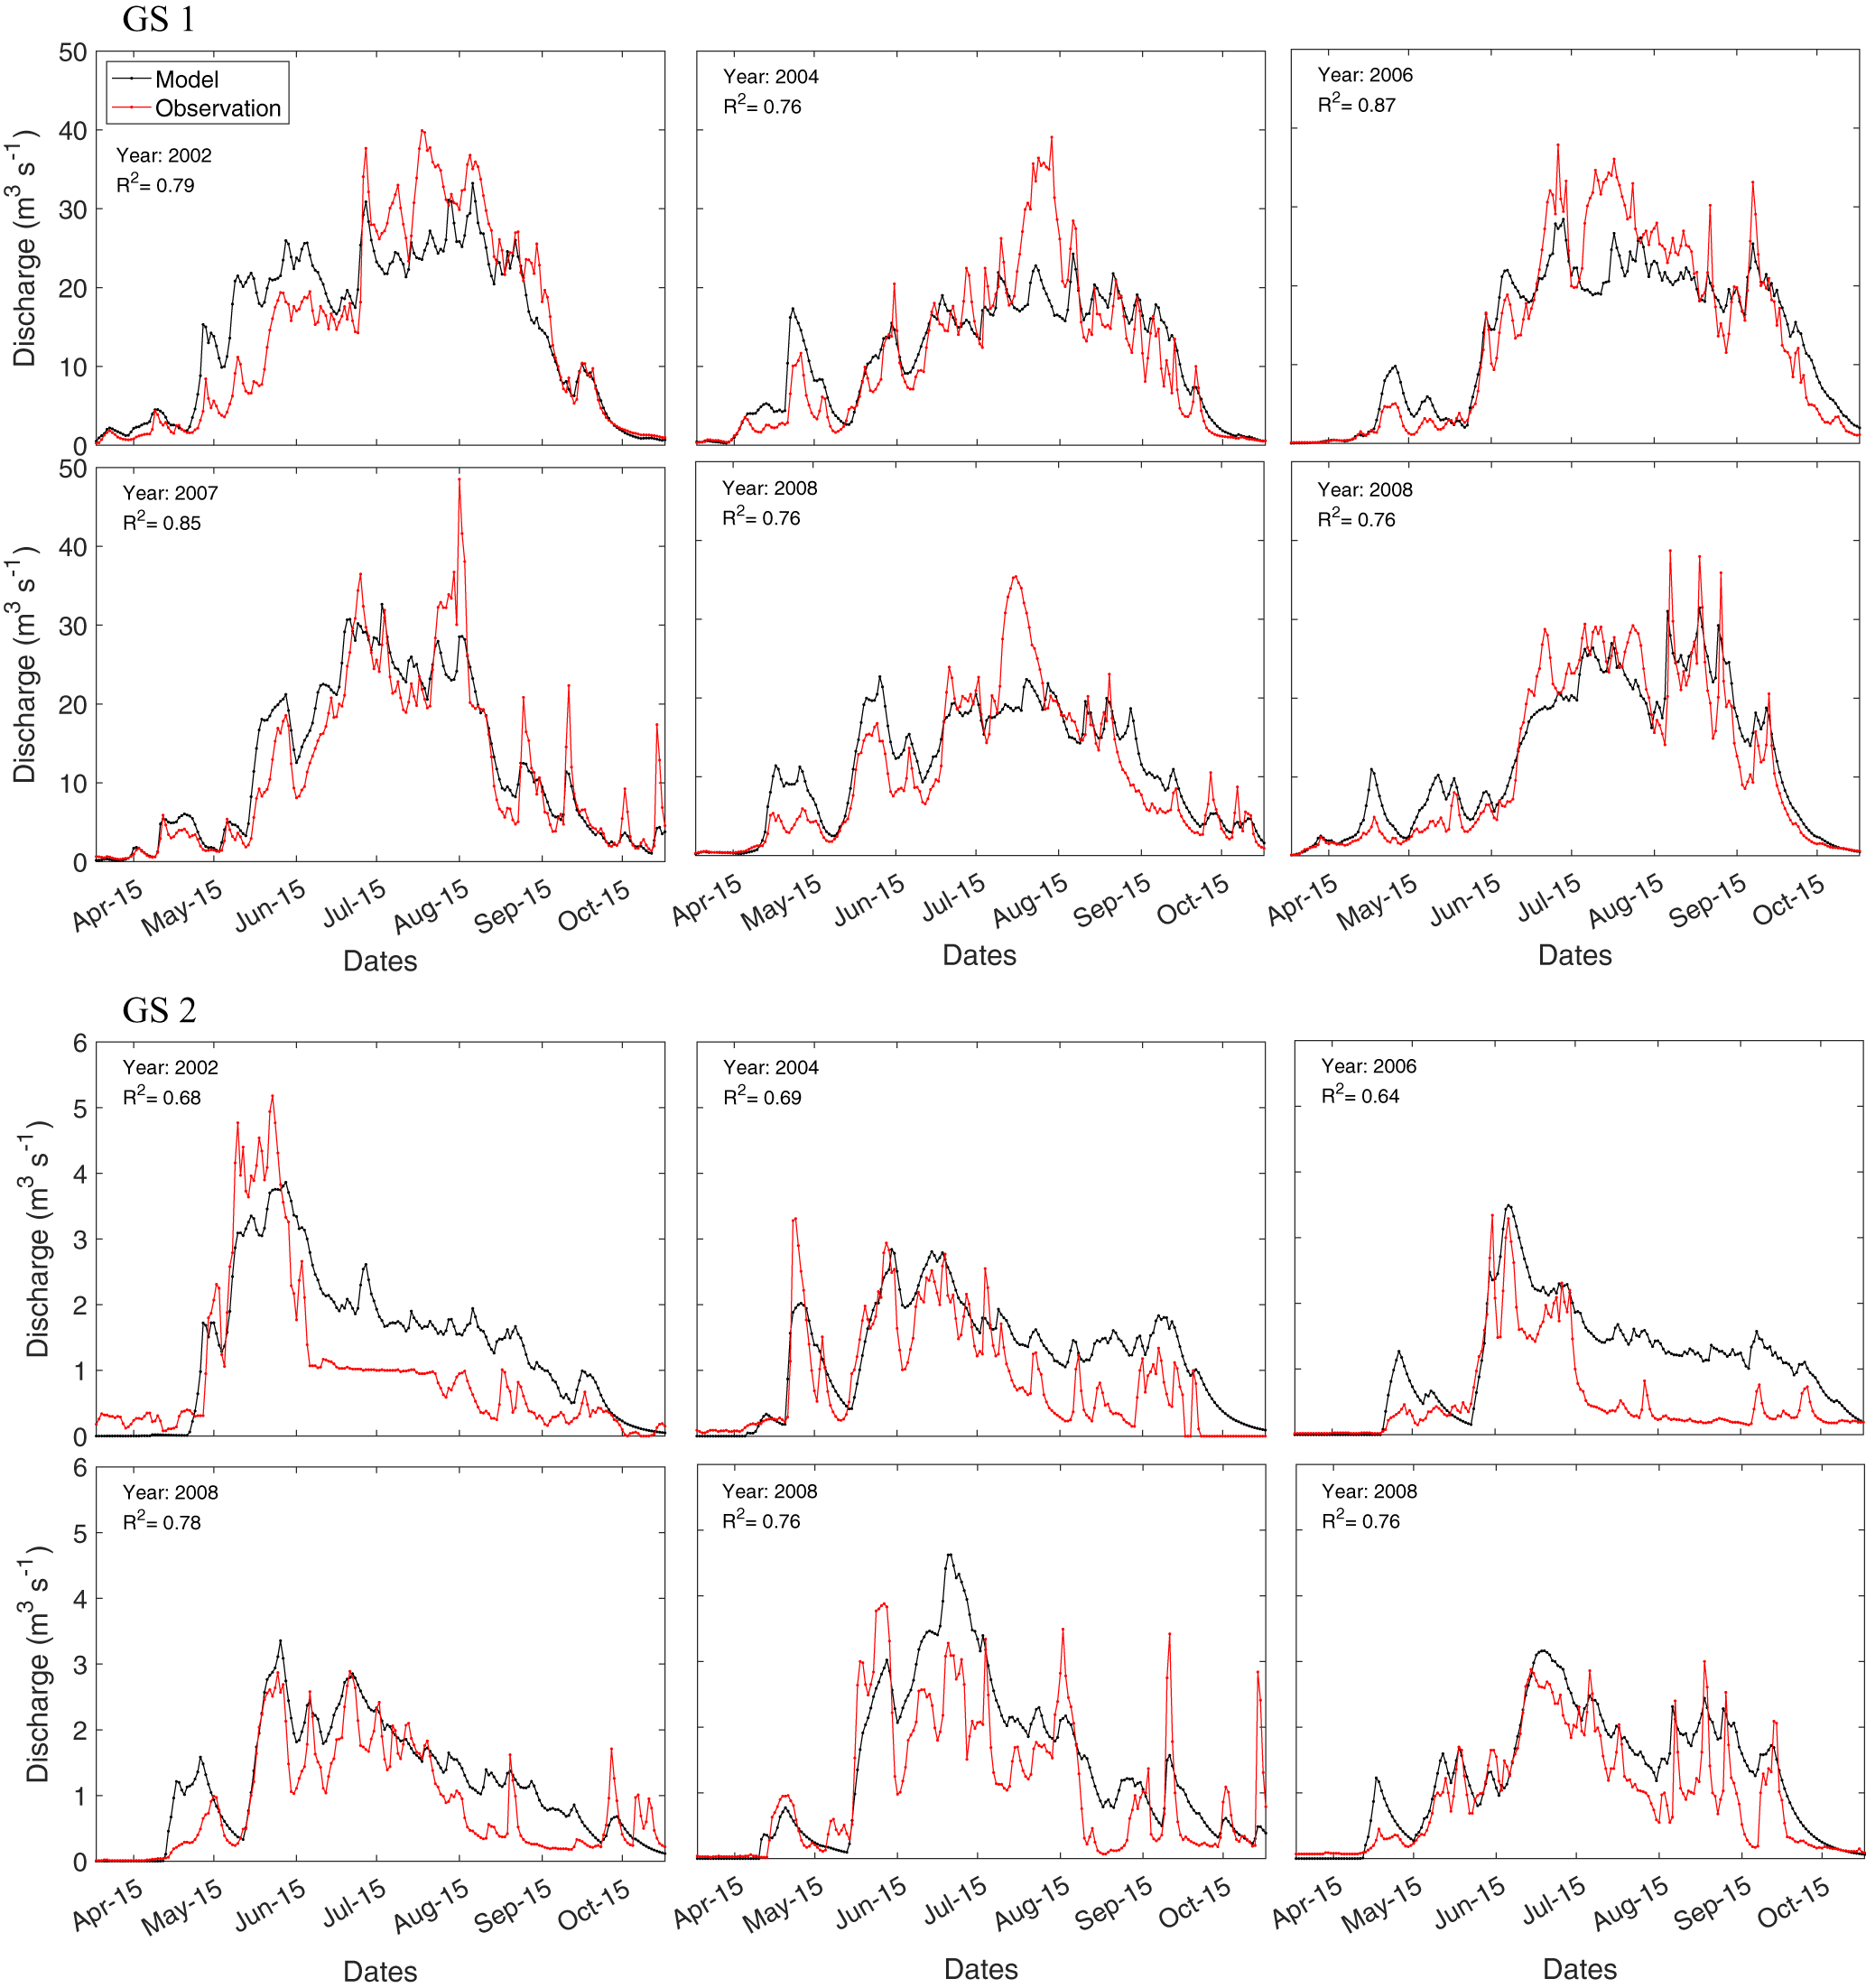
Figure 3 Long description
The image contains eight line graphs comparing modeled and observed discharge at two gauge stations, GS 1 and GS 2, in years when Warm and Dry days are detected. Each graph has the x-axis labeled 'Dates' and the y-axis labeled 'Discharge (m superscript 3 s superscript -1)'. For GS 1, the graphs are for the years 2002, 2004, 2006 and 2008, with R squared values of 0.79, 0.76, 0.87 and 0.76 respectively. For GS 2, the graphs are for the years 2002, 2004, 2006 and 2008, with R squared values of 0.68, 0.69, 0.64 and 0.76 respectively. Each graph shows two lines, one for the model and one for observation, illustrating the discharge patterns over time for each year and station.
3.2. Contributions to total runoff at water intakes and the resulting GTHP
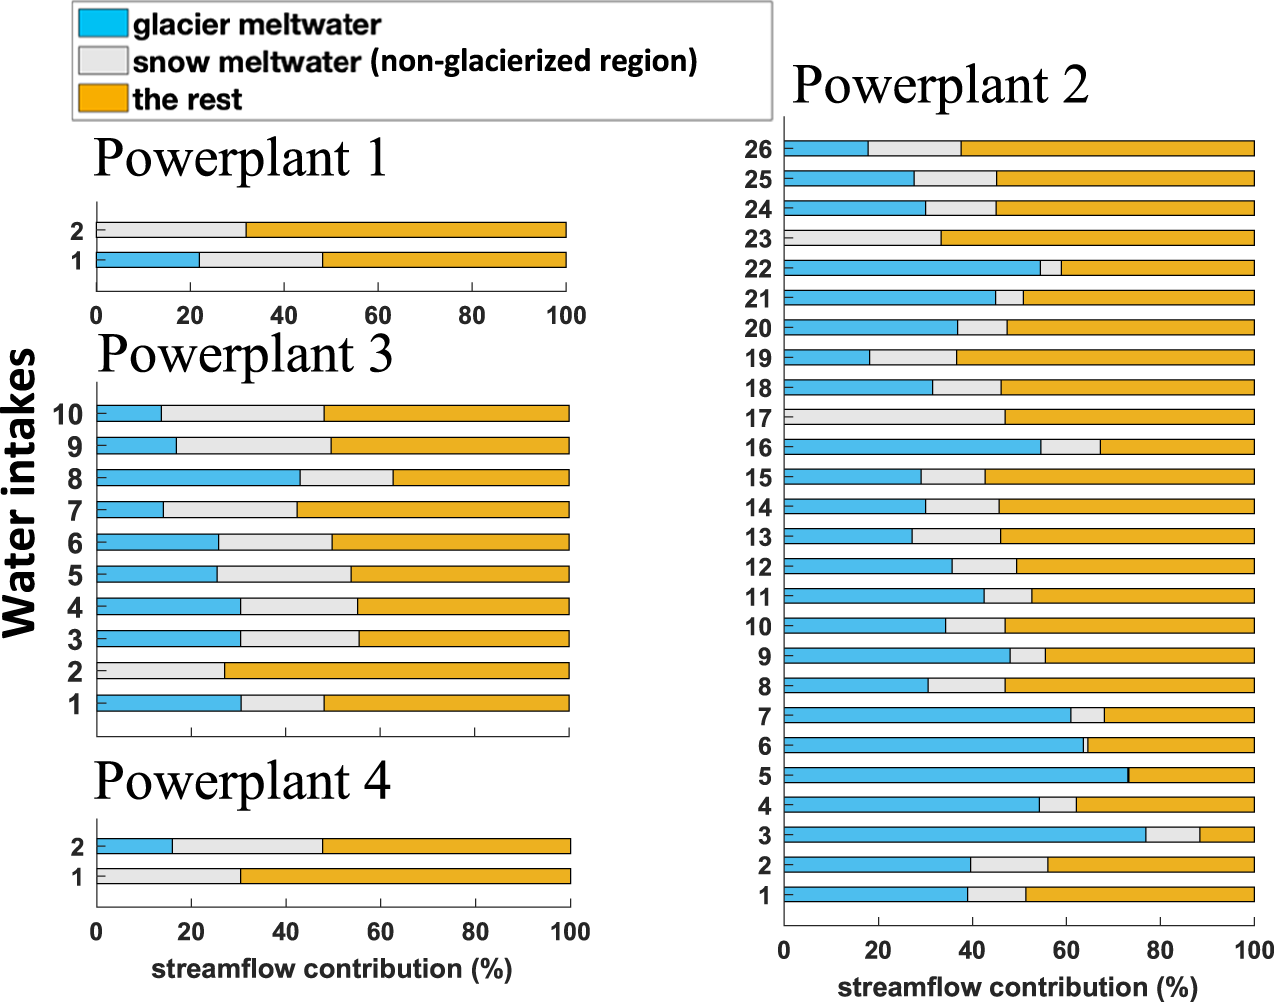
This section evaluates the relative contributions of different water sources to hydropower generation across four power plants, highlighting the seasonal importance of glacier meltwater, especially during summer months. Figure 4 illustrates the 14-year average contributions of different water sources (Section 2.5.1) to the total water intake of the four power plants. Our model results indicated that rainfall and baseflow were the most significant contributors to all four power plants, with an average contribution of 60.0%, 47.5%, 50.7%, and 60.9% across all the water intakes for Vanndøla (P1), Jostedal (P2), Leirdøla (P3), and Røneid (P4), respectively. For Jostedal, glacier meltwater was the second most significant contributor (38.5%). Glacier meltwater accounted for 23.0% of Leirdøla’s total water intake. For the smaller power plants, Vanndøla and Røneid, which receive water from less glacier-covered areas, glacier meltwater contributed just 10.9% and 8.0%, respectively. The contribution of glacier meltwater varied significantly across water intakes, with some receiving none. The average contribution from snow meltwater from non-glacier-covered areas to all power plants was also notable, with 29.1% for Vanndøla, 14.0% for Jostedal, 26.2% for Leirdøla, and 31.1% for Røneid.
Multi-annual mean contribution of different components to total runoff at the water intake of hydropower stations 1–4. The water intakes of each hydropower plant are numbered in Figure 1 from top to bottom, corresponding to their vertical locations.
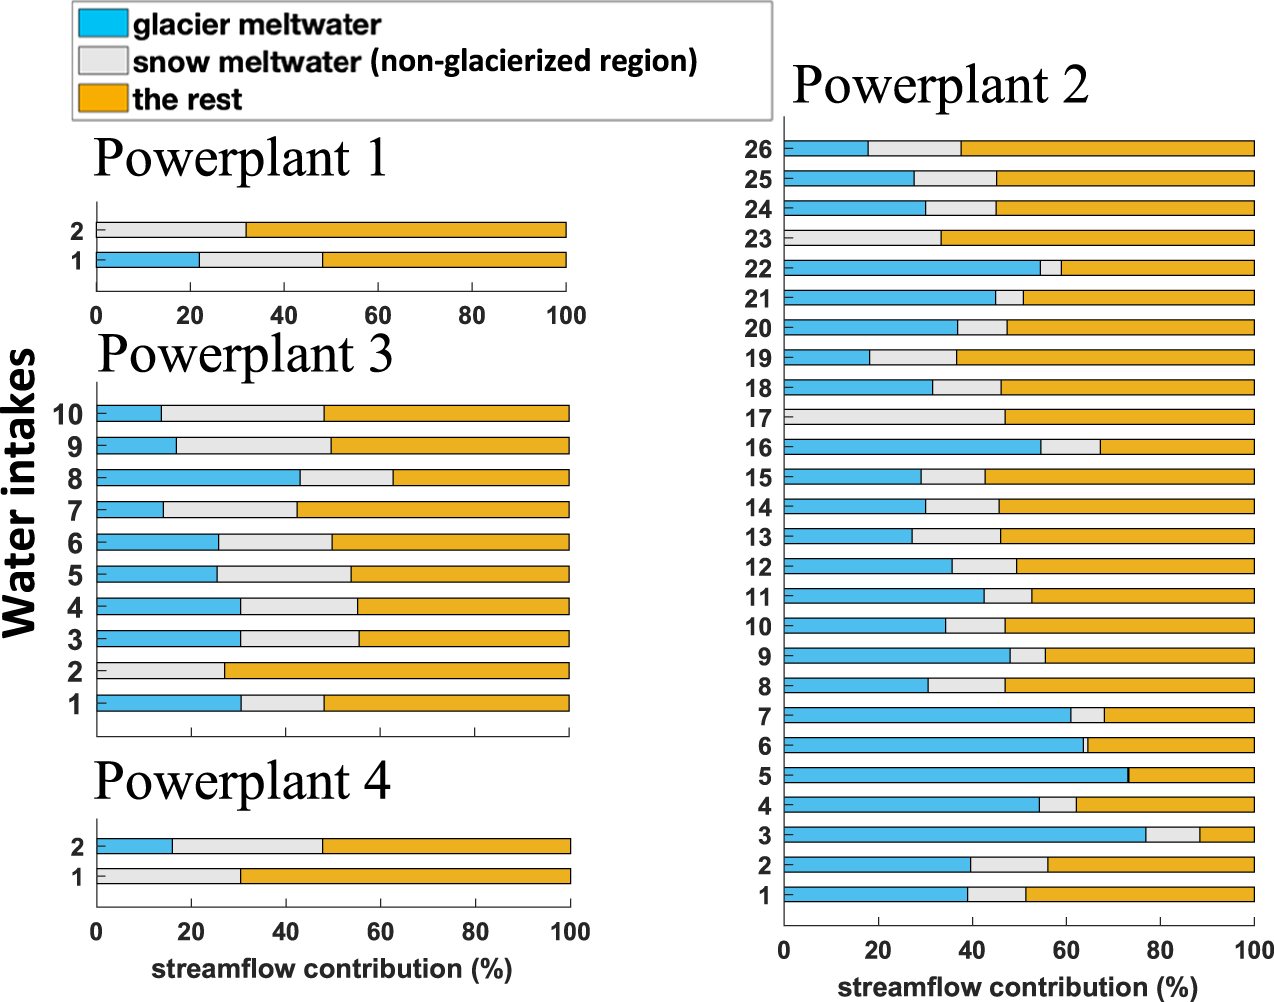
Figure 4 Long description
The image contains bar charts for four powerplants, each showing streamflow contributions from meltwater originating from glacierized regions, snow meltwater from non-glacierized regions and other sources. Powerplant 1 has two water intakes, Powerplant 2 has twenty-six, Powerplant 3 has ten and Powerplant 4 has two. Each bar represents a water intake, with the x-axis labeled as streamflow contribution in percent. The contributions are color-coded: glacier meltwater, snow meltwater and the rest. The charts illustrate the varying proportions of each water source for the different intakes across the powerplants.
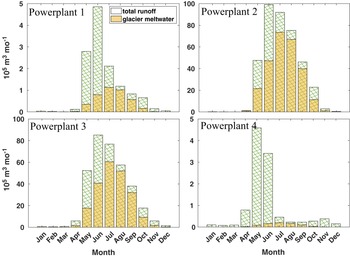
The values in Figure 4 represent the mean annual contributions of the modeled water balance components of the selected power plants. The seasonal distribution of glacier meltwater relative to total water intake, however, reveals a more nuanced pattern. Figure 5 shows the modeled monthly distribution of glacier meltwater for the same 14-year period (2000–2014). The results confirm that the proportion of glacier meltwater was substantially higher during the summer months (June–September), particularly for Jostedal and Leirdøla, and to a lesser extent for Vanndøla. This effect was most pronounced in late summer (July–September), coinciding with Warm and Dry events. Notably, although glacier meltwater played only a minor role in Vanndøla’s annual contribution (Fig. 4), it accounted for more than half of the total water intake during July–September (Fig. 5).
The intra-annual discharge and glacier meltwater production of power plants 1–4.
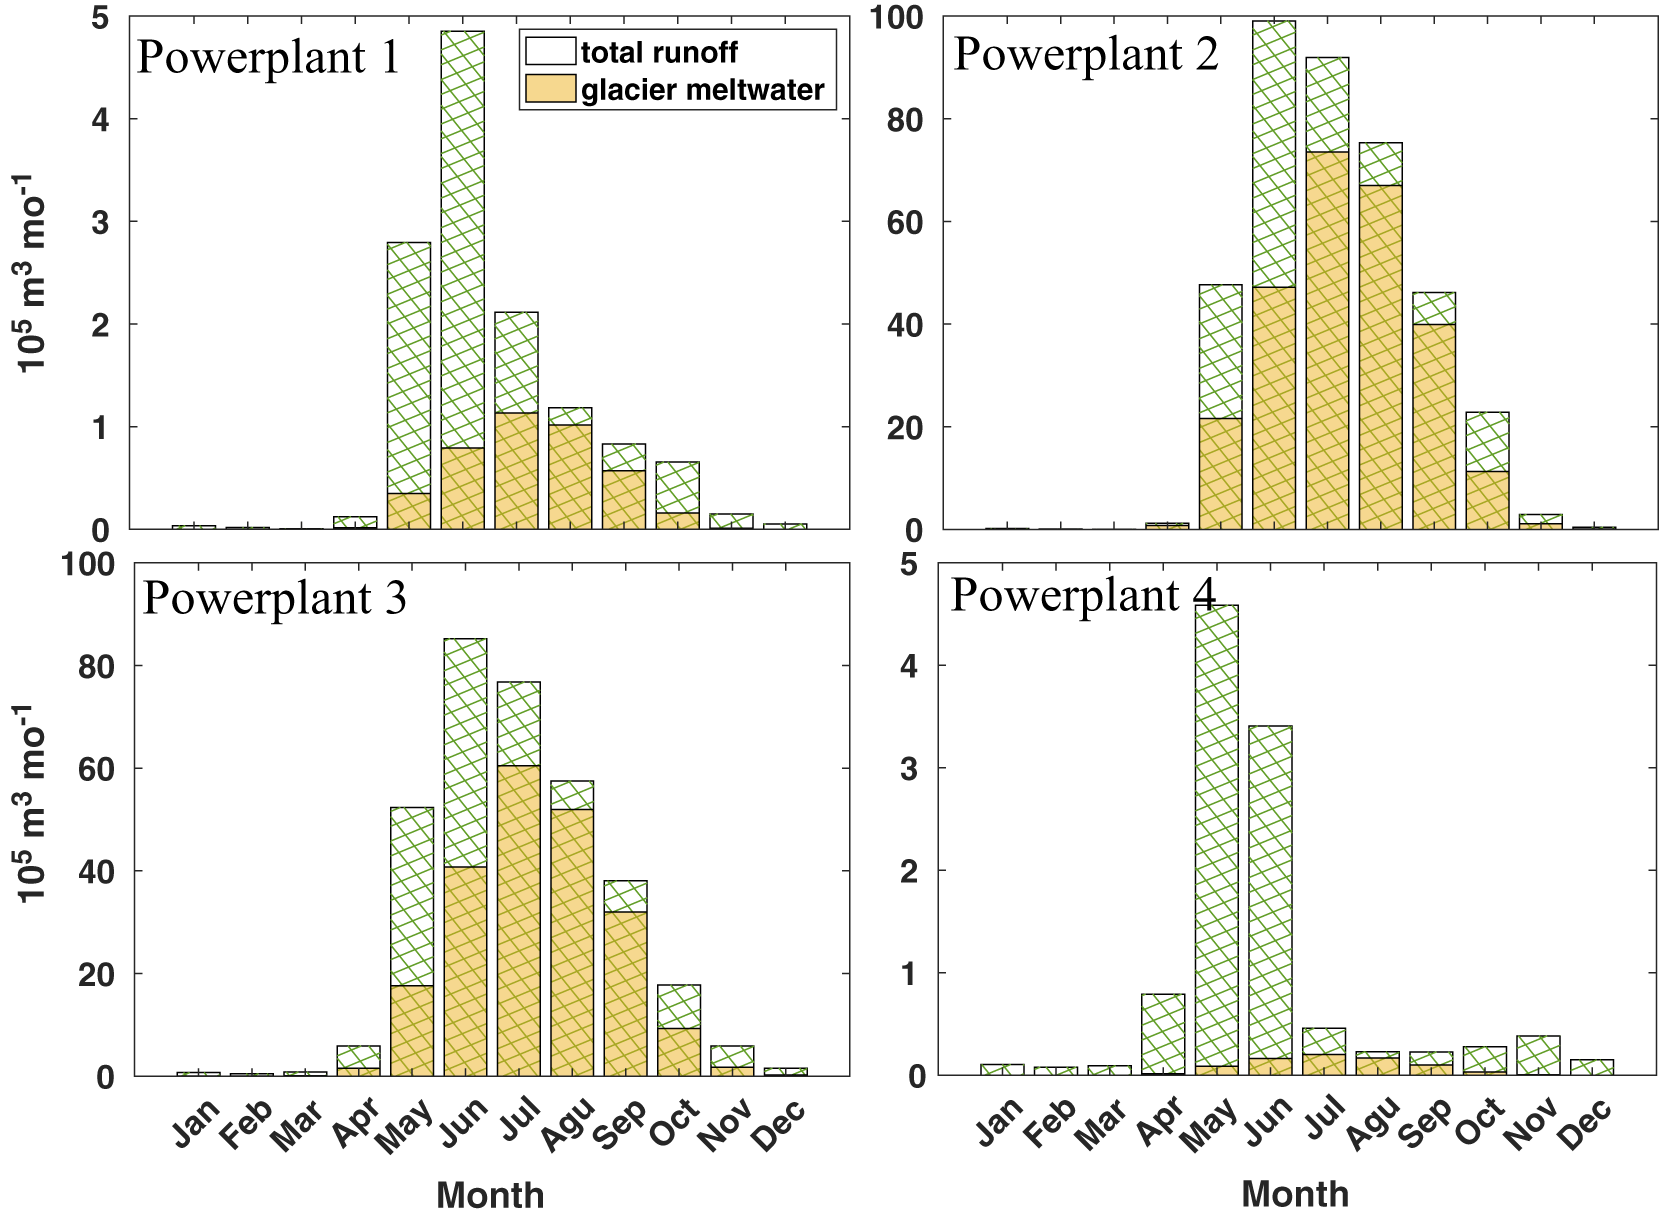
Figure 5 Long description
Each graph has the x-axis labeled 'Month' with months from January to December and the y-axis labeled '10 superscript 5 m superscript 3 mo superscript negative 1'. Powerplant 1 shows peaks in June and July, with glacier meltwater contributing significantly. Powerplant 2 has a similar pattern, with high values in June and July. Powerplant 3 shows the highest values in June, July and August. Powerplant 4 peaks in May, with a smaller contribution from glacier meltwater. The graphs illustrate the seasonal variation in water sources for each power plant.
Table 3 presents the GTHP that could be produced solely from glacier meltwater. For Jostedal and Leirdøla, a substantial share of GTHP already originated from glacier meltwater in May, with the highest values occurring from June through September. Even in October, when temperatures declined and melt rates decreased, glacier meltwater still contributed significantly. For Vanndøla, the GTHP from glacier meltwater was also considerable during summer months and remained non-negligible in May and October, while at Røneid it was smaller but still present. These results suggested that glacier meltwater is an important contributor to hydropower production during summer months, even at intakes with relatively limited glacierized areas.
The intra-annual gross theoretical hydropower potential (GWh) calculated from glacier melt water discharge for power plants 1–4 (P1–P4)

Table 3 Long description
The table measures the gross theoretical hydropower potential in GWh from glacier melt water discharge for four power plants (P1-P4) across each month and annually. Powerplant 2 shows the highest annual potential at 277.7 GWh, with a significant peak in July at 78.9 GWh. In contrast, Powerplant 4 has the lowest annual potential at 1.4 GWh, with minimal monthly variation. Powerplant 1 and Powerplant 3 have annual potentials of 10.4 GWh and 131.9 GWh, respectively, with Powerplant 3 peaking in July at 36.8 GWh. The data indicates a strong seasonal trend, with all power plants showing increased potential during the summer months, particularly in July and August.
3.3. Glacier compensation during Warm and Dry events
Building on the analysis of runoff contributions to hydropower plant intakes, this section evaluates the extent to which glacier meltwater can compensate for reduced runoff during Warm and Dry events. The results show that the degree of compensation varies with season, plant size, and degree of glaciation. Because we applied more stringent criteria for Dry-Day selection than previous studies (Van Tiel et al., Reference Van Tiel, Van Loon, Seibert and Stahl2021) (Section 2.5.2), fewer Warm and Dry days were identified: a total of five events (47 days) in June and two events (17 days) in August across 6 years of the study period (Table 4).
The mid-dates of Warm and Dry events and the number of Warm and Dry days

Table 4 Long description
The table shows the mid-dates and duration of Warm and Dry events detected in June and August in the years 2002, 2004 and 2006 - 2009. In June 2006, the longest event lasted 11 days, occurring from the 9th to the 13th. June 2008 also had an 11-day event, while June 2009 had the shortest event with 8 days. In August, the longest event was in 2004, lasting 9 days from the 11th to the 13th. Notably, no warm and dry events were recorded in August from 2006 to 2009. This suggests a trend of more frequent events in June compared to August during these years.
The compensation metric (Section 2.5.4) was calculated for the identified Warm and Dry events, accounting only for the discharge at water intakes that received glacier meltwater. This metric expresses discharge availability relative to a multiyear baseline. Values of the compensation metric larger than 100% indicate that snow and ice meltwater runoff more than compensates for rainfall deficits (overcompensation). Conversely, values below 100% mean that snow and ice meltwater cannot fully offset the combined effects of reduced rainfall and higher evaporation and ET.
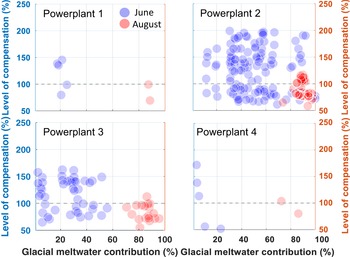
Since the compensation level was evaluated through the calculation of a ratio (Section 2.5.4), the over-/underestimation identified in Section 3.1 should not significantly affect the investigation. To examine whether the level of compensation was provided by glacier meltwater, we plotted the compensation metric calculated for these water intakes during each Warm and Dry event in June or August against the glacier meltwater contribution to total runoff (Fig. 6).
Each of the two small run-of-river power plants, Vanndøla and Røneid, only had one water intake which received glacier meltwater (Fig. 4). For both plants, reductions in total runoff relative to the 2000–2014 average caused by rainfall deficits during Warm and Dry days were overcompensated in three of the five June events (Fig. 6). In these cases, the additional input of glacier meltwater not only offset the rainfall shortage but also raised total runoff above the long-term average (overcompensation), resulting in higher-than-normal water availability.
The level of compensation plotted against the contribution of glacier meltwater to total runoff (Q gl/Q totl × 100%) for each of the water intakes of hydropower stations 1–4 that receive meltwater from the glaciers. They are plotted for the Warm and Dry days of each year in either June (blue circles; left axis) or August (red circles; right axis).
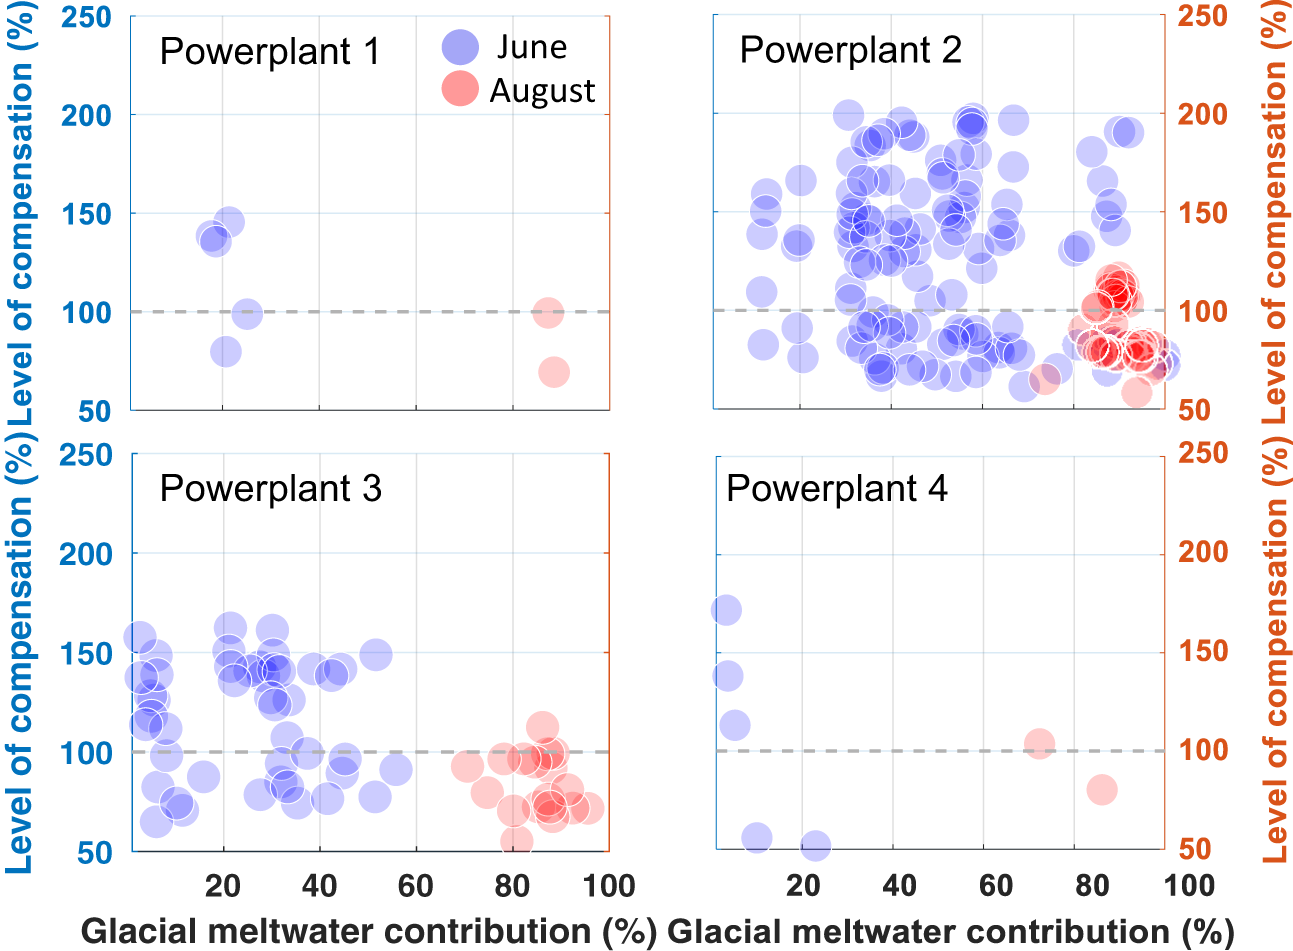
Figure 6 Long description
The image contains four scatter plots, each representing a different power plant (P1 to 4). The x-axis is labeled 'Glacial meltwater contribution (percent)' and the y-axis is labeled 'Level of compensation (percent)'. Each plot shows data points for June (blue circles) and August (red circles), in which Warm and Dry days are detected. P1 shows a few data points with higher compensation levels in June. P2 has a dense cluster of data points around the 100 percent compensation level, with more variation in June. P3 displays a spread of data points, with some exceeding 100 percent compensation. P4 has fewer data points, mostly below 100 percent compensation. The plots illustrate the relationship between glacial meltwater contribution and compensation levels for each power plant during the specified months.
During the Warm and Dry events detected in this study, the contribution from glacier meltwater was less than 30%, indicating that compensation was primarily provided by other sources, such as snowmelt from non-glacierized regions, rather than glacier meltwater. On the other hand, precipitation deficits affecting total runoff in August were only partially or inadequately compensated for during Warm and Dry events, despite total runoff being predominantly composed of glacier meltwater (over 70%). For the large power plants, Jostedal and Leirdøla, with multiple water intakes that received glacier meltwater (Fig. 4), the compensation metric during Warm and Dry days in June showed more scattered values. Especially for Jostedal, the total runoff of more than half of the water intakes could be compensated or overcompensated with a wide range of glacier meltwater contributions. However, for Vanndøla and Røneid, although glacier meltwater contributed more than 70% to the total runoff across their water intakes, the lack of precipitation could not be compensated for or could only be compensated to a small extent during Warm and Dry events in August.
3.4. Perceptions of hydropower companies and societal implications of changes in glacier runoff for hydropower production
Building on the modeled results described earlier, the qualitative interviews and survey with the operators of the four hydropower plants in the study area revealed that a future reduction in glacier meltwater and snowmelt, which is a likely consequence of continued climate change, may affect energy production in the basin more strongly than anticipated by hydropower companies operating run-of-river plants without reservoirs.
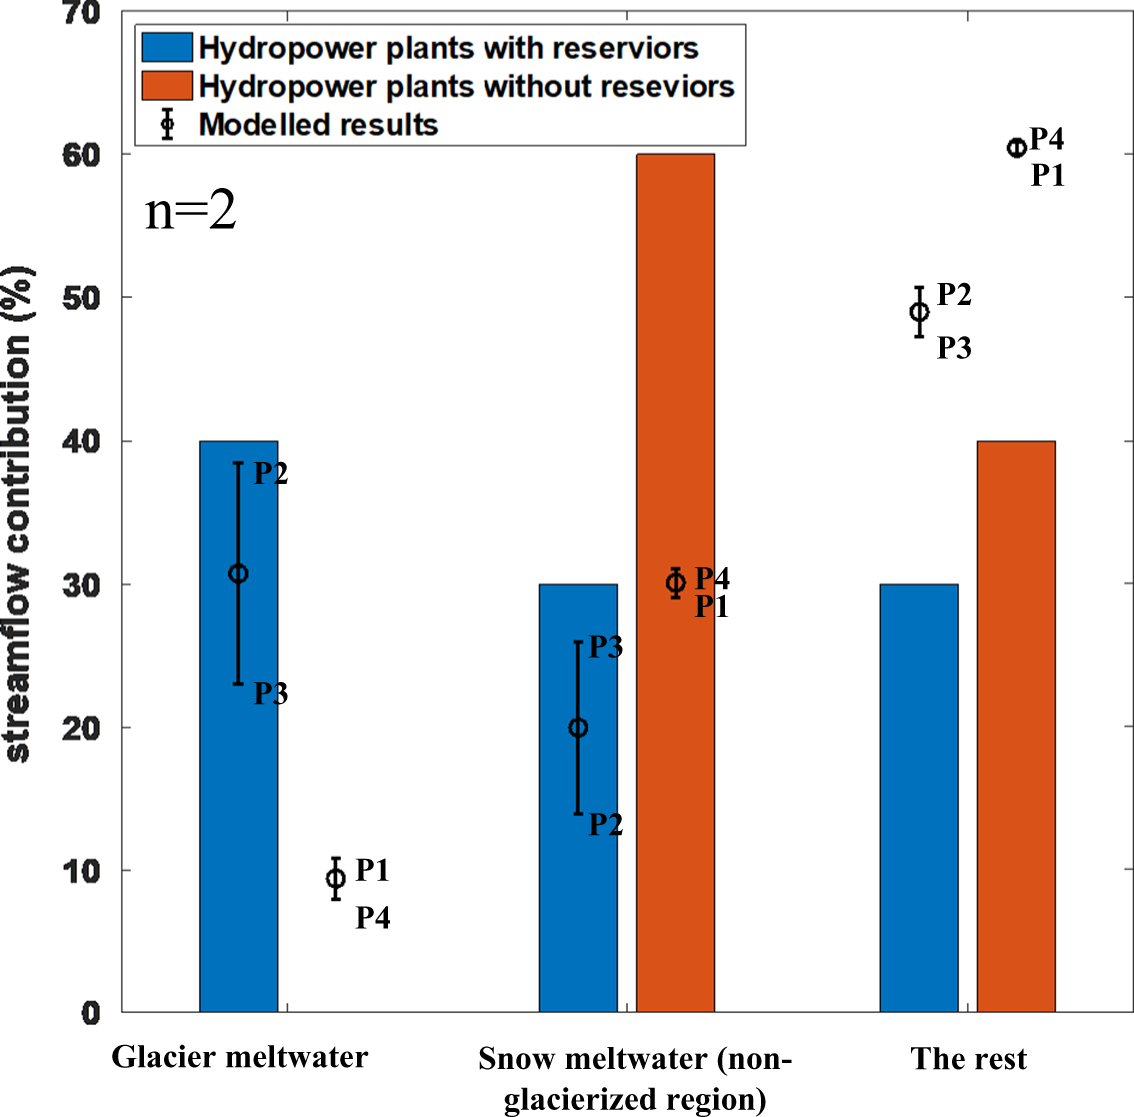
The consistency between the perceptions of hydropower operators at Jostedal and Leirdøla and the modeled results supports the experts’ understanding of the significant role of glacier meltwater in hydropower generation, despite their overestimation of the exact contributions (Fig. 7). However, operators of the smaller run-of-river plants, Vanndøla and Røneid, assumed that glacier meltwater did not contribute to their production. Furthermore, the operators overestimated snowmelt from non-glacier areas for Vanndøla, Røneid, and Leirdøla. This discrepancy was particularly pronounced for power plants without reservoirs, where the perceived contribution of snowmelt was nearly twice the modeled value.
The empirical estimates of streamflow contribution from hydropower plant employees of hydropower stations 1–4 (P1–P4) (the bar graph) compared with the average modeled results (circle marker), with vertical bars showing the higher and lower estimates. The two employees (n=2) have provided a combined estimate for hydropower plants with a reservoir (P2 and P3), represented by blue bars, and for hydropower plants without a reservoir (P1 and P4), represented by red bars. These estimates only indicate a general perception of the hydropower companies.
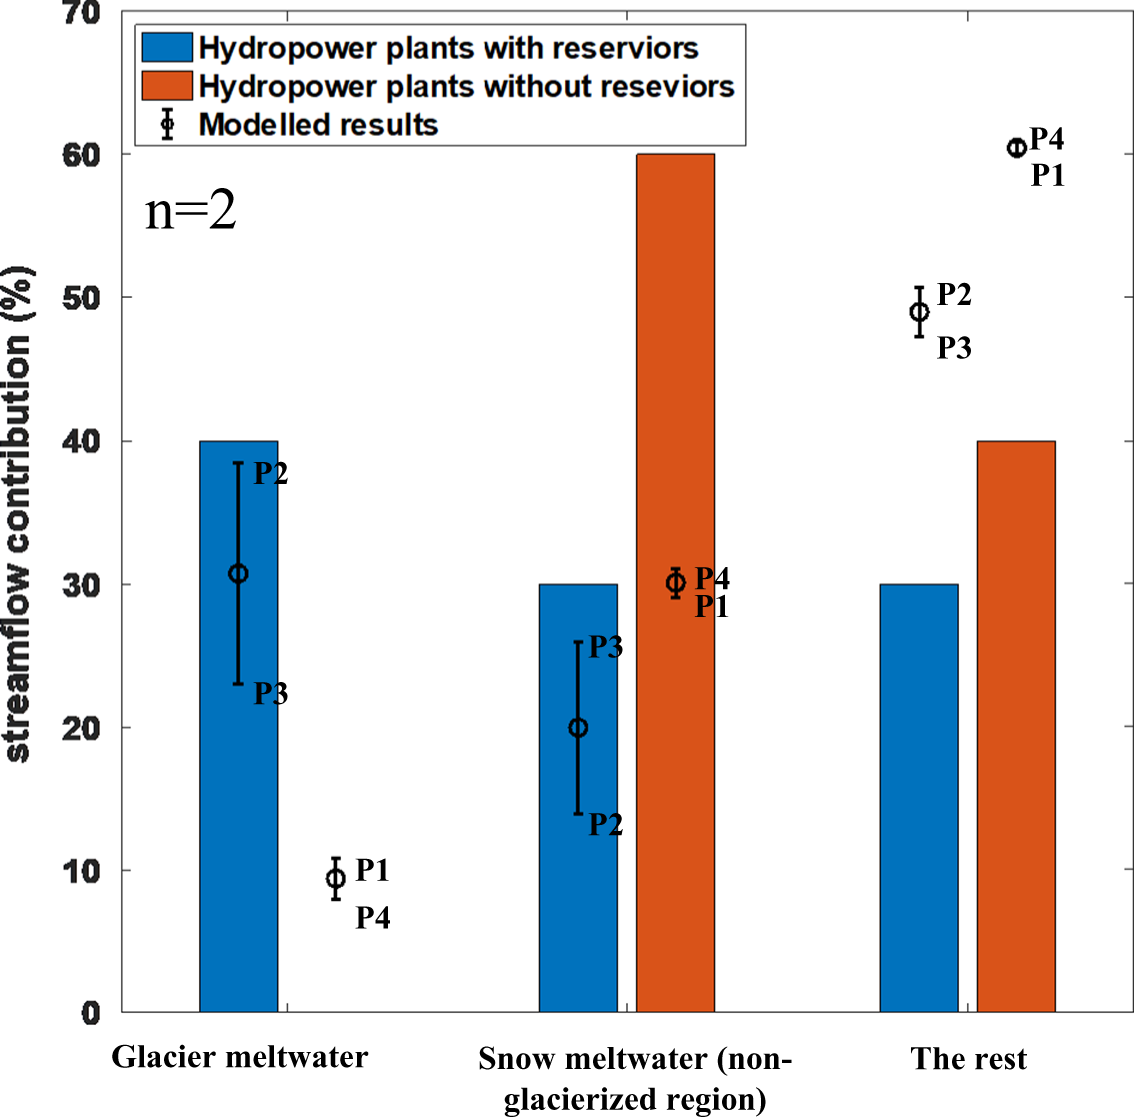
Figure 7 Long description
A bar graph displays empirical estimates of streamflow contribution percentages from hydropower plant employees for hydropower plants with reservoirs (blue bars) and without reservoirs (red bars). The categories are glacier meltwater, snow meltwater from non-glacierized regions and the rest. Modeled results are indicated by circle markers with vertical bars showing higher and lower estimates. Plants P2 and P3 are associated with reservoirs, while P1 and P4 are without. The sampling size is 2 (n=2).
Our qualitative content analysis of the sustainability reports of power companies operating in the basin suggests that the challenges posed by a potential future loss of glacier and snowmelt inflows were ignored. While the Statkraft 2020 Sustainability Report (Statkraft, Reference Statkraft2020) does emphasize the risks posed by climate change, these were linked only to increased prevalence of extreme precipitation events and to safety and operational risks associated with changes in weather patterns. The analyzed documents contained no discussion of the contribution from glacial and snowmelt water, the long-term impacts of glacier retreat, or future seasonal variability in water supply. On the other hand, in the Småkraft 2024 Sustainability Report (Småkraft, Reference Småkraft2024), climate change was presented as having a positive impact on hydropower production, with increased precipitation contributing to an overall rise in energy output. However, while overall precipitation in Norway is projected to increase (Hanssen-Bauer et al., Reference Hanssen-Bauer, Førland, Haddeland, Hisdal, Mayer, Nesje, Nilsen, Sandven, Sandø, Sorteberg and Ådlandsvik2017), the frequency of droughts is expected to rise in southwestern Norway (Spinoni et al., Reference Spinoni, Vogt, Naumann, Barbosa and Dosio2018). These reports failed to address the potential impacts of Warm and Dry events, which could critically affect seasonal water supply and operational reliability.
To further investigate the economic impacts, we conducted a combined content analysis of Norwegian energy market documents and a semi-structured interview with a local government representative. The integration of Luster Municipality into the broader electricity markets means that, while a potential loss of hydropower production capacity resulting from reduced water inflows from glaciers and snowmelt may reduce energy production in the municipality in parts of the year, it is unlikely to have a significant impact on local energy prices. However, Luster Municipality and Vestland County have a combined right to 10% of the total electricity produced by hydropower operations within their jurisdictions. The municipalities and counties buy electricity at cost and either sell it on the power market at market value or distribute it to residents at a discounted rate. In addition, Jostedal and Leirdøla generate significant revenue through the natural resource tax, under which all companies with total production above 10,000 kVA in the income year pay NOK 0.013 per kWh produced. All four plants also contribute through property taxes, real estate taxes, and license fees (Energy Facts Norway, 2024; Skatteetaten, n.d.). Income from taxation and the sale of additional electricity on the market is used to fund community services and local initiatives, such as start-up loans for entrepreneurs launching new businesses. A loss of hydropower productivity in the region due to reduced glacier meltwater will thus negatively impact value creation and reduce government revenue streams used to fund social benefits for local communities.
4. Discussion
The importance of glacier meltwater for hydropower production in glacierized catchments in Norway lies in its ability to regulate discharge seasonality. While the long-term total runoff in a basin is primarily determined by annual precipitation, glacierized areas provide the most meltwater in summer months, when other water sources for hydropower are at a minimum (Pelto, Reference Pelto, Singh, Singh and Haritashya2011). Although both summer temperature and Warm days in southwestern Norway are projected to increase throughout the 21st century (Hanssen-Bauer et al., Reference Hanssen-Bauer, Førland, Haddeland, Hisdal, Mayer, Nesje, Nilsen, Sandven, Sandø, Sorteberg and Ådlandsvik2017), rising temperature will drive a non-monotonic response in glacier meltwater production. Glacier meltwater production is expected to increase as long as glacier volumes remain substantial, but as glaciers retreat to higher elevations and become smaller, meltwater runoff will decline (Huss & Hock, Reference Huss and Hock2018). This turning point is projected to occur by mid-to-late 21st century for Norwegian glaciers under the representative concentration pathway scenarios (Cisneros et al., Reference Cisneros, Taikan, Nigel, Gerardo, Graham, Petra, Tong, Shadrack, Zbigniew, Field, Barros, Dokken, Mach, Mastrandrea, Bilir, Chatterjee, Ebi, Estrada, Genova, Girma, Kissel, Levy, MacCracken, Mastrandrea and White2014; Thorsteinsson & Björnsson, Reference Jóhannesson, Aðalgeirsdóttir, Ahlstrøm, Andreassen, Beldring, Björnsson, Crochet, Einarsson, Elvehøy, Guðmundsson, Hock, Machguth, Melvold, Pálsson, Radić, Sigurðsson and Thorsteinsson2011).
In this study, we investigated this dynamic by using a series of model simulations to examine the role of glacier meltwater in hydropower production in the highly glacierized Jostedøla River Basin at the beginning of the 21st century. As a result of rigorous configuration and parameter tuning, the simulated outputs showed good agreement with observations, though they tended to overestimate low discharges and underestimate high discharges. Since we used runoff outputs from our previous study using SnowModel alone (Gong et al., Reference Gong, Tomar, Rogozhina and Basso2025), uncertainties and errors from earlier parameter tuning had been carried forward into this stage of the model chain. While several aspects of the model were improved – such as the inclusion of ET, soil water storage, and runoff routing – certain limitations persist, notably the use of a fixed glacier geometry and the absence of water storage in the form of permafrost and lakes. These uncertainties and limitations were discussed in detail in a separate paper by Gong et al. (Reference Gong, Tomar, Rogozhina and Basso2025).
Additionally, a source of uncertainty specific to this study arises from the adoption of slow flow speeds (Section 2.4) measured in Greenland by Liston and Mernild (Reference Liston and Mernild2012), which might not accurately reflect local conditions. This issue could be addressed through field measurements in future research. Nevertheless, its impact on our analysis was mitigated by employing ratios rather than absolute values, as ratios emphasize relative relationships and are less sensitive to systematic biases in the data.
Despite these uncertainties and limitations, our benchmark still provides a reference for future impact studies in our study region. The results indicate that glaciers supplied water to all four hydropower plants in the Jostedøla basin. The larger power plants, Jostedal (P2) and Leirdøla (P3), rely primarily on glacier-fed terminal lakes as their main reservoirs. Glacier meltwater contributes substantially to their production (Table 3), particularly during the summer months (June–August), when peak melt coincides with maximum runoff. For the smaller run-of-river plants, snow and ice meltwater from glacierized areas contributed over one-quarter of the total runoff at Vanndøla (P1) and roughly a quarter at Røneid (P4) between 2000 and 2014. However, because these facilities are located in less glacierized sub-catchments, they are less strongly influenced by glacier meltwater. The direct contribution of glacier meltwater is comparatively low (<11%), and both glacier meltwater and total runoff reach their highest levels during different seasons: while total runoff peaks in late spring to early summer, glacier meltwater peaks in the summer months (Fig. 5).
Further, glacier meltwater is a valuable water source for hydropower production, particularly during Warm and Dry periods when precipitation deficits occur (Fountain & Tangborn, Reference Fountain and Tangborn1985). In this study, the highest number of Warm and Dry days (17 days) was identified in June and August 2002 (Table 4), a period when unusually high temperatures led to significantly reduced water flow in rivers without glaciers in their catchment areas in Norway (Pelto, Reference Pelto, Singh, Singh and Haritashya2011), along with other Warm and Dry days in 2004 and 2006–2009. Overall, during the Warm and Dry days in June, the lack of precipitation was compensated for and overcompensated by other sources, such as snowmelt water from non-glacier-covered areas, with more than half of the water intakes receiving it, especially at Jostedal and Leirdøla. In Warm and Dry days in August, when most of the runoff was supplied by ice meltwater from glacierized areas since seasonal snow had largely disappeared, the lack of precipitation could not be sufficiently compensated to reach the mean runoff level in the early 21st century for all power plants.
A previous study (Van Tiel et al., Reference Van Tiel, Van Loon, Seibert and Stahl2021) examining different glacierized catchments in southwestern Norway reported similar results for basins with glacier coverage comparable to that of the Jostdøla river basin (∼38%). It emphasized that although higher temperatures play an important role in discharge compensation during the dry July–September period, when the most meltwater was released from glacierized areas, glaciers did not compensate linearly. For instance, summer snow cover in areas without glacier coverage, groundwater storage, and antecedent conditions such as the amount of snowfall in the previous winter and discharge conditions 30 days before the Warm and Dry event also controlled the level of compensation and its variability.
In addition to meteorological factors, a power plant’s storage capacity also determines the adaptivity of hydropower production to future fluctuations in inflows from different water sources. Power plants with large reservoirs that can retain a significant fraction of inflow water can produce hydropower when it is most needed (namely, winter in Norway), with little risk of losing excessive water except for possible overflows during high discharge periods (Haddeland et al., Reference Haddeland, Hole, Holmqvist, Koestler, Sidelnikova, Veie and Wold2022). Therefore, the impacts of climate change on their power production relate more to the total annual water inflow than to when and where water comes from. However, for power plants that only have a pondage, reduced inflow from glaciers and/or snow in summer will reduce their overall production capacity, as summer is their peak production season. These plants are thus vulnerable to the distribution of river flow during the year (Lazzaro et al., Reference Lazzaro, Basso, Schirmer and Botter2013) and the occurrence of, e.g., droughts and floods (Kaunda et al., Reference Kaunda, Kimambo and Nielsen2012).
The comparison between our interview data and the modeled results reveals that experts’ perceptions diverge from the model’s representation of hydrological processes, particularly at smaller run-of-river power plants. The discrepancies are likely due to different monitoring regimes for the two companies operating in the region. Statkraft, which operates the two power plants with large reservoirs (Jostedal and Leirdøla), applies a stricter monitoring regime that includes measuring snow depth and using weather stations in the catchment area to optimize production during periods when prices are highest. Småkraft AS, which operates two production sites with two small pondages (i.e., short-term storage), has a very limited opportunity to adjust production to increase revenue and hence limited incentives to predict seasonal variability in its streamflow. In addition, our analyses on the 2023 company sustainability report of Småkraft AS suggested that this might result from a systematic failure to consider the specific local hydrological conditions in highly glacierized landscapes in southwestern Norway, such as the Jostedøla River Basin. This oversight was particularly concerning during future Warm and Dry events, such as the 2022 heat wave, which led to lower reservoir water levels, reduced hydropower production, and higher electricity prices in southern Norway (e.g., Bridget, Reference Bridget2022).
The potential societal impacts of a loss of productivity in hydropower following a reduction of meltwater from glaciers and snow should not be underestimated, as our modeled results show they contribute, on average, 40% of the GTHP in small plants (Vanndøla and Røneid) and 51% in large ones (Jostedal and Leirdøla). The societal consequences of reduced hydropower production include revenue losses for companies operating run-of-the-river hydropower plants, increased vulnerability of hydropower production during warm, dry events, greater year-round fluctuations in electricity production, reduced energy security, and reduced government revenue. Although construction or expansion of existing reservoirs might mitigate many of the potential negative impacts of future changes in streamflow contributions from snow and ice on hydropower production (Sveinsson et al., Reference Sveinsson, Linnet and Björnsson2018), there are economic and environmental impacts associated with such constructions (Botelho et al., Reference Botelho, Ferreira, Lima, Pinto and Sousa2017; Kirchherr & Charles, Reference Kirchherr and Charles2016).
Beyond these technical and environmental considerations, reduced hydropower production also has important social and distributional consequences. The impacts of higher energy prices on vulnerable groups have been extensively documented in the energy poverty literature (González-Eguino, Reference González-Eguino2015; Nussbaumer et al., Reference Nussbaumer, Bazilian and Modi2012; Sovacool, Reference Sovacool2012). In our case study, however, the municipality’s integration into a larger electricity market shields local consumers from sharp price fluctuations, though it limits the municipality’s ability to supply subsidized electricity at cost to its residents. More critically, the regional structure of ownership and taxation means that a loss in hydropower production will negatively affect the local municipality’s revenues. As these incomes constitute a notable share of the municipal budget, a decline in electricity production and related income from the Natural Resource Tax and license fees could affect the municipality’s ability to maintain current services, such as healthcare, education, and local development projects. Such changes in public services, along with rising costs for residents, may disproportionately affect households with limited financial resources (Haile & Niño-Zarazúa, Reference Haile and Niño-Zarazúa2018), highlighting the distributional consequences of glacier loss for hydropower-dependent municipalities in Norway.
Although local consumers are insulated mainly from major price shocks, glacier retreat still threatens welfare by undermining municipal revenues and, in turn, the provision of social services, including pro-poor policies. This highlights a set of dynamics often overlooked in consumer- and price-focused energy-poverty studies, extending the discussion of how climate change, energy production, and social equity intersect. While our analysis focuses solely on Luster municipality, energy-producing municipalities in Norway that rely on glacier meltwater are generally rural areas marked by population decline and aging demographics, limited employment opportunities, shrinking government revenues, and persistent challenges in providing adequate social services (Harvold & Nordahl, Reference Harvold and Nordahl2012; Lysgård & Berg, Reference Lysgård, Berg, Halfacree, Kocách and Woodward2002; Vennerød & Schjøtt-Pedersen, Reference Vennerød and Schjøtt-Pedersen2023). In such municipalities, hydropower revenues often account for a significant share of the local government budget (Geys & Sørensen, Reference Geys and Sørensen2016), suggesting that the challenges identified in this paper may be relevant beyond the case study examined.
While assessing the full social impacts of a reduction in hydropower production from glacier meltwater is well beyond the scope of this paper, our analysis clearly shows that this will result in adverse societal effects. The limited understanding mentioned above can hinder production companies and local governments from fully grasping the potential impacts of future climate change on hydropower production, thereby impairing their adaptive capacities (e.g., Sahu et al., Reference Sahu, Sayama, Saini, Panda and Takara2020). A better comprehension of how snow and ice contribute to hydropower production is crucial for developing comprehensive climate risk mitigation plans and predicting the potential impacts of climate change on energy security in Norway.
Further research is needed to deepen our understanding of glaciers’ role in hydropower production, how climate change may alter this contribution, and the broader societal implications of these changes. It includes integrating measurements of hydropower production, which is not publicly available, from basins reliant on glaciers and snowmelt into modeling and examining how this production is woven into local economic and social processes. It also involves exploring in greater detail how these changes affect vulnerable communities and households across different locations in Norway and beyond, and strengthening the science-policy interface to support evidence-based climate adaptation strategies. Working in dialogue with hydropower production companies is crucial throughout this process. Ultimately, a better understanding of glaciers’ role in hydropower production will strengthen climate adaptation strategies for both companies and the government, contributing to improved energy security in the region.
5. Conclusions
We used a series of energy-balance snow/ice-melt, soil–water-balance, and linear-reservoir runoff-routing models to simulate gridded surface runoff rates from snow and ice melt, rainfall, sublimation, and ET, and to route volumetric discharge to rivers and streams. Our cascading model chain could provide relatively accurate 100 × 100 m-resolution gridded daily runoff outputs for the Jostedøla River Basin, where about 38% of the land surface was covered by glaciers and permanent ice at the beginning of the 21st century. These outputs were then used to examine the role of glacier meltwater (both snow and ice meltwater in glacier-covered areas) in the hydropower production of four hydropower plants in the catchment, in terms of its contribution to total runoff and its compensation level on Warm and Dry days. Additionally, we conducted semi-structured interviews and developed an online survey to gain an understanding of stakeholders’ perceptions regarding the role of glacier meltwater in hydropower production.
Two of the four power plants, Jostedal and Leirdøla, have long-term reservoirs. Moreover, the other two, Vanndøla and Røneid power plants, are small run-of-river power plants with only short-term storage pondages. At the largest power plant, Jostedal, glacier meltwater contributed as much as 38.5% of the water available at the water intakes. For the other three power plants, the most significant contribution came from non-meltwater sources, such as rainfall and baseflow. Warm and Dry days occurred during the months when discharges from the water intakes of different power plants were at their highest. During the Warm and Dry days that occurred during our simulation period in June, the lack of precipitation could be compensated for or overcompensated by other sources, such as snowmelt from areas not covered by glaciers, as glacier meltwater contributions are low. In August, although most of the water comes from glacier meltwater, the lack of precipitation cannot be made up for.
Due to differences in water storage capacity, these power plants can be affected by future annual and seasonal fluctuations in water inflow to water intakes differently, depending on weather extremes and glacier recession. The two power plants with only small pondages are more vulnerable to these fluctuations compared to the other two, as their production is more dependent on the water available in rivers and streams.
Our analysis reveals discrepancies between the modeled results and the perceptions of key hydropower company representatives regarding the contributions of different sources to the water supply. Thus, the challenges posed by the physical variation in sources and timing of inflows are exacerbated by a potential systematic misperception of the role of ice and snow in hydropower production in Norway, which could hamper the efforts of both hydropower companies and local governments to adapt sufficiently to future climatic changes and energy insecurity.
Reductions in hydropower production also carry broader societal implications, including revenue losses for small operators, heightened vulnerability during dry periods, greater price volatility, reduced energy security, and lower social welfare. While a detailed analysis of these impacts is beyond the scope of this study, a limited understanding of these impacts constrains effective adaptation. Strengthening knowledge of the role of snow and ice in hydropower is crucial for assessing climate risks and ensuring a secure long-term energy supply. Future research should integrate glacier- and snow-dependent hydropower data into model studies, assess the effects on vulnerable communities, and promote closer collaboration among scientists, policymakers, and industry stakeholders (Islar et al., Reference Islar, Johansson, Sinisalo and Gómez-Baggethun2025).
Supplementary material
The supplementary material for this article can be found at https://doi.org/10.1017/sus.2026.10059.
Acknowledgements
We thank the High-Performance Computing Group at NTNU for providing the IDUN supercluster for our computer simulations.
Author contributions
Gong conducted model simulations, drafted the quantitative section of the paper, and provided feedback on the interview guides. Bly prepared the interview guides and conducted interviews with the help of Gong and Hyldmo. Bly and Hyldmo drafted the qualitative section of the paper. Egli finalized Section 3.2 based on Gong’s drafts. Both Egli and Basson reviewed the manuscripts and provided crucial feedback that shaped the final version of the paper.
Funding statement
This work was supported by the Norwegian Research Council project ‘A pilot study of drivers and societal impacts of freshwater discharge from glacial systems in Norway and the Chinese Karakoram (GOTHECA-NOCK)’ (grant number 326014).
Competing interests
The authors certify that they have NO affiliations with or involvement in any organization or entity with any financial interest (such as honoraria; educational grants; participation in speakers’ bureaus; membership, employment, consultancies, stock ownership, or other equity interest; and expert testimony or patent-licensing arrangements) or non-financial interest (such as personal or professional relationships, affiliations, knowledge, or beliefs) in the subject matter or materials discussed in this manuscript.
Declaration of generative AI and AI-assisted technologies in the writing process
During the preparation of this work, the authors used Microsoft Copilot (https://copilot.microsoft.com/) to improve the English language. After using this tool/service, the author(s) reviewed and edited the content as needed and took full responsibility for the publication's content.
Availability of data and material
Model results, codes, and any other data are available upon request.
Code availability
Codes and search queries are available upon request.





 Open access

