

Introduction
Glutamate is the major excitatory neurotransmitter in the human brain and recent years have seen growing interest in the role of altered glutamate activity in the pathophysiology of depression and bipolar disorder (Sanacora et al. Reference Sanacora, Treccani and Popoli2012; Taylor, Reference Taylor2014). This interest has been greatly stimulated by the striking antidepressant effects of the N-methyl-D-aspartate (NMDA) receptor antagonist, ketamine, in depressed patients resistant to monoamine-potentiating agents (McGirr et al. Reference McGirr, Berlim, Bond, Fleck, Yatham and Lam2015).
It is possible to measure levels of glutamate in the living brain in an acceptable, non-invasive way, using proton magnetic resonance spectroscopy (1H-MRS). Several MRS studies in depressed patients have been carried out, the majority of which assessed glutamate levels in anterior brain regions such as prefrontal cortex (PFC) and anterior cingulate cortex (ACC), in comparison with those of healthy controls (Yüksel & Öngür, Reference Yüksel and Öngür2010). Generally, meta-analyses have reported diminished levels of glutamate in these regions in depression, though data from individual studies are inconsistent and a recent investigation, for example, found increased glutamate and glutamine levels in ACC in depressed patients (Luykx et al. Reference Luykx, Laban, Van Den Heuvel, Boks, Mandl, Kahn and Bakker2012; Arnone et al. Reference Arnone, Mumuni, Jauhar, Condon and Cavanagh2015; Abdallah et al. Reference Abdallah, Hannestad, Mason, Holmes, DellaGioia, Sanacora, Jiang, Matuskey, Satodiya, Gasparini and Lin2017).
One factor relevant to this inconsistency is that, at conventional field strengths [3 T (T) or less], it is difficult to separate glutamate clearly from its precursor and metabolite, glutamine, and the two compounds are usually measured together as Glx (Yüksel & Öngür, Reference Yüksel and Öngür2010; Bond & Lim, Reference Bond and Lim2014). A second complicating issue is that patients have often been studied on antidepressant medication, which could alter glutamate activity (Taylor et al. Reference Taylor, Murphy, Selvaraj, Wylezinkska, Jezzard, Cowen and Evans2008). Finally, there is the probability of clinical heterogeneity, as demonstrated by a study by Haroon et al. (Reference Haroon, Fleischer, Felger, Chen, Woolwine, Patel, Hu and Miller2016) who found that glutamate levels in basal ganglia (but not ACC) were significantly higher in depressed patients with raised levels of C-reactive protein (CRP), a peripheral marker of inflammation. However, no control group was studied for comparison in this investigation.
MRS at 7 T has the spectral resolution to allow the clear identification of separate glutamate and glutamine resonances (Tkáč et al. Reference Tkáč, Öz, Adriany, Uğurbil and Gruetter2009; Emir et al. Reference Emir, Auerbach, Van De Moortele, Marjanska, Ugurbil, Terpstra, Tkáč and Öz2015). The aim of the present study was to use MRS at 7 T to assess levels of glutamate and glutamine in 55 un-medicated depressed patients, and age and gender-matched controls, in three brain regions, ACC, occipital cortex (OCC) and putamen (PUT). We predicted that overall depressed patients would have lower glutamate levels than controls in ACC, but that the subgroup of patients with evidence of peripheral inflammation, as measured by CRP, would have increased glutamate and glutamine levels in PUT.
Method
Participants and clinical ratings
Ethical approval for the study was obtained from the National Research Ethics Service Committee (NRES), South-Central Oxford B. Fifty-five drug-free patients with an episode of major depression (31 females, 24 males, mean age 31.3 years, range 18–59 years) and 50 healthy volunteers (28 females, 22 males, mean age 31.3 years, range 19–62 years) were included in the study after giving full informed written consent. Exclusion criteria for patients included psychosis or substance dependence as defined by DSM-IV (determined using the Standard Clinical Interview for Diagnostic and Statistical Manual for Mental Health Disorders – Fourth Edition) (First et al. Reference First, Spitzer, Gibbon and Williams1997), clinically significant risk of suicidal behaviour and need for urgent drug treatment; for healthy volunteers, current or past history of Axis I disorder on DSM-IV; for both groups contra-indications to magnetic resonance (MR) imaging, concurrent medication which could alter MRS neurochemicals (e.g. benzodiazepines), pregnancy or breast feeding, and involvement in a research project during the month preceding the study.
Thirty-nine patients were drug-naive and the remaining 16 patients had been drug-free for an average of 40 months (2 weeks–15 years). Of the latter group, two patients stopped medication within four weeks from the scan: one person was taking lofepramine, gabapentin and lamotrigine until two weeks before the scan, and the other was taking venlafaxine up to four weeks before the scan. Six patients had a comorbid diagnosis of generalized anxiety disorder and four suffered from occasional panic attacks, insufficient to meet criteria for panic disorder. Mood ratings were measured using the Hamilton Rating Scale for Depression (HAM-D) (Hamilton, Reference Hamilton1960) and the Beck Depression Inventory (BDI) (Beck et al. Reference Beck, Ward, Mendelson, Mock and Erbaugh1961), while anxiety ratings were scored using the Spielberger State Anxiety Inventory (STAI) (Spielberger et al. Reference Spielberger, Gorssuch, Lushene, Vagg and Jacobs1993). We also measured anhedonia with the Snaith–Hamilton Pleasure Scale (SHAPS) (Snaith et al. Reference Snaith, Hamilton, Morley, Humayan, Hargreaves and Trigwell1995) and fatigue with the Chalder Fatigue Scale (CFS) (Chalder et al. Reference Chalder, Berelowitz, Pawlikowska, Watts, Wessely, Wright and Wallace1993).
Magnetic resonance spectroscopy
All participants had a single proton (1H) MRS scan at the Functional Magnetic Resonance Imaging of the Brain (FMRIB) Centre in Oxford. Scanning was performed on a 7 T Siemens MAGNETOM scanner (Siemens, Erlangen, Germany) with a Nova Medical 32 channel receive array head coil. Spectra were measured from three voxels, in the ACC (20 × 20 × 20 mm3), in the OCC (20 × 20 × 20 mm3) and in the right PUT (10 × 16 × 20 mm3) (Fig. 1). Voxels were positioned manually by reference to the 1 mm isotropic T1-MPRAGE image. First- and second-order shims were first adjusted by gradient-echo shimming (Shah et al. Reference Shah, Kellman, Greiser, Weale, Zuehlsdorff and Jerecic2009). The second step involved only fine adjustment of first-order shims using FASTMAP (Gruetter & Tkáč, Reference Gruetter and Tkáč2009). Spectra were acquired using a semi-LASER pulse sequence (TE = 32 ms, TR = 5 s, number of averages = 64) with variable power radiofrequency (RF) pulses with optimised relaxation delays (VAPOR) water suppression and outer volume saturation (Öz & Tkáč, Reference Öz and Tkáč2011). Unsuppressed water spectra, acquired from the same voxel, were used to remove residual eddy current effects and to reconstruct the phased array spectra.
Voxel placement and representative spectra from the ACC, OCC and PUT. Glu, glutamate; Gln, glutamine; GSH, glutathione; Cr, creatine; PCr, phosphocreatine; myoIns, myo-inositol; PC, phosphocholine; GPC, glycerophosphocholine; NAA, N-acetylaspartate; Asc, ascorbate.

Metabolites were quantified using LCModel (Provencher, Reference Provencher2001). The model spectra of alanine (Ala), aspartate (Asp), ascorbate/vitamin C (Asc), glycerophosphocholine (GPC), phosphocholine (PC), creatine (Cr), phosphocreatine (PCr), γ-aminobutyric acid (GABA), glucose (Glc), glutamine (Gln), glutamate (Glu), glutathione (GSH), myo-inositol (myo-Ins), lactate (Lac), N-acetylaspartate (NAA), N-acetylaspartylglutamate (NAAG), phosphoethanolamine (PE), scyllo-inositol (scyllo-Ins), and taurine (Tau) were generated based on previously reported chemical shifts and coupling constants (Govindaraju et al. Reference Govindaraju, Young and Maudsley2000; Tkáč, Reference Tkáč2008) by using the GAMMA/PyGAMMA simulation library of VeSPA (VErsatile Simulation, Pulses and Analysis) for carrying out the density matrix formalism. Simulations were performed with the same RF pulses and sequence timings as that on the 7 T system. A macromolecule spectrum acquired from the OCC, using an inversion recovery sequence (TR = 3 s, TE = 36 ms, inversion time TI = 0.685 s), was included in the model spectra. Metabolite concentrations were obtained relative to an unsuppressed water spectrum acquired from the same Voxel of Interest (VOI).
The MPRAGE images were segmented using SPM to determine grey matter (GM), white matter (WM), and cerebrospinal fluid (CSF) fraction (fGM, fWM, fCSF) in the voxels (Ashburner & Friston, Reference Ashburner and Friston2005). Concentrations were then corrected for these with the following formula:
 $$\eqalign{\left[ {{\rm Mcorr}} \right]{\rm =} & \left[ {\rm M} \right] \times ({\rm 43}\;{\rm 300} \times {\rm fGM + 35}\;{\rm 880} \times {\rm fWM} \cr {\rm} & {\rm + 55}\;{\rm 556} \times {\rm fCFS/}\left[ {{\rm 1}{\rm -} {\rm fCSF}} \right]{\rm /55}\;{\rm 556}),} $$
where [Mcorr] is the corrected concentration and [M] is the metabolite concentration from the LCModel output. Metabolites quantified with the Cramér–Rao lower bounds (CRLB, estimated error of the metabolite quantification) ⩾30% were classified as not detected.
C-Reactive Protein
Venous blood samples were taken at the time of scanning and were assayed for high sensitivity (hs)CRP, using a standard immunoturbidimetric method on an Abbott c 16 000 automatic chemistry analyser (Abbott Diagnostics, Maidenhead, UK). Samples were assayed blind to diagnosis and MRS results.
Statistics
Statistical analyses were performed in SPSS version 22. Differences in glutamate and glutamine concentrations between patients with depression and controls in the three voxels were tested using unpaired t tests with Bonferroni correction for multiple comparisons to yield a critical statistical p < 0.008. Subsequent univariate analysis of variances (ANOVAs) were used to allow for the effects of smoking, correlations were carried out using Pearson's product moment without correction for multiple analyses.
Results
The patient and healthy control groups did not differ significantly in terms of age and gender ratio, but the body mass index (BMI) in the patients tended to be higher than controls (t = 1.92; p = 0.059). More patients than controls smoked cigarettes (18 v. 3; p = 0.001, χ2 test) (Table 1).
Demographic data and clinical scores

Values represent numbers or mean (s.e.m.).
HAM-D, Hamilton Rating Scale for depression; BDI, Beck Depression Inventory; STAI, Spielberger State Anxiety Inventory; SHAPS, Snaith–Hamilton Pleasure Scale; CFS, Chalder Fatigue Scale.
The following scans were rejected for reasons of quality (see Methods): in the ACC, four patients and five controls; in the OCC, seven patients and two controls; in the PUT, five patients and three controls. All remaining spectra were of acceptable quality. For results describing the signal-to-noise ratio (SNR) and full-width at half-maximum (FWHM), see Supplementary information.
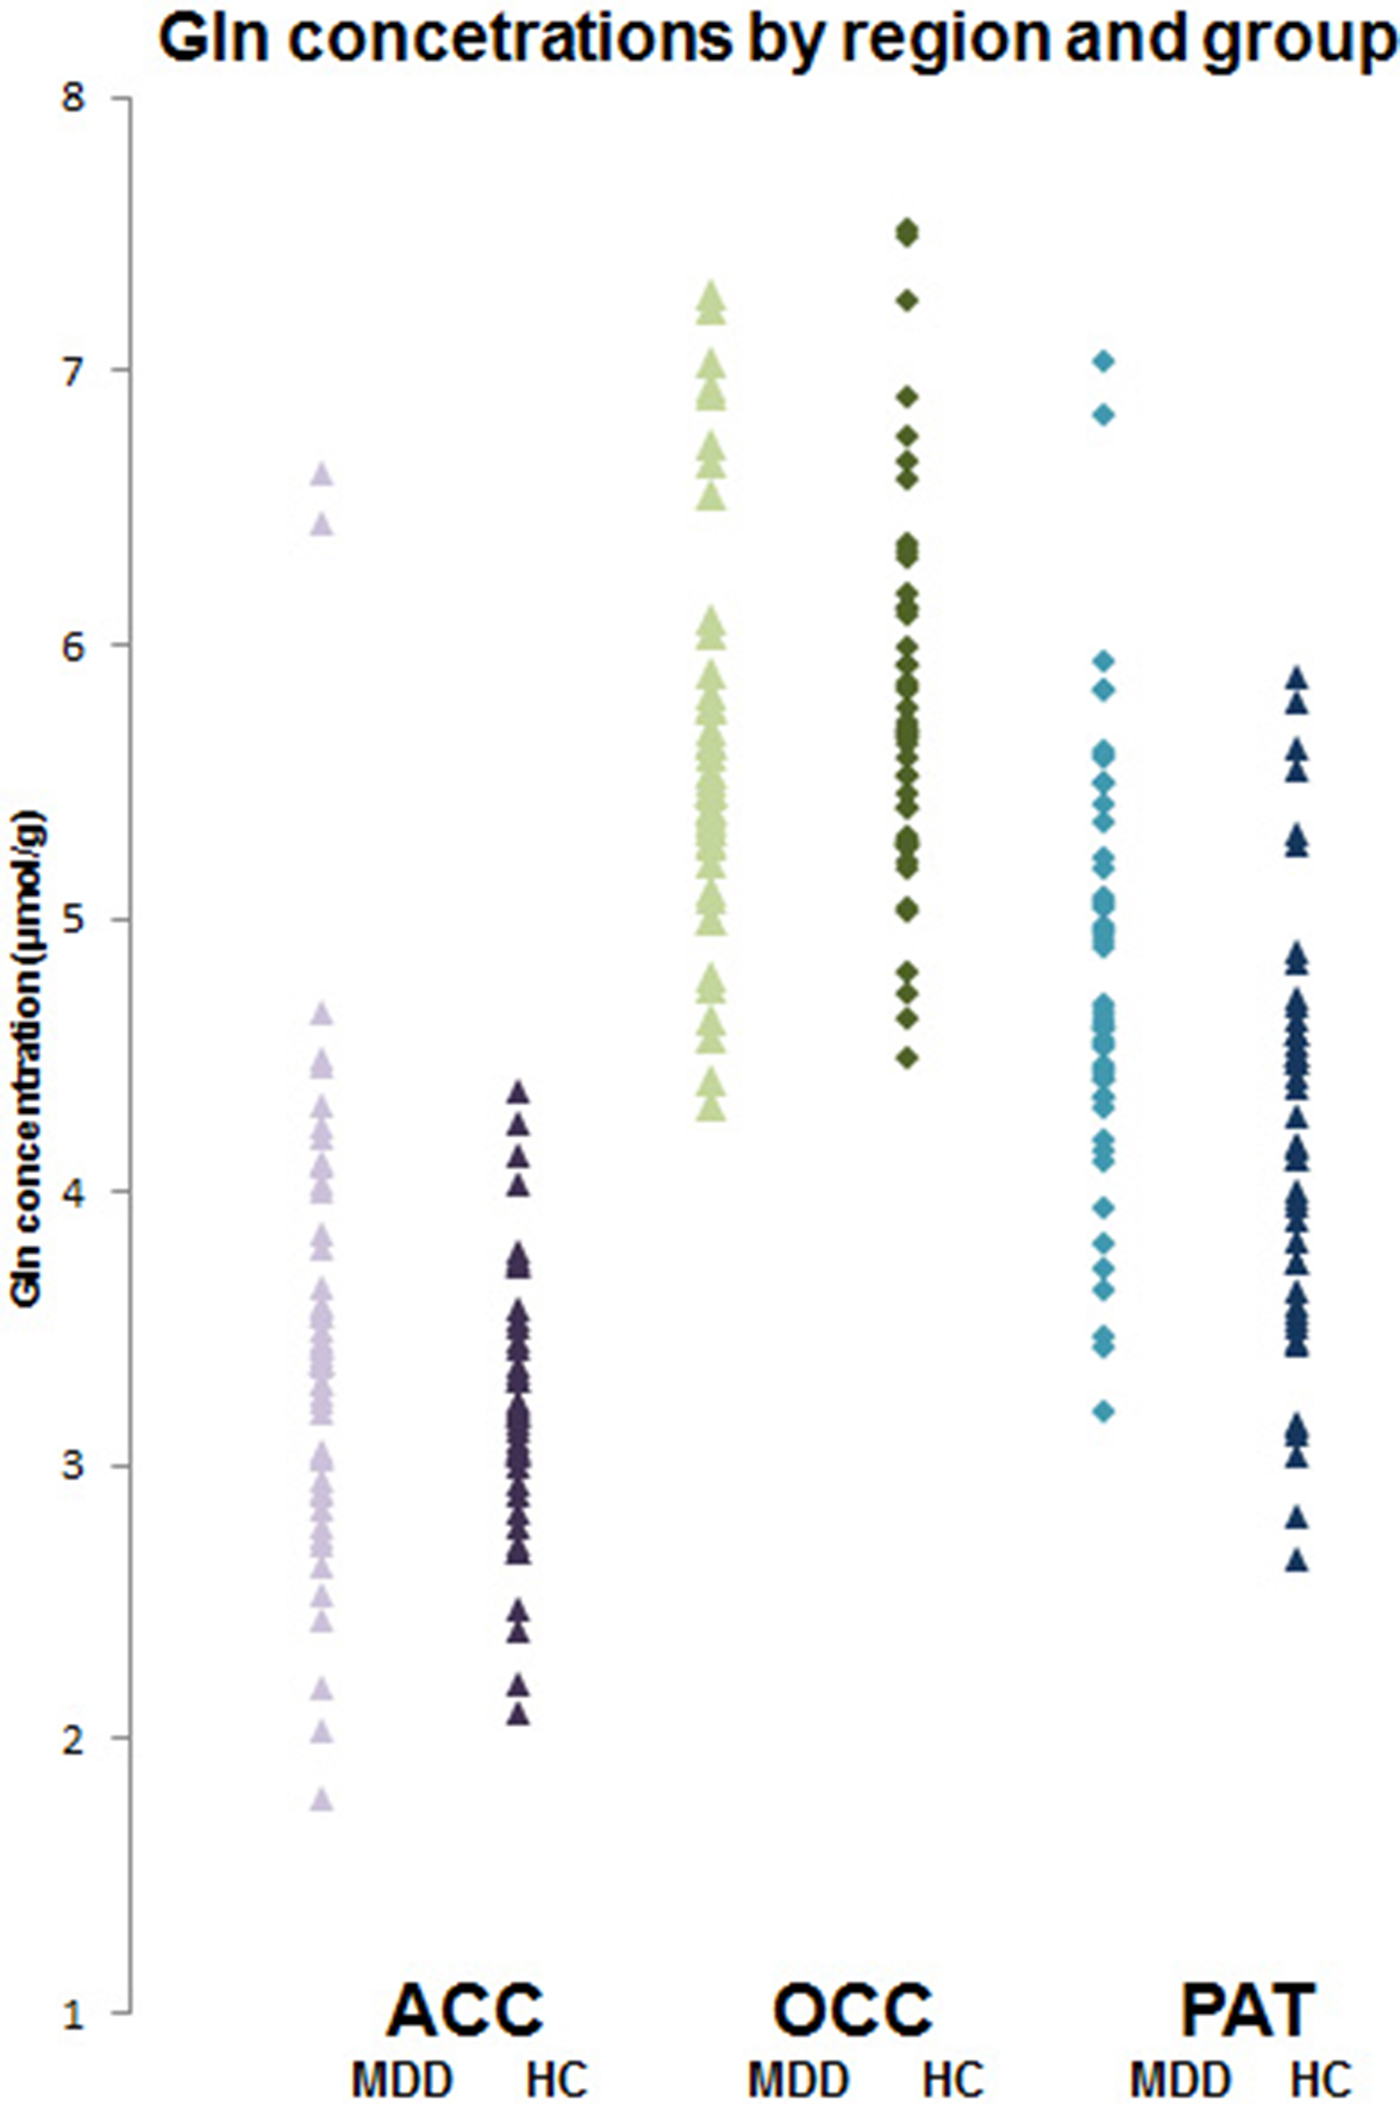
In ACC and OCC, there were no significant differences in concentrations of glutamate and glutamine between depressed patients and controls (Table 2). In PUT, depressed patients had significantly higher concentrations of glutamine than controls, although glutamate levels were not different (Table 2, Fig. 2). Excluding PUT scans with CRLB ⩾ 20%, gave a very similar finding (depressed patients v. controls, 4.91 ± 0.11 v. 4.38 ± 0.11 µmol/g, t = 3.45, p = 0.001).
Individual glutamine concentrations (μmol/g) in depressed patients (MDD) and healthy controls (HC) in ACC, OCC and PUT. Mean glutamine level in patients in PUT is significantly higher (t = 3.30; p < 0.001, t test).
Mean (s.e.m.) absolute concentrations (μmol/g) glutamate and glutamine, corrected for GM, WM and CSF content in ACC, OCC and PUT
Significantly more patients than controls smoked cigarettes (Table 1) and there are reports that smoking can affect MRS glutamate measures (Durazzo et al. Reference Durazzo, Meyerhoff, Anderson, Abé, Gadzdzinski and Murray2016). We, therefore, ran additional univariate ANOVAs on glutamate and glutamine levels in the three voxels adding ‘smoking’ as a between-subject factor to ‘diagnosis’ (depressed v. control). In the ACC, smoking produced a significant main effect on glutamate levels (F = 4.21; df = 1,92; p = 0.043) and there was also a main effect of diagnosis (F = 4.55; df = 1,92; p = 0.036). Mean ± s.e.m. glutamate levels were lower in the patients than controls (9.11 ± 0.11 v. 9.81 ± 0.29 µmol/g) and higher in smokers than non-smokers (9.79 ± 0.31 v. 9.13 ± 0.11 µmol/g). Similarly, in the OCC, glutamate levels were higher in smokers (F = 5.67; df = 1, 96; p = 0.019) (6.14 ± 0.22 v. 5.60 ± 0.22 µmol/g) but there was no main effect of diagnosis (F = 1.93; df = 1, 92; p = 0.17). There were no other main or interactive effects of smoking on glutamate or glutamine levels (all p > 0.05).
Eighteen depressed patients met criteria for DSM-IV depression with melancholia and had valid scan data. The MRS data of the melancholic patients were very similar to those of the non-melancholic patients and the only difference again from controls was an increased level of glutamine in the PUT (melancholic patients, 4.94 ± 0.23 µmol/g, t = 3.23, p = 0.002; non-melancholic patients 4.71 ± 0.12 µmol/g, t = 3.05, p = 0.003).
CRP levels were available for 49 patients and 44 controls. Mean CRP concentration was slightly but significantly higher in the depressed patients (0.88 ± 0.18 v. 0.45 ± 0.07 mg/l, t = 2.19, df = 61, p = 0.032). However, when covarying for BMI, this difference became non-significant (F = 1.92; p = 0.17). Eleven of the patients had CRP values >1.0 mg/l but there was no significant difference in glutamine levels in the PUT between these participants and patients with CRP levels <1.0 mg/l (4.44 ± 0.21 v. 4.86 ± 0.16 µmol/g, t = 1.411, p = 0.16). The correlation between CRP levels and PUT glutamine levels in the depressed patients was on the borderline of statistical significance but trended to a negative value (r = −0.31, p = 0.050). There were no other trends for CRP levels to correlate with neurometabolites in any of the brain regions studied (all p > 0.2). Similarly, allowing for BMI failed to reveal any significant correlations between CRP and neurometabolites (all p > 0.1).
In the patients, there were no significant correlations between scores on the HAM-D, BDI, STAI, SHAPS and CFS scales and any of the measured neurometabolites, with the exception of one uncorrected positive correlation between the total BDI score and glutamine level in ACC (r = 0.32, p = 0.025). There was generally no correlation between illness duration and MRS metabolites except for a single uncorrected positive correlation with glutamate levels in ACC (r = 0.36, p = 0.011).
Discussion
The main finding of the study was a significant increase in glutamine levels in the PUT of patients with major depression relative to healthy controls. Although we had hypothesised reductions in MRS glutamate concentrations in ACC depressed patients relative to controls, no changes in glutamate levels were apparent in any of the three voxels examined. There was no significant correlation between CRP levels and concentrations of glutamate and glutamine in any of the voxels.
Previous meta-analytic summaries of MRS glutamate investigations in patients with unipolar depression using scanner strengths of 1.5–3 T have suggested a decrease in Glx levels in anterior brain regions in depression, particularly in ACC. However, while Luykx et al. (Reference Luykx, Laban, Van Den Heuvel, Boks, Mandl, Kahn and Bakker2012) (16 studies, 281 patients) found an overall lowering of both glutamate and Glx in ACC in depressed patients, Arnone et al. (Reference Arnone, Mumuni, Jauhar, Condon and Cavanagh2015) (17 studies, 363 patients) reported lower Glx but normal glutamate in prefrontal cortical regions (including the ACC). The latter group concluded that diminished Glx in depression was likely to be due to a reduction in glutamine levels, perhaps due to glial dysfunction. However, generally, sample sizes of depressed patients in the individual studies in the meta-analyses were modest (average n of around 20) and there was significant heterogeneity in the findings.
The use of MRS at 7 T allows a clear spectral resolution of both glutamate and glutamine (Tkáč et al. Reference Tkáč, Öz, Adriany, Uğurbil and Gruetter2009; Emir et al. Reference Emir, Auerbach, Van De Moortele, Marjanska, Ugurbil, Terpstra, Tkáč and Öz2015). Of other published 7 T MRS studies in depression, Taylor et al. (Reference Taylor, Osuch, Schaefer, Rajakumar, Neufeld, Théberge and Williamson2017) found no differences in glutamate and glutamine between 17 depressed patients and 18 healthy controls, in either ACC or thalamus, while Li et al. (Reference Li, Jakary, Gillung, Eisendrath, Nelson, Mukherjee and Luks2016) using multivoxel spectroscopic imaging (MRSI) found no significant differences in glutamate levels between 16 depressed patients and 10 healthy controls in ACC, insula, PUT, caudate and thalamus. Thus studies at 7 T, so far, have not revealed clear decreases in glutamate in ACC or other brain regions.
When allowing for the effect of smoking on glutamate levels, we did observe a lowering of glutamate levels in ACC in the depressed patients compared to controls. While this is of interest in the context of the reports noted above, the significance level of this finding was above our Bonferroni-corrected p value of 0.008. In addition, while we found that smoking was associated with elevated glutamate levels in ACC and OCC, previous reports of the effect of cigarette smoking on MRS glutamate in ACC have been somewhat inconsistent with increased, decreased and no change in levels being reported (Gallinat & Schubert, Reference Gallinat and Schubert2007; Mennecke et al. Reference Mennecke, Gossler, Hammen, Dörfler, Stadlbauer, Rösch, Kornhuber, Bleich, Dölken and Thürauf2014; Durazzo et al. Reference Durazzo, Meyerhoff, Anderson, Abé, Gadzdzinski and Murray2016).
The basal ganglia have been relatively little studied in MRS studies of depression despite the importance of this brain region in motor behaviour, as well as motivation, reward and emotional regulation (Gunaydin & Kreitzer, Reference Gunaydin and Kreitzer2016). This is in part because MRS scanning of deep brain structures is challenging, especially at conventional field strengths. However, the increased SNR resulting from scanning at 7 T makes brain regions such as the PUT more feasible for MRS investigation, though the SNR of the PUT in our study was still substantially less than that of the ACC or OCC (see Supplementary data). Our finding of increased glutamine levels in the PUT was not predicted but statistically was highly significant, surviving correction for multiple comparisons. Interestingly, Haroon et al. (Reference Haroon, Fleischer, Felger, Chen, Woolwine, Patel, Hu and Miller2016) found that depressed patients with evidence of peripheral inflammation, as judged by raised levels of CRP, had increased levels of glutamate in basal ganglia that correlated with measures of anhedonia.
The latter work suggests that one reason for the heterogeneity in MRS studies of glutamate in depression might be that a subgroup of patients, with evidence of inflammation, has specific disturbances in glutamate metabolism that lead to increased glutamate levels rather than the diminished glutamate concentration seen in the majority of depressed patients. It is also possible that these different profiles of glutamate abnormality in depressed patients relate more to illness course than patient subgroup, with high concentrations of glutamate in the early illness phase being followed by lower levels subsequently as a result of neurotoxic effects on glutamate neurotransmission (Portella et al. Reference Portella, de Diego-Adeliño, Gómez-Ansón, Morgan-Ferrando, Vives, Puigdemont, Pérez-Egea, Ruscalleda, Álvarez and Pérez2011; Haroon et al. Reference Haroon, Miller and Sanacora2017). However, we found no evidence of a negative correlation between duration of illness and glutamate levels. In addition, peripheral inflammation, as measured by CRP, did not correlate significantly with any of the MRS measures in the present study; indeed in the PUT, if anything, CRP tended to correlate negatively with glutamine levels. In addition, there was no correlation between glutamine concentration in the PUT and clinical measures of anhedonia or fatigue. However, it must be acknowledged that few of the patients in the current study had significantly raised levels of CRP. Also, although changes in peripheral inflammatory markers such as CRP have been commonly shown in depressed patients, how far these peripheral markers reflect central inflammatory changes is open to question (Setiawan et al. Reference Setiawan, Wilson, Mizrahi, Rusjan, Miler, Rajkowska, Suridjan, Kennedy, Rekkas, Houle and Meyer2015).
Another recent investigation identified significantly high glutamate and glutamine levels in ACC in un-medicated depressed patients v. healthy controls, though peripheral inflammatory markers in these patients were not described (Abdallah et al. Reference Abdallah, Hannestad, Mason, Holmes, DellaGioia, Sanacora, Jiang, Matuskey, Satodiya, Gasparini and Lin2017). Interestingly, in the latter investigation, as in our study, there was a positive correlation between BDI score and glutamine but not the glutamate level in ACC. Taken together the data suggest that a variety of changes in glutamate and glutamine levels are present in depressed patients and further work is needed to understand the basis of this heterogeneity. In many previous studies, depressed patients were studied on antidepressant medication and while there is no clear link between antidepressant medication and lowered glutamate levels in anterior brain regions (Luykx et al. Reference Luykx, Laban, Van Den Heuvel, Boks, Mandl, Kahn and Bakker2012; Arnone et al. Reference Arnone, Mumuni, Jauhar, Condon and Cavanagh2015; Godlewska et al. Reference Godlewska, Near and Cowen2015), it seems likely that the presence of antidepressant treatment in a depressed patient is a marker of treatment-resistance; this might be a relevant factor in determining glutamate status.
Synaptic glutamate release and glutamate–glutamine cycling are highly dynamic processes, which mean that interpretation of a change in a single, static measure of glutamine in depression must be tentative (Yüksel & Öngür, Reference Yüksel and Öngür2010; Bond & Lim, Reference Bond and Lim2014). However, glutamine is largely found in glia where it is produced by the action of the enzyme, glutamine synthetase, on glutamate taken up from the synapse into glia (Zhou & Danbolt, Reference Zhou and Danbolt2014; Haroon et al. Reference Haroon, Miller and Sanacora2017). Indeed, this uptake of glutamate and its conversion to glutamine is one of the main mechanisms by which glutamate neurotoxicity is prevented, and is critically dependent on glial function. Thus the increased levels of glutamine found in the present study would not be straightforwardly compatible with the glial deficits that have been reported in neuropathological studies of depression (Cotter et al. Reference Cotter, Pariante and Everall2001), and our findings are more consistent with an increased release and metabolism of glutamate in the PUT in depression.
The PUT has been implicated in the circuitry models of depression which emphasise the role of cortical–striatal projections in reward and motivational processes (Gunaydin & Kreitzer, Reference Gunaydin and Kreitzer2016). Indeed, much of the glutamate neurotransmission in the PUT is derived from descending cortical fibres (Greenamyre, Reference Greenamyre2001). A recent meta-analysis of resting state fMRI studies in un-medicated depressed patients found altered activity in fronto-limbic systems, particularly implicating dorsolateral PFC and its connectivity to the PUT (Zhong et al. Reference Zhong, Pu and Yao2016). The authors suggested that altered activity in the PUT might be associated with deficits in social emotional regulation consistent with recent work that shows a role for caudate and PUT in emotional reappraisal (Ochsner et al. Reference Ochsner, Silvers and Buhle2012). Of course, the PUT has a long-recognised role in motor behaviour (Gunaydin & Kreitzer, Reference Gunaydin and Kreitzer2016) and in this respect, it is of interest that increased dopamine D2 receptor binding found in some studies of the PUT in depressed patients may correlate with the extent of psychomotor retardation (Meyer et al. Reference Meyer, McNeely, Sagrati, Boovariwala, Martin, Verhoeff, Wilson and Houle2006). There are important interactions between dopamine and glutamate release in the striatum which may also be relevant to the present findings (Gunaydin & Kreitzer, Reference Gunaydin and Kreitzer2016).
While our study has a number of strengths, such as the inclusion of a large number of un-medicated depressed patients and advanced 7 T imaging, the finding of increased glutamine levels in the PUT was not hypothesised and will require confirmation in a further investigation with bilateral imaging of the PUT. In view of the potentially important role of inflammation in the pathophysiology of depression and glutamate neurotransmission (Haroon et al. Reference Haroon, Fleischer, Felger, Chen, Woolwine, Patel, Hu and Miller2016; Reference Haroon, Miller and Sanacora2017), future studies should also include a subgroup of depressed patients with clearer evidence of peripheral inflammation. However, the current study does suggest altered glutamatergic activity in the PUT in patients with major depression. This abnormality, if it can be confirmed, is likely to reflect the role of the striatum, including the PUT, in the cortical–striatal circuitry that regulates the emotional and reward-driven behaviours that underpin the clinical symptomatology of depressive states. We suggest that future MRS investigations in depression should include studies of basal ganglia as well as the more usually studied, cortical brain regions.
Supplementary material
The supplementary material for this article can be found at https://doi.org/10.1017/S0033291717003373
Acknowledgements
The work was supported by an MRC programme grant to PJC (MR/K022202/1). CM was a Rhodes Scholar. We thank all the participants, as well as Clare Williams for skilled nursing assistance and Jon Campbell, David Parker, Michael Sanders and Caroline Young for expert radiographic assistance, and care of the participants during scanning.
Declaration of interest
In the past 3 years, PJC has served on an advisory board for Lundbeck. None of the other authors declares any conflict of interest.


 Open access