


1. Introduction
The greenhouse climate spanning the late Cretaceous to early Eocene serves as a critical analogue under high emission scenarios for deciphering future climate dynamics, with the Paleocene-Eocene thermal maximum (PETM) standing out as an extreme warming event of profound significance (Koch et al. Reference Koch, Zachos and Gingerich1992; Zachos et al. Reference Zachos, Dickens and Zeebe2008). Characterized by global temperature elevation (Zachos et al. Reference Zachos, McCarren, Murphy, Röhl and Westerhold2010; Dunkley Jones et al. Reference Dunkley Jones, Lunt, Schmidt, Ridgwell, Sluijs, Valdes and Maslin2013), marine deoxygenation (Yao et al. Reference Yao, Paytan and Wortmann2018), acidification, a prominent negative carbon isotope excursion (CIE) (Jiang et al. Reference Jiang, Cui and Wang2021), intensified hydrological cycling (Carmichael et al. Reference Carmichael, Inglis, Badger, Naafs, Behrooz, Remmelzwaal, Monteiro, Rohrssen, Farnsworth, Buss, Dickson, Valdes, Lunt and Pancost2017), shallowed carbonate compensation depth (Zachos et al. Reference Zachos, Röhl, Schellenberg, Sluijs, Hodell, Kelly, Thomas, Nicolo, Raffi, Lourens, McCarren and Kroon2005) and benthic microbial extinctions (Barrett et al. Reference Barrett, Adebowale, Birch, Wilson and Schmidt2023), the PETM has been extensively documented through both marine and terrestrial sedimentary archives. Initial investigations centred on oceanic records such as ODP Site 690B (Tremolada et al. Reference Tremolada, De Bernardi and Erba2008), and subsequent studies have expanded to coastal and terrestrial basins across North America (Wing et al. Reference Wing, Harrington, Bowen and Koch2003; Foreman et al. Reference Foreman, Heller and Clementz2012; Sutherland, Reference Sutherland2021), Europe (Schmitz and Pujalte, Reference Schmitz and Pujalte2003; Giusberti et al. Reference Giusberti, Rio, Agnini, Backman, Fornaciari, Tateo and Oddone2007) and Asia (Wang et al. Reference Wang, Xi, Mattioli, Wang and Wan2023 b) – including the Bighorn, Tarim and Nanxiong Basins (Yin et al. Reference Yin, Zhang, Gu, Yin, Wen, Jin and Wang2023) – utilizing isotopic, paleontological and sedimentological approaches. While these records have advanced our understanding of global PETM characteristics, basin-specific variations in sedimentary environments and lithology hinder robust global correlations. Moreover, terrestrial studies remain relatively underdeveloped compared to marine counterparts due to the inherent heterogeneity and poor lateral continuity of continental strata, despite their unique value in preserving paleobiological proxies that capture regional climate responses (Ting et al. Reference Ting, Bowen, Koch, Clyde, Wang, Weng and McKenna2003; Kraus and Riggins, Reference Kraus and Riggins2007; Chen et al. Reference Chen, Wang, Hu, Yang, Zhu, Dong, Tang, Peng and Ding2014; Teng et al. Reference Teng, Wang, Liu, Yan and Luo2021; Xie et al. Reference Xie, Wu and Fang2022).
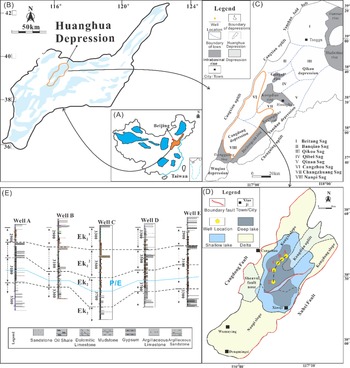
To address these gaps, this study focuses on laminated lacustrine shales of the Paleocene Kongdian Formation in the Bohai Bay Basin – a continental rift basin in northern China – where well-preserved Paleocene-Eocene strata, including unambiguous PETM records, have been identified via Ar/K dating and stratigraphic correlation of 11 marine-terrestrial profiles (Figure 1) (Shi et al. Reference Shi, Jin, Liu, Zhang, Fan and Gao2022). By integrating mineralogical, inorganic and organic geochemical analyses of these terrestrial lacustrine sediments, we aim to unravel the climatic and environmental dynamics of the PETM in East Asia. Specifically, this research quantifies patterns of aridification and episodic precipitation, providing high-resolution insights into paleoenvironmental conditions and the complex interplay between global warming and regional climate feedbacks. These findings not only enhance our understanding of ancient climate systems but also underscore the utility of lacustrine laminations in the Bohai Bay Basin as a key archive for refining PETM global change models.
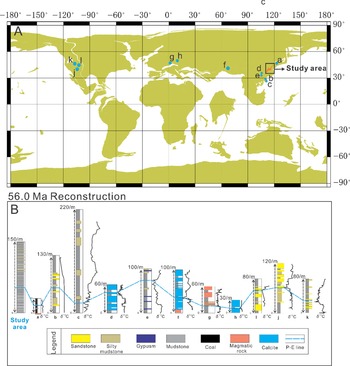
Location of the study area in the Bohai Bay Basin and sequence correlation of chronostratigraphic, isotopic and lithologic records with other PETM locales.
https://www.odsn.de/odsn/services/paleomap/paleomap.html. (A) Map of PETM sites mentioned in the text. Circles represent the sites where the PETM has been studied. The black square shows the study area. (B) Carbon isotope curves of the records indicated in the map. (a) organic carbon isotope curve of the west open profile of Fushun Basin; (b) carbon isotope curve of soil carbonate nodules in Hengyang Basin; (c) carbon isotope curve of shale in the Maogouwan section, Nanxiong Basin; (d) carbon isotope curve of lacustrine carbonate rocks in the Yuhuangding Section, Nanyang Basin; (e) carbon isotope curve of SKD1 core, Jianghan Basin; (f) stratigraphic and carbon isotope data of the Qimugen Section, Sw Tarim Basin; (g) Claret site in the Tremp – Graus Basin, Spain; (h) Forada section of Italy; (i) stratigraphic and carbon isotope data of Chalk Butte, Powder River Basin; (j) stratigraphic and carbon isotope data of Piceance Creek Basin; (k) stratigraphic and carbon isotope data of Polecat Bench, Bighorn Basin.

2. Geological setting
The Bohai Bay Basin is the most significant oil and gas basin in the Asia-Pacific region, covering an area of 200,000 km2 (Zhao et al. Reference Zhao, Zhou, Pu, Jin, Shi, Han, Jiang, Han, Zhang, Wang and Ma2020). It is a faulted basin formed through a series of rift and Neogene sag phases (Figure 2A). The Huanghua Sag is located deep within the Bohai Bay Basin, with a general NE-SW orientation. The Huanghua Sag is approximately 250 km long and 50–100 km wide (Figure 2B) (Zhao et al. Reference Zhao, Pu, Jiang, Zhou, Jin, Xiao, Fu and Li2019), covering a total area of about 17,000 km2. It is bordered by the Yanshan Fold Belt to the north, the Shahejie Belt Uplift to the east, the Chengning Uplift to the south and the Cangxian Uplift to the west (Figure 2C) (Zhao et al. Reference Zhao, Zhou, Pu, Jin, Shi, Han, Jiang, Han, Zhang, Wang and Ma2020). Following complex Mesozoic-Cenozoic subsidence and uplift events, the Huanghua Sag developed into the Cangdong Depression (Figure 2C), comprising deltaic and lacustrine sedimentary environments (Figure 2D).
(A) Location of the Bohai Bay Basin (BBB). (B) Location of the Huanghua Depression. (C) Location of the Cangdong Sag. (D) Location of the wells (Well A, Well B, Well C, Well D, Well (E). E. Stratigraphic correlation of the P/E boundary within the study area.
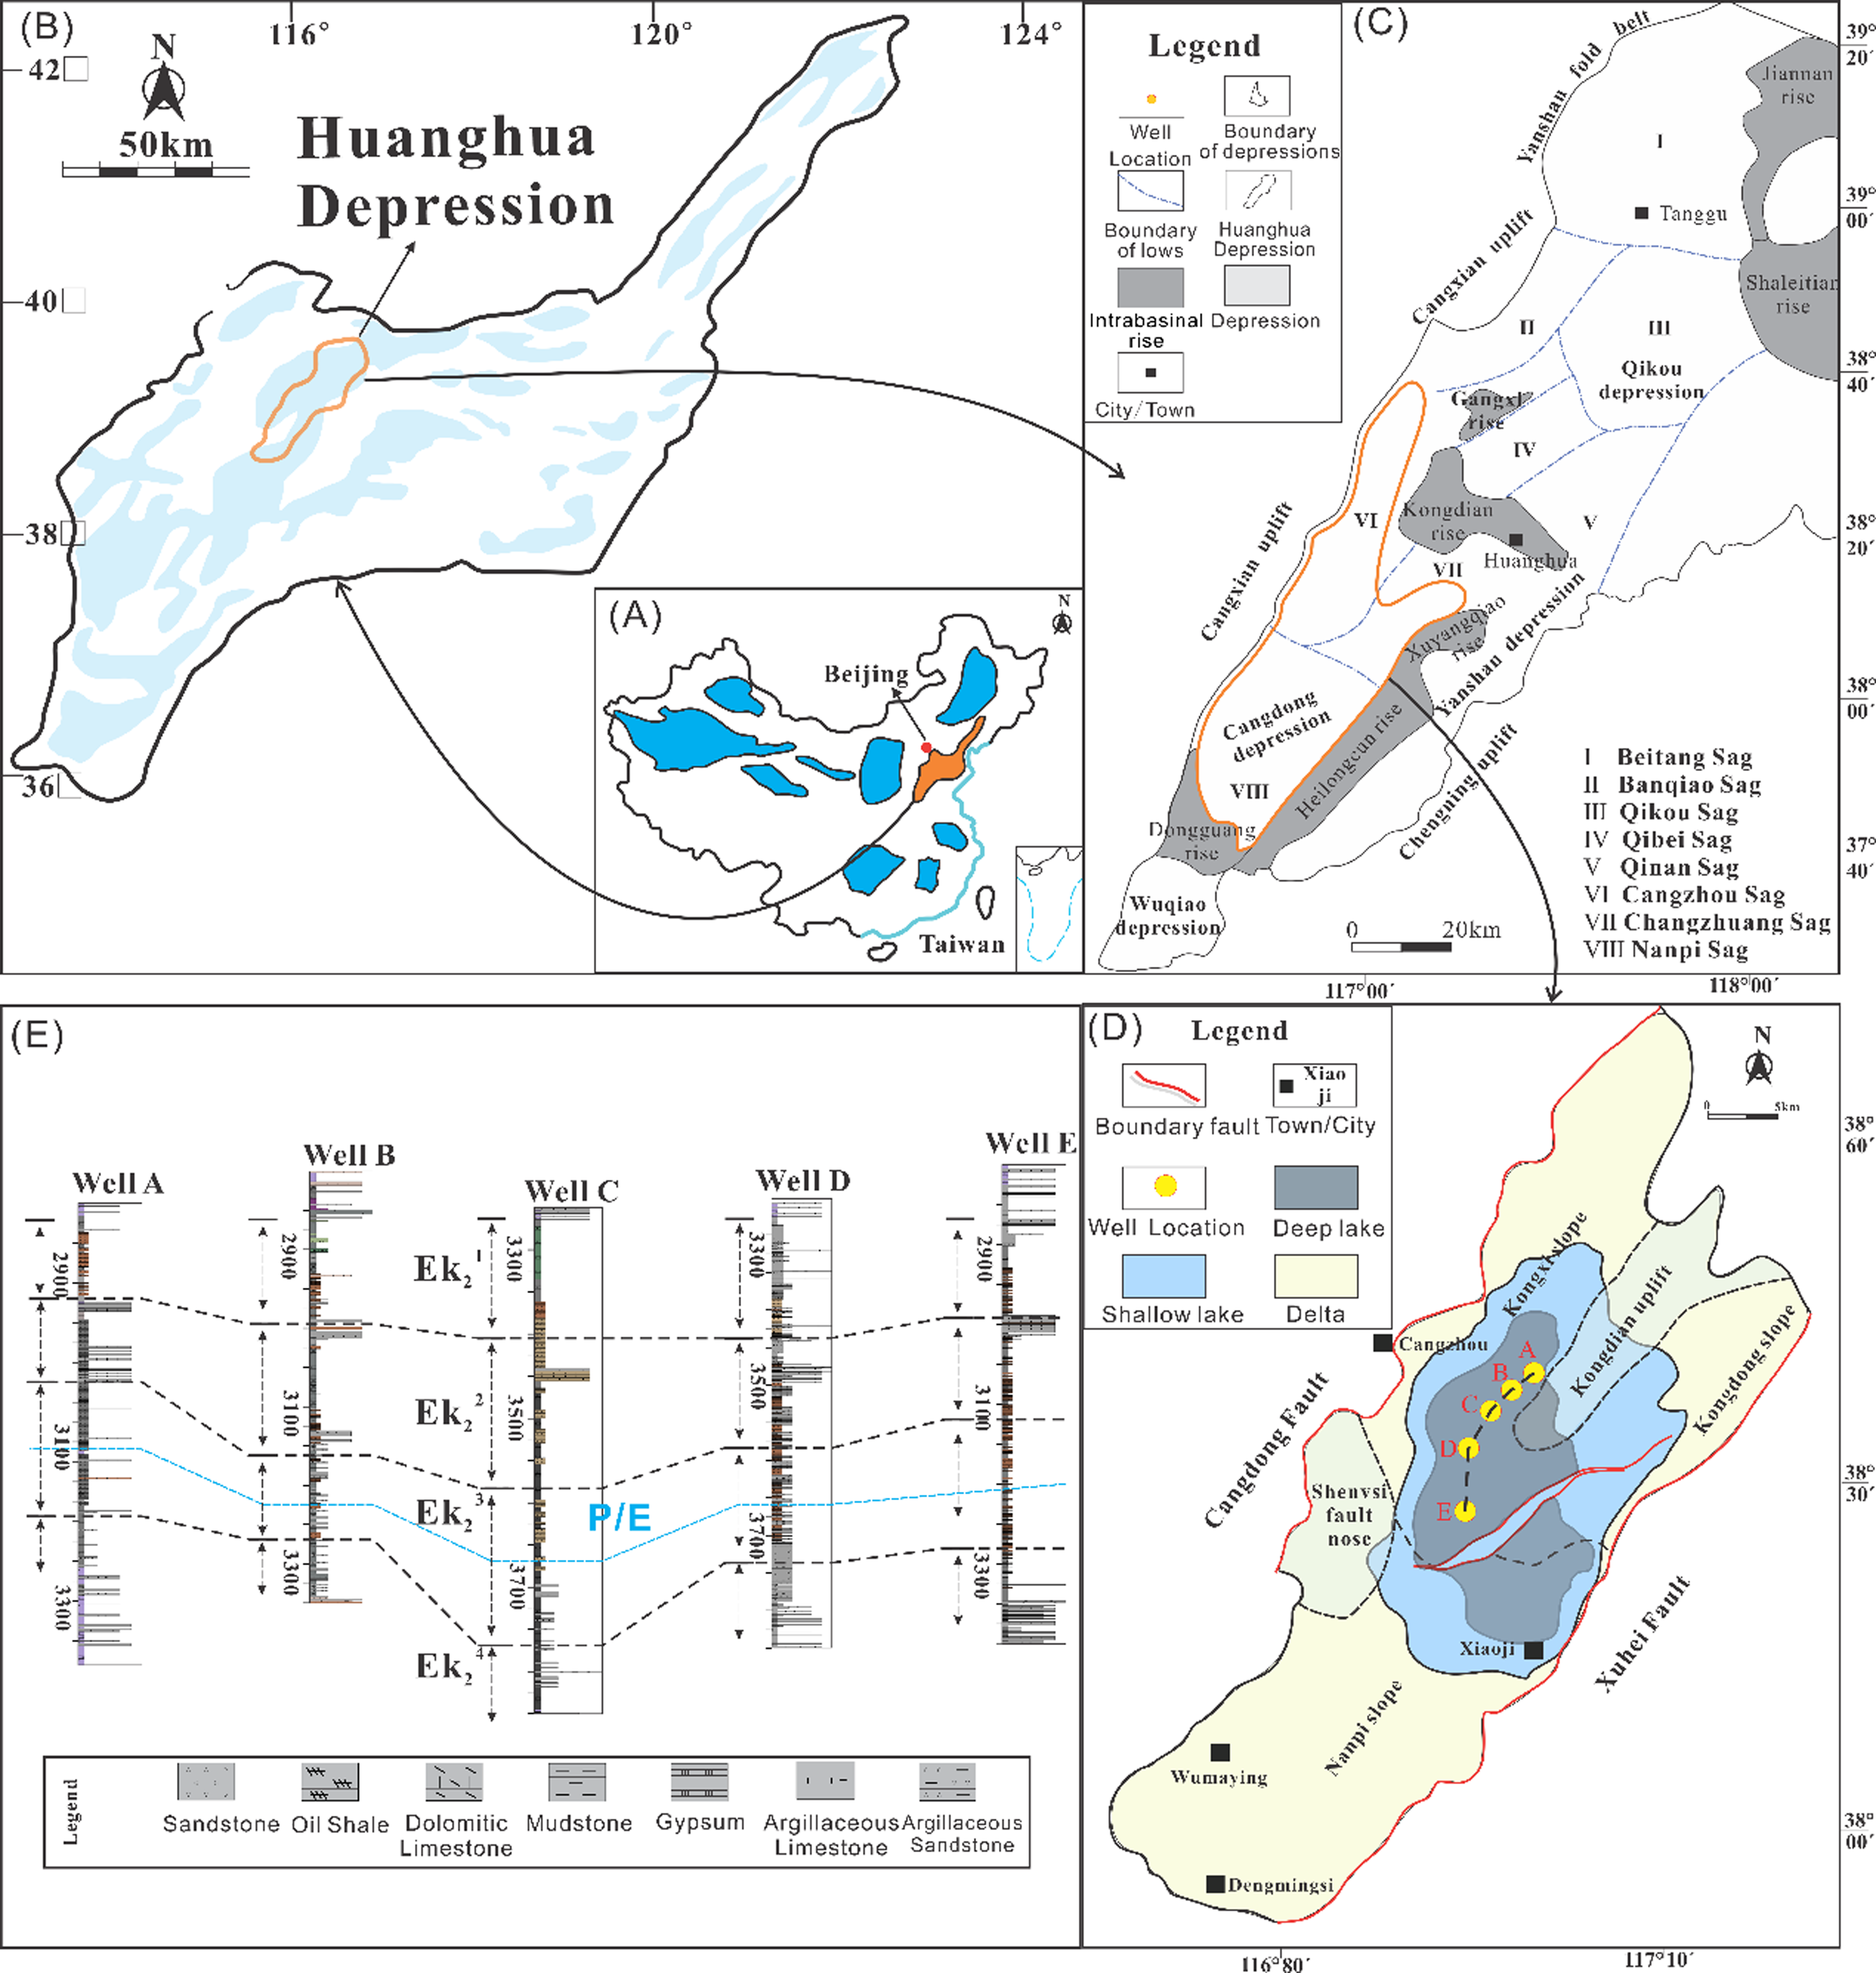
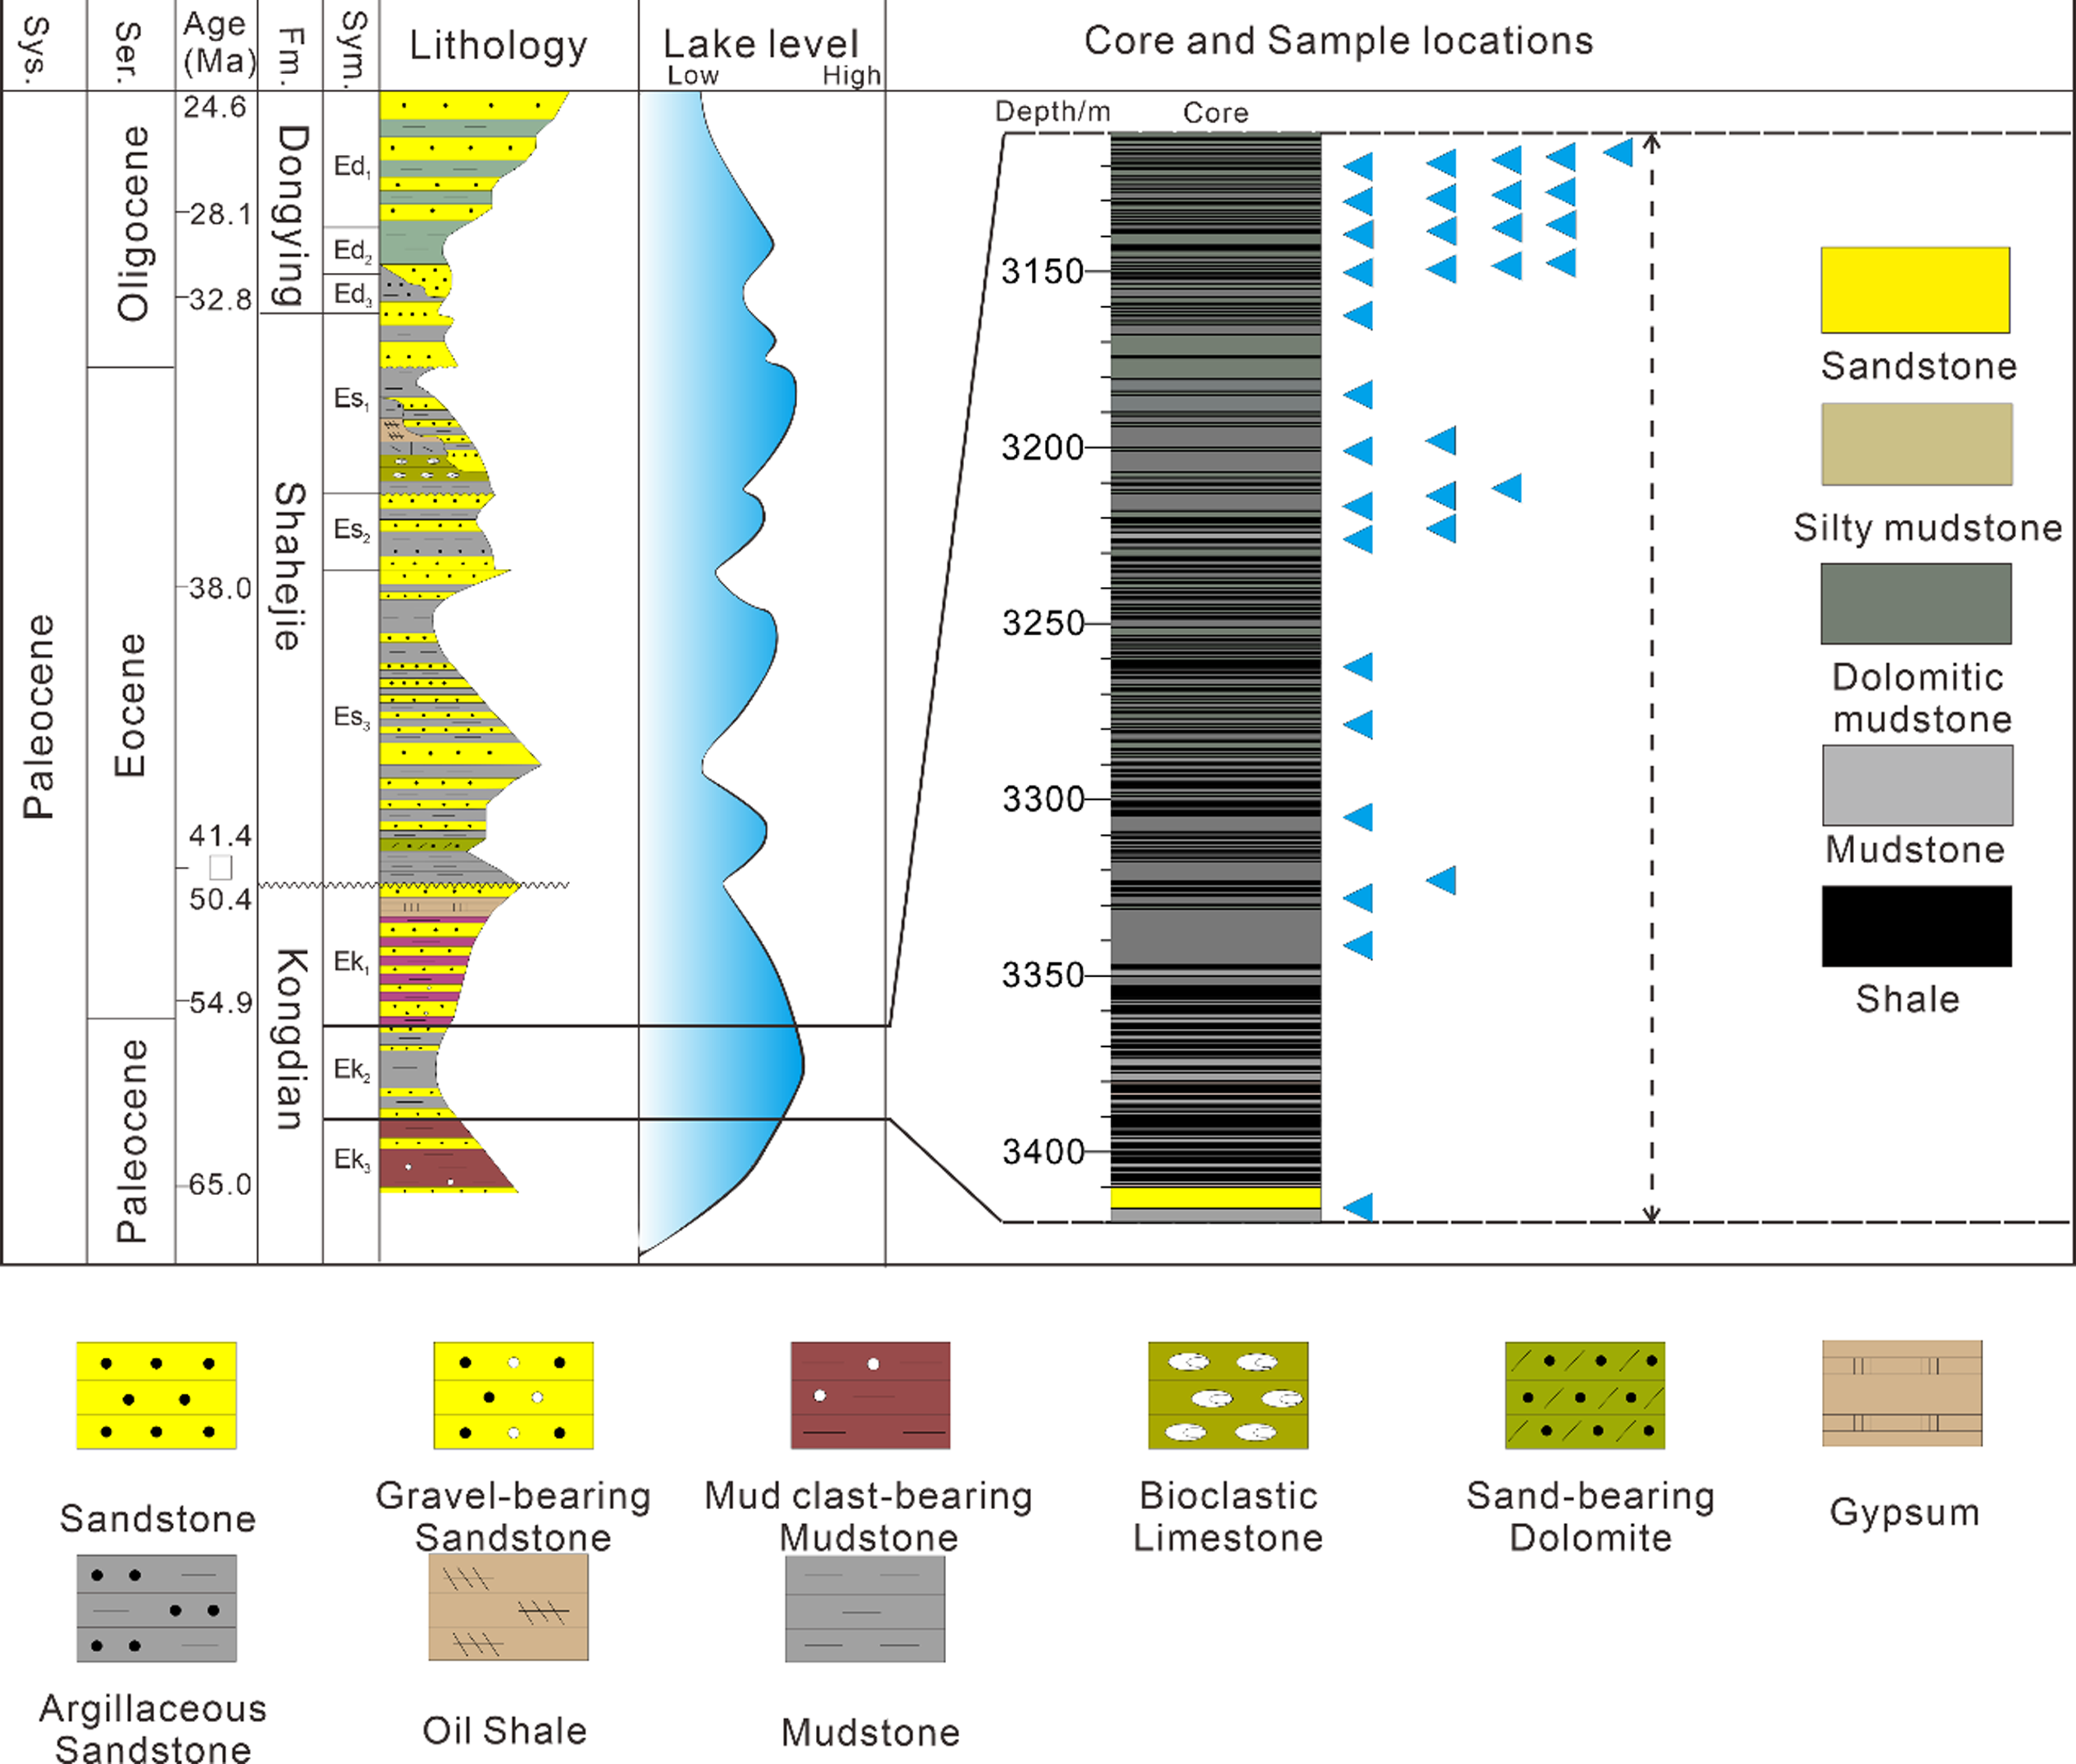
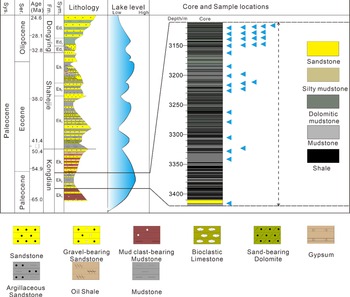
The Paleogene in eastern China is an important source rock for hydrocarbons, comprising the Kongdian, Shahejie and Dongying formations (Figure 3). Among these, the Kongdian Formation, which is the focus of this study, is the primary hydrocarbon-generating unit and comprises 3 members (Ek3 through Ek1: from bottom to top). Rock types in the Kongdian Formation are predominantly thick dark mudstones interbedded with dolomites and argillaceous dolomites (Zhao et al. Reference Zhao, Zhou, Pu, Jin, Shi, Han, Jiang, Han, Zhang, Wang and Ma2020). The sedimentary environment of the Kongdian Formation was a reducing to brackish water lake basin, characterized by shales bearing intercalations predominantly comprising thin, regular and continuous laminations.
Stratigraphy of the studied Paleocene-Oligocene sedimentary record in the Bohai Basin: the right panel is sampling locations. Sys.: System; Ser.: Series; FM.: Formation; Sym.: Symbol.
3. Material and methods
This study is based on the detailed analysis of a drill core from the Paleogene Kongdian Formation in the Bohai Bay Basin (Figure 2E, well E). The core lithology predominantly consists of shale, spanning a depth range from 3109.86 to 3413.46 m. To cover the PETM totally, 33 samples were collected on approximately 303.6, 10 from the PETM and 23 from pre-PETM and post-PETM. Each section has been thoroughly described (Figure 3). Sample analyses included X-ray diffraction (XRD), thin section petrography, scanning electron microscopy (SEM), pyrolysis to determine total organic content (TOC), trace element analysis and carbon and oxygen isotope analysis for all selected samples.
3.a. X-ray diffraction (XRD), petrography, scanning electron microscopy (SEM) and palynology analysis
For this study, samples collected from the target interval were first ground into a fine powder (particle size < 75 μm) using an agate mortar to ensure homogeneity for XRD analysis. The prepared powder was loaded into a Bruker D8 Advance XRD instrument equipped with Cu Kα radiation (λ = 1.5406 Å) for testing. Measurement parameters were set as follows: scan range of 2θ = 3–70°, step size of 0.02°, scan speed of 4°/min and operating voltage/current of 40 kV/40 mA. To comprehensively characterize mineralogy, both bulk mineral composition (e.g., quartz, feldspar, carbonate and anhydrite) and clay mineral identification were conducted. For clay mineral analysis, supplementary pretreatments were performed: K/Mg-saturation, ethylene glycol solvation (to expand smectite interlayers) and heating at 550°C for 2 hours (to collapse clay structures), enabling the distinction of smectite, vermiculite, illite and kaolinite via peak shift analysis. Post-measurement, the obtained diffractograms were quantitatively analyzed using the Rietveld refinement method (Topas 6.0 software) to determine the relative content of each mineral, with analytical precision verified by repeated tests (relative error < 5%).
Concerning the thin-section analysis, rock samples were polished or ground to create thin sections. These sections were then examined under single and orthogonal polarizations at magnification levels ranging from 20x to 400x.
Shale samples were prepared by polishing them with argon ions using Ilion 697. The polishing process took roughly two hours. The FEI Quanta FEG450 field emission scanning electron microscope was employed to examine shale samples polished with the argon ion using the Ilion 697. This examination allowed for the determination of pore properties. It is important to note that the shale samples were polished for approximately two hours. For argon ion polishing (Ilion 697), we set an ion energy of 6 keV, an incidence angle of 45° and a rotation speed of 5 rpm. The FEI Quanta FEG450 SEM was operated at 10 kV accelerating voltage, 8 mm working distance and secondary electron detector mode.
5 g of each sample was treated with 10% HCl and 40% HF to remove carbonates and silicates, sieved through a 10 μm mesh and mounted on slides. Palynomorphs were identified using a Leica DM2500 microscope (400× magnification), with at least 300 grains counted per sample for quantitative analysis.
3.b. Total organic content (TOC) and pyrolysis
To effectively conduct the total organic carbon analysis, the assessed sample size was reduced to a range of 170–200 mesh. After being neutralized with distilled water, inorganic carbon was removed from the samples using a 12.5% HCL solution, and they were subsequently dried at 60 to 80°C in an oven. The quantity of TOC in the treated powdered samples was then measured.
All samples were ground into a powder with a mesh size of 100, with 80 mg of each sample being added to the instrument and subsequently heated to 650°C in a nitrogen-heavy environment at a rate of 25°C per minute. The Rock–Eval pyrolysis instrument has the parameters of Tmax, S1 and S2. The target temperature was set at 300°C for 3 min and continued heating at 25°C per min until reaching 650°C. Tmax constitutes the temperature for kerogen cracking; S1 represents the quantity of free hydrocarbons under 300°C, while S2 represents the number of hydrocarbons produced from the kerogen cracking between the temperatures of 300°C and 650°C.
3.c. Trace element and stable isotope analysis
Trace element analyses were conducted following a standardized sample pretreatment and analysis procedure: first, the raw materials were crushed to approximately 200 mesh and then calcinated in a furnace set at 700°C. For the subsequent analysis, the pretreated samples were dissolved in a mixed solution of HF and HNO3 and subjected to closed-vessel microwave digestion to ensure complete dissolution. Trace element concentrations were finally determined using an Agilent 7900 ICP-MS instrument. For quality control, we used the geological reference material GSR-1 (shale standard sample); the measured values of its trace elements deviated by <5% from the certified values. The uncertainties of the measured concentrations (expressed as relative standard deviation, RSD) were 2–4% for major trace elements (e.g., V and Ni) and ≤6% for low-abundance elements (e.g., Cd and Sb), verified via duplicate analyses of 10% of the samples. The enrichment degree is evaluated using enrichment factors (EF), calculated as: $\rm EF = {\left( {{C_i}/{C_{AL}}} \right)_{samlpe}}/{\left( {{C_i}/{C_{AL}}} \right)_{UCC}}$
where Ci and CAL represent the concentrations of target elements and Al (reference element) in samples and the upper continental crust (UCC), respectively. EF values in the middle interval are significantly higher than those in other intervals, confirming the concentrated enrichment of trace elements.
Carbon and oxygen isotope analyses were conducted following optimized sample preparation and detection procedures: first, ∼200-mesh powdered samples were treated with hydrogen peroxide to remove organic matter, then heated to 105°C for 12 hours to eliminate moisture. For isotopic analysis, the pretreated samples were reacted with H₃PO₄, and the resulting gases were analyzed using a Thermo Delta V Advantage isotope ratio mass spectrometer (IRMS).
To ensure data reliability, strict quality control (QC) protocols were implemented: we measured the international reference materials NBS‑19 (carbonate standard) and LSVEC (lithium carbonate) alongside samples for calibration and quality control. Both carbon isotope (δ13C) and oxygen isotope (δ18O) measurements were reported relative to the VPDB standard. Reproducibility was verified via duplicate analyses of 15% of samples, with relative standard deviations (RSD) of <0.15% for δ13C and <0.2% for δ18O, confirming high data precision.
4. Results and interpretation
4.a. Laminae thickness distributions
Through observation and statistical analysis of laminae using both core samples and thin sections, the distribution of laminae in the study interval was examined. Lamination density in core samples ranged from 12 to 968 laminae per metre, with an average density of 322 laminae per metre and an average thickness of 2.28 mm. In thin sections, the density of lamination development ranged from 5 to 510 laminae per metre, with an average density of 75 laminae per metre and an average thickness of 251.3 μm. Specifically, in the core samples at depths of 3184.38–3295.19 m, the lamination density was 325 laminae per metre, whereas in the thin sections it was 80 laminae per metre (Figure 4).
The vertical distribution characteristics of laminae of Well E by core and thin sections.
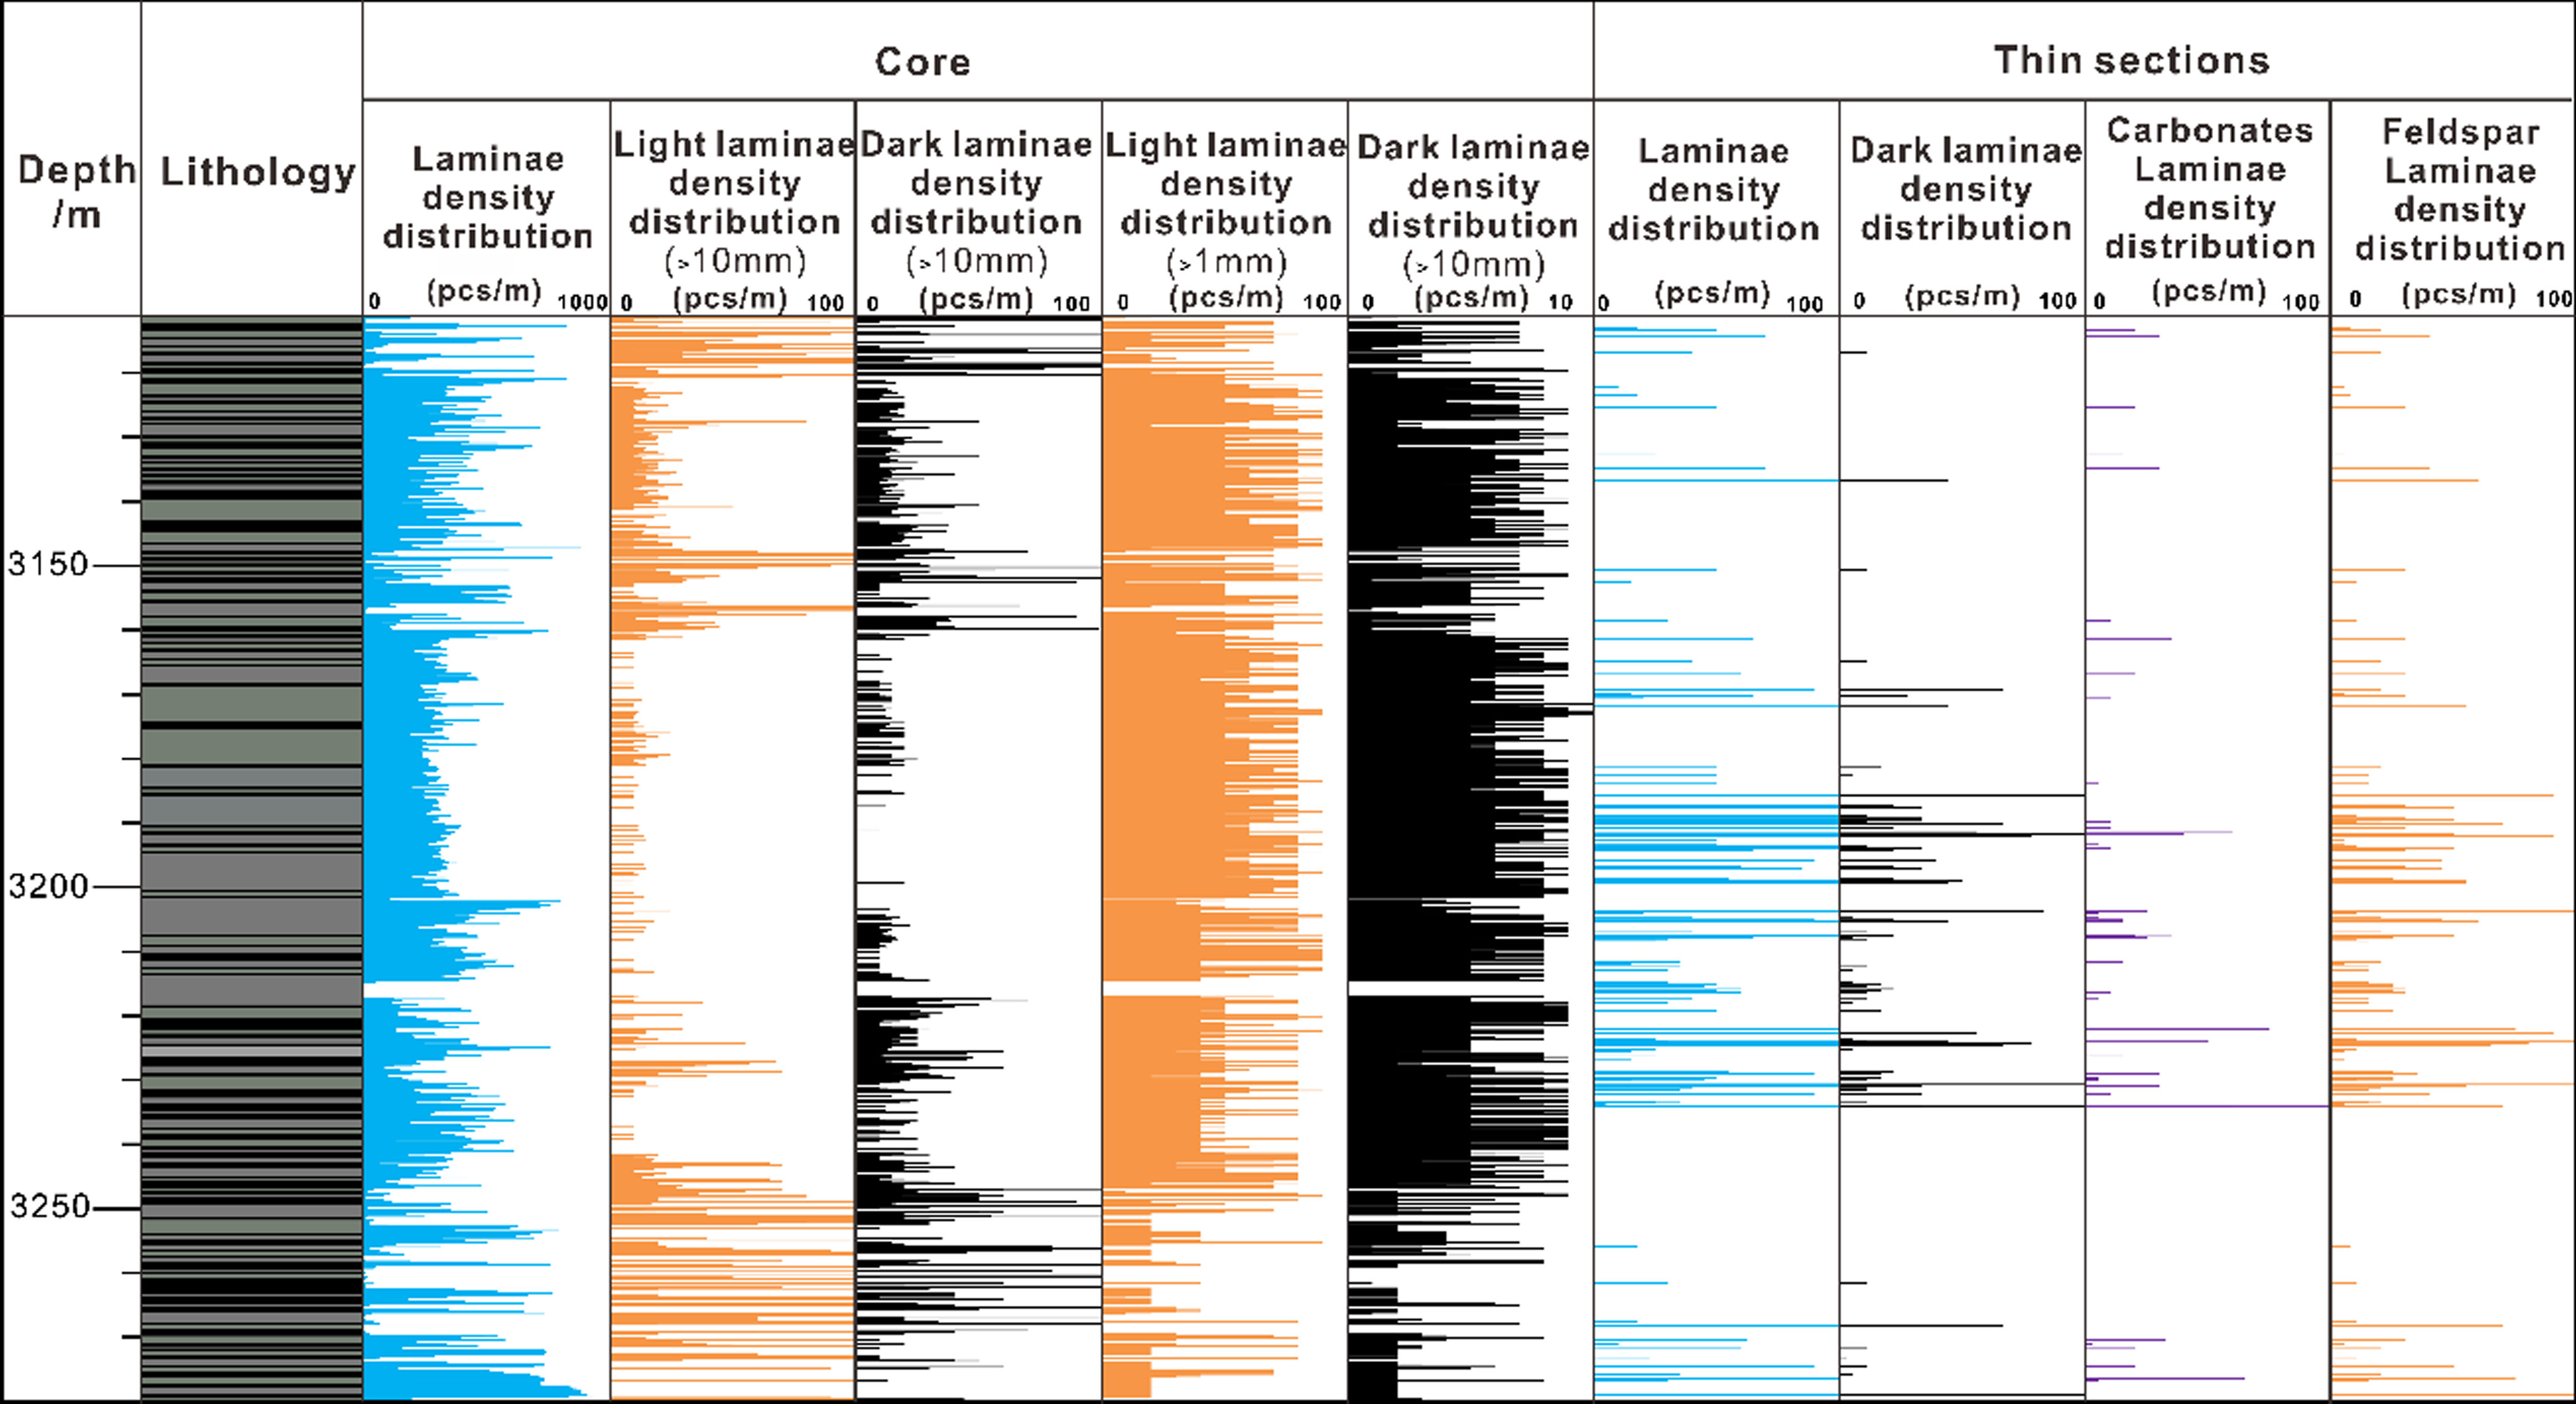
According to the laminae division standard of previous research (Dean et al. Reference Dean, Kemp and Pearce2001; Wang et al. Reference Wang, Zhang, Hu, Shu, Sun and Bao2019), the laminae growth stages (low density, low thickness (LL); high density, high thickness (HH); and low density, high thickness (LH)) are separated by the laminae density and the maximum thickness of each lamina (Wang et al. Reference Wang, Zhang, Hu, Shu, Sun and Bao2019). There are two distinct phases in the laminae development of the second component of the Paleogene Kongdian Formation from bottom to top. The HH type predominates in the depth range of 3184.38–3295.19m, while the LL type predominates in the other depths.
4.b. Mineralogy and lithology
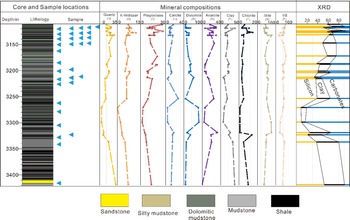
The mineralogical analysis results, as determined using XRD, are presented in Figure 5. The mineral composition of the shale includes quartz, feldspar, clay, calcite and dolomite. The laminae are mainly composed of detrital minerals and carbonates, with a low clay content. The mineral composition exhibits substantial vertical heterogeneity. Specifically, carbonates in the laminations are predominantly composed of calcite and dolomite, with average values of 7.42% and 19.36%, respectively. The carbonate content fluctuates widely, with the highest average carbonate content found between depths of 3184.38–3295.19 m, ranging from 34.83% to 83.33%, with an average of 49.52%. The average content of detrital minerals (quartz and feldspar) in the laminations is 32.44%, and the clay content averages 18.04%. In the shale laminations between the depths of 3109.86–3169.96 m, the content of detrital minerals (quartz and feldspar) is 54.95%, with average carbonate and clay contents of 23.40% and 21.66%, respectively.
Mineral contents of laminae samples from XRD. I/S: illite/smectite ratio.
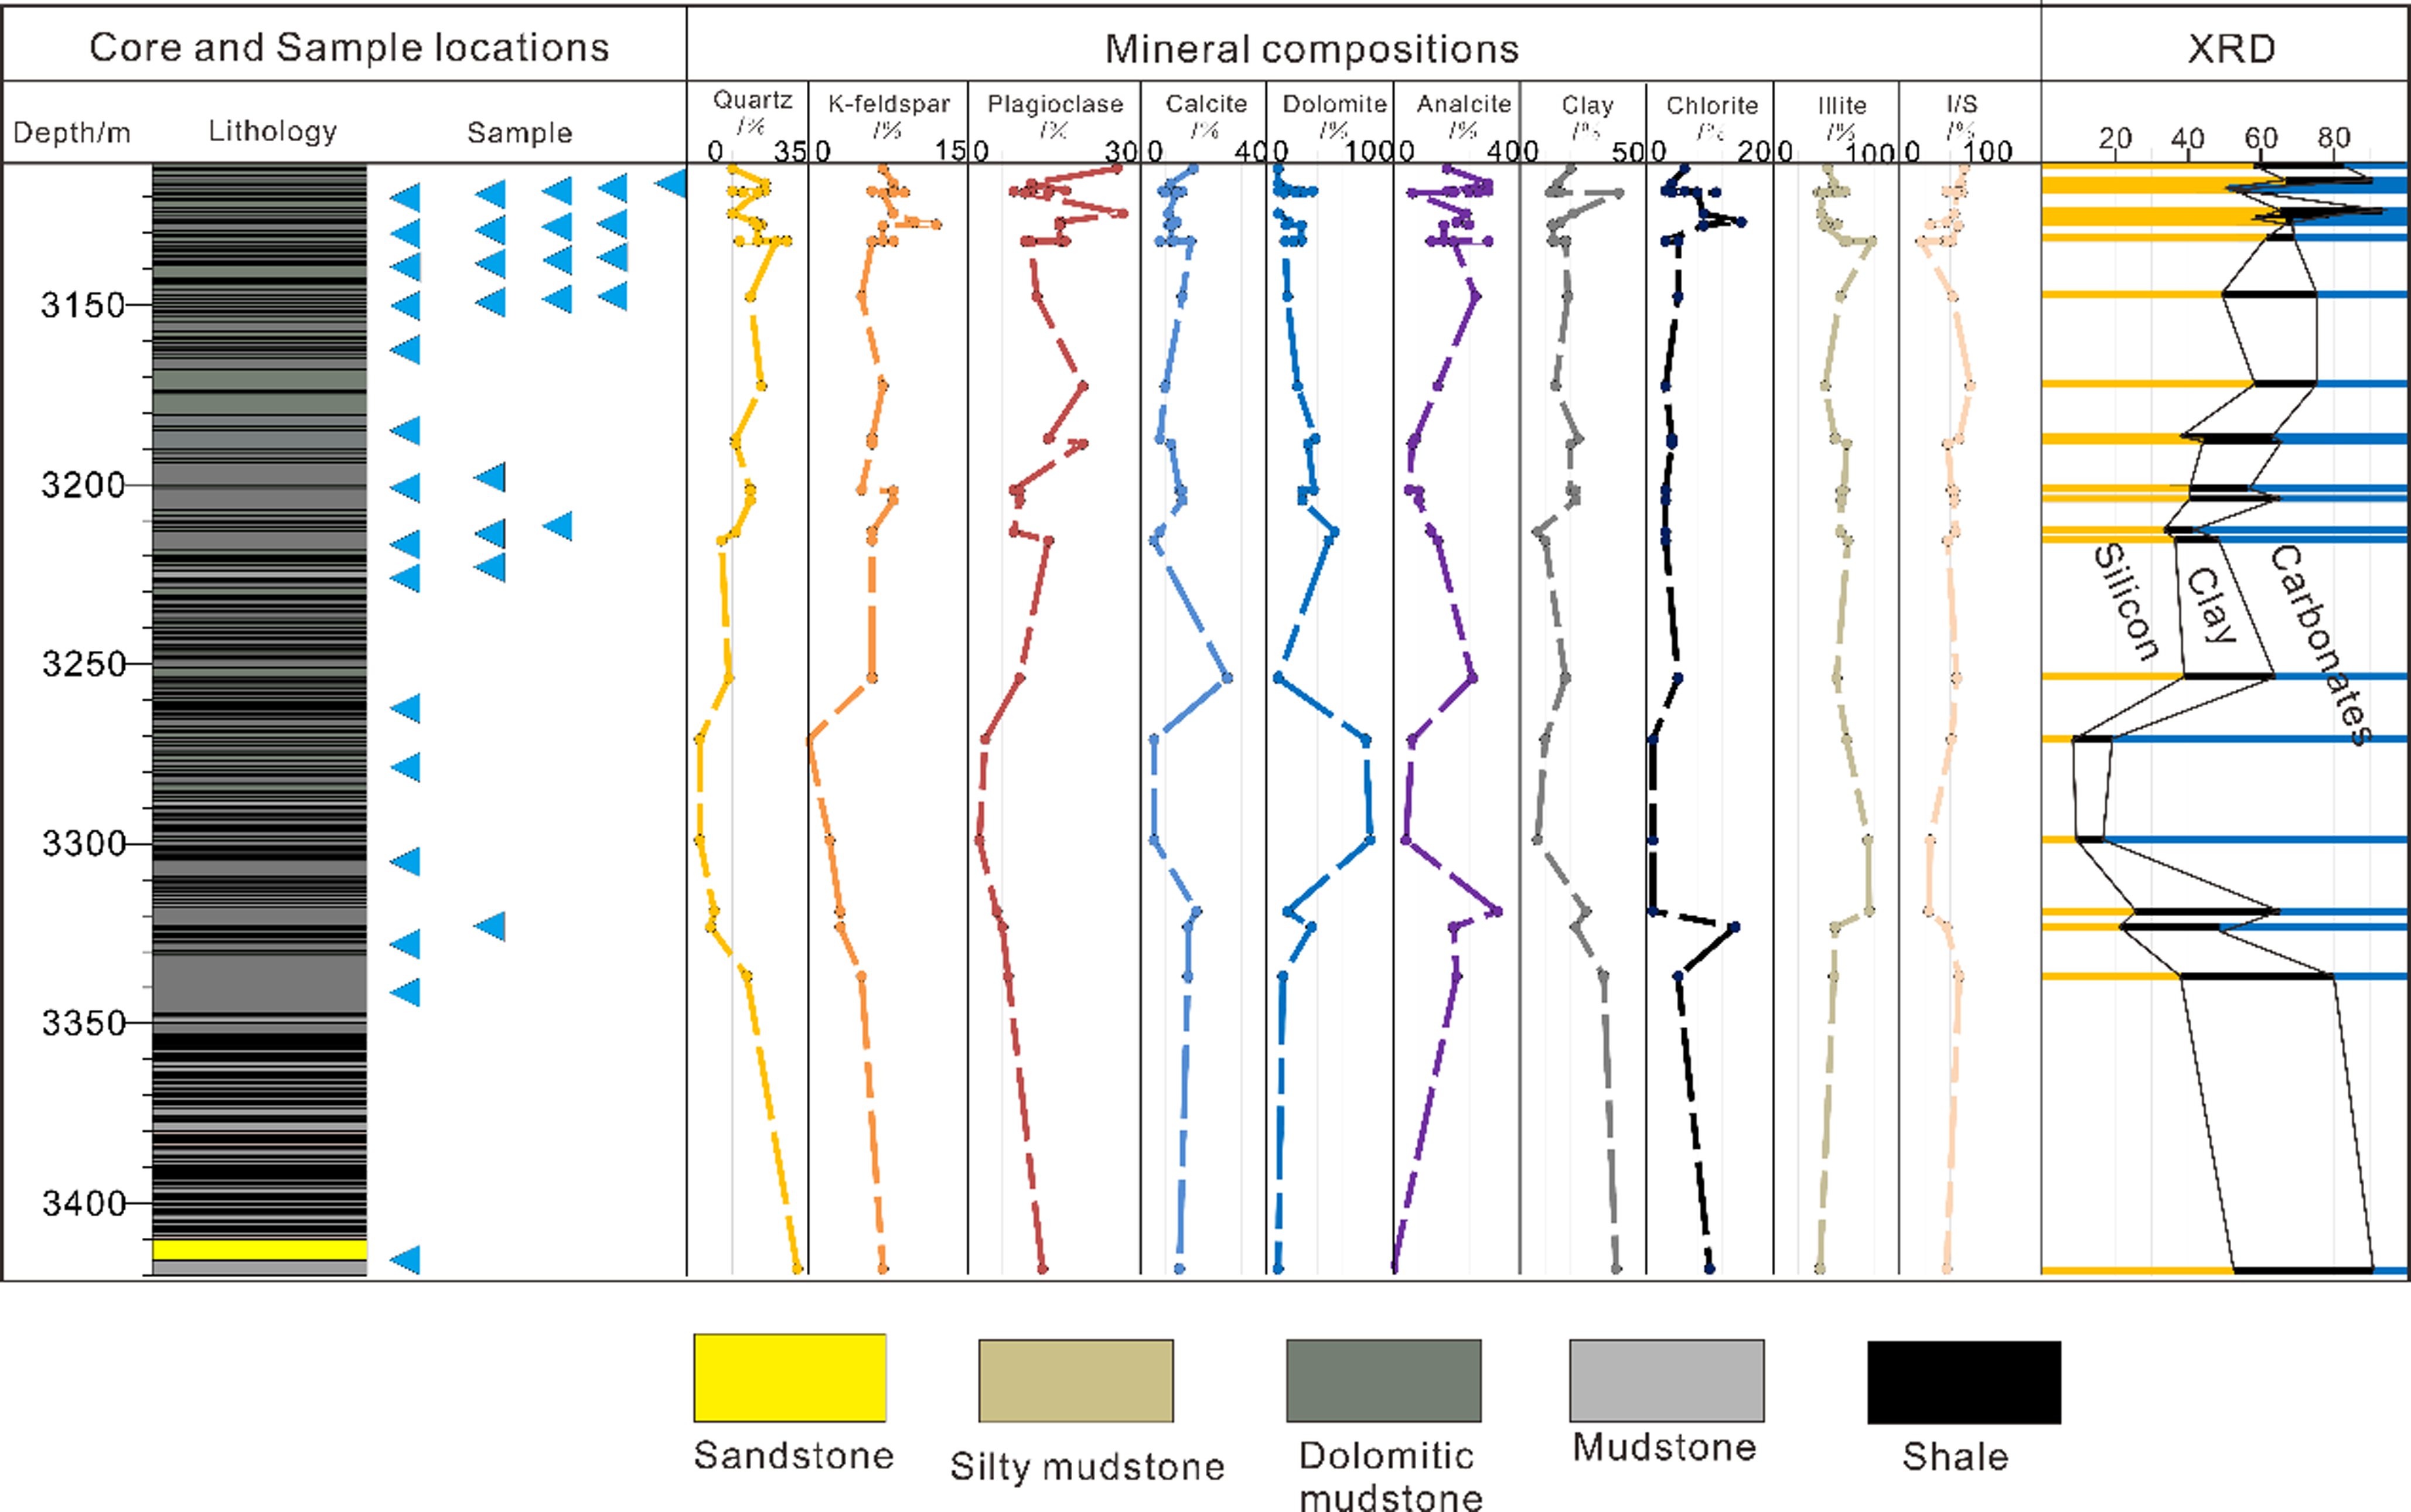
It can be observed in the mineral composition analyses of well E (Figure 5) that from the bottom to the top of the core, the contents of quartz and clay first decrease from ∼3400 to ∼3270 m and then increase upward. In contrast, the contents of dolomite and calcite (carbonate minerals) are initially high at the core bottom and subsequently decrease upward. Terrestrial debris supply is indicated by the combined contents of quartz, K-feldspar and plagioclase – detrital minerals derived from the continental crust. These minerals show a trend of initial decrease followed by upward increase, consistent with enhanced terrigenous input during the late PETM interval. Additionally, analcime likely reflects early diagenetic alteration of volcanic detritus, while chlorite may indicate detrital input or diagenetic transformation of clay minerals under relatively low-temperature conditions, both of which provide complementary constraints on sedimentary provenance and diagenetic history.
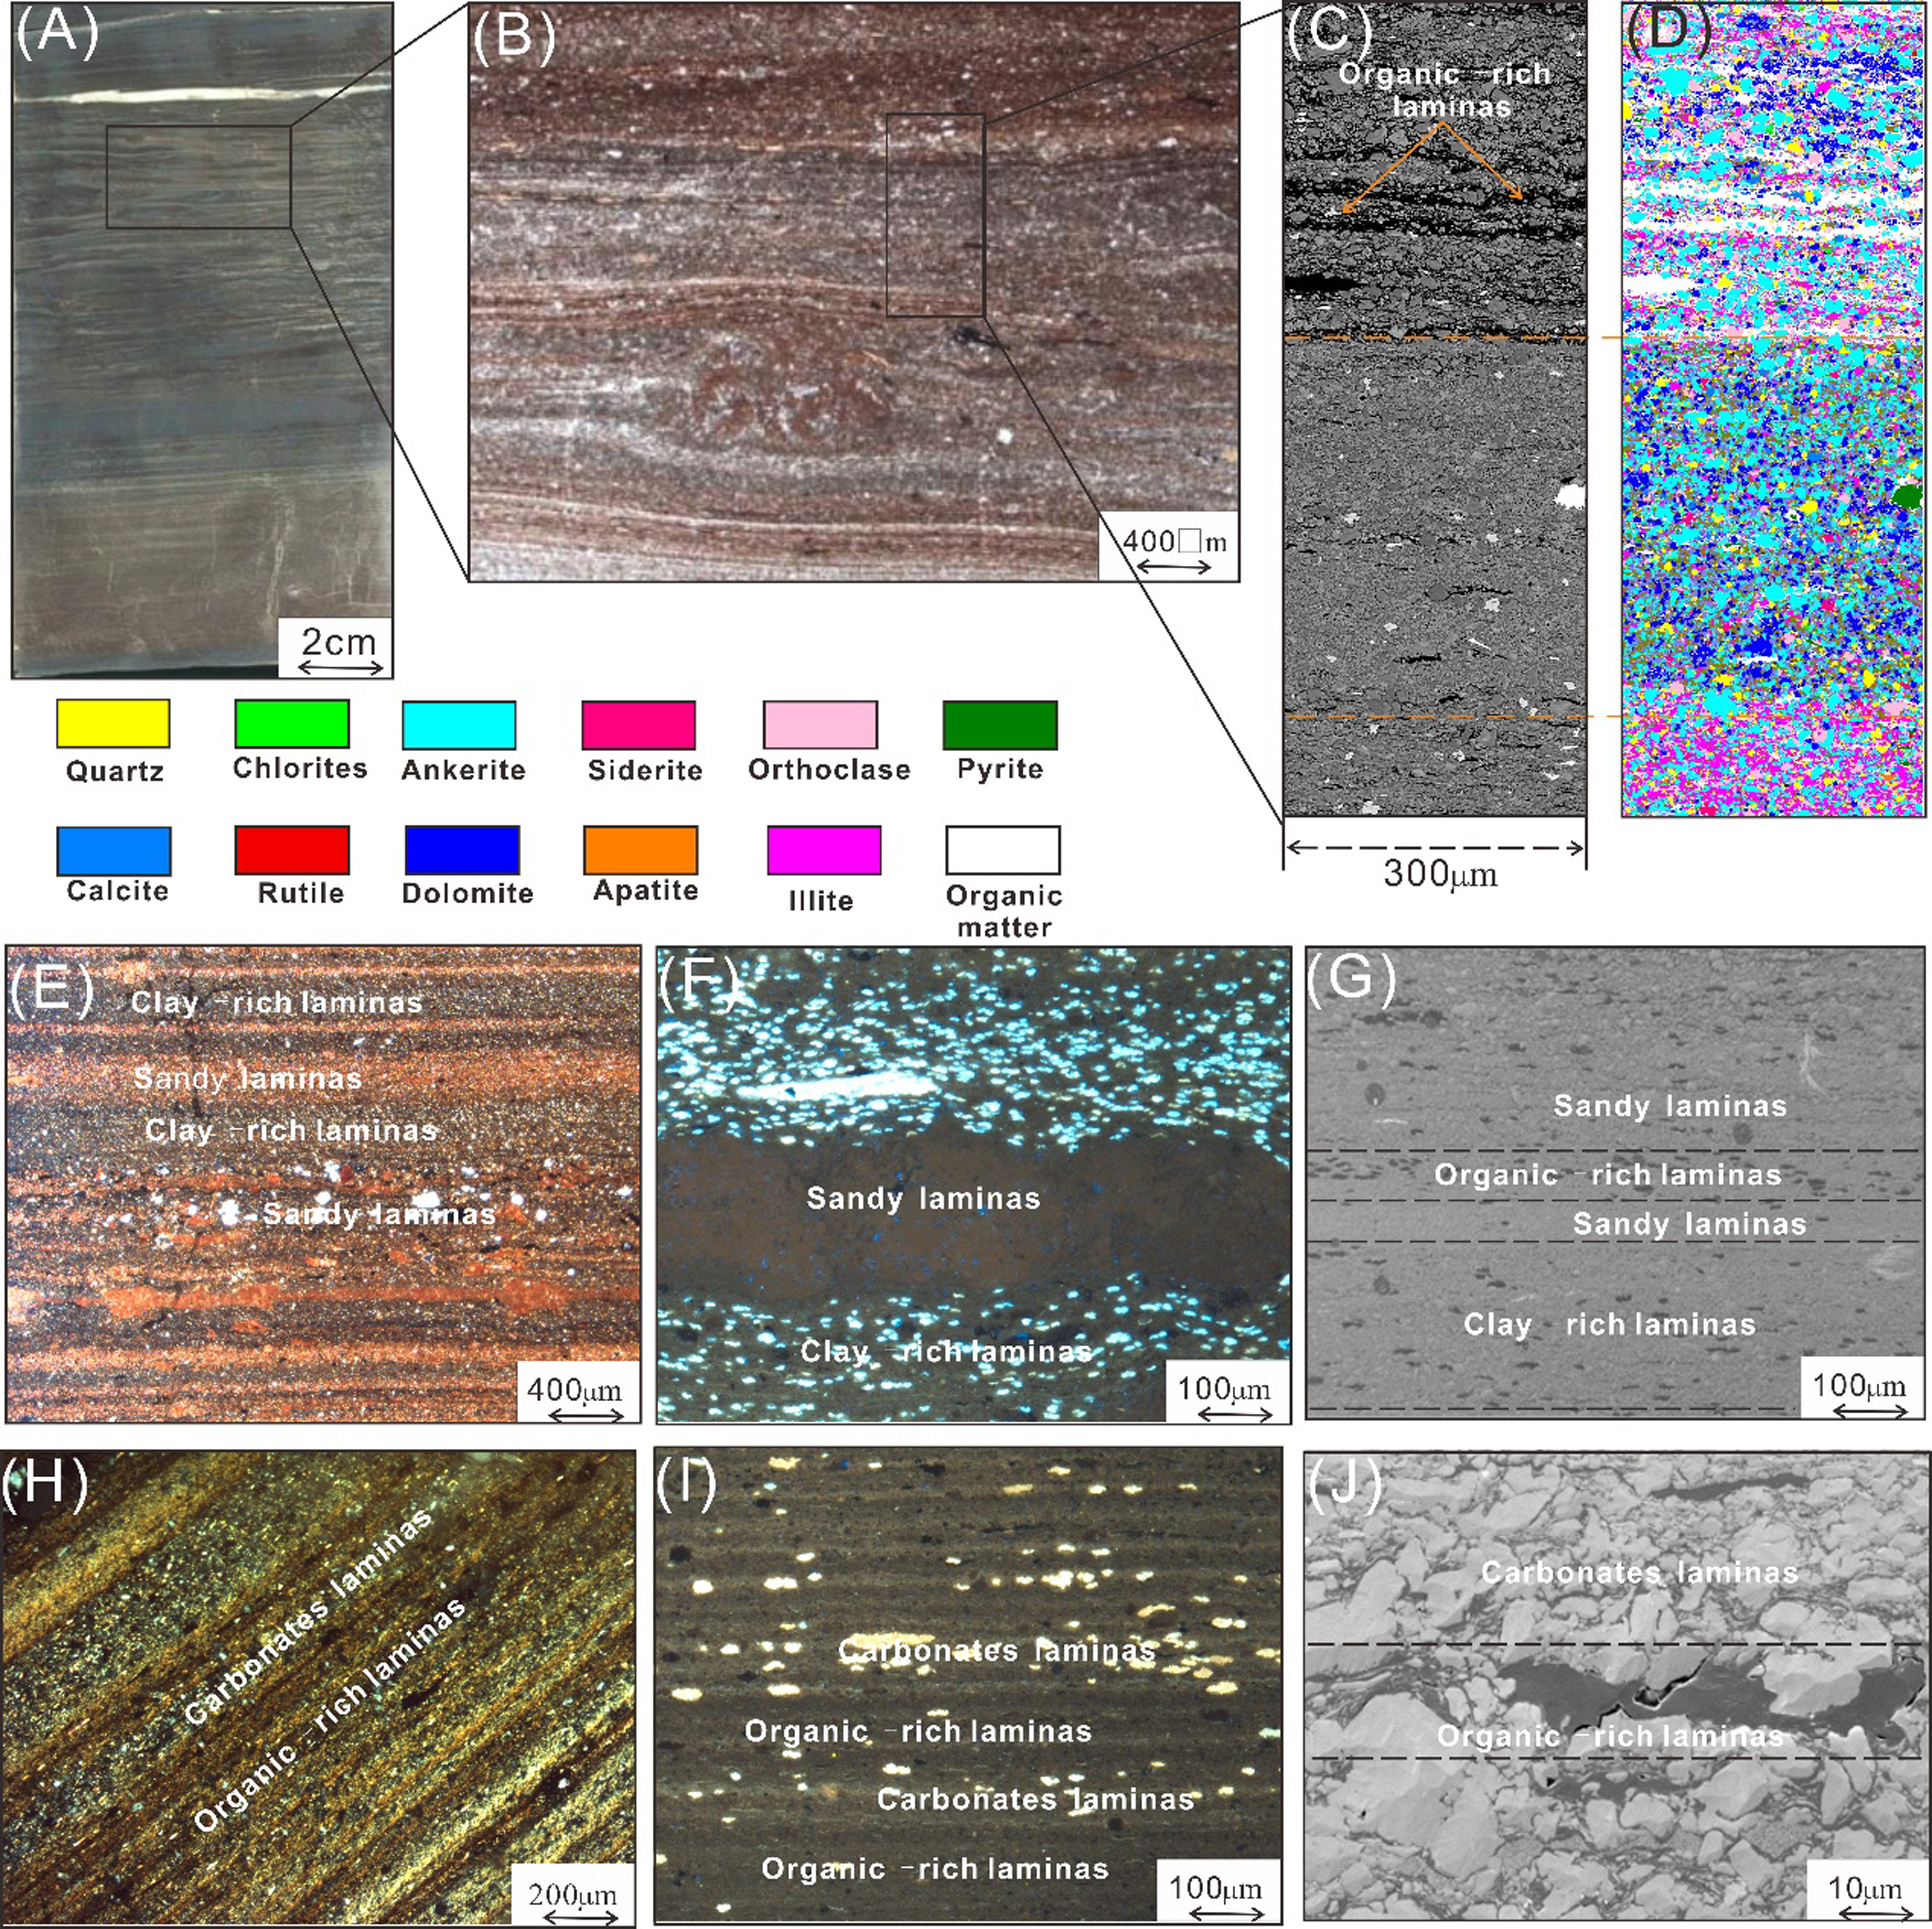
The laminae appear to be well developed based on observations from thin sections and cores (Figure 6A,B). The laminated structure exhibits abrupt variations in grain size, colour and mineral composition (Figure 6C). The laminae found in the Ek2 shales are predominantly rich in clay, organic matter, carbonate and sand (Figure 6D). In comparison to the organic-rich and clay-rich laminae, which range in thickness from 5 to 50 μm, the siliceous and carbonate laminae typically have a thickness of 10 to 500 μm. The thickness of the single sandy lamination ranges from 30 to 350 μm, according to an integrated analysis of polarizing microscope and SEM images (Figure 6E). The bright laminae are primarily made of quartz and feldspar (Figure 6F). Most of the sub-rounded, fine-grained quartz and feldspar grains range in size from 5 to 30 μm (Figure 6G). The thickness of the single carbonate lamina ranges from 30 to 500 μm (Figure 6H), which is thicker than other laminae type (Figure 6I), according to observations made under polarized microscope and SEM. The light grey carbonate laminae are primarily rhombus-shaped, with sizes ranging from 1 to 18 μm. Among the dolomite crystals are minerals such as quartz, feldspar and clay (Figure 6J).
The characteristics and types of laminae in the well E core sequence from the Bohai Bay Basin. (A) Core showing the laminae characteristics, Well E, 3116.01 m; (B) Thin sections showing the laminae characteristics, Well E, 3116.01 m; (C) SEM showing the laminae characteristics, Well E, 3116.01 m; (D) QEMSCAN showing the laminae characteristics, Well E, 3116.01 m; (E) Thin sections, Well E, 3109.86 m; (F) Fluorescent flakes, Well E, 3109.86 m; (G) SEM picture of Well E, sandy laminas and clay-rich laminas, Well E, 3116.58 m; (H) Thin sections, Well E, 3210.03 m; (I) Fluorescent flakes, Well E, 3210.03 m; and (J) SEM picture of Well E, 3122.31 m; carbonate laminas and clay-rich laminas.
4.c. Geochemical characteristics of laminae
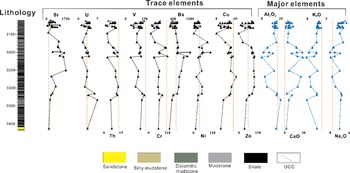
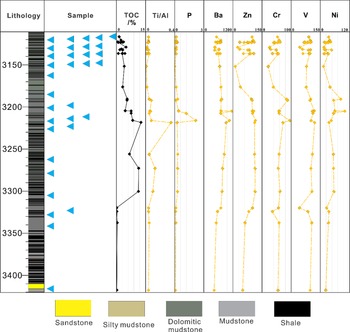
The results of the elemental analyses are given in Figure 7, with key parameters including concentration ranges, average values and standard deviations summarized as follows: the Paleogene shale laminations of the Bohai Bay Basin’s Kongdian Formation exhibit distinct major and trace element distribution characteristics. When compared to the average values of the UCC, trace element variations are notable: Sr shows significant enrichments, Ba is relatively enriched, Zn and U display both depleted and enriched patterns, while V, Cr, Cu and Th are generally depleted. For major elements, SiO₂ and Al₂O₃ dominate the laminations, with CaO content fluctuating noticeably and other elements present at relatively low levels; after UCC normalization, CaO is significantly higher than UCC norms (Hu and Gao, Reference Hu and Gao2008; Gaschnig et al. Reference Gaschnig, Rudnick, McDonough, Kaufman, Valley, Hu, Gao and Beck2016; Mazza et al. Reference Mazza, Gaschnig, Rudnick and Kleine2024), and Na₂O is relatively enriched.
Vertical variations of major and trace element concentrations of Paleogene laminae in Bohai Bay Basin (wt% for major elements, ppm for trace elements). The yellow dashed lines represent the values of the upper continental crust (UCC).
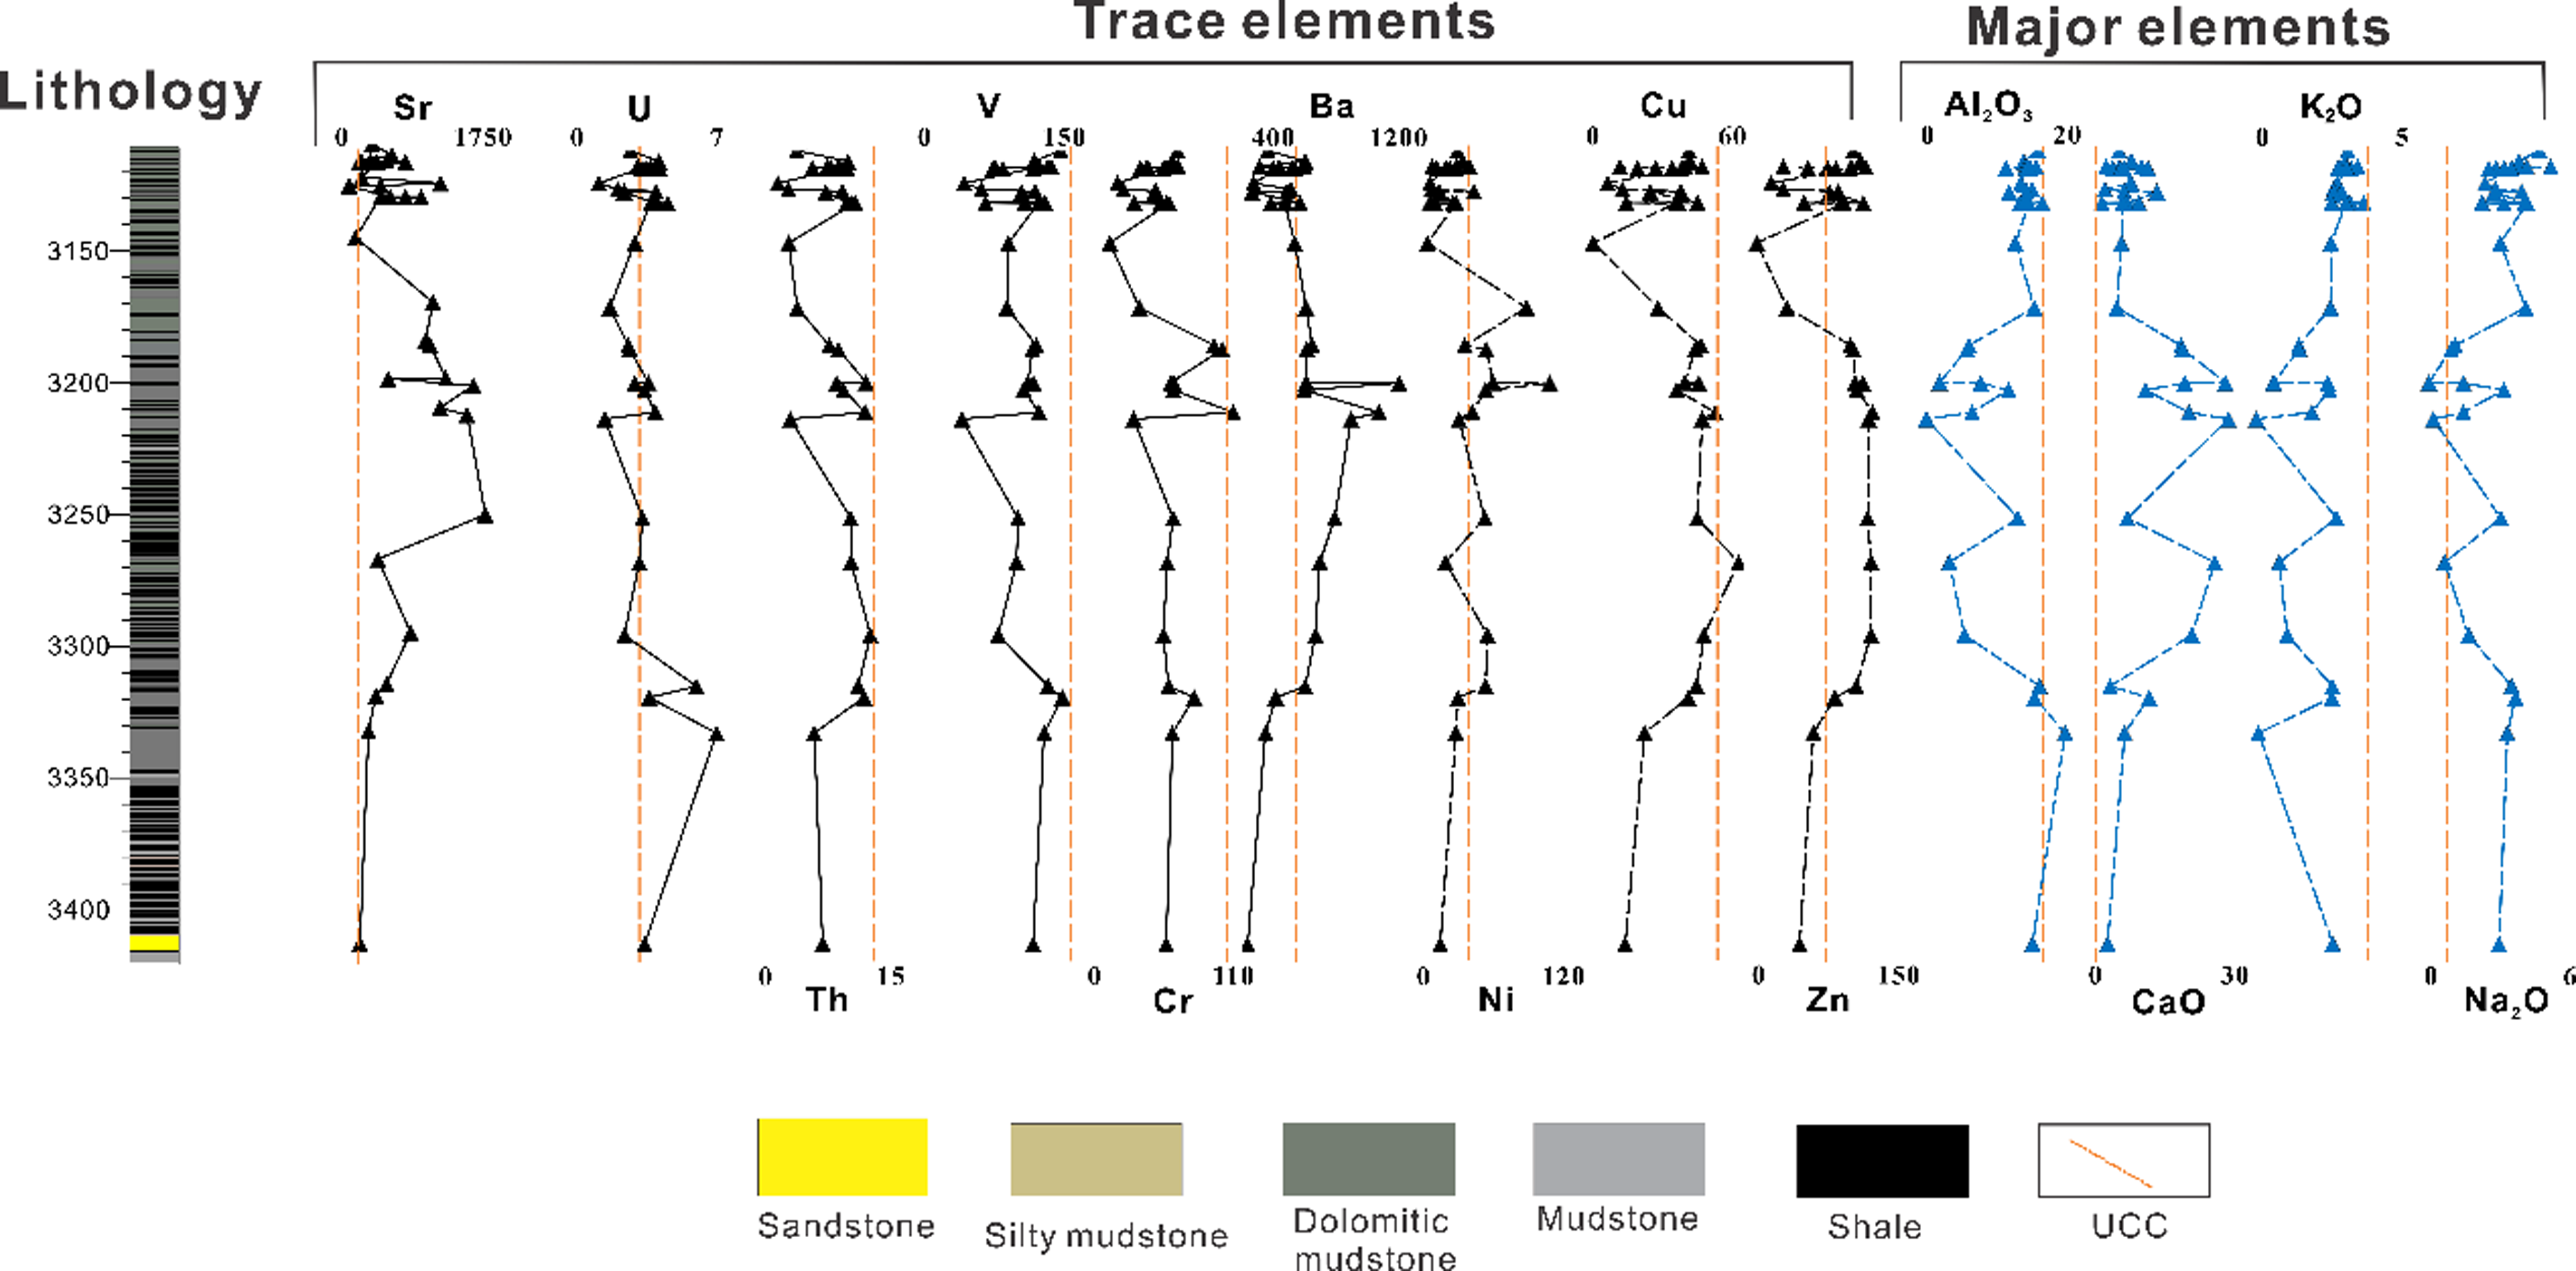
Elemental distributions also vary vertically across the formation: the lower part (3314.79–3413.46 m) is enriched in U (average 4.37 ppm) and V (average 108.61 ppm) but depleted in Th (average 8.96 ppm), Ba (average 551.51 ppm) and Cu (average 31.26 ppm); the middle part (3184.38–3295.19 m) is enriched in Cr (average 64.56 ppm), Ba (average 835.59 ppm), Cu (average 44.78 ppm) and Zn (average 106.88 ppm) yet depleted in V (average 86.72 ppm), Al₂O₃ (average 6.98%), K₂O (average 1.62%) and Na₂O (average 1.72%); the upper part (3109.86–3169.96 m) has low Th (average 7.71 ppm) and Ba (average 597.71 ppm) but the highest K₂O (average 2.90%).
TOC content of the Kongdian Formation averages 3.98%, much lower than the middle’s 8.12% (Figure 8). It ranges from 4.53% to 12.66% at 3184.38–3295.19 m, increasing from the base to the middle (peaking at 12.66%) then decreasing progressively to a top average of 2.58%. The Ti/Al ratio (a proxy for detrital, external input) (Lal et al. Reference Lal, Charles, Vacher, Goswami, Jull, McHargue and Finkel2006; Chupakov et al. Reference Chupakov, Pokrovsky, Moreva, Shirokova, Neverova, Chupakova, Kotova and Vorobyeva2020; Gäng et al. Reference Gäng, Böning, Brüchert, Lahajnar and Pahnke2023) is stable at 0.04 in the lower part, jumps to 0.05–0.35 in the middle, then drops to 0.03–0.1 in the upper part – consistent with the concentrated enrichment of trace elements (P, Ba, Zn, Cr, V, Ni) in the middle part, as reflected by higher enrichment factors here than in other intervals.
The distribution characteristics of TOC and enrichment factors in the Bohai Bay Basin.

4.d. Carbon-oxygen stable isotope analysis
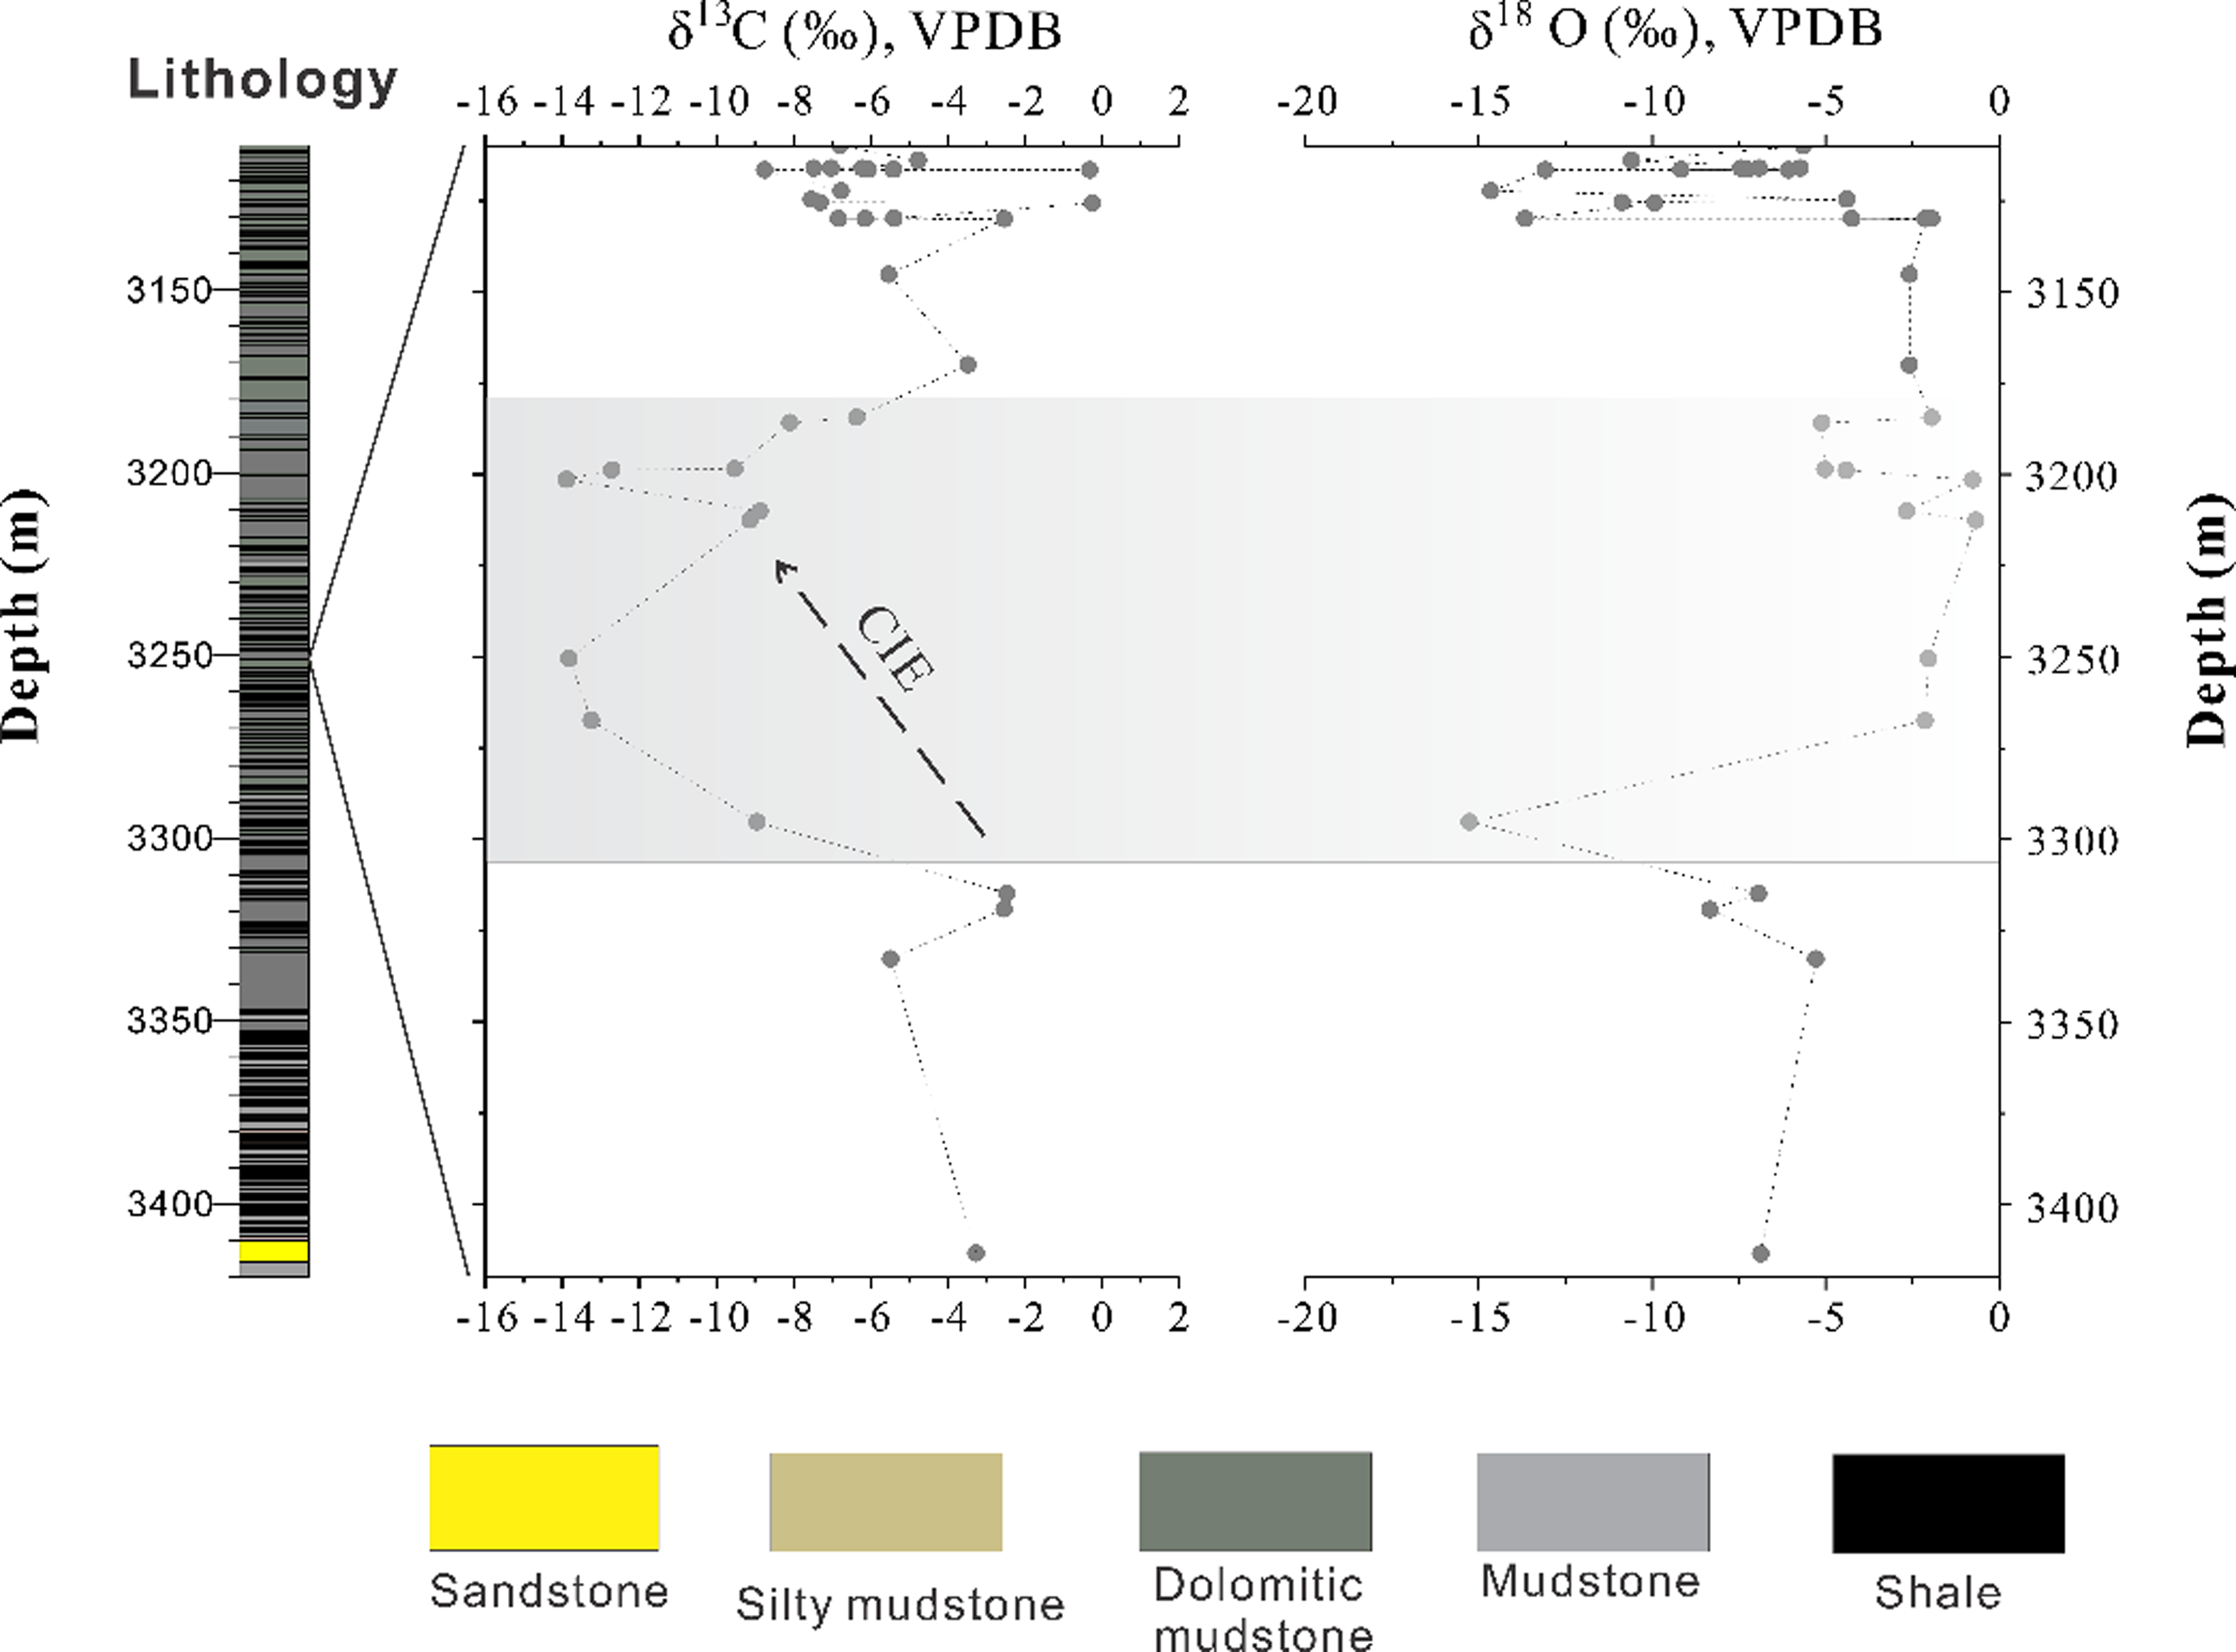
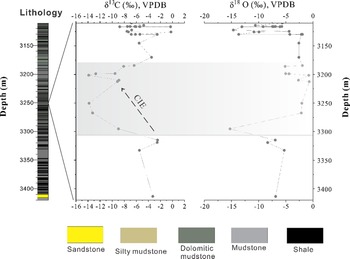
Carbon and oxygen stable isotopes in lacustrine carbonates are essential for examining changes in lake basin environments (Leng et al. Reference Leng, Jones, Frogley, Eastwood, Kendrick and Roberts2010; Butiseacă et al. Reference Butiseacă, van der Meer, Kontakiotis, Agiadi, Thivaiou, Besiou, Antonarakou, Mulch and Vasiliev2022; Isson and Rauzi, Reference Isson and Rauzi2024). The isotopes, minimally altered by diagenesis, offer insights into the evolution of these environments. The δ13C values of the Kongdian Formation bulk carbonate laminae exhibit a clear vertical trend of first decreasing then increasing from the lower to the upper part (Figure 9), with detailed parameters as follows: the lower part (3314.79–3413.46 m) has an average δ13C of −3.44%; the middle part (3184.38–3295.19 m) shows a significant negative excursion, with an average δ13C of −10.46% (representing a 7.02% lightening compared to the lower part); the upper part (3109.86–3169.96 m) undergoes a stepwise positive excursion, with δ13C ranging from −8.75% to −0.24% and an average of −5.5%. In contrast, the δ18O values of the laminae show an opposite vertical trend of first heavying then lightening. The lower part has an average δ18O of −6.86%; the middle part reaches the heaviest average value of −4.00%; the upper part lightens significantly, with δ13C ranging from −14.65% to −0.24% and an average of −5.5%. The δ18O variations of carbonates are closely linked to both paleotemperature and hydrological conditions. According to the temperature-dependent equilibrium fractionation between carbonate and lake water (Leng and Marshall, Reference Leng and Marshall2004), δ18Ocarb values increase by ∼0.36% per °C rise in temperature. Therefore, the higher δ18O values in the middle part of the Kongdian Formation may reflect either a period of relatively arid climate/reduced freshwater input, elevated paleotemperature or a combination of these factors. In contrast, the lower δ18O values in the upper part suggest a transition to more humid environmental conditions and/or moderate cooling, highlighting the complex interplay of temperature and hydrology in controlling lacustrine carbonate isotopic compositions.
Carbon and oxygen isotope records of Paleogene laminae during the PETM in Bohai Bay Basin.
4.e. Microfossil analysis
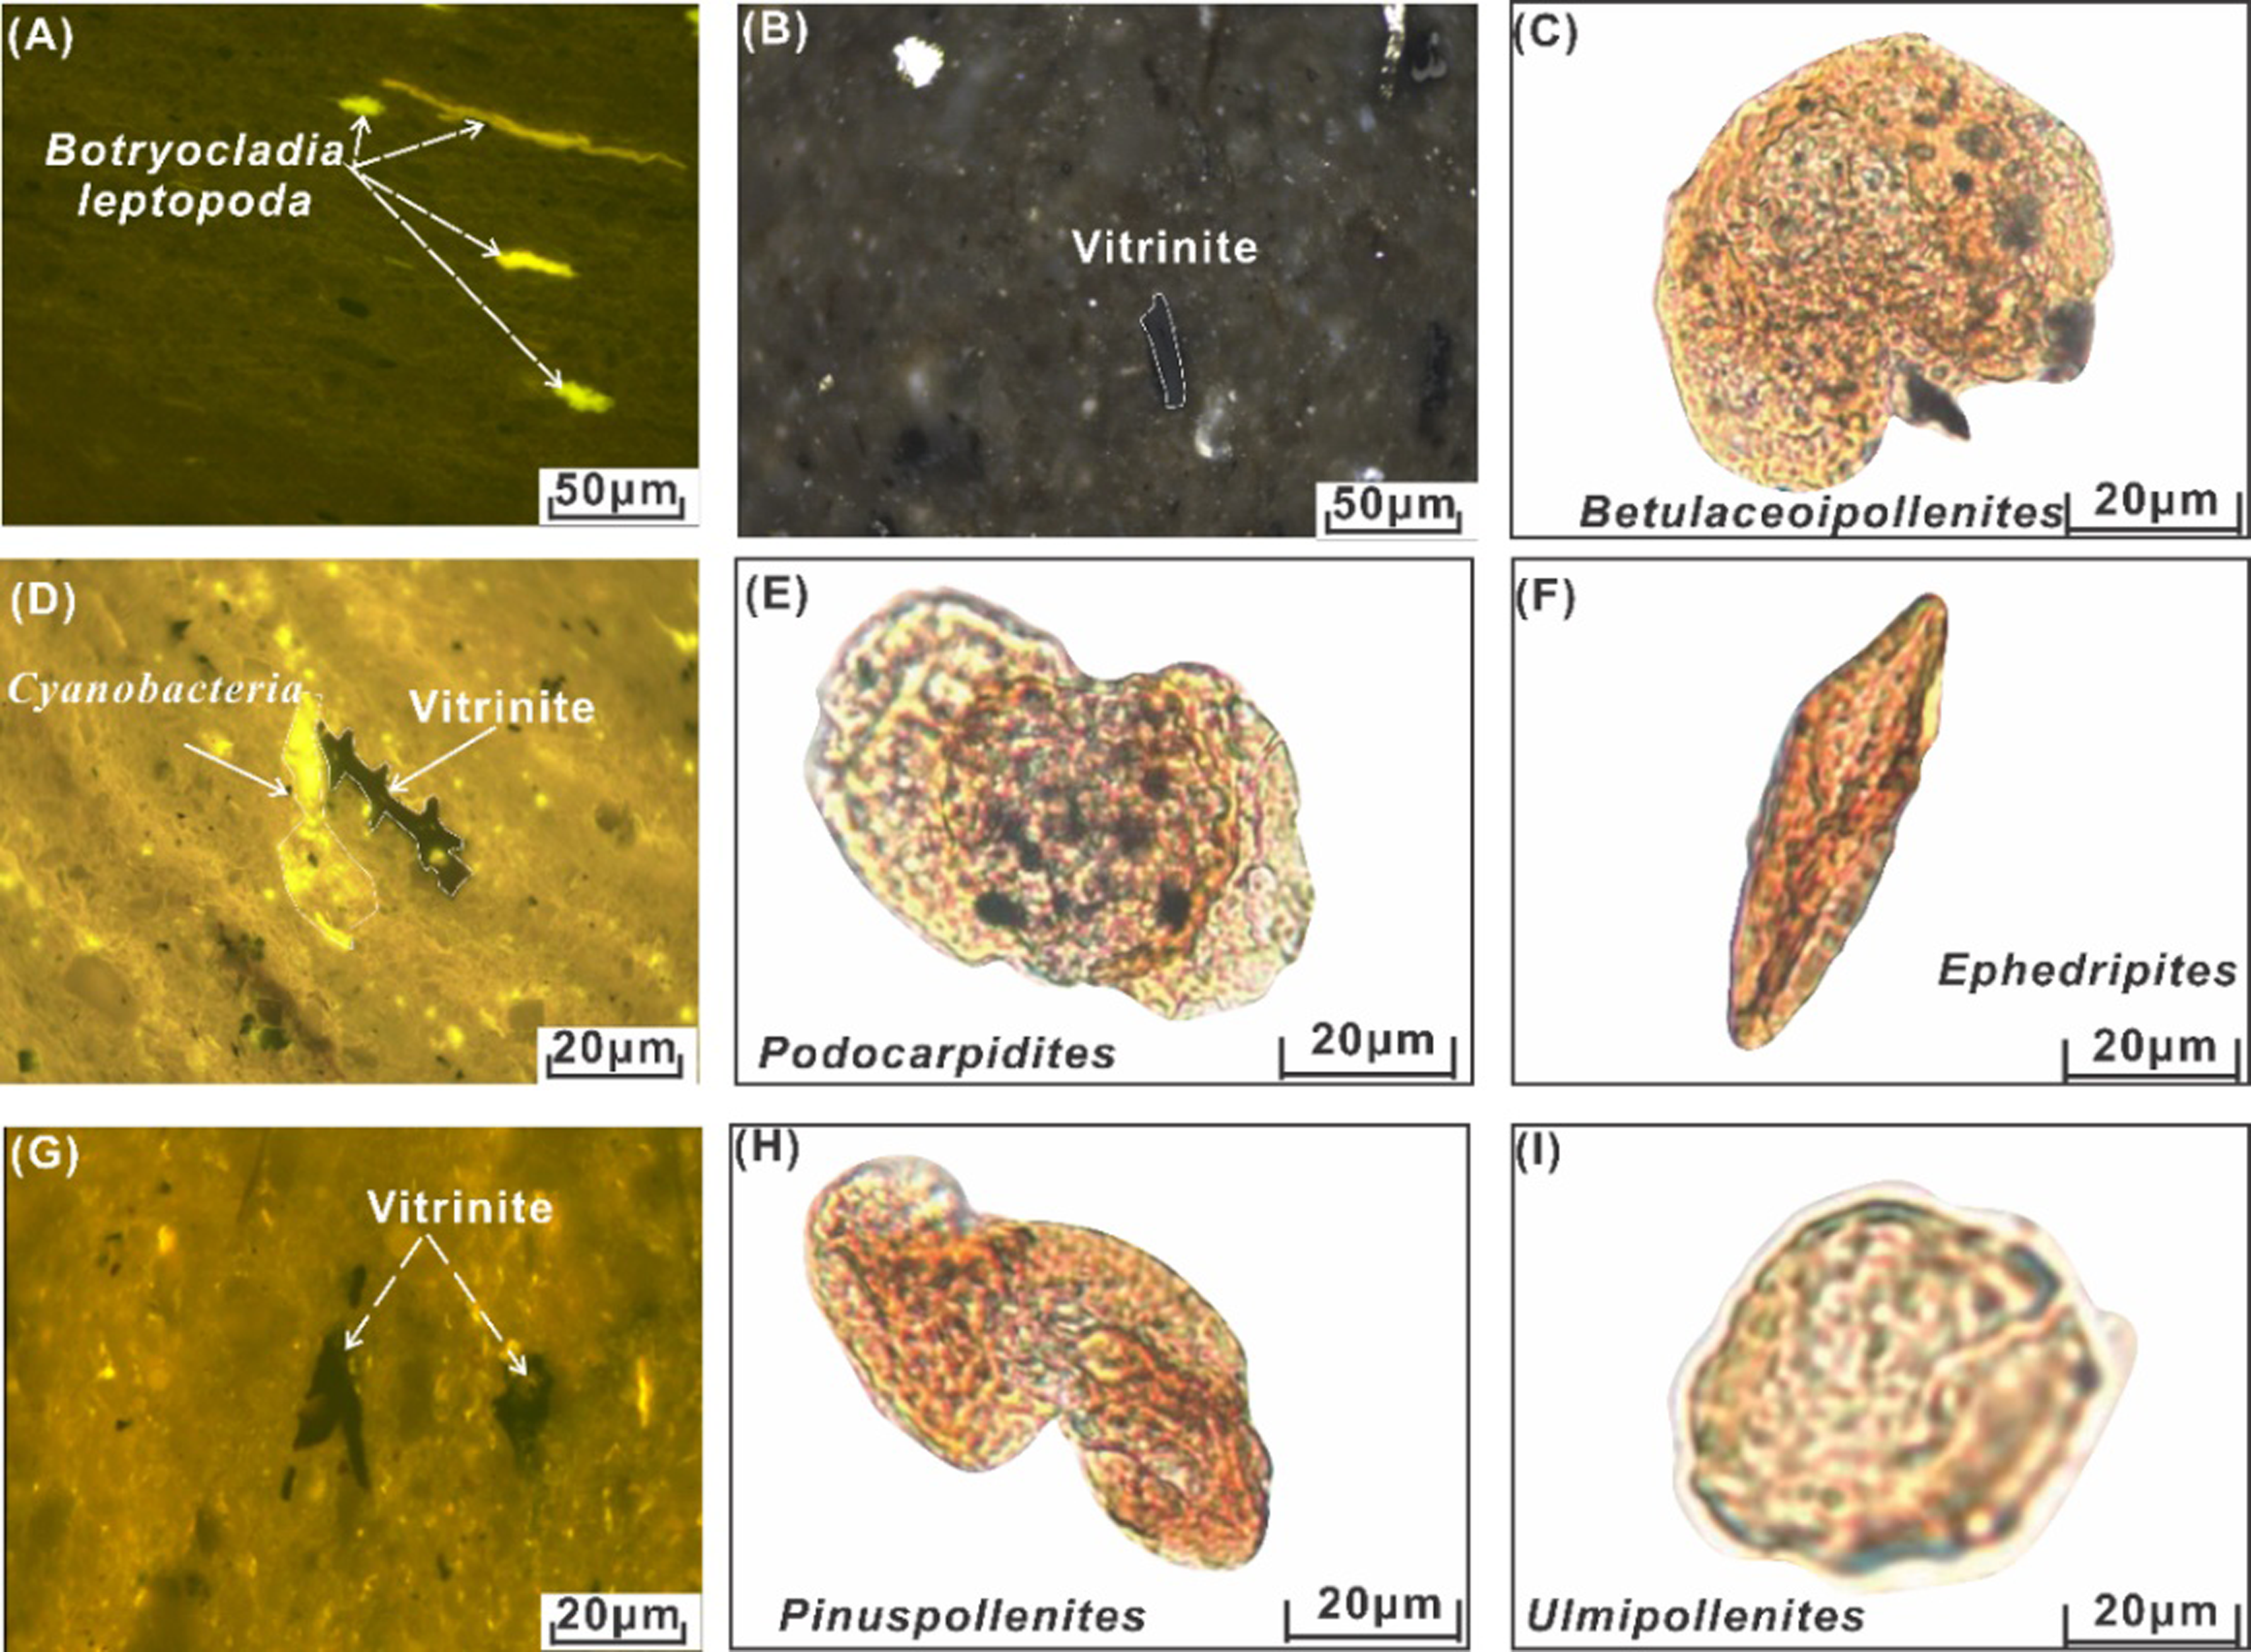
Microfossils are key to understanding hydrocarbon generation and analyzing sedimentary environments (Cohen et al. Reference Cohen, Irvine and Strauss2017; Beauger et al. Reference Beauger, Serieyssol, Legrand, Latour, Berthon, Lavrieux and Miras2022; Korsakova et al. Reference Korsakova, Kolka, Tolstobrov, Savelieva, Kosova, Petrov and Semyonova2022; Torromé et al. Reference Torromé, Aurell, Martín-Pérez and Košir2023; Wang et al. Reference Wang, Wu, Yang and Fang2023 a). Microfossil analysis involved microscopic identification of algal fragments, species, abundances and spores. In the Bohai Bay Basin’s Paleogene shale laminations, diverse microfossils (e.g., desmids, acritarchs, cyanobacteria, Ephedripites, Podocarpidites, Ephedra spores and elm pollen) were observed (Figure 10), with Pinuspollenites and Ulmipollenites dominating the lower Kongdian Formation. The middle part is characterized by cyanobacteria, acritarchs, Ephedripites spores, Ephedra spores and elm pollen, indicating the arid conditions (Xin et al. Reference Xin, Hao, Han, Xu, Zhang and Tian2021; Wang et al. Reference Wang, Zhu, Lai, Lin, Wang, Du, Huang and Zhu2024). The upper part is characterized by Botryocladia, Leptopoda and Betulaceoipollenites.
Micropaleontological microfacies and ecostratigraphic palynology of Paleogene laminae in the Bohai Bay Basin.
5. Discussion
5.a. Carbon and oxygen isotopes of laminae generation of the PETM
The PETM CIE is a widely recognized marker of global warming events, triggered by excessive carbon in the ocean-atmosphere system due to volcanic outgassing in the North Atlantic Igneous Province (Stap et al. Reference Stap, Lourens, Thomas, Sluijs, Bohaty and Zachos2010; Sreenivasan et al. Reference Sreenivasan, Samanta, BouDagher-Fadel, Mukherjee, Vadlamani and Bera2022; Mbabi Bitchong et al. Reference Mbabi Bitchong, Adatte, Ngos, Keller, Karabeyoğlu and Spangenberg2023; Zhang et al. Reference Zhang, Ding, Chen, Brennecka, Sun, Ma, Gao, Zhang and Willems2023). The extent of CIE varies based on several factors such as paleolatitude and the integrity of the sedimentary record. Previous studies show that terrestrial carbonates exhibit a negative shift in δ13C of 5.99%, whereas marine carbonates show a shift of 2% to 4% (McInerney and Wing, Reference McInerney and Wing2011). Carbon and oxygen stable isotope curves were analyzed and compared with records from 11 Paleocene-Eocene boundary sections. The results show a notable −11.43% (3314.79–3201.44 m) negative shift in carbon stable isotope δ13C values for the study interval, presenting a larger shift than typical global changes.
Concurrently, the oxygen isotope δ18O does not show a synchronous positive shift during the recovery phase. The δ13C trend shows an initial rapid negative shift consistent with other documented records of the PETM followed by a gradual positive recovery, whereas δ18O shows a negative shift followed by a positive shift of about 10%. This pattern confirms a complete PETM event is well preserved in the central Bohai Bay Basin (Figure 9). This integrated record, combined with supporting evidence (e.g., algal fossil abundance in Figure 10), indicates the CIE-related negative δ13C shift is not driven by low productivity. Instead, the pronounced negative δ13C shift and positive δ18O offset primarily reflect elevated global CO₂ concentrations and consequent extreme warming during the PETM. The modest negative excursion of carbonate δ18O values at the initial stage of the PETM reflects an additional regional hydrological signal driven by intensified rainfall during the CIE period. This isotopic response arises because extreme global warming during the Paleocene-Eocene Thermal Maximum drastically accelerated the hydrological cycle, promoting the input of isotopically light meteoric water into the lacustrine system. The influx of low-δ18O meteoric water diluted the isotopic composition of original lake water, which was subsequently inherited by authigenic carbonates and thus induced the observed negative δ18O shift (Carmichael et al. Reference Carmichael, Inglis, Badger, Naafs, Behrooz, Remmelzwaal, Monteiro, Rohrssen, Farnsworth, Buss, Dickson, Valdes, Lunt and Pancost2017, Reference Carmichael, Pancost and Lunt2018; Pang et al. Reference Pang, Li, Li, Wang, Hui, Liu, Liu, Hu, Xu, Jiang, Pang and Wang2023). This rainfall-enhanced riverine input of low-δ18O meteoric water partially offset the evaporation-induced δ18O enrichment of lake water; simultaneously, intensified fluvial erosion and runoff delivered large quantities of 13C-depleted terrestrial organic matter (dominated by C3 plants with δ13C values of −20% to −35%) from the catchment to the lake system. This increased terrestrial organic matter input amplified the negative δ13C shift through two key processes: (1) the oxidative decomposition of 13C-depleted organic matter in the lake released large amounts of 13C-depleted CO₂ into the lake water, which mixed with the dissolved inorganic carbon (DIC) pool and significantly lowered the δ13C value of authigenic carbonate (δ13C_carb); (2) the direct input of 13C-depleted terrestrial organic carbon further exacerbated the negative excursion of sedimentary total organic carbon δ13C (δ13C_TOC). Combined with the local hydrological modulation of the oxygen isotope signal, these processes generated carbonate and organic carbon isotopic signals that far exceed the magnitude of the global background CIE (≤4%) for the Paleocene-Eocene Thermal Maximum (PETM) (Teng et al. Reference Teng, Wang and Zhang2025).
5.b. Sedimentary environment of laminae formation over the PETM
Reconstructing ancient sedimentary environments and processes using trace element content as indicators has proven to be highly effective, with substantial advancements made in this field (Bellón et al. Reference Bellón, Mosser, Roquin and Pardo1994; Dong et al. Reference Dong, Zhu, Li, Kendall, Wang and Gao2016; Pozo et al. Reference Pozo, Carretero and Galán2016; Carmichael et al. Reference Carmichael, Pancost and Lunt2018; Gibson et al. Reference Gibson, Kunzmann, Poirier, Schumann, Tosca and Halverson2020). Significant progress includes improvements in analyses of sedimentary environments concerning ancient productivity, water oxidation status, water salinity and paleoclimate.
Essential nutrients for biological growth and reproduction include major elements such as C, N and P, along with trace micronutrients like Cu, Ni and Zn. Ba often co-precipitates with organic matter during sedimentation, primarily depositing as barium sulphate in aquatic environments, which is closely linked to terrestrial material input. Higher inputs of terrestrial materials typically result in increased barium sulphate content, often signalling enhanced ancient productivity. During the PETM period, the Ni+Cu+Zn content in shale laminations ranged from 180.36 to 251.87, averaging 205.42. Ba content varied from 448.61 to 923.07, with an average of 643.34. Together with high TOC levels, these measurements indicate significant productivity during the PETM period (Figure 11).
Paleoenvironmental parameters of Paleogene laminae during the PETM in Bohai Bay Basin.
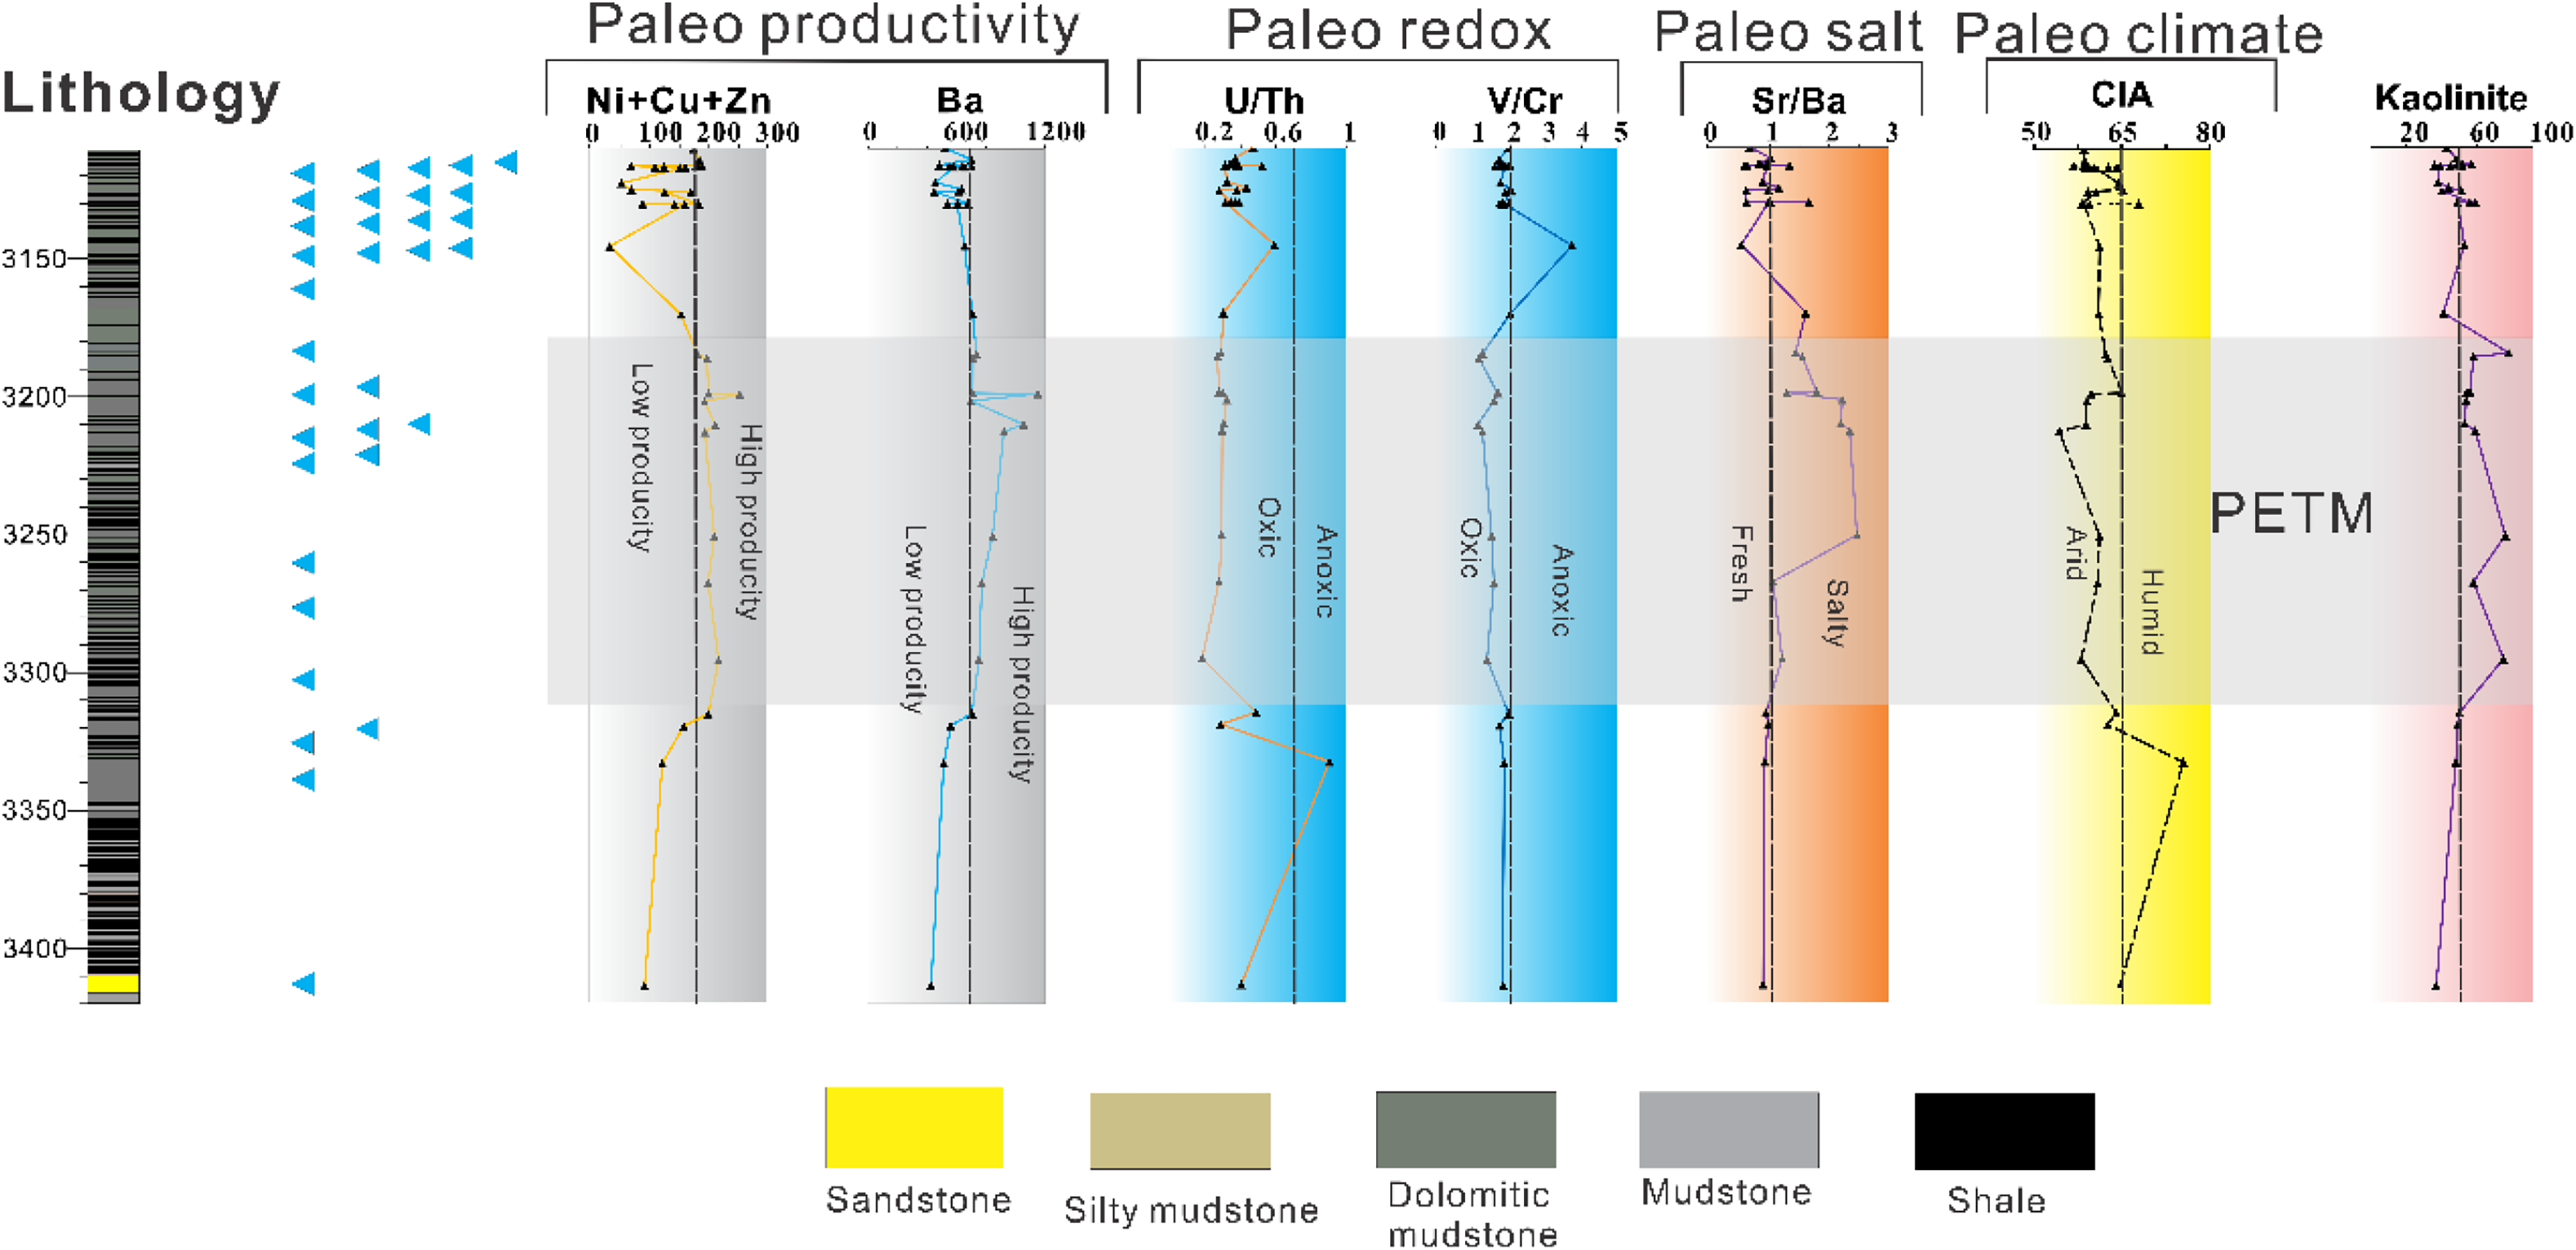
The accumulation and dispersion of elements in water basins, influenced by mechanical separation, chemical separation and biogeochemical processes during sedimentation, are related to lake bathymetry. In this study, the ratios of U/Th and V/Cr were used to indicate oxidation states, with higher values for V/Cr suggesting reducing conditions. During the PETM period, the U/Th and V/Cr ratios in the shale laminations of the study area ranged from 0.19 to 0.32 and 1.08 to 1.65, respectively, with averages of 0.28 and 1.37. These values indicate a predominantly oxidizing environment within the laminations during the PETM (Figure 11) (Jones and Manning, Reference Jones and Manning1994).
Paleosalinity plays a crucial role in reconstructing past environmental conditions. Strontium (Sr) is more mobile in water and has higher solubility in its sulphate compounds compared to barium (Ba). As salinity gradually increases, Ba precipitates first, while Sr remains in solution until Sr/Ba>1. Consequently, the Sr/Ba ratio in sediments positively correlates with paleosalinity, with ratios of Sr/Ba around 1.0 indicating fresh water and ratios greater than 1.0 indicating saline water (Wei and Thomas, Reference Wei and Thomas2020). During the PETM period in the study area, Sr/Ba ratios in shale laminations ranged from 1.05 to 2.35, averaging 1.75, suggesting a saline water environment. In comparison, Sr/Ba ratios in the shale laminations before and after the PETM ranged from 0.51 to 1.65, with an average of 0.92, indicating lower salinity levels before and after the PETM period.
Paleoclimate significantly influences the intensity of physical and chemical weathering processes, impacting the maturity of fine-grained sediments. In this study, the Chemical Index of Alteration (CIA) was employed to evaluate paleoclimate conditions, with higher CIA values indicating a wetter paleoclimate. CIA values in the shale laminations ranged from 54.34 to 64.99, with an average of 60.22 during the PETM. These values classify the environment as ‘arid’, indicating that the lake basin experienced a dry climate with less intense chemical weathering processes during the PETM period.
The CIA analysis shows that the paleoclimate during the PETM period was arid, but it is also worth noting that the kaolinite content during the PETM period (62.1%) was higher than that in the pre-PETM (46.0%) and post-PETM (47.9%) stages. The increase of kaolinite may be due to increased physical weathering and erosion (John et al. Reference John, Banerjee, Longstaffe, Sica, Law and Zachos2012).
Multiple lines of sedimentological and geochemical evidence indicate an increase in average annual rainfall, establishing a warm and humid regional climatic background during the PETM. These include: (1) a marked increase in terrigenous clastic input and grain size, reflecting enhanced fluvial transport and erosion under intensified precipitation; (2) palynological assemblages dominated by hygrophytic plant taxa, consistent with a persistently wetter climate. Within this humid background, the enhanced accumulation of organic matter is specifically attributed to episodic, catastrophic precipitation events that delivered large volumes of terrestrial organic material to the basin via rapid runoff and flood events. Driven by global warming during the PETM, the intensified global water cycle has accelerated the transport of water vapour from low to high latitudes, shaping the study area’s distinctive climatic features: long-term high temperature and an arid overall background, coupled with significantly increased seasonal rainfall. This conclusion is supported by multiple proxies: the pronounced δ18O positive shift in the late PETM interval (Figure 9) confirms sustained climatic warming; Ephedripites-dominated pollen assemblages (35–42%) indicate arid conditions; and 1–5 mm seasonal cyclicity in laminated shales reflects enhanced seasonal precipitation, which further amplifies riverine organic matter input.
During the PETM period, the shale laminations exhibited high paleoproductivity, which is primarily attributed to the flattened mid-to-high latitude temperature gradient driven by extreme warming. This reduced gradient – resulting from amplified high-latitude warming – weakened the cold climatic barrier that previously restricted thermophilic vegetation. Consequently, vegetation (e.g., Ephedra and Ulmus) expanded toward higher latitudes, with pollen records confirming the northward spread of mid-latitude taxa (e.g., Pinuspollenites) to the study area. This vegetation expansion, coupled with weakened zonal winds facilitating pollen and seed dispersal, increased terrestrial organic matter input, ultimately enhancing the organic matter levels preserved in the shale laminations (Zachos et al. Reference Zachos, Dickens and Zeebe2008; Korasidis, Reference Korasidis, Wing, Shields and Kiehl2022). This provided favourable conditions for biological growth and development. However, as temperatures continued to rise in the later stages of the PETM, the decrease in organic matter content reflected the impact of high-temperature events leading to lake acidification and salinization. These conditions hindered biological growth, resulting in relatively lower overall productivity. In the transition to the later stages of the PETM, the lake biome gradually recovered as increased rainfall led to the freshening of the lake water, transporting nutrients (such as N, P and Fe) to the lake.
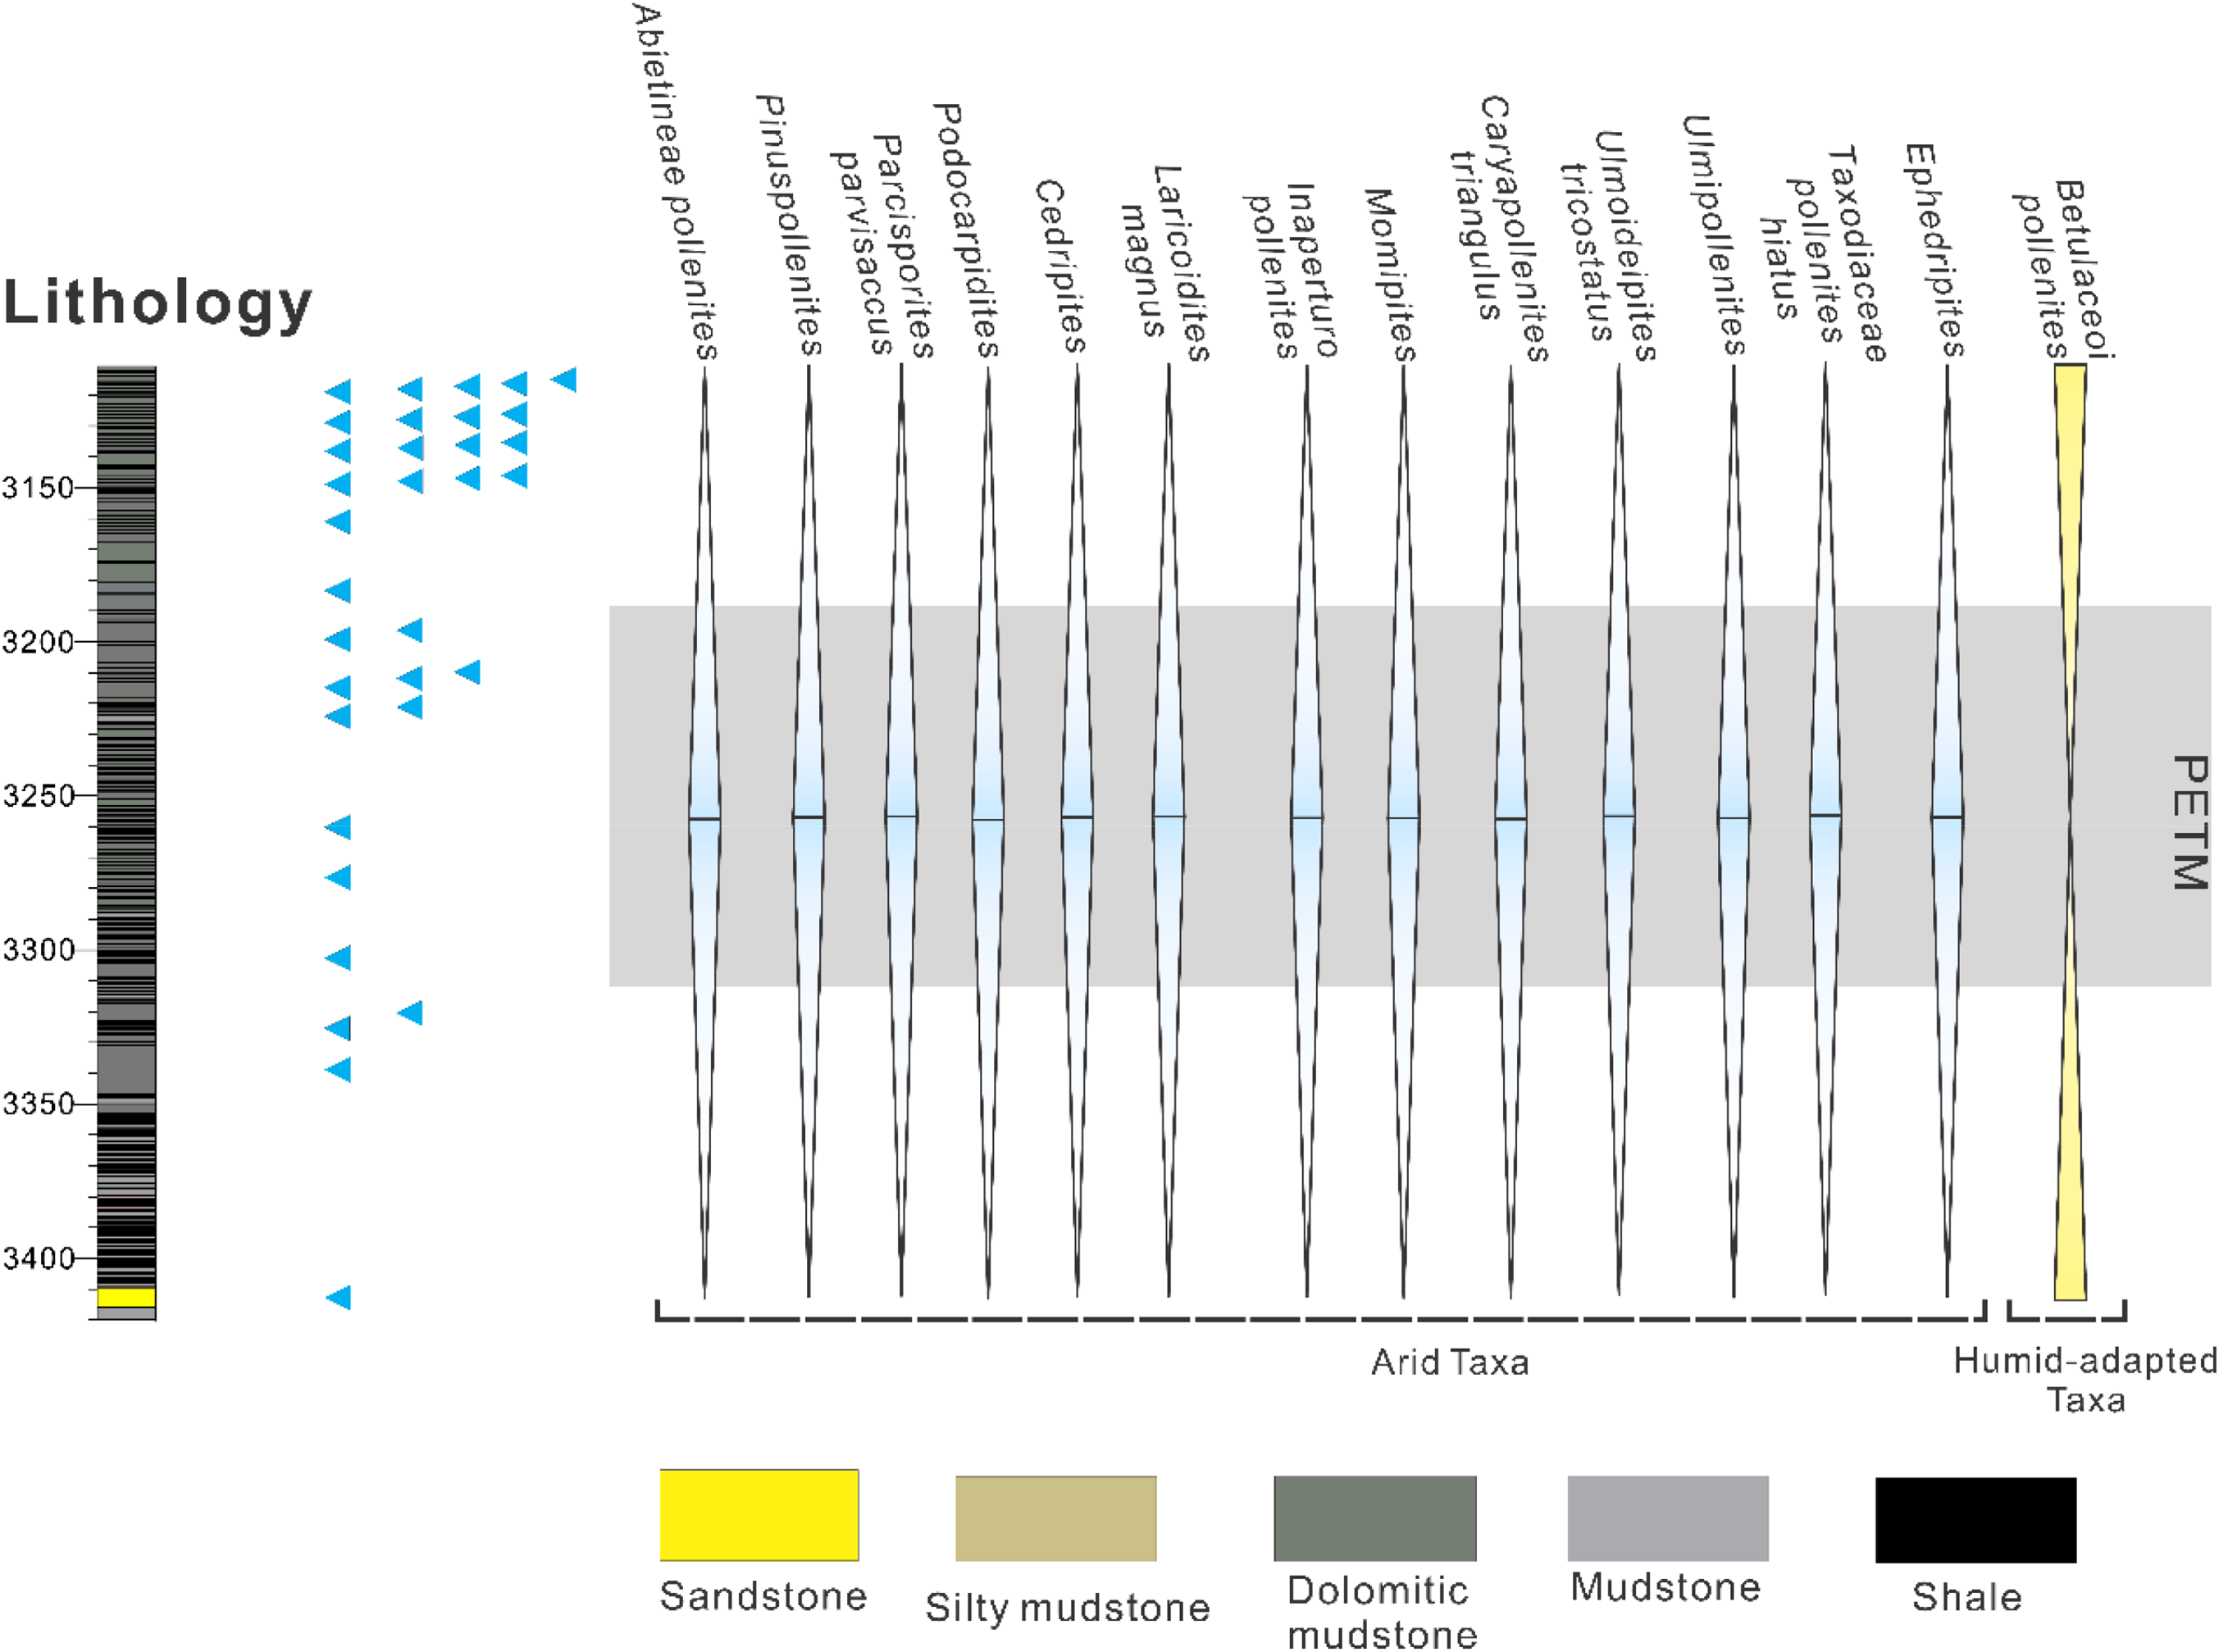
Pollen analysis indicates the presence of arid-adapted species such as Podocarpidites sp. and Ephedripites sp. in the Paleocene-Eocene of the Bohai Bay Basin during the PETM period (Figure 12). Conversely, other intervals are dominated by pollen series of wetland plants like Betulaceoipollenites sp., with occurrences of drought-resistant plant pollen segments, indicating a prevalence of drought-resistant plants during the period of extreme hot climate.
Ecostratigraphic palynological spectra of Paleogene laminae during the PETM in Bohai Bay Basin.
5.c. Environmental reconstruction during the PETM
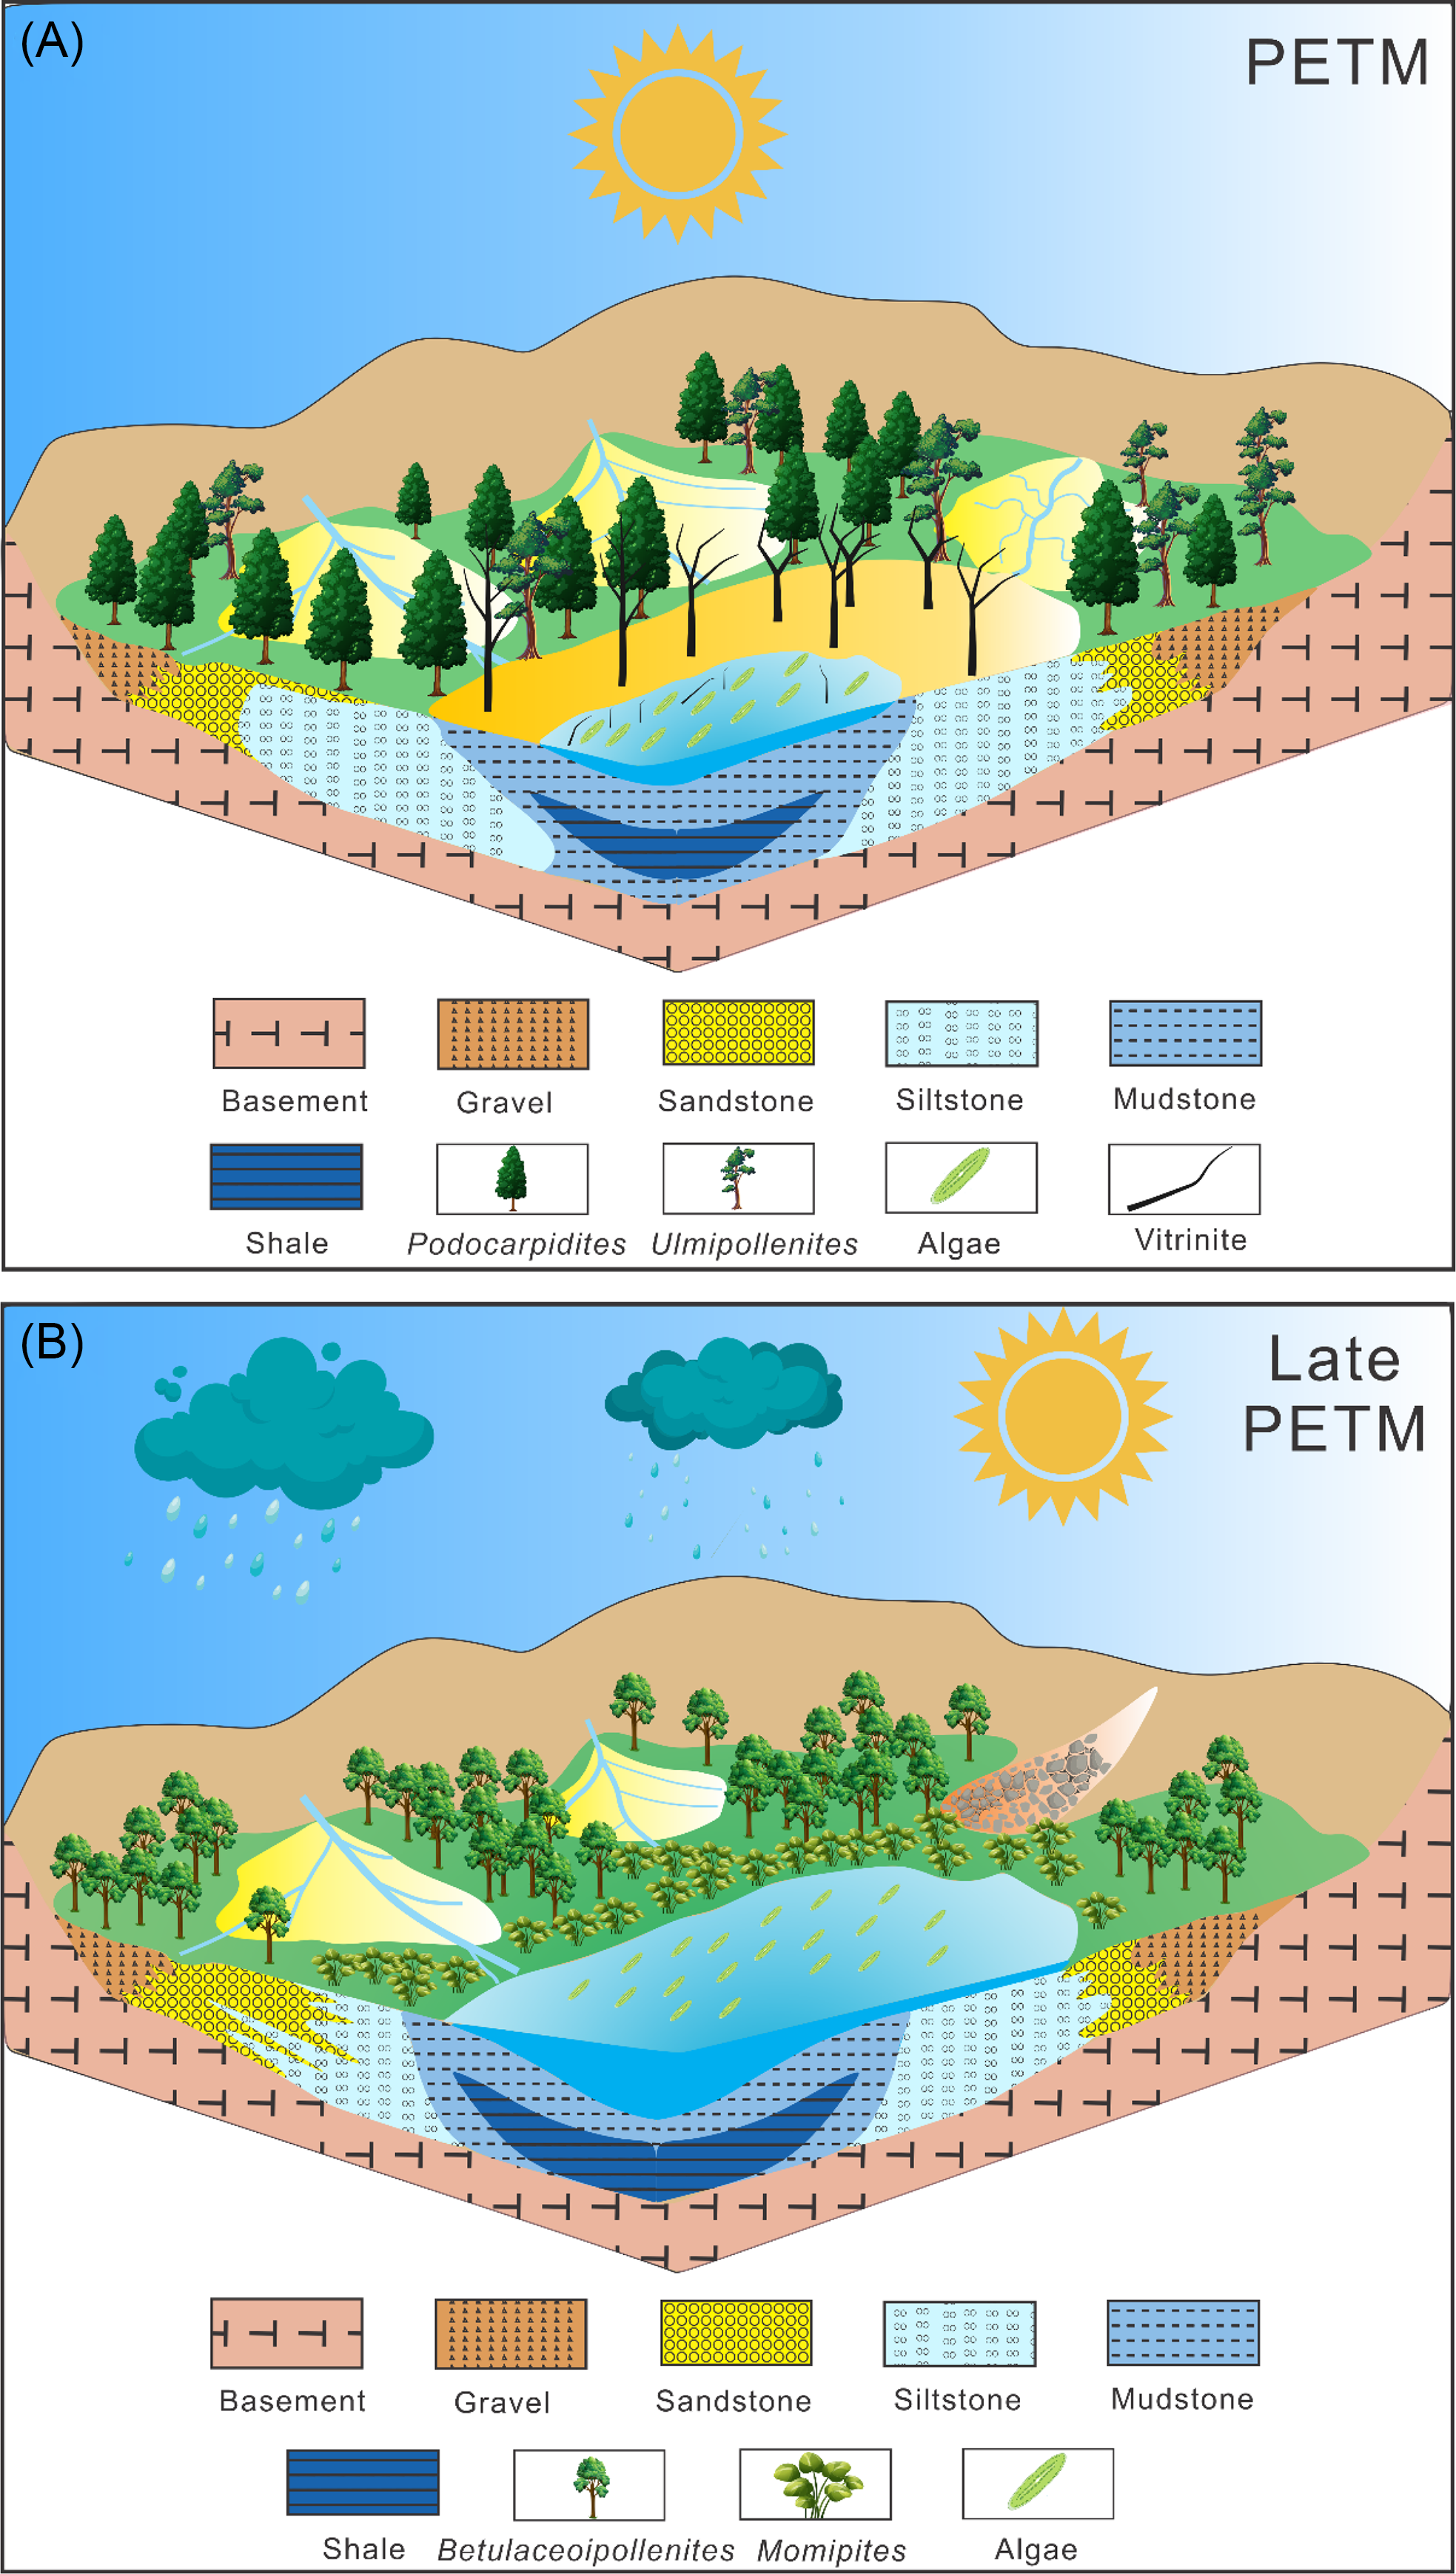
The PETM period altered various characteristics of this ancient lake. Evidence shows that increased temperatures during the PETM led to arid conditions, resulting in higher evaporation rates and significant calcite sedimentation in the lakes. This is corroborated by the strong negative CIE that defines the PETM interval. Following a minor negative δ18O excursion at the PETM onset, carbonate δ18O values exhibit a persistent positive shift throughout the middle and late PETM. This prominent positive δ18O shift primarily records evaporative enrichment of lake water under an intensified seasonal hydrological cycle (Talbot and Truls, Reference Talbot and Truls1992). Specifically, under conditions of increased episodic rainfall, the lake system experiences pronounced alternations between arid seasons – where limited water input leads to elevated evaporation and thus high δ18O values of lake carbonates – and humid (wet) seasons with pulsed runoff. The superimposed high-amplitude variations in δ18O across the CIE therefore indicate a marked increase in the intensity and seasonality of regional precipitation, rather than a simple shift in mean annual rainfall. Based on the analyses and observations above, a model of paleoenvironmental evolution for terrestrial lakes during the PETM period is proposed.
The weather and climate effects during the PETM were complex. Elevated temperatures caused increased evaporation and salinity during dry seasons, as supported by chemical and fossil evidence, which points to overall increased aridity. Simultaneously, there is evidence of seasonal elevated precipitation, possibly due to intense monsoonal rainfall patterns or the northward movement of the tropical convergence zone. As such, pollen evidence from the Bohai Bay Basin boundary indicates both significant precipitation and increased aridity during the PETM, evidencing more extreme shifts between seasons.
This model supports two main themes developing in climate research (Figure 13A). First, the PETM period exhibited more pronounced seasonal variance, reflecting climatic extremes. The weather and climate effects during the PETM were complex. Located at 34–36°N paleolatitude – derived from regional paleomagnetic and tectonic reconstruction data – the study area experienced elevated temperatures that caused increased evaporation and salinity during dry seasons. Simultaneously, seasonal elevated precipitation is evidenced by the cyclicity of laminated shales and the marked increase in hygrophytic pollen taxa. Laminated shale cyclicity reflects lacustrine sedimentary rhythmicity driven by seasonal wet-dry hydrological fluctuations, while hygrophytic pollen acts as a seasonal proxy: these pollen producers are ecologically restricted to high-moisture habitats, and their enhanced abundance directly indicates the expansion of wet catchment/lake margin environments in response to intensified seasonal rainfall and runoff. The two proxies together validate the signal of seasonal elevated precipitation. Although extreme PETM warming diminished the traditional continent-ocean thermal contrast, intensified monsoonal circulation was still triggered by two interconnected greenhouse feedbacks: first, extreme warming drastically enhanced ocean evaporation and atmospheric moisture loading; second, the Intertropical Convergence Zone (ITCZ) shifted northward by ∼5° (Arbuszewski et al. Reference Arbuszewski, deMenocal, Cléroux, Bradtmiller and Mix2013; Deininger et al. Reference Deininger, McDermott, Cruz, Bernal, Mudelsee, Vonhof, Millo, Spötl, Treble, Pickering and Scholz2020), extending its precipitation belt to the mid-latitude study area. Asymmetric continental-oceanic thermal forcing under the extreme greenhouse state overrode the weakened zonal heat contrast, ultimately amplifying seasonal monsoonal rainfall. Simultaneously, seasonally elevated precipitation is evidenced by laminated shale cyclicity and increased hygrophytic pollen. Consistently, pollen records from the Bohai Bay Basin boundary document both enhanced seasonal precipitation and persistent aridity during the PETM, emphasizing the complex interplay of global warming-driven climatic conditions.
Paleocene-Eocene paleoenvironment reconstruction map of the Bohai Bay Basin.
During the PETM, the increased kaolinite content does not represent in-situ pedogenesis under warm-humid conditions; instead, it is of detrital origin (Schmitz et al. 2003; John et al. Reference John, Banerjee, Longstaffe, Sica, Law and Zachos2012). Notably, the study area was characterized by an overall arid climate during the PETM as recorded by multiple paleoclimate proxies, and the detrital kaolinite enrichment was not driven by persistent humid conditions but by seasonally enhanced precipitation and episodic heavy rainfall events. Such short-term, intense precipitation events intensified physical erosion in the kaolinite-bearing catchment area, promoting the input and accumulation of detrital kaolinite. This interpretation is consistent with the synchronous hydrological cycle intensification signals recorded by carbonate δ18O values in the same interval, together revealing the coupled response of sedimentary provenance processes and regional climate change (arid background with seasonal heavy rainfall) during the PETM. Simultaneously, the increase in exogenous organic matter is attributed to the transfer of catastrophic and episodic precipitation events (Handley et al. Reference Handley, Pearson, McMillan and Pancost2008).
Second, high atmospheric CO2 concentrations during the PETM may have caused the Hadley circulation to retreat towards the equator, leading to increased seasonal precipitation in mid-latitude regions (Kiehl and Shields, Reference Kiehl and Shields2013). During the PETM period, global warming intensified the global water cycle, accelerating the circulation of water vapour from low latitudes to high latitudes (Held and Soden, Reference Held and Soden2006; Carmichael et al. Reference Carmichael, Inglis, Badger, Naafs, Behrooz, Remmelzwaal, Monteiro, Rohrssen, Farnsworth, Buss, Dickson, Valdes, Lunt and Pancost2017). Variations in tectonics and the positions of land and sea led to some regions becoming warmer and more humid, with an increase in annual average rainfall, while other areas experienced prolonged periods of high temperatures and droughts with an increase in seasonal precipitation (Tierney et al. Reference Tierney, Zhu, Li, Ridgwell, Hakim, Poulsen, Whiteford, Rae and Kump2022). Additionally, regardless of changes in total precipitation, rainfall patterns underwent dual modifications: they became more sporadic and episodic (i.e., concentrated in short, intense events with prolonged intervals between precipitation) while also exhibiting greater seasonality (i.e., pronounced contrasts between wet and dry seasons) (Carmichael et al. Reference Carmichael, Inglis, Badger, Naafs, Behrooz, Remmelzwaal, Monteiro, Rohrssen, Farnsworth, Buss, Dickson, Valdes, Lunt and Pancost2017). There was an increase in episodic environmental inputs, demonstrated by the increased rainfall and development of laminae due to enhanced physical weathering transport processes (Goodbred et al. Reference Goodbred, Kuehl, Steckler and Sarker2003; Simpson and Castelltort, Reference Simpson and Castelltort2012). Both an increase in annual average rainfall and an increase in the frequency of extreme precipitation events can exacerbate the erosion and transport of source rock in river catchments and along river banks, leading to enhanced physical weathering and erosion of source rocks in the peripheral and catchment areas of basins, resulting in changes in the types and contents of sediment minerals within the basin.
Following the peak of the Paleocene-Eocene Thermal Maximum (Figure 13B) – the interval of extreme global warming and hydrological cycle intensification – we observe a significant shift in two key lacustrine sediment proxies during the post-PETM stage: (1) a marked decrease in carbonate δ18O values. This isotopic shift primarily indicates a sustained transition to a wetter climate with enhanced seasonal precipitation, rather than reflecting the PETM-stage hydrological intensification. Notably, precipitation moisture sources (governing water isotopic composition) are independent of detrital mineral provenance (McLennan, Reference McLennan1989; Xu et al. Reference Xu, Peng, Liu, Shan, Hao, Jia and Li2025); the study ruled out major changes in moisture transport pathways as the dominant driver, because the magnitude and pattern of the δ18O decrease align with regional post-PETM wetting records, and no synchronous shifts are observed in elemental provenance proxies (which reflect detrital source area variations, not moisture sources). A minor contribution from moderate cooling cannot be excluded, but hydrological wetting dominates this isotopic signal (Inglis et al. Reference Inglis, Bragg and Burls2020). (2) A decrease in calcite content, suggesting reduced abundance of carbonate-precipitating organisms, likely driven by increased freshwater dilution and altered lake water chemistry. Taken together, these observations point to a gradual shift towards a wetter climate following the PETM peak. Enhanced persistent precipitation (rather than transient PETM rainfall) drove greater freshwater input into the lake and elevated nutrient-rich terrestrial runoff, with no corresponding changes in detrital mineral provenance.
6. Conclusion
This study highlights the significant climatic and environmental changes during the Paleocene-Eocene Thermal Maximum (PETM) as evidenced by detailed analyses of the mineralogical, inorganic and organic geochemical characteristics of the Kongdian Formation in the Bohai Bay Basin. The findings indicate that elevated temperatures during the PETM led to intensified evaporation and widespread aridification, driving substantial calcite sedimentation in lakes. Simultaneously, strong negative δ13C excursions in carbonates record significant episodic rainfall events, reflecting a complex interplay of arid background conditions and short-term wet seasonal patterns during the PETM. The increased content of detrital kaolinite during the PETM points to intensified physical weathering and erosion in the kaolinite-bearing catchment areas, triggered by episodic heavy rainfall and elevated seasonal runoff within the PETM interval. Furthermore, the rapid influx of nutrients such as nitrogen, phosphorus and iron into the lakes via this pulsed PETM runoff enhanced lake paleoproductivity, as evidenced by the development of fine laminations and the dominance of dry-adapted organisms like Podocarpidites and Ephedripites (consistent with the overall arid climatic framework). These episodic environmental inputs underscore the intricate relationship between climate dynamics and sedimentary processes during the PETM, illustrating how pulsed seasonal precipitation and background aridification coexisted. Ultimately, this research underscores the importance of understanding terrestrial laminations in the Bohai Bay Basin for reconstructing high-resolution paleoenvironmental conditions, and this comprehensive approach contributes to a broader understanding of ancient climate dynamics and their implications for future climate scenarios. The study’s findings provide valuable insights into the paleoenvironmental evolution during the PETM (not post-PETM), emphasizing the need for further research to unravel the complex climate mechanisms that drove these transient changes.
Acknowledgements
This work was financially supported by the National Natural Science Foundation of China (Grant No. 42072150) and the Science Foundation of China University of Petroleum, Beijing (No. 2462025XKBH024), and we thank the sponsors of these projects. We thank PetroChina Dagang Oilfield Company for providing samples and data access.
Competing interests
The authors declare that they have no known competing financial interests or personal relationships that could have appeared to influence the work reported in this paper.


 Open access