

In comparison to Alzheimer’s dementia, individuals with dementia with Lewy bodies are disproportionately affected by visuoperceptual impairments and up to 80% experience recurrent complex visual hallucinations. Reference Aarsland, Ballard, Larsen and McKeith1 These clinical and neuro-psychological features strongly suggest that the visual system in dementia with Lewy bodies is dysfunctional, although precisely which components are affected and how remains to be clarified. Single photon emission computerised tomography (SPECT) and fluorodeoxyglucose positron emission tomography (PET) studies in dementia with Lewy bodies have demonstrated occipital and occipito-parietal visual association area hypoperfusion and hypometabolism respectively. Reference Pasquier, Michel, Brenot-Rossi, Hassan-Sebbag, Sauvan and Gastaut2–Reference Imamura, Ishii, Hirono, Hashimoto, Tanimukai and Kazuai5 However, occipital deficits are not consistently reported in dementia with Lewy bodies. Reference Kemp, Hoffmann, Tossici-Bolt, Fleming and Holmes3
Functional magnetic resonance imaging (fMRI) has been used to examine cortical visual function, although there has been only one study to date in patients with dementia with Lewy bodies, which examined cortical activation and deactivation patterns compared with patients with Alzheimer’s disease using a number of visual tasks. Reference Sauer, ffytche, Ballard, Brown and Howard6 However, we are not aware of studies investigating deficits in lower visual processing in dementia with Lewy bodies. There is a larger literature looking at cortical visual function in Parkinson’s disease, Reference Stebbins, Goetz, Carrillo, Bangen, Turner and Glover7–Reference Meppelink, de Jong, Renken, Leenders, Cornelissen and van Laar9 although cortical visual activation patterns vary considerably depending on the study paradigm. Overall, there remains a need to understand the functional integrity of the cortical visual system in dementia with Lewy bodies. We sought to address this issue using the application of fMRI and arterial spin labelling (ASL)-MRI to dementia with Lewy bodies. Our specific hypotheses were:
-
1 that individuals with dementia would show evidence of deficits in higher visual areas on blood oxygen-level dependent (BOLD) response to visual stimuli compared with controls, but lower visual areas would show normal function;
-
2 that using ASL-MRI we would find posterior brain hypo-perfusion at rest in individuals with dementia compared with controls; however, in light of increasing evidence for intact lower visual areas in dementia with Lewy bodies, we expected perfusion deficits to be less marked here than in higher areas.
Method
Participants
Participants with dementia with Lewy bodies (DLB group) were recruited from a local community-dwelling population of individuals who had been referred to geographically based old age psychiatry and neurology services. The control group was selected from friends and spouses of participants included in this and previous studies. The study was approved by the local ethics committee.
Diagnosis of probable dementia with Lewy bodies was made independently by two experienced senior clinicians using the revised International Consensus Guidelines for dementia with Lewy bodies. Reference McKeith, Dickson, Lowe, Emre, O'Brien and Feldman10 Cognitive function was tested using the Cambridge Cognitive Examination Reference Roth, Tym, Mountjoy, Huppert, Hendrie and Verma11 (CAMCOG, maximum score 105) and the Mini-Mental State Examination Reference Folstein, Folstein and McHugh12 (MMSE, maximum score 30). The presence and severity of any extrapyramidal signs were graded using the motor component of the Unified Parkinson’s Disease Rating Scale (UPDRS). Reference Fahn13
Control participants included in the study demonstrated no evidence of dementia (from history and score >80 on CAM-COG). Exclusion criteria for all participants included contra-indications for MRI, severe visual impairment, previous history of alcohol or substance misuse, significant neurological or psychiatric history, focal brain lesions on brain imaging or the presence of other severe or unstable medical illness.
All participants had measurement of their best near visual acuity on Landolt broken rings or Snellen chart (test distance 40 cm) after correction of any refractive errors. Assessment of visuoperceptual function was carried out using previously described angle discrimination and overlapping figures tasks, with 20 trials administered for each task. Reference Mosimann, Mather, Wesnes, O'Brien, Burn and McKeith14 Prior to MRI in the DLB group, cognitive fluctuations were assessed using the Clinician Assessment of Fluctuation (CAF) scale and the One Day Fluctuation Assessment Scale (ODFAS). Reference Walker, Ballard, Ayre, Wesnes, Cummings and McKeith15 For assessment of visual hallucinations, caregivers were asked to complete the hallucinations subscale of the Neuropsychiatric Inventory (NPIhall), which enquires about the occurrence of visual hallucinations in the past month. The NPIhall score (frequency × severity) was used in analyses to determine the association of the severity and frequency of visual hallucinations with imaging indices.
Neuroimaging data acquisition
Participants were scanned on a 3T whole body MRI scanner (Achieva scanner; Philips Medical System, The Netherlands). Images acquired included a standard whole brain structural scan (three-dimensional (3D) MPRAGE, sagittal acquisition, slice thickness 1.2 mm, in plane resolution 0.94 × 0.94 mm; repetition time (TR) 9.6 ms; echo time (TE) 4.6 ms; flip angle 8°; SENSE factor 2). Functional MRI data were collected with a gradient-echo echo planar imaging (EPI) sequence (TR = 1.92 s; TE = 40 ms; field of view (FOV) 192 × 192 mm2; matrix size 64 × 64, flip angle 90°, 27 slices, slice thickness 3 mm, slice gap 1 mm). The length of each functional run varied between the different stimulus conditions (see below): 100 volumes (192 s) were acquired for the checkerboard stimuli; 183 volumes (351 s) were acquired for the moving dot stimuli; and 234 volumes (449 s) were acquired for objects stimuli.
Subsequently, within the same scanning session, resting cerebral perfusion imaging data were collected with the participants instructed to close their eyes during the acquisition. Cerebral perfusion imaging used a multislice pulsed ASL sequence – FAIR (Flow sensitive Alternating Inversion Recovery Reference Kim and Tsekos16 ) – with 4 slices (TE = 26 ms, TR = 4000 ms, inflow time 1700 ms, in plane resolution 4 × 4mm2,slice thickness 6mm, FOV=256 × 256 mm2) and incorporated a 10 ms bipolar gradient to suppress bulk flow. Two spatially contiguous acquisitions of FAIR giving 8 slices were acquired, angled at 30° to the corpus callosum to cover the occipital and inferior parietal lobe.
To quantify T1 for use in the perfusion quantification, we used a rapid inversion recovery gradient-echo EPI sequence with: TR = 15000 ms; TE = 24 ms; T1 from 0.25 s to 2.5 s in 12 equal steps; FOV = 256 × 208 mm; SENSE factor 2; in plane resolution 2 × 2 mm; 72 slices, slice thickness 2 mm.
Functional MRI stimulus presentation
Previously reported activation differences on BOLD fMRI between controls and the DLB group may be due in part to task performance differences. Reference Sauer, ffytche, Ballard, Brown and Howard6 To limit the confounding effect of performance (either over- or underactivity) so that we could specifically test for (any) differences in visual cortical processing, our participants passively viewed simple visual stimuli rather than carrying out an active behavioural task. Visual stimuli were back-projected onto a screen at the foot of the scanner and individuals viewed the stimuli via a mirror positioned above their eyes. Functional MRI compatible goggles with lenses that ranged from –4.0 to 4.0 diopters (0.5 increment) were used to correct any refractive errors.
Participants were asked to focus on a central cross-hair set against a grey background. The stimulus presentation was controlled by the psychophysics toolbox (http://psychtoolbox.org/; extension for Matlab (Mathworks, Natick, Massachusetts, USA). Reference Pelli17
A block design was used for three different stimulus conditions: flashing checkerboards (checkerboard stimulus), pictures of objects (objects stimulus), and moving dot fields (motion stimulus). The checkerboard stimulus consisted of five 19.2 s blocks of a flashing black-and-white checkerboard, alternating with five 19.2 s baseline blocks of a blank screen. The checkerboard flickered with a frequency of 7.5 Hz. The object stimulus consisted of seven 18 s blocks of intact pictures of objects, alternating with seven 18 s blocks of images of ‘scrambled’ texture patterns, which had the same low-level contrast and luminance as the pictures of the objects. Between blocks, a grey screen with fixation cross was displayed. Six stimuli were presented on each block. The stimuli were shown for 1 s, with a 2 s fixation cross between stimuli. For the motion stimulus, there were 18 9.6 s blocks of expanding white dots, alternating with 18 9.6 s blocks of stationary but flickering white dots. All stimuli subtended a maximum of 4° of visual angle. The checkerboard stimulus was used to stimulate lower visual areas (V1–V3), the objects stimulus was used to stimulate higher visual areas in lateral-occipital cortex, Reference Grill-Spector and Malach18–Reference Lerner, Hendler, Ben-Bashat, Harel and Malach20 and the motion stimulus was used to stimulate posterior temporal areas. Reference Watson, Myers, Frackowiak, Hajnal, Woods and Mazziotta21
Although participants passively viewed the visual stimuli to avoid performance confounds, to maintain their attention to the stimuli during the fMRI component of the study, a small intermittent pink dot appeared approximately every 30 s over the central fixation point to which participants were instructed to respond to by squeezing a response button placed in their right hand, with disappearance of the dot either on response or after 5 s.
Functional MRI analysis
For each participant, the T1 anatomical image was segmented and spatially normalised in SPM5 (www.fil.ion.ucl.ac.uk/spm/) using the default parameters. The fMRI data for each stimulus condition were first motion corrected by aligning all functional images to the first image, and then coregistered with the T1 anatomical image. The spatial normalisation parameters from the T1 segmentation were used to write out the EPI data in standard space with a voxel size of 3 × 3 × 3 mm. The normalised images were then smoothed (6 × 6 × 6 mm full width half-maximum Gaussian kernel). A high pass filter of 128 s was used, and serial correlations were removed with SPM’s AR(1) model.
The general linear model (GLM) in SPM was used to conduct a whole brain analysis of the fMRI data. For each stimulus condition, we created a design matrix by convolving the time course of the two block types (i.e. flashing checkerboard and blank; objects and scrambled images; and moving dots and static flashing dots), with the canonical haemodynamic response function (HRF) and its first derivative. The six parameters from the motion correction for each functional run were included in the design matrix as covariates of no interest. The regressors were fitted to the fMRI data to produce beta estimates for each regressor. Individual participant and second-level (random effects) group analyses were conducted making comparisons between groups. Contrast images were generated from beta estimates for the following comparisons: checkerboard v. baseline (checkerboard stimulus contrast), moving dots v. static dots (motion stimulus contrast), and objects v. scrambled images (objects stimulus contrast). Results are shown thresholded at P<0.05 family wise error corrected for multiple comparisons at the voxel level and we report clusters only ≥20 voxels in size. We used the SPM anatomy toolbox (www2.fz-juelich.de/inm/inm-1/spm_anatomy_toolbox) to determine the location of each cluster.
To maximise sensitivity, we also performed a region of interest (ROI) analysis focusing on the visual areas. For fMRI data, five ROIs in Montreal Neurological Institute (MNI) space were defined averaging across left and right hemispheres. Four ROIs (V5/MT (middle temporal area); V1; V2 and V3 combined; and V4) were taken from the SPM anatomy toolbox. A fifth area (lateral occipital cortex, LOC) was a 1 cm diameter sphere (20 voxels in volume) centred on the average of coordinates described in a number of previously published reports (online Fig. DS1). Reference Grill-Spector and Malach18–Reference Lerner, Hendler, Ben-Bashat, Harel and Malach20 For each participant, the magnitude of activation for the different conditions in each ROI was determined by averaging the relevant beta parameter from each participant’s fitted beta estimates from the general linear model.
Cerebral perfusion analysis
T1 was determined by fitting the inversion recovery images with a relaxation curve on a pixel by pixel basis. Motion correction was applied to each ASL image-set. The ASL images and the T1 map were co-registered with the 3D-T1 anatomical scan. Each ASL scan was split into ‘control’ and ‘tag’ image series. Each series was then averaged and the difference image dM was created by subtracting the mean control image from the mean tag images, while the magnitude image M was calculated by taking the average of all ASL images. Perfusion values were then calculated on a voxel-wise basis from the dM, M and T1 images, using a value of 1.932 s for T1 of blood, and 0.9 ml/g for the blood–brain partition coefficient. Reference Silva and Kim22
The calculated perfusion images were then spatially normalised, using the parameters from the 3D-T1 scan. Since we had limited spatial coverage, a mask in MNI space was created of voxels which had ASL data from all participants. As well as using the ROIs from fMRI analysis (V1, V2/3, V4, V5/MT and LOC), we derived a further two from the Harvard Oxford atlas (in FSL, www.fmrib.ox.ac.uk/fsl) encompassing the precuneus and the superior lateral occipital (SLO) region because of the previously reported widespread posterior perfusion found in dementia with Lewy bodies in these areas. Reference Colloby, Fenwick, Williams, Paling, Lobotesis and Ballard23,Reference Fong, Inouye, Dai, Press and Alsop24 We calculated mean perfusion within these ROIs in MNI space.
Statistics
The NPIhall score in the DLB group was correlated against fMRI beta values and ASL perfusion rates in the ROIs. Comparison of fMRI and perfusion data was also made using ROIs between the control and DLB groups correcting for age, even though groups were not significantly different, as this has been suggested to be a significant factor leading to region-specific decreases and increases in perfusion. Reference Preibisch, Sorg, Forschler, Grimmer, Sax and Wohlschlager25 Group comparisons were made using Student t-test and we hypothesed that there would be no difference in ROI BOLD activations between the DLB and control groups in V1–4 to checkerboard stimulus, but reduced activations in V5/MT and LOC to motion and object visual stimuli respectively. For the ASL-MRI data, we hypothesed that ROI perfusion would be normal in V1–3 but reduced in higher visual areas. Secondary analyses were done to ensure that any notable findings were related to group differences in visual function rather than owing to other factors by examining the association between key demographic/disease factors (age, visual acuity, UPDRS motor subscale score, CAMCOG score, age at onset of dementia, duration of any dementia, CAF and medication use) and imaging ROI. Parametric and non-parametric correlations were used depending on the normality of the data. All values reported are means (s.e.) unless otherwise stated and t-tests were two-tailed.
Results
Demographics
We recruited 19 individuals with dementia with Lewy bodies and 19 controls; one patient with dementia was subsequently excluded on the basis that he could not tolerate lying flat in the MRI scanner. Another person with dementia failed to respond to the motor task during scanning and demonstrated no occipital lobe activation to the checkerboard stimulus and thus their data were not included in the fMRI analysis. Arterial spin labelling MRI data from two other participants with dementia were excluded from the perfusion analysis due to excessive movement artefact during ASL-MRI acquisition, although fMRI data from these individuals were available. Thus, data were available on 17 individuals with dementia for the fMRI analyses and 15 individuals with dementia for the ASL-MRI analyses.
Demographic features of the participants who completed the study are shown in Table 1. Age, gender and visual acuity were comparable between control and DLB groups with, as expected, reduced cognitive performance on CAMCOG and MMSE, lower visuoperceptual task scores and higher UPDRS scores in the DLB group compared with controls.
Demographic, cognitive and motor characteristics of participants included in study a

| Control group (n = 19) | DLB group (n = 17) | P | |
|---|---|---|---|
| Age, years: mean (s.d.) | 77.6 (7.1) | 81.2 (5.6) | 0.10 |
| Males: females, n | 11:8 | 10:8 | 1.00 |
| UPDRS motor subscale, mean (s.d.) | 0.9 (1.6) | 33.9 (14.0) | <0.001 |
| MMSE, mean (s.d.) | 29.0 (1.2) | 18.8 (5.1) | <0.001 |
| CAMCOG, mean (s.d.) | |||
| Total score | 96.5(3.4) | 64.8 (14.0) | <0.001 |
| Executive subscore | 22.1 (3.4) | 10.4 (4.8) | <0.001 |
| Memory subscore | 23.6(2.1) | 15.6 (4.2) | <0.001 |
| Visual acuity (decimalised), mean (s.d.) | 0.64 (0.29) | 0.55 (0.26) | 0.32 |
| Age at onset of dementia, mean (s.d.) | – | 77.4 (5.7) | N/A |
| Duration of dementia, months: mean (s.d.) | – | 45.4 (32.2) | N/A |
| CAF, mean (s.d.) | – | 8.2 (4.4) | N/A |
| ODFAS, mean (s.d.) | – | 6.2 (4.7) | N/A |
| NPIhall, mean (s.d.) | – | 3.1 (2.3) | N/A |
| Angle discrimination task (score out of 20), mean (s.d.) | 19.9 (0.2) | 15.5 (5.6) | <0.001 |
| Overlapping figures task (score out of 20), mean (s.d.) | 19.8 (0.3) | 14.8 (3.6) | <0.001 |
| On cholinesterase inhibitor, n (%) | – | 13 (72) | N/A |
| On anti-Parkinson medication, n (%) | – | 5 (28) | N/A |
| L-dopa dose equivalent, mg: b mean (s.d.) | – | 234.4 (186.6) | N/A |
DLB, dementia with Lewy bodies; UPDRS, Unified Parkinson's Disease Rating Scale; MMSE, Mini-Mental State Examination; CAMCOG, Cambridge Cognitive Examination; CAF, Clinician Assessment of Fluctuation; ODFAS, One Day Fluctuation Assessment Scale; NPIhall, Neuropsychiatric Inventory hallucinations subscale score (frequency×severity of hallucinations).
a For comparison of data in control group v. DLB group, independent t-tests were used for continuous data and Pearson chi-squared for categorical data.
b Calculated equivalent L-dopa dose for those in the DLB group on dopaminergic medication.
Results in bold are significant.
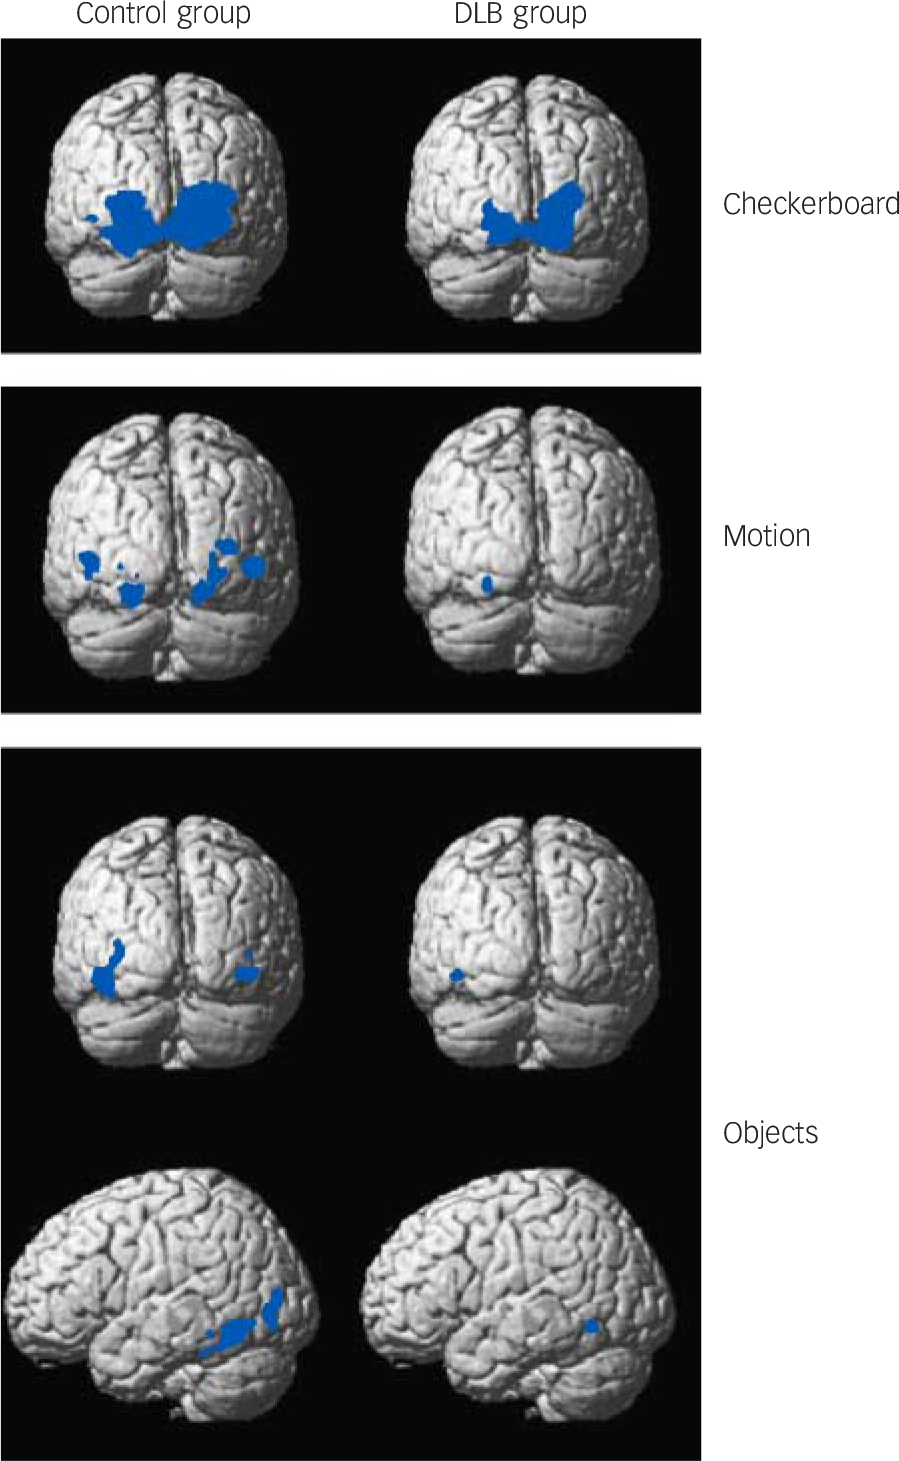
Group activation maps for checkerboard, motion and objects stimuli. Blue areas indicate significant BOLD activation. See online Fig. DS2 for graduated colour activation maps.
Thresholded at P<0.05 family wise error corrected and superimposed on average brain template. Contrasts include checkerboard v. static image (checkerboard stimulus), moving dots v. static image (motion stimulus) and objects v. scrambled image (objects stimulus). BOLD, blood oxygen-level dependent; DLB, dementia with Lewy bodies.
Functional MRI activations
Distinct and overlapping networks (P<0.05 family wise error corrected) were evident for each of the visual stimuli for both control and DLB groups (Fig. 1 and Tables 2, 3, 4 and online Fig. DS2). Significant cluster activations for checkerboard stimulus lay within V1 and V2 for both control and DLB groups, with controls in addition showing significant clusters over V3. For the motion stimulus contrast, both DLB and control groups had significant activations in V3 and V4, with activation in V5/MT only present in the control group. The objects stimulus contrast demonstrated activation clusters in controls overlying the left inferior temporal gyrus, left fusiform gyrus, left inferior and middle occipital gyrus. No clusters ≥20 voxels were noted in participants with dementia with this stimulus.
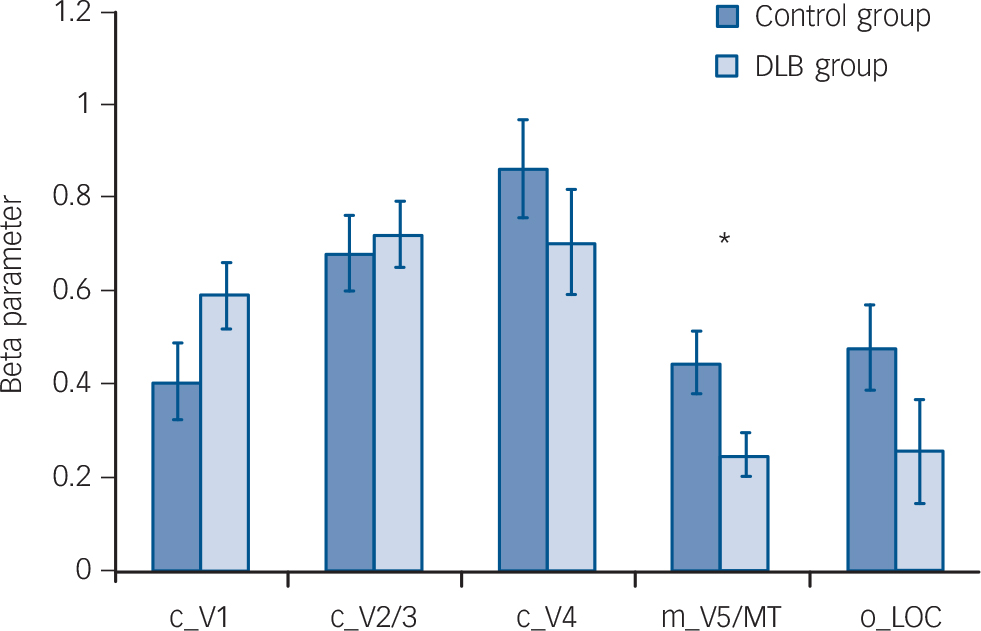
Whole brain analyses comparing groups, however, did not demonstrate any significant differences in activation between DLB and control groups for each of the tasks. Region of interest analysis (Fig. 2) for lower visual areas confirmed this finding, with no differences in activity between the control and DLB groups for checkerboard stimulus (V1 ROI) or objects stimulus analyses (LOC ROI). However, the ROI localised on the V5/MT showed that the DLB group had reduced activation to the motion stimulus in this area compared with controls (P = 0.02). The results of the exploratory analyses of BOLD activity in the other ROIs for each of the tasks are shown in online Table DS1. Of note, there were no significant differences between DLB and control groups in the BOLD response to the three visual stimuli in V1, V2/3 or V4.
Cerebral perfusion
Cerebral perfusion within the segment of brain covered by the FAIR image acquisition was significantly reduced in the DLB group compared with controls within inferior parietal and posterior cingulate/precuneus (Fig. 3 and Table 5 and online Fig. DS3). Lower visual areas (V1–3) appeared relatively intact.
Perfusion deficits in dementia compared with controls were confirmed in ROI analysis (Fig. 4). Correcting for age, the reduction was
Checkerboard stimuli: anatomical locations of BOLD activations in participants to visual stimuli a

| Cluster | P corrected | Size (voxels) | Anatomical loci | Maximum Z | Maximum Z position (MNI) |
|---|---|---|---|---|---|
| Control group | <0.001 | 899 | Right V1 | 6.80 | 9, –93, –9 |
| Right area V2 | |||||
| Left V3 | |||||
| Left V2 | |||||
| DLB group | <0.001 | 541 | Right V1 | 6.82 | 18, –93, 0 |
| Right V2 | |||||
| Left V2 | |||||
| Left V1 | |||||
BOLD, blood oxygen- level dependent; MNI, Montreal Neurological Institute.
a Significant clusters in Statistical Parametric Mapping analysis, local maxima more than 4 mm apart. Data presented were all significant at the P<0.05 family wise error corrected level.
Motion stimuli: anatomical locations of BOLD activations in participants to visual stimuli a

| Cluster | P corrected | Size (voxels) | Anatomical loci | Maximum Z | Maximum Z position (MNI) |
|---|---|---|---|---|---|
| Control group | |||||
| 1 | <0.001 | 27 | Left V4 | 5.73 | –21, –84, –18 |
| Left V3 | |||||
| 2 | <0.001 | 21 | Right V2 | 5.44 | 18, –84, –15 |
| Right V3 | |||||
| 4 | <0.001 | 27 | Left V5 | 5.39 | –42, –69, 3 |
| 5 | <0.001 | 34 | Right V5 | 5.24 | 45, –66, 0 |
BOLD, blood oxygen-level dependent; MNI, Montreal Neurological Institute.
a Significant clusters in Statistical Parametric Mapping analysis, local maxima more than 4 mm apart. Data presented were all significant at the P<0.05 family wise error corrected level.
Object stimuli: anatomical locations of BOLD activations in participants to visual stimuli a

| Cluster | P corrected | Size (voxels) | Anatomical loci | Maximum Z | Maximum Z position (MNI) |
|---|---|---|---|---|---|
| Control group | |||||
| 1 | < 0.001 | 81 | Left inferior temporal gyrus | 6.58 | –42, –60, –9 |
| Left fusiform gyrus | 5.69 | –36, –48, –21 | |||
| Left inferior occipital gyrus | 6.49 | – 39, – 63, – 6 | |||
| 2 | < 0.001 | 24 | Left middle occipital gyrus | 5.40 | –36, –78, 0 |
BOLD, blood oxygen- level dependent; MNI, Montreal Neurological Institute.
a Significant clusters in Statistical Parametric Mapping analysis, local maxima more than 4 mm apart. Data presented were all significant at the P<0.05 family wise error corrected level.
not significant in V1 (P =0.25) or V2/3 (P = 0.19), but approached significance in V4 (P = 0.08). The reduction was
Bar chart showing region of interest (ROI) analysis comparing control group v. dementia with Lewy bodies (DLB) group with regard to functional BOLD activations to different visual stimuli (mean (s.e.)).
c_V1, checkerboard activation in V1 ROI; c_V2/3, checkerboard activation in V2/3 ROI; c_V4, checkerboard activation in V4 ROI; m_V5/MT, motion activation in ROI V5/MT; o_LOC, objects activation in ROI lateral occipital complex; BOLD, blood oxygen-level dependent. There were no significant differences between groups for ROI activations except for motion stimulus contrast (P = 0.02). *P<0.05.
significant in: V5/MT, P = 0.05; LOC, P = 0.05; precuneus, P<0.001; SLO, P = 0.004.
Associations between clinical variables and imaging changes in participants with dementia
There were no significant correlations between visual hallucinations (NPIhall) score and BOLD activations, although there was a negative relationship between V4 perfusion and NPIhall (rho = –0.52, P = 0.04; online Fig. DS4), but not perfusion in other ROIs. Angle discrimination task scores in dementia did not correlate significantly with either BOLD activations or perfusion. Overlapping figures task scores in dementia were, however, associated with increased perfusion in lower but not higher visual areas (V1, rho = 0.49, P = 0.05; V2/3, rho = 0.55, P = 0.03; V4, rho = 0.55, P = 0.03; online Fig. DS5).
Anatomical locations of perfusion deficits in DLB group v. aged control group

| Cluster | P corrected | Size (voxels) | Anatomical loci | Maximum Z | Maximum Z position (MNI) |
|---|---|---|---|---|---|
| 1 | <0.001 | 39 | Right V1 | 5.22 | 18, –54, 12 |
| Right V2 | |||||
| Right precuneus | |||||
| 2 | <0.001 | 20 | Left inferior parietal cortex | 5.11 | –45, –54, 21 |
| Left supramarginal gyrus | |||||
DLB, dementia with Lewy bodies; MNI, Montreal Neurological Institute.
Statistical Parametric Mapping t-plot showing differences in cerebral perfusion thresholded at P<0.001 uncorrected at group level between control and DLB groups (blue areas indicating reduced perfusion in the DLB group relative to controls) and superimposed on average brain template. Lines demarcate boundaries of overlap of perfusion slices sampled. See online Fig. DS3 for exemplar raw cerebral perfusion and graduated colour SPM perfusion maps.

There was no relationship between CAMCOG score, or visual acuity and BOLD response or perfusion in any ROI in either the control or DLB group. In the control group, participants’ perfusion in ROI of SLO and LOC correlated negatively with age (SLO r = –0.45, P = 0.05; LOC r = –0.58, P = 0.01), although no relationship was noted in the DLB group. We found a negative relationship between UPDRS score and SLO ROI perfusion (rho = –0.66, P = 0.006) in participants with dementia, although there was no association between UPDRS scores and other ROIs for perfusion or functional BOLD activations. There were no significant differences in BOLD or perfusion data in participants with dementia taking or not taking cholinesterase inhibitors and on or off dopaminergic medications.
Bar chart showing region of interest (ROI) analysis comparing control v. dementia with Lewy bodies (DLB) group with regard to perfusion (mean (s.e.)).
LOC, lateral occipital complex; Precun, precuneus; SLO, superior lateral occipital region. Mean per cent reduction in perfusion: V1, 13.1%; V2–3, 13.4%; V4, 20.5%; V5/MT, 27.8%; LOC 28.2%; Precun, 33.7%; SLO, 28.2%. *P<0.05; **P<0.01.

Discussion
Functional activations to passively viewed visual stimuli
We found no significant differences in fMRI response between the control and DLB groups to checkerboard, objects or motion stimuli in V1 and V2/V3. These findings are comparable to the one other fMRI study in dementia with Lewy bodies by Sauer et al. Reference Sauer, ffytche, Ballard, Brown and Howard6 Although these researchers did not specifically examine striate visual cortical activation to their visual stimuli, it was notable that their colour task led to similar V4 activity between participants with dementia and controls. Thus overall, given that BOLD activity is presumed to correlate with neuronal activity, Reference Logothetis and Pfeuffer26 the similar levels of activation to simple visual stimuli in the control and DLB groups imply that, in lower visual areas at least, visual processing function in dementia with Lewy bodies is not grossly perturbed. This conclusion is reinforced by the lack of specific pathological change evident in the occipital lobe of individuals with dementia with Lewy bodies at the macrostructural Reference Beyer, Larsen and Aarsland27–Reference Whitwell, Weigand, Shiung, Boeve, Ferman and Smith29 and microstructural level, Reference Gomez-Tortosa, Newell, Irizarry, Albert, Growdon and Hyman30 comparable levels of visual cortical excitability in dementia compared with controls Reference Taylor, Firbank, Barnett, Pearce, Livingstone and Mosimann31 as well as our ASL findings (see below) of a non-significant reduction in lower visual area perfusion.
We found reduced activation in the lateral occipito-temporal cortex (V5/MT) on ROI analysis to the motion stimulus, which is consistent with previous evidence that individuals with Parkinson’s disease or dementia with Lewy bodies who hallucinate show visual motion deficits both on behavioural testing Reference Mosimann, Mather, Wesnes, O'Brien, Burn and McKeith14 and on functional imaging. Reference Sauer, ffytche, Ballard, Brown and Howard6,Reference Stebbins, Goetz, Carrillo, Bangen, Turner and Glover7 However, it is notable that no significant differences were noted on the motion task on whole brain analyses. Such analyses may be unduly conservative when testing a priori hypotheses but, nonetheless, our findings should be considered preliminary and require replication.
The potential finding of reduced activity in V5/MT to motion stimuli, together with lack of group difference in LOC response to objects stimuli are somewhat at odds with neuropathological findings, although there have been very few investigations of visual pathway pathology in dementia with Lewy bodies; Reference Gomez-Tortosa, Newell, Irizarry, Albert, Growdon and Hyman30,Reference Harding, Broe and Halliday32 Lewy body pathology in the inferior temporal lobe has been linked to visual hallucinations. In contrast, Lewy body deposition in occipital and parietal areas is low. Nevertheless, perfusion (see below and Colloby et al Reference Colloby, Fenwick, Williams, Paling, Lobotesis and Ballard23 and Fong et al Reference Fong, Inouye, Dai, Press and Alsop24 ) and metabolism deficits Reference Imamura, Ishii, Hirono, Hashimoto, Tanimukai and Kazuai5 have been observed in both occipito-parietal and occipito-temporal areas. It may be the interaction between dysfunctional occipito-temporal and occipito-parietal processing streams or indeed disruption to visual white matter connectivity Reference Ota, Sato, Ogawa, Murata, Kuno and Kida33 that contributes to the visuoperception difficulties and visual hallucinations seen in dementia with Lewy bodies.
Perfusion deficits in dementia with Lewy bodies
The finding of reduced posterior perfusion using ASL-MRI is consistent with prior evidence of hypoperfusion/hypometabolism in dementia with Lewy bodies. However, the extent to which the occipital lobe is affected remains controversial, with Kemp et al Reference Kemp, Hoffmann, Tossici-Bolt, Fleming and Holmes3 showing a lack of involvement, and others occipital reductions. Reference Pasquier, Michel, Brenot-Rossi, Hassan-Sebbag, Sauvan and Gastaut2,Reference Imamura, Ishii, Hirono, Hashimoto, Tanimukai and Kazui34 In part, this disparity may be driven by differences in severity and stage of illness of the dementia cohorts involved in the different studies. Reference Fong, Inouye, Dai, Press and Alsop24
Dopaminergic changes may also be relevant, as we found a negative correlation between the severity of Parkinsonism as measured on the UPDRS and perfusion in SLO ROI. A study with PET in patients with Parkinson’s disease Reference Bohnen, Minoshima, Giordani, Frey and Kuhl35 noted a relationship between occipital hypometabolism and nigrostriatial dysfunction, although more recent findings using 123I-FP-CIT/SPECT and ECD/SPECT in Parkinson’s disease with dementia and patients with dementia with Lewy bodies Reference Rossi, Volterrani, Nicoletti, Manca, Frosini and Kiferle36 failed to find any link between regional cerebral perfusion and nigrostriatal loss. This combined with a lack of any observed effect of dopaminergic medication on perfusion in the present study indicate that the role of dopaminergic mediated processes on visual function in dementia with Lewy bodies is more complex and may depend on other factors, for example, the severity of co-associated cortical neuro-degeneration and/or concurrent changes in other neurotransmitter systems. Reference O'Brien, Colloby, Pakrasi, Perry, Pimlott and Wyper37
Imaging findings related to visual hallucinations, visuoperceptual function and cholinesterase inhibitors
There are no comparative fMRI studies in people with dementia with Lewy bodies examining the relationship between BOLD response and severity of hallucinations. There is a more extensive literature in Parkinson’s disease, where studies have demonstrated widely distributed changes in activation patterns (ranging from the lower visual system, through to visual association areas and frontal areas) in people who hallucinate compared with those who do not, but there is no established or consistent pattern to these (see e.g. Stebbins et al, Reference Stebbins, Goetz, Carrillo, Bangen, Turner and Glover7 Ramírez-Ruiz et al Reference Ramírez-Ruiz, Martí, Tolosa, Falcón, Bargalló and Valldeoriola8 and Meppelink et al Reference Meppelink, de Jong, Renken, Leenders, Cornelissen and van Laar9 ).
In our study we found no evidence of any association between the severity and frequency of visual hallucinations and BOLD activations to any of our visual task probes. The disparity of this finding compared with the Parkinson’s disease data may be as a result of intrinsic differences between our study and those in people with Parkinson’s disease in terms of disease process (dementia with Lewy bodies v. Parkinson’s diease), cognitive function (dementia v. Parkinson’s disease without dementia), dopaminergic/nigrostriatal deficiency, and lack of a significant non-hallucinator group in our study.
However, we did note an association between the severity of visual hallucinations and the degree of hypoperfusion deficits in V4. Visual area V4 is important for colour Reference McKeefry and Zeki38 and is an intermediate module within the ventral visual stream for object and form processing Reference Pasupathy39 and thus hypoperfusion of this region in association with visual hallucinations severity is certainly plausible. However, we did not see any association between hypo-perfusion in higher visual areas such as the inferior temporal cortex, and Lewy body pathology in this area has been associated with visual hallucination occurrence. Reference Harding, Broe and Halliday32 Nevertheless, this and other studies in dementia with Lewy bodies and Parkinson’s disease which have demonstrated coupling between visual hallucinations and posterior perfusion deficits have focused on comparing people who hallucinate with people who do not, Reference Stebbins, Goetz, Carrillo, Bangen, Turner and Glover7–Reference Meppelink, de Jong, Renken, Leenders, Cornelissen and van Laar9,Reference Perneczky, Drzezga, Boecker, Forstl, Kurz and Haussermann40 whereas in the present sample all participants with dementia with Lewy bodies hallucinated to varying degrees. Thus, perfusion deficits may be a marker of a neural environment that is permissive to the manifestation of visual hallucinations, but this does not indicate they are causally related.
Angle discrimination task and overlapping figures task are differentially impaired in dementia with Lewy bodies compared with other visuoperceptive tasks. Reference Mosimann, Mather, Wesnes, O'Brien, Burn and McKeith14 Although the neurobiological basis of both tasks remains unclear, it is likely that the angle task is more dependent on the occipito-parietal or dorsal visual stream, Reference Wood, Firbank, Mosimann, Taylor and O'Brien41 and that the overlapping figures task may involve activity within the occipito-temporal ventral stream, Reference Alegret, Vinyes-Junqué, Boada, Martínez-Lage, Cuberas and Espinosa42 given that this latter task requires object recognition. In the present study we did not see any association between the angle or overlapping figures task with BOLD activation to visual stimuli. This may suggest that the neural substrate that is responsive to the visual stimuli does not overlap the same structures responsible for the performance in the visuoperceptive tasks chosen in this study. However, there was an association between greater perfusion in lower visual areas (V1–4) in dementia with Lewy bodies and overlapping figures task scores, which may indicate that the integrity of lower visual areas is important in dementia with Lewy bodies for the maintenance of visuoperceptual function associated with the ventral visual stream.
There were no differences in either BOLD task-related activations or perfusion in the DLB group on or off cholinesterase inhibitors. Previous reports have demonstrated increased occipital perfusion in individuals treated with donepezil, a cholinesterase inhibitor. Reference Fong, Inouye, Dai, Press and Alsop24,Reference Mori, Ikeda, Fukuhara, Nestor and Tanabe43 The present study was cross-sectional and thus we cannot exclude the possibility that cholinesterase inhibitor use in individuals may have modulated the imaging findings.
Clinical implications
Our results suggest that lower visual areas are functionally relatively intact and respond normally to simple visual stimuli. Abnormalities in the visual system do appear to emerge at higher levels and these may contribute towards visuoperceptive dysfunction and visual hallucinations, which are common in dementia with Lewy bodies. However, whether these abnormalities include both the ventral and dorsal visual stream or are a product of an interaction between the two remains to be resolved, and certainly the integrity of lower visual areas may also be important for maintaining certain aspects of visuoperceptual function. Our understanding of the role of functional synaptic and neurochemical changes in these lower areas also remains deficient. For example, O’Brien et al Reference O'Brien, Colloby, Pakrasi, Perry, Pimlott and Wyper37 found a relationship between nicotinic receptor binding in primary and secondary visual cortices and visual hallucinations in individuals with dementia with Lewy bodies, which were not associated with occipital perfusion deficits, suggesting that significant functional receptor changes can occur in the absence of obvious alterations in perfusion. Further work combining investigative modalities in individuals with dementia with Lewy bodies that examine regional receptor changes, perfusion/metabolism and functional responsivity to visual stimuli and their relationship with observed clinical visual symptomatology are needed.
Funding
This work was supported by the UK NIHR Biomedical Research Centre for Ageing and Age-related disease award to the Newcastle upon Tyne Hospitals NHS Foundation Trust, the Newcastle Healthcare Charity and by the Academy of Medical Sciences and Wellcome Trust Starter Grants scheme for Clinical Lecturers.


 Open access
eLetters
No eLetters have been published for this article.