

Introduction
Many glaciers exhibit complex three-dimensional flow dynamics resulting from drag on valley walls, tributary flow, topographic variations, basin geometry, and flow around a bend (Reference Meier, Kamb, Allen and SharpMeier and others, 1974;Reference Echelmeyer and KambEchelmeyer and Kamb, 1987). Thermal characteristics and water content complicate the situation further (Reference Murray, Booth and RippinMurray and others, 2007; Reference Moore, Iverson and CohenMoore and others, 2009). Accumulation zones within valley glaciers exhibit these structural complexities to a lesser degree because of close proximity to the origin of flow. However, englacial stratigraphic structure in the upper reaches of a glacier can still vary significantly over short distances due to the aforementioned controls. Although complex stratigraphy commonly occurs in the accumulation zone of valley glaciers, their dynamics have rarely been investigated in detail with combined GPR and geodetics. Common valley glacier complexities within both firn and englacial regimes include angular unconformities, shear zones, superposition of different flow regimes, water conduits, and transition zones between complex and surface-conformable stratigraphy (Reference Clarke and BentleyClark and Bentley, 1994;Reference ArconeArcone, 2002;Reference Goodsell, Hambrey and GlasserGoodsell and others, 2002;Reference KingKing, 2009). Here we show evidence of these complexities and discuss their causes, using data from upper Kahiltna Glacier, Alaska Range, USA.
In May-June of 2008-10 we collected ground-penetrating radar (GPR) profiles and surface ice-flow velocities from GPS in Kahiltna Pass Basin (KPB) on Kahiltna Glacier to find an appropriate location for drilling a surface to bedrock ice core for Holocene paleoclimate studies. We chose this site because of its flatness, location in the upper reaches of the percolation zone and low surface ice-flow velocities (Denali National Park, unpublished data, 2007). We hypothesized that >200 m of surface-conformable stratigraphy (SCS) might exist in the basin;however, we recognized that numerous deformational mechanisms could preclude the use of KPB for ice-core studies (Reference Arcone, Kreutz, Rogers and ChignellArcone and Kreutz, 2008), particularly because of its location at a 90° bend in the glacier (Fig. 1) and variations in velocity, slope and basin dimensions, both locally and upstream. Although the site has now been deemed unsuitable for Holocene ice-core studies (Reference CampbellCampbell and others, 2012), the GPR profiles and GPS data revealed an interesting case study of flow dynamics, which gave rise to this paper.
Maps showing: (a) digital elevation model of Alaska (red is high elevation) and location of the Alaska Range (circle-plus symbol); (b) Landsat image of Kahiltna Glacier with Mount McKinley (Denali; D), Foraker (F) and Hunter (H); and (c) high-resolution (0.5 m) QuickBird satellite image of the upper Kahiltna Glacier study area with topographic contour overlay. (c) further shows the bergschrund (dashed line; BG), Motorcycle Hill (MH), Kahiltna Pass Basin (KPB), the converging tributary (box; CTB), the surrounding hanging glaciers (HG), estimated ice-flow directions (unlabeled arrows), GPS-measured surface ice-flow velocity vectors (labeled arrows) and approximate location of center-line 40MHz GPR profile (light dotted line).

Our objective, therefore, was to characterize the structural features of KPB to find the dynamical causes of any deformation or preclusion of conformable stratigraphy. Our approach was to use both deep and shallow GPR profiles collected with mid- to high-frequency (40-900MHz) antennae, GPS surface velocity measurements in the basin and the main tributary upstream, visual observations of surface conditions, and snow accumulation rates, to interpret dynamic controls on stratigraphy and glaciological structures within KPB.
Kahiltna Pass Basin
The Kahiltna is an alpine valley glacier that originates from the southwestern flank of Mount McKinley and flows southward out of the Alaska Range. It is the largest glacier in the Alaska Range, is 71 km long, 475km2 in area (Reference Meier, Tangborn, Mayo and PostMeier, 1971) and has 3660 m of relief. A bergschrund defines the top of the main glacier trunk at Windy Corner near 4100 m a.s.l. (Reference Washburn and RobertsWashburn, 1991;Reference CoombsCoombs, 1997) and its separation from a hanging glacier higher up. Ice originating at Windy Corner flows westward for 3 km through a steep and narrow valley known as Motorcycle Hill (MH), prior to reaching KPB at 3108 m a.s.l. (Fig. 2). Some surface crevasses are visible in satellite imagery just up-glacier of KPB, and these same features were visible in the field, suggesting a topographic bedrock rise prior to entering KPB. Upon entering KPB, the main trunk bends nearly 90° to the south into a flat region with minimal signs of surface deformation (i.e. no crevasses). The flat region is ˜800 m wide (east to west) and 700 m long (north to south) and appears well constrained by the valley walls to the west and north. A continuous bergschrund below the ridge of Kahiltna Pass suggests minimal influence on flow into the basin from the south- and southeast-facing valley walls. The equilibrium-line altitude on the Kahiltna is located ˜1800 m a.s.l. (Reference CoombsCoombs, 1997), so KPB is located entirely in the accumulation zone.
Photograph of Motorcycle Hill showing recent and partially buried avalanche debris, crevasses, and exposed rock from recent icefall. Crevasses, avalanche and rock debris are buried as they are transported into KPB where flow bends 90° to the south.

Equipment and Methods
During May-June of 2008-10 we profiled stratigraphy and ice depths at KPB with a range of GPR pulse bandwidths (Figs 1 and 3). We used a Geophysical Survey Systems Inc. (GSSI) SIR-3000 control unit with several antennas for different applications. We used a model 3101 900MHz bistatic antenna for high-resolution imaging of the upper ˜14-20m of firn to infer accumulation rate variability over profiles 1-5 (Fig. 3). A model 3107 100MHz monostatic transceiver (also used over profiles 1-5) and model 3200 MLF 15-80MHz bistatic antenna unit were used to image deeper stratigraphy and the ice-bedrock contact. The MLF antenna was centered at 40 MHz for this study, and was used on profile 2 (Fig. 7a, further below) and a center-line GPR profile from KPB (3100 ma.s.l) to below Camp 1 (2340 m a.s.l). The center-line transect was located ˜50 m to the west and parallel to profile 4. The 40MHz profile 2 was compared to the 100MHz profile 2, and the center-line profile was used to infer thermal variability and larger-scale bed topography, which were hypothesized to control flow dynamics within KPB.
Plan-view QuickBird satellite image of KPB showing firn-core location, crevasses on the inside bend of the glacier, surface ice-flow velocity vectors (ma-1) from 2009 and 2010, flux gates (red dotted lines, G1-G3) and ice depth contours extrapolated from GPR profiles (blue lines). The eastern depths of gate G3 (black dotted line) were interpolated for flux calculations.

Each antenna unit was hand-towed at ˜0.5ms-1 and polarized orthogonally to the profile direction. Profile traces lasted 100-400 or 4000-6300 ns for shallow and deep applications, respectively, with 2048-4096 16-bit samples per trace. Profiles were recorded with range gain and post- processed with bandpass filtering to reduce noise. We applied elevation and distance corrections to the profiles using regularly spaced GPS readings. Post-processing also included stacking to increase the signal-to-noise ratio, a Hilbert transformation (magnitude only) to simplify complex horizon waveforms, and post-stack variable velocity migration for time-depth conversion. The variable velocity migration was performed using GSSI proprietary software through hyperbola matching at different depths in GPR profiles to estimate changes in wave velocity through the firn and ice. Based on hyperbola migration, firn had an average dielectric constant of 2.45 which translates to a wave velocity of 0.189 m ns-1. However, we used a dielectric constant (˜3.0) and wave velocity of ice (0.173 m ns-1) for all GPR profiles (except migrated data), to assure features lined up well for visual purposes.
Rapid static velocity surveys (Fig. 3) were performed at KPB in 2009 and 2010 to quantify surface ice velocity vectors and volumetric strain (Reference Koons and HendersonKoons and Henderson, 1995). A Trimble 5700 receiver with a Zephyr Geodetic antenna was used for base-station corrections. Between 8 and 11 May 2009, 25 stakes were placed in the flat region of KPB and another 12 stakes down-glacier. Following the initial GPS measurement, each stake remained for another 4-9 days and was then relocated by the receiver to create a network of surface ice-flow velocity vectors. Another 16 velocity measurements were collected within and up-glacier of KPB between 12 and 26 May 2010 for comparison with data collected in 2009. Error estimates range between 2.0 and 3.6 m a-1, based on 5 mm of estimated error associated with the Trimble 5700 control unit, multiplied by baseline distances (0.5-7.5 km), and standardized to represent m a-1 as opposed to the time frame in which each pair of measurements were collected per survey point.
Accumulation rates were determined from isotopic chemistry results of shallow firn cores extracted in the central region of KPB in 2008 and 2010 (Reference CampbellCampbell and others, 2012). Estimated accumulation rates were adjusted in this study from those originally published by Reference Kelsey, Wake, Kreutz and OsterbergKelsey and others (2010) based on a comparison of cores and samples between years. Chemistry spikes from the 2009 Mount Redoubt and 2001 Mount Cleveland (Alaska) eruptions and other seasonal chemistry signals show an average accumulation rate of 0.8 ± 0.2 m ice equiv. a-1.
Radar data, GPS velocities and the average accumulation rate were used to create cross-section balance flux profiles (hereafter referred to as ‘gates’) at three different locations surrounding KPB: one up-glacier toward MH (G1), one within the basin just south of the 90° bend (G2) and one 600 m down-glacier of the bend (G3) (Fig. 3). Bedrock depths from GPR profiles and interpolated velocities from the GPS survey were used to create 2 m sections along each gate. The accumulation areas included in each flux calculation for gates 2 and 3 were estimated by delineating the visible bergschrund surrounding KPB (Fig. 4). Radar profiles only crossed the western half of G3 (Fig. 3, red dashed line), so the eastern depths and the eastern end location of G3 (Fig. 3, black dashed line) were estimated from velocity vectors, extrapolated bed topography and satellite imagery. Lastly, a 0.5 m pixel resolution QuickBird satellite image of the study area was acquired during the 2009 field season. The satellite image was compared to surface observations (e.g. surface crevasses and avalanche debris), velocity vectors and GPR profiles, to predict where subsurface complexities may occur and infer causes of such complexities imaged with GPR.
Graph showing balance flux through gates established above KPB (gate 1), within KPB (gate 2) and 600m down-glacier of KPB (gate 3). Accumulation was removed from the balance flux of gates 2 and 3 by multiplying the accumulation rate by the area located between proximal up-glacier gates. Percentage values represent difference in gate 2 and 3 balance flux relative to gate 1.

Results
Radar profiles
A center-line 40MHz radar profile from KPB (3100 m a.s.l.) to Camp 1 (2286 m a.s.l.) shows a transition between the percolation and wet snow zones between ˜2800 and 2600 m a.s.l. (Fig. 5;TZ), based on radar signal attenuation (Reference Murray, Booth and RippinMurray and others, 2007;Reference Woodward and BurkeWoodward and Burke, 2007; Reference CampbellCampbell and others, 2012). The center-line profile was collected ˜50 m west of and parallel to profile 4 (Fig. 3) and shows folded yet relatively continuous stratigraphy, in the upper 80 m between 0 and 1 km (Fig. 5b);however, an unconformity occurs between 1 and 2.5 km (Fig 5b;U) just down-glacier from KPB. Thin-ice layers in a 20 m deep firn core recovered from KPB in 2008 (used for accumulation rate estimates) confirm its location in the percolation zone. However, the melt effect appears to be minor because it does not cause deep radar signal attenuation or wash out the seasonal isotope and chemistry signals, as indicated by shallow firn-core chemistry data (Reference Kelsey, Wake, Kreutz and OsterbergKelsey and others, 2010).
Center-line 40MHz GPR profile along the long axis of Kahiltna Glacier from KPB at 3100ma.s.l. to Camp 1 at 2340ma.s.l. showing: (a) elevation profile of entire profile length; (b) zoom of upper 80m of ice depth along the profile length; (c) GPR depth profile; (d) zoom showing strata visible to 170m depth (arrow); and (e) location of GPR profile (red line) superimposed on a satellite image of the glacier. (b) shows the estimated firn-core location at KPB (plus-circle symbol) and unconformity (U). (b, c) show estimated location of a transition zone (TZ) at _2600–2800ma.s.l. between the percolation zone (PZ) and wet zone (WZ), which likely migrates up-glacier during the summer (STZ) and down-glacier during the winter (WTZ). (c) shows overdeepening (OD) within KPB, a bedrock rise (BR) down-glacier and surface ice-flow velocities from GPS surveys in 2009–10. (Edited from Reference CampbellCampbell and others, 2012.)

100MHz radar profiles 1 and 2, collected in KPB, show a strong bottom horizon and a U-shaped valley with ice thicknesses between 250 and 300 m at the center (Figs 3 and 5-7). SCS on the western side of the basin reaches 75 m depth in the 100MHz profile (Figs 6a and 7b;SCS), and ˜170m depth in the 40MHz profile (Fig. 7a;SCS). The eastern side of the basin is dominated by discontinuous dipping strata (DDS) and a series of hyperbolic events (H) that dip to the west creating an apparent unconformity or transition zone (TZ) (Figs 6 and 7) between complex stratigraphy (CS) and only 60-70 m of SCS overburden.
100MHz GPR profile 1 within KPB showing: (a) zoom of upper 130m with thickening strata (TS), SCS and CS, west to east, and (b) full depth profile with the black dashed line representing zoomed region in (a). A strong bottom horizon and side reflections are also visible in (b). Side reflections occur because of the GPR profile’s close proximity to the valley headwall. The deepest internal horizon is interpreted as bedrock.

GPR profile 2 collected within KPB showing: (a) migrated 40 MHz zoom; (b) 100 MHz zoom unmigrated section; and (c) full- depth 100 MHz unmigrated section. Red and black dashed boxes in (c) show zoomed migrated (a) and unmigrated (b) sections, respectively. SCS to 170 m depth is visible on the west in the 40 MHz profile, transitioning to dipping (DT) and thickening strata (TS) to the east. The migrated 40 MHz and unmigrated 100 MHz zoom profiles also show discontinuous strata or discrete events up to 230 m depth and an apparent transition zone between SCS and complex strata (CS). The transition zone (TZ) into CS is characterized by a lack of continuous strata, a shift into discontinuous dipping strata (DDS) and hyperbolic events (H). Convex folds (F) also exist on the eastern half of the 100 MHz zoom profile.

A gradual vertical thickening of surface-conformable strata (Fig. 6;TS) occurs west to east, with thickness between the strongest englacial horizons increasing by as much as 30%. A series of open anticlinal folds also occurs in the upper 30-50 m, on the east side of the basin (Fig. 7;F). Lastly, the surface-conformable strata experience a ˜13° apparent dip (maximum) to the east near the center of profile 2, below 50 m depth (Fig. 7;DS). The dip appears relatively consistent with the surface slope as ice flows out of the narrow up-glacier valley into KPB.
Axial profile 3 shows SCS on the west side of the basin (Fig. 8;SCS), and axial profiles 4 and 5 reveal CS on the east side (Figs 9 and 10;CS). These results are consistent with structures imaged in cross-glacier profiles 1 and 2. In the center-line axial profile a pronounced up-glacier dip of strata occurs near 50 m depth (Fig. 9;UGD). Vertical thinning of strata also occurs from north to south (Fig. 9; white arrows). Bow-tie reflections occur along the bedrock which partially mask the true bed topography in unmigrated cross sections and suggest overdeepening (Figs 5c, 9b and 10b) where ice flows from MH into KPB and where ice exits KPB, down- glacier. Continuous stratigraphic horizons disappear below ˜-75-170m depth. Some discontinuous or discrete events are visible within the GPR profiles, upwards of 220 m depth (Fig. 7a), and the only strong reflection horizon below this depth is from bedrock. Narrow vertical noise bands resulting from the Denali National Park Service communications repeater situated 3 km to the west also mask data in some of the GPR profiles (Figs 7b and c and 10b).
Axial western 100MHz GPR profile 3 of KPB showing: (a) SCS in upper 100m zoomed section and (b) intermittent bedrock horizon in full profile. Zoom section is outlined by dashed line. Minimal variations in stratigraphy thickness or signs of deformation are present.

Axial center-line 100MHz GPR profile 4 of KPB showing: (a) zoom of upper 125m and (b) full depth profile with zoom section outlined by dashed line. SCS overlies complex strata (CS), strata that dip up-glacier (UGD) and significant strata thickness variations (white arrows). A strong bedrock horizon and bow-tie reflections (BT) suggest overdeepening in the full profile.

Axial eastern 100MHz GPR profile 5 of KPB showing: (a) complex strata (CS) in upper _90m depth and (b) varied bed topography with overdeepening (OD) suggested by bow-tie reflections (BT) at 100m distance, where ice plunges from MH into KPB and at 850 m where ice flows out of KPB to the south. Dashed line represents zoomed section in (a).

Geodetic survey
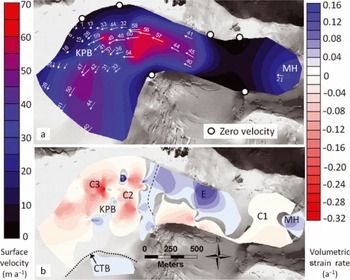
Velocity data from GPS measurements show ice-flow direction oriented to the south-southwest after it flows into KPB from the east (Fig. 3). Velocities range between 7 and 60 m a-1, with the highest near the center line of flow and the lowest associated with the northwest corner of the basin (Figs 3 and 11a). Velocities decrease by ˜36% (60 m a-1 to 38 m a-1) as ice flows from the steep MH region into the flat KPB. An eightfold velocity increase (7 m a-1 to 59 m a-1) occurs over a distance of 200 m from the northwest corner of the basin towards the glacier center line. There is also a slight divergence of vectors as ice flows toward the west side of the basin (Fig. 11b;D). Volumetric strain rate calculated via kriging interpolation from GPS surface velocities suggests zones of compression near the base of MH (Fig. 11b; C1) and within KPB (Fig. 11b; C2, C3). Zones of extension occur as ice flows from MH toward KPB (Fig. 11b; E, MH). Compression zone C2 is located where ice flows from the high-velocity, narrow, steep up-glacier valley into KPB, and zone C3 is located toward the central-western region of KPB where ice converges with the western valley wall and bends to the south.
Maps of KPB and MH showing: (a) velocity contours and (b) volumetric strain rate where areas of extension (blue, E) occur at and down-glacier of MH and areas of compression (red, C1–C3) occur primarily within KPB and immediately west of MH. Slight divergence (D) occurs in the northwest region of KPB. Velocity vectors and zero velocity point locations used for velocity and strain-rate interpolations are displayed in (a). The black dashed line shows the estimated MH/KPB transition, and the black dotted line shows a converging tributary boundary (CTB) between the main trunk and icefall to the east.
Comparison of center-line velocity measurements indicates a ˜300% velocity increase (Fig. 1) 4 km down-glacier (Fig. 1; 61 ma-1 to 170 m a-1) and a 400% increase 7 km down-glacier (61 ma-1 to 248ma1) relative to KPB. The significant velocity increase occurs primarily below Camp 1 following the steep terrain associated with Ski Hill (Fig. 1; SH). Velocity measurements in the basin collected in 200910 are comparable to those collected in 2007 by the Denali National Park Service (unpublished data).
Satellite imagery and field observations
The 0.5 m resolution QuickBird satellite image (Fig. 3) reveals crevassing and an icefall situated at MH and on the southern edge of the narrow valley, prior to entering KPB. A prevalent bergschrund surrounding and constraining MH and KPB is also visible. The majority of KPB is relatively featureless with the exception of crevasses (Fig. 3;C) situated perpendicular to the flow direction, immediately up-glacier from the KPB entrance. Field observations also include recent avalanche debris, including rocks, situated on the glacier surface or partially buried from snow accumulation, in the narrow valley, up-glacier from KPB (Fig. 2).
Interpretations
Cause of the transition between surface-conformable and complex stratigraphy
A number of mechanisms may have caused the transition between SCS and CS;here we examine several possible causes. The glacier bergschrund at Windy Corner is almost 3 km away and 900 m higher, which allows ample time for ice to deform as it flows toward KPB. When ice flow reaches the narrow and steep MH (3500 m a.s.l.), crevasses form through extension, and avalanche debris frequently slumps onto the glacier from the surrounding valley walls (Fig. 2). Once ice exits MH, we suggest that the crevasses and avalanche debris are covered by accumulation and transported further down-glacier, eventually entering KPB. The SCS in KPB represents all accumulation acquired once ice has exited the crevasse- and avalanche-prone MH (Fig. 12).
Block interpretation of KPB flow dynamics using GPR profile 2 and a superimposed Google EarthTM image. The surface shows general regions of extension, compression and divergence (D). The GPR profile interpretation shows bedrock (BR) drawn to scale as a solid line and extrapolated as a dotted line, west and east. The transition zone (TZ) is a rough separation between the SCS and complex strata (CS). The thickening strata (TS), buried crevasses and avalanche debris (AD) that occurred up-glacier are also displayed.

Due to continual accumulation, the further ice flows into the KPB, the deeper the transition zone between the SCS and the CS becomes. Our GPR results suggest that complex strata underlay all SCS within KPB and that the thickness of SCS increases east to west due to the increased ice-flow distance from MH. We interpret the westward-dipping linear series of hyperbolic events in profile 2 (Fig. 7b) to be the result of regularly spaced crevasses (Reference Arcone, Delaney, Noon, Stickley and LongstaffArcone and Delaney, 2000), formed from a bedrock rise east of KPB, which are reburied by accumulation as ice flows into KPB. We believe the randomly spaced and discrete reflection events within the CS are relic avalanche features;we make this general distinction due to the nonrandom and random nature of crevasses and avalanches, respectively. A lack of visible stratigraphy in other radar studies has previously been interpreted as being caused by radar signal attenuation (Reference Arcone and KreutzArcone and Kreutz, 2009) or stagnant ice (Reference Watson, Yelf, Bertler, Rogers and ChignellWatson and others, 2008). In our case, we interpret a lack of continuous stratigraphy below the transition zone to be caused by deformation and significant fracturing during flow through the steep and narrow up-glacier valley, which homogenizes the ice and minimizes continuous reflectors visible to radar. Some of the discontinuous dipping strata on the east side of the glacier (Fig. 6;DDS) are likely caused by the steepness of layers which reflect the electomagnetic pulse away from the transceiver. Exposed rock on the valley walls up-glacier from KPB (Fig. 2), and rock fragments on the glacier surface within the narrow valley also suggest that some of the discrete hyperbolic reflections in KPB may result from entrained avalanche rock debris.
Another possibility considered for the origin of the transition zone between the surface-conformable and complex strata is the convergence of two tributaries within KPB: one originating at Kahiltna Pass and a second originating from above MH. To test this interpretation we assess velocity vectors and compare balance-flux calculations between three gates surrounding and within KPB (Figs 3 and 4;G1, G2, G3). Surface velocity vectors suggest that a single glacier tributary flows through KPB (Fig. 3). Balance- flux calculations show a 4.5% increase in volume flux at G2 relative to G1, and a 9.4% increase at G3 relative to G1. However, by subtracting estimated accumulation acquired in the areas between gates G1 and G3, differences in flux between G1 and G3 or G2 and G3 are both <1% (Fig. 4). This small difference can likely be attributed to variations in accumulation rate throughout the basin or errors in our area estimates used for flux calculations.
We interpret the unconformity below KPB (Fig 5;U) and immediately down-glacier of gate 3 as representing the convergence of a small secondary tributary into the main ice flow. We arrive at this interpretation because of a surface lineation visible on satellite imagery (Fig. 1, CTB;Fig. 11b, CTB) and field observations showing a significant icefall originating to the east and depositing ice just below KPB. Reference Woodward and KingWoodward and King (2009) provide similar examples of englacial stratigraphy imaged with GPR on Rutford Ice Stream, Antarctica, although our interpretations differ.
Cause of surface-conformable strata thickness variations in Kahiltna Pass Basin
Differential velocities and basin dimensions may cause thickness variations in deposited strata. Kahiltna Glacier experiences expansion and vertical thinning of strata because of velocity increases (0 m a-1 to 60 m a-1) between MH and KPB (Fig. 3; Fig. 11, MH, E). Zones C2 and C3 are areas of compression (Fig. 11; C2, C3) that experience vertical thickening of strata (Fig. 7b) caused by the decrease of velocities within KPB (60 m a-1 to 15 m a-1).
At one location in the basin, a ˜60% velocity decrease (59 m a-1 to 24 m a-1) occurs over a distance of 120 m (Fig. 11; C3), causing a 29% vertical thickening of stratigraphy. This thickening is visible near the center of GPR profiles 1 and 2 (Figs 6a, 7b and 13;TS). Volumetric strain estimates (Fig. 11) and surface ice velocities south of KPB (Fig. 12) suggest that strata continue to thin as it flows south; thinning stratigraphic units in GPR profile 4 (Fig. 9; white arrows) support this argument.
We use our adjusted and constant accumulation rate with a densification model, a series of center-line GPS velocities established from MH to the west side of KPB, and volumetric strain rates calculated from these velocities, to find that 97 years and 187 ± 33 m of SCS should exist above the CS (Reference CampbellCampbell and others, 2012). This correlates reasonably well with the deepest location of the transition zone (˜150- 170 m) between SCS and CS recorded in the 40MHz GPR profile (Fig. 7;TZ).
The dimensions of KPB are larger than the narrow up- glacier valley;when coupled with the 90° bend in ice flow at KPB, a divergence of velocity vectors in the northwest corner of the basin is expected, and in fact occurs (Fig. 11; D), which should lead to some stratigraphic thinning near the divergence. However, the topography of KPB is also less steep than the up-glacier region, which results in decreased velocities, compression, and thickening of stratigraphy (Fig. 11b). The sharp bend should also increase flow resistance out of KPB, adding to rates of thickening. We suggest that the integration of these thickness changes (both thinning and thickening) results in an overall thickening of layers because the compression (e.g. influence of topographic steepness and sharp bend) is greater than the divergence in this case. In a similar study, Reference Meier, Kamb, Allen and SharpMeier (1974) shows that the stress center line of Blue Glacier, Washington, USA, is shifted towards the inside of a smooth 60° bend, relative to the flow center line, and that flow velocity maxima are shifted towards the outside of the bend. Reference Echelmeyer and KambEchelmeyer and Kamb (1987) further mention that actual bed geometry and the radius of the glacier curvature can significantly influence flow dynamics. Blue Glacier has relatively consistent width dimensions whereas Kahiltna Glacier flows from a narrow steep valley into a wider and flatter basin. Crevasse patterns on the inside bend of KPB are consistent with those of Blue Glacier, which suggests that they represent somewhat similar situations. However, we suggest that the different glacier curvatures (60-90° for Blue and Kahiltna Glaciers, respectively) and the increasing width and flattening of KPB cause different flow results and impacts to the englacial stratigraphy than those experienced by Blue Glacier.
An alternative explanation for the observed differences in strata thickness is variable accumulation rate within and up- glacier of the basin. We tested this hypothesis by collecting 900 MHz GPR data in KPB over the same transects used for the 40 and 100MHz profiles, to image the previous ˜9 years of accumulation. The profiles showed minimal thickness change between isochrones, which suggests that accumulation variability is not a significant contributor to the difference in strata thicknesses at greater depths. Although internal GPR layers cannot be specifically linked to yearly accumulation without correlation to ice cores, they are most likely associated with the same age events (Reference ArconeArcone and others, 2002). Therefore, continuous horizons are a good estimate of a previous glacier surface and their depth should be uniform if accumulation rate is uniform.
Discussion
Reference SiegertSiegert and others (2004) suggest that deformed englacial layers can be caused by several potential spatial and temporal variations, including velocities, thermal (e.g. basal or surface melt), topographic (e.g. bed topography or converging/diverging tributaries) and climatic mechanisms (e.g. variable accumulation rates). Our results suggest that the SCS-CS transition zone within KPB results from relic avalanches and buried crevasses being transported down- glacier from MH, and that the variable strata thicknesses are primarily caused by expansion and compression during ice flow. We refute the possibility of two tributaries causing the SCS-CS transition zone, or accumulation rate variability significantly contributing to strata thickness variations, within KPB.
We make some assumptions with these interpretations. Side reflections as illustrated in profile 1 (Fig. 5) occur when ice is deeper than the distance from a valley headwall to the GPR transceiver. As such, reflections from the headwall may be inappropriately interpreted as bedrock in the vertical direction. We distinguish side reflections from bedrock reflections by searching for the deepest strong horizon along each profile. The likelihood of radar returns originating below bedrock depth is minimal because contrasts in density and conductivity in bedrock are relatively small, whereas signal attenuation at the ice/bedrock interface is significant.
We assume spatially and temporally constant accumulation rates;however, mountaineering literature suggests that significant snowfall events (>1 m) or higher accumulation rates occasionally occur at MH (Reference CoombsCoombs, 1997), relative to KPB. We assume that melt is spatially uniform throughout KPB and MH. We do not account for a lack of melting in the dry snow zone because we assume it is located above our study region (KPB and MH) ˜3900m a.s.l. (Reference CampbellCampbell and others, 2012).
We assume constant horizontal velocity with depth (sliding bed) for all flux calculations because bed conditions and variations in velocity with depth are unknown. Significant velocity increases 4 km down-glacier from KPB suggest that ice is frozen to the bed within KPB and that sliding occurs, down-glacier (Fig. 5c). However, KPB may also be located in a transition zone where bed conditions and velocities close to the bed are variable (i.e. pockets of sliding ice or ice frozen to the bed). The center-line 40MHz GPR profile (Fig. 5c) shows variable backscatter strengths that may provide supporting evidence of a frozen or thawed bed; however, further quantitative analysis and ice depth corrections are required to determine relative bed reflection powers and infer bed conditions (Reference Pattyn, Delcourt, Samyn, De Smedt and NolanPattyn and others, 2009). Lastly, it is possible that the topographic high associated with Ski Hill simply impedes and maintains relatively low and constant ice-flow velocities within KPB.
We assume minimal year-to-year variations in velocity within and up-glacier of KPB. Velocities appear consistent between measurements collected during this project and from a separate field season conducted by Denali National Park Service in 2007 (unpublished data). Unfortunately, all velocity measurements represent short time intervals within the summer months (4-14days, collected in May-August) and we have no velocity measurements in the winter for comparison (Reference Copland, Sharp and NienowCopland and others, 2003; Reference LeBlanc, Larsen, West, Truffer and O’NeelLeBlanc and others, 2008). The avalanche-prone region covers a distance of nearly 1 km near MH, from which, due to safety issues with collecting data in these areas, we do not have velocity measurements (Fig. 1; C). For velocity and strain interpolations, we also assume a flow boundary condition of 0 m a-1 where bedrock is exposed or in contact with the glacier surrounding MH and KPB (Fig. 11a).
Questions also remain regarding causes of the apparent folds on the east side of the basin, proximal to the SCS-CS transition zone (Fig. 6;F). Such folds could have been caused by topographic variations further up-glacier or by compression. The former is more likely, considering the distance ice has traveled and the range of terrain it has flowed over. Folds from compression are less likely because the translation of folds throughout shallower strata is absent, suggesting an earlier event caused them.
Due to the potential irregularity of ice-flow velocities, when or where avalanches are deposited, and unknowns regarding accumulation rate variability, a more precise maximum age estimate of SCS is difficult to establish from flow estimates alone. However, these combined GPR and velocity results present a convincing argument in support of our interpretation of the transition zone origin between SCS and CS, and strata thickness variations within KPB.
Conclusions
Geodetic results show that ice in KPB originates from steep terrain with higher ice velocities located to the northeast. We conclude that stratigraphic complexities in the deeper ice of KPB are caused by reburied extensional crevasses from flow over complex topography and irregularly deposited avalanche debris from steep valley walls, up-glacier. Low-frequency (40-100 MHz) radar profiles show 75-170 m of SCS overlying CS in KPB, suggesting that the SCS were deposited down-glacier from the avalanche and crevasse zones and that most of the discontinuous strata were caused up-glacier, in the vicinity of MH. The deformed ice is at greater depths toward the western side of the basin because ice reaching this point has had more time to accumulate a surface-conformable overburden. Strata thickness variations evident in radar profiles are likely to be a consequence of vertical thickening caused by significant longitudinal compression and thinning caused by divergence as ice flows around the 90° bend. This study emphasizes the importance of considering all potential up-glacier deformation mechanisms and using a multidisciplinary approach to determine polar and subpolar glacier dynamics and kinematics. These results also emphasize the value of GPR and geodetics for constraining interpretations.
Acknowledgements
We thank the US National Science Foundation - Office of Polar Programs (awards 0713974 to K. Kreutz and 0714004 to C. Wake), the Denali National Park Service, the US Army Cold Regions Research and Engineering Laboratory, the University Navstar Consortium (UNAVCO), the Dan and Betty Churchill Exploration Fund, the University of Maine Graduate Student Government, the University of Maine Department of Public Relations, and Talkeetna Air Taxi, for funding, equipment and logistical support. We appreciate significant field help from Mike Waszkiewicz, Eric Kelsey, Ben Gross, Tom Callahan, Max Lurie, Loren Rausch, Ronald Lisnet, Austin Johnson and Noah Kreutz. We also thank Peter Koons, Roger Hooke, John Woodward, Daniel Binder and an anonymous reviewer for reviewing and significantly improving the manuscript.


