


Introduction
Politics, socio-economic factors and armed conflicts can have both positive and negative effects on wildlife, including individuals and populations (Daskin & Pringle Reference Daskin, Pringle, Peters, Hemptinne and Kolb2022). Quantitative analyses conducted on a large scale suggest that conflict intensifies both direct exploitation and habitat conversion (Machlis & Hanson Reference Machlis and Hanson2008). Due to security concerns, conservation activities are often suspended during conflicts (Hart et al. Reference Hart, Hart, Fimbel, Fimbel, Laurance and Oren1997, Shambaugh et al. Reference Shambaugh, Oglethorpe and Ham2001), while international aid and attention focus primarily on peacekeeping and humanitarian efforts (Hanson et al. Reference Hanson, Brooks, Da Fonseca, Hoffmann, Lamoreux and Machlis2009). In this context, protected areas (PAs) may be left without staff, equipment or infrastructure (Hart et al. Reference Hart, Hart, Fimbel, Fimbel, Laurance and Oren1997, Zahler Reference Zahler2003) just as their role becomes even more pivotal to biodiversity conservation.
Lebanon is one of the most vulnerable countries in the Mediterranean region, marked by significant political and socio-economic instability that exerts considerable pressure on its biodiversity. The combination of anthropogenic pressures, the small area of its nature reserves (NRs) and weak law enforcement creates a highly challenging context for biodiversity conservation.
Lebanon hosts 18 NRs extending from the northernmost reserve of Karm Chbat to the southern limits of the country; they span a wide altitudinal gradient encompassing a variety of ecosystems. NRs play a vital role in biodiversity conservation by acting as refuges for endemic and threatened species while also enhancing ecological resilience against anthropogenic pressures and climate change (Leverington et al. Reference Leverington, Costa, Pavese, Lisle and Hockings2010, Watson et al. Reference Watson, Dudley, Segan and Hockings2014). They contribute to the protection of critical habitats and the conservation of species of high biological importance, and they provide priceless ecosystem services (Geldmann et al. Reference Geldmann, Barnes, Coad, Craigie, Hockings and Burgess2013). However, species presence and ecological dynamics within Lebanese NRs remain largely understudied, particularly with regard to mammal populations.
Available data on Lebanese mammals are limited, fragmentary and often outdated (Lewis et al. Reference Lewis, Lewis and Atallah1968, Tohmé & Tohmé Reference Tohmé and Tohmé1985, Nader et al. Reference Nader, El Indary, Salloum and Dagher2011, Amr & Abi Said Reference Amr and Abi Said2012, Benda & Engelberger Reference Benda and Engelberger2016, Benda et al. Reference Benda, Abi Said, Bou Jaoude, Karanouh, Lučan and Sadek2016, Talhouk et al. Reference Talhouk, Itani, Al-Zein and Pullaiah2018, Boukhdoud et al. Reference Boukhdoud, Saliba, Kahale and Bou Dagher Kharrat2021), but new records and field observations have begun to emerge. These include increased sightings in several reserves of both common species and locally and internationally threatened species, including large carnivores such as the grey wolf (Canis lupus) and striped hyaena (Hyaena hyaena). However, species vulnerability assessments cannot rely solely on field sightings (Nichols & Williams Reference Nichols and Williams2006), especially in the absence of systematic monitoring. Mammalian species in Lebanon face multiple anthropogenic threats, including unregulated urban expansion, illegal hunting, habitat fragmentation, unsustainable resource exploitation and pollution. Compounding these threats is the lack of centralized, accessible data. Although public institutions, non-governmental organizations (NGOs) and research centres collect biodiversity data spanning several taxonomic groups, these data have rarely been published or otherwise made publicly available (Boukhdoud et al. Reference Boukhdoud, Saliba, Kahale and Bou Dagher Kharrat2021). As a result, efforts are often duplicated, and no comprehensive national checklist of mammalian species exists to date. There is thus a critical need for coordinated, large-scale surveys to assess the true status of mammal populations and inform conservation and management efforts across Lebanon’s PAs.
The detection of mammal species can be conducted using various methodologies, depending on the target species. At a broad geographical scale, non-invasive methods such as sign surveys and camera traps are commonly used, especially for medium-sized and non-volant mammals (Rovero & Zimmermann Reference Rovero and Zimmermann2016, Bisi et al. Reference Bisi, Gagliardi, Cremonesi, Colombo, Mazzamuto and Wauters2019).
In 2023–2024, the first nationwide monitoring campaign was conducted across 17 of Lebanon’s NRs, using a combination of sign survey tracking and camera traps to enhance understanding of elusive medium-sized mammal species. These techniques were subsequently compared in accordance with NR safety guidelines. The influences of NR area, habitat diversity and anthropogenic pressure on mammal communities were also examined. The initiative sought to refine species checklists for previously surveyed areas and to establish new baselines for others, contributing to a more comprehensive understanding of Lebanon’s mammalian biodiversity in order to inform future conservation strategies.
Materials and methods
Study area
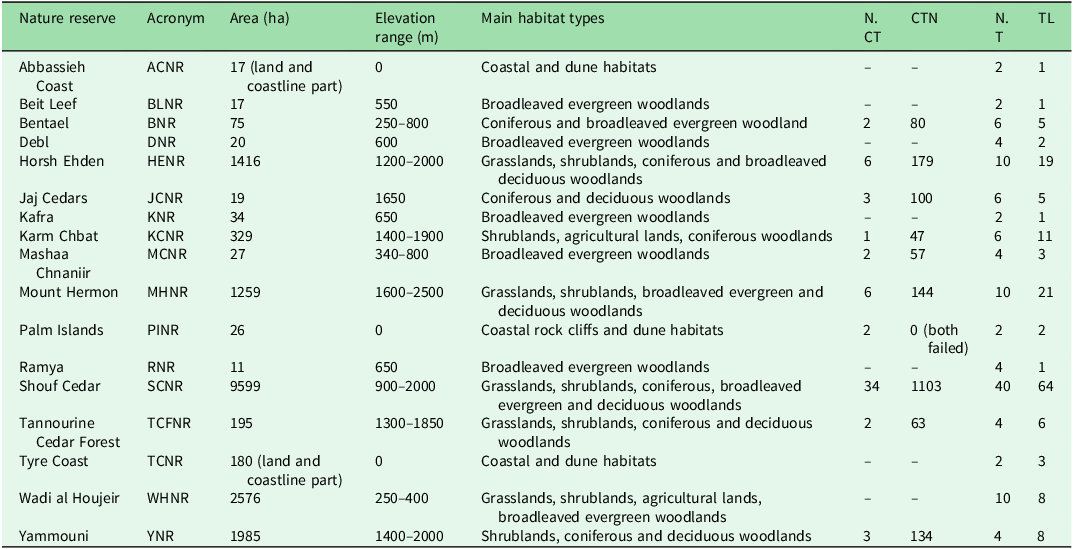
The study was conducted across 17 NRs in Lebanon, which collectively cover c. 2% of the country’s land area (Fig. 1 & Table 1). These NRs span from sea level up to c. 2800 m altitude at Mount Hermon, their sizes varying from as little as 11 ha (Ramya NR) to 9599 ha in the Shouf Cedar NR. Although Tyre Coast NR reaches 15 647 ha, this includes a substantial marine component (Lebanese territorial waters), which was not included in this study; in the Abbassieh Coast and Palm Islands NRs as well only the terrestrial portions were considered. Surveying was possible in 17 out of 18 NRs because Nmairieh NR could not be surveyed due to access restrictions. The NRs protect a diverse range of habitats, including coastal ecosystems, riverine and wetlands, oak woodlands, pine and cedar forests, grasslands and shrublands and rocky slopes. The conservation status and management frameworks of these NRs vary; some are designated as strict NRs; the others are managed such that restricted human activities are allowed, primarily for biodiversity conservation, including forest management, fire risk mitigation and invasive species control. Among the NRs, eight benefit from fully implemented legal frameworks and active management, whereas the others are at different stages of institutional development and legal enforcement.
Locations of nature reserves in Lebanon (dots) overlaid on national borders (dark grey lines). Dot colour indicates mammal species richness recorded in each nature reserve during the survey.

List of the monitored nature reserves with their areas (terrestrial only for coastal and marine sites), altitude ranges, main habitat types and sampling details.

CTN = total camera trap-days; NCT = total number of camera traps deployed; NT = total number of transects; TL = total transect length in kilometres.
Sampling
Two primary data collection methods employed between March 2023 and March 2024 were camera traps and line transect sampling, tailored to maximize species detection while ensuring coverage of key habitats within the NRs. The line transects were designed to cover representative habitats across the study area. A Geographical Information System (GIS)-based planning approach was adopted using land-cover data to ensure that transects crossed diverse and ecologically valuable habitat types, and at least one transect per main habitat was carried out. Based on previous designs (Nader et al. Reference Nader, El Indary, Salloum and Dagher2011, Abi Said & Amr Reference Abi-Said and Amr2012), observers walked along predefined routes with a 4-m sight range (2 m on each side), recording direct and indirect mammal signs including footprints, droppings and burrowing. GPS coordinates were logged for each sighting, and photographic evidence was analysed with reference to sources including Bang (Reference Bang2006) and Serhal and Alkhuzai (Reference Serhal and Alkhuzai2015). Motion-sensor camera traps were employed as a non-invasive monitoring tool in areas of high known mammalian activity (models: Browning Command Ops Elite, Browning Strike Force and Moultrie Panoramic P180i). The cameras were set at 60 cm above ground level and programmed to record 20-s videos with a 5-min interval between consecutive triggers. They operated 24 h every day with medium passive infrared (PIR) sensitivity. A 5 × 5 km grid system was used to ensure evenly distributed sampling within NRs, with one camera trap deployed per grid cell to ensure standardized spatial coverage. In smaller NRs, where the entire area was encompassed within a single grid cell, a minimum of one camera trap was installed for each monitoring campaign, based on habitat suitability (see Table 1 for sampling details). Videos were stored on SD memory cards and retrieved monthly for analysis. The GPS coordinates of all detections were mapped to assess species distribution across the study area. Species not identifiable through the applied methodologies, such as small rodents (e.g., Apodemus spp.), were excluded from the analysis. In contrast, identifiable small mammals such as Sciurus anomalus and Mustela nivalis were retained, as they could be reliably detected with the methods used. In each NR, two monitoring campaigns were conducted – one during the warm season (April–October) and another during the cold season (November–March) – to capture potential seasonal differences in mammal activity patterns in several species (Viella et al. Reference Vilella, Ferrandiz-Rovira and Sayol2020). Although the aim had been to deploy camera traps in all of the NRs, field implementation was constrained by safety and military concerns. As a result, camera traps could be deployed in only 10 out of the 17 surveyed NRs, while in the other seven NRs only transect sampling was implemented.
Data analysis
All analyses were performed using QGis v3.32 (QGis.org 2023) and R version 4.4.2 (R Core Team 2024). We first conducted a comparative analysis restricted to the 10 sites where both methodologies were implemented to assess whether the two methods produced consistent results. For each species detected, a relative abundance index (RAI) was calculated for each method for each site (Table 1). For camera trap data, the RAI was computed by dividing the number of independent detections by the total number of camera trap-days (O’Brien et al. Reference O’Brien, Kinnaird and Wibisono2003). For sign survey data, the number of observations was divided by the total distance walked within the selected 10 areas (Joshi et al. Reference Joshi, Sharief, Kumar, Kumar, Dutta and Devi2020). All the values were then normalized using Equation 1:
 $$Z{{\left( {x{\rm{\;}} - {\rm{\;\mu }}} \right)}}\over{{\rm{\sigma }}}$$
where Z is the standard score, x is the raw value, µ is the mean and σ is the standard deviation.
The two datasets were compared using a Wilcoxon paired test (Wilcoxon Reference Wilcoxon, Kolz and Johnson1992) after checking for non-normality via the Shapiro–Wilk (Shapiro & Wilk Reference Shapiro and Wilk1965) test. As no significant difference was found between the methods in the areas where both methodologies were applied (Wilcoxon paired test, V = 1808, p = 0.43), all available data from all 17 NRs were pooled for subsequent analyses regardless of whether one or both methods had been applied.
To assess drivers of medium to large mammal richness across all NRs, three explanatory variables were analysed. NR area (ha) was used both as a measure of NR size and as a proxy for survey effort, as larger NRs were assigned proportionally more transects and longer camera trap periods. Habitat diversity was assessed using habitat types and area derived from a flora assessment report (United Nations Development Programme (UNDP) STEP4Nature Project, personal communication 2023). Each habitat type was initially classified according to the European Nature Information System (EUNIS) adapted to the Lebanese context (El Zein et al. Reference El Zein, Stephan, Khater, Al-Zein and Dagher-Kharrat2022). Using an expert-based approach, these detailed habitat classes were then consolidated into eight aggregated categories: Coastal, Coniferous Woodlands, Broadleaved Woodlands, Grasslands, Agricultural Lands, Shrublands, Urban Areas and Wetland–Riverine systems (Appendix S1, Tables S1 & S2). Human disturbance was quantified using the Human Footprint Index (HFI) raster dataset from the Socioeconomic Data and Applications Center (SEDAC; 1-km resolution; Venter et al. Reference Venter, Sanderson, Magrach, Allan, Beher and Jones2018) aligned with the 5 × 5 km sampling grid. The average HFI value was calculated for each 5 × 5 km grid cell. NRs that spanned multiple cells were assigned the mean HFI value across relevant cells. Due to its small size, Palm Island was not covered by the HFI and was excluded from this analysis because the HFI includes only terrestrial areas and the largest islands.
Correlations between species richness and the three explanatory variables were initially explored using Pearson’s correlation coefficients after verifying assumptions of linearity and normality of distribution (Shapiro–Wilk test). Linear models were then used to investigate the combined effect of predictors on species richness. We initially tested additive models including all three variables and all possible first-order interaction terms (i.e., two-way interactions) while avoiding second-order interactions due to the absence of replicated data and the risk of overfitting (Crawley Reference Crawley2012). To identify the most explanatory model, we applied a stepwise backward selection procedure, iteratively removing non-significant terms; this allowed us to assess both the individual effects of each variable and their potential interactions, improving the explanatory power and clarity of the final model.
Results
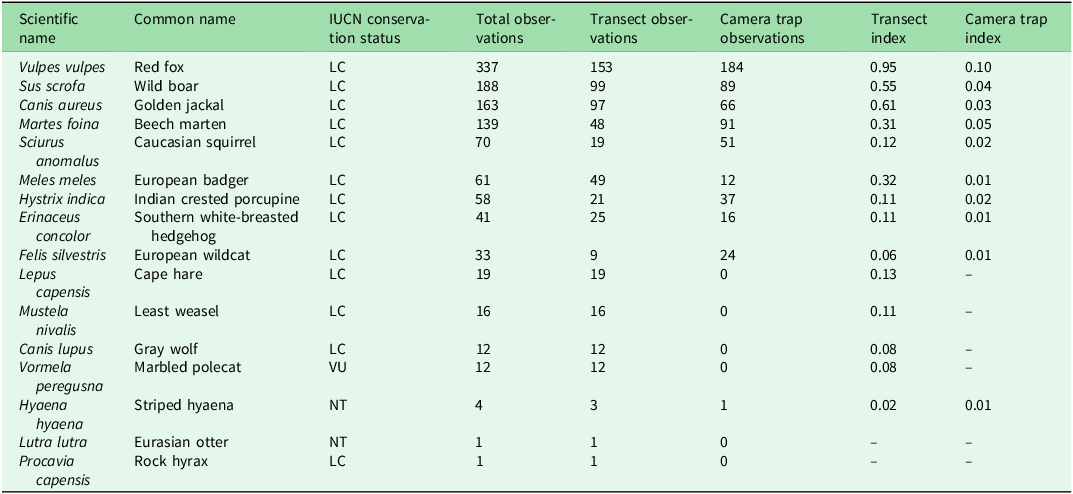
A total of 61 camera traps resulted in 571 video recordings with operational periods ranging between a minimum of 11 and a maximum of 51 days for each camera, and 118 line transects resulted in 628 observations; 16 species were documented (Fig. 2 & Table 2).
Spatial distribution of species across Lebanon’s nature reserves by detection method.

Checklist of target terrestrial mammal species found in Lebanon’s nature reserves ordered by number of total observations.

IUCN status: LC = Least Concern; NT = Near Threatened; VU = Vulnerable.
Transect index = number of observations divided by the total distance walked; camera trap index = number of independent detections divided by the total number of camera trap-days. These indexes are calculated only using data from areas where both methodologies were applied.
IUCN = International Union for Conservation of Nature.
No species were recorded in two NRs, while the majority of sites typically exhibited 5–10 species. The highest richness values were found in some of the largest or most ecologically diverse NRs, such as Tannourine Cedar Forest NR, Horsh Ehden NR and Shouf Cedar NR (Fig. 1).
The highest habitat richness values were in Shouf Cedar NR (7), Horsh Ehden NR and Wadi al Houjeir NR (6), whereas 10 NRs had only one or two habitat types (Appendix S2, Fig. S1). The HFI ranged from 7.63 (Mount Hermon NR) to 41.62 (Tyre Coast NR), with most NR values being 15–30 (Appendix S1, Tables S3 & S4 & Appendix S2, Fig. S2).
Habitat richness showed the strongest positive correlation with species richness (r = 0.45, p = 0.06; Appendix S2, Fig. S3); NRs with more habitat types also tended to host more mammal species. The HFI data indicated negative anthropogenic pressures on species richness within NRs (r = –0.24, p = 0.33), while larger NRs tended to support more species (r = 0.40, p = 0.10); however, neither of these correlations was statistically significant.
The best-fitting linear model of species richness across NRs included habitat richness and the HFI, and their first-order interaction (Appendix S1, Table S3) explained 38% of the variance in species richness (multiple R2 = 0.38, adjusted R2 = 0.25, F3,14 = 2.84, p = 0.076). Habitat richness was the only significant predictor of mammal species richness (β = 4.27 ± 1.96, p = 0.047); the HFI alone was not statistically significant (β = 0.32 ± 0.25, p = 0.222), although interaction with habitat richness was indicated (β = –0.13 ± 0.07, p = 0.105), suggesting that the effect of habitat richness might vary depending on the level of anthropogenic pressure. The residual standard error was 3.87. NR area was excluded from the final model during the backward selection process as it was not a significant predictor. As survey effort was standardized proportionally to NR size, it seems that variation in sampling effort did not substantially influence the observed species richness.
Discussion and conclusion
A total of 16 terrestrial mammal species were confirmed across Lebanon’s 17 NRs surveyed. These species represent the primary target group of the applied methodologies, camera traps and sign transect surveys, which are best suited to detect medium- and large-sized terrestrial mammals (Espartosa et al. Reference Espartosa, Pinotti and Pardini2011, Zwerts et al. Reference Zwerts, Stephenson, Maisels, Rowcliffe, Astaras, Jansen and Van der Waarde2021). These records contribute to filling a long-standing gap in the country’s biodiversity data. The highest richness was found in northern and central NRs such as Tannourine Cedar Forest NR (14 species), followed by Horsh Ehden NR (13 species) and Shouf Cedar NR (12 species). In contrast, the southern NRs presented lower species richness. Although differences in survey effort between northern and southern NRs may have influenced detection probabilities, the observed pattern of lower species richness in the south was also evident when comparing only transect data. Southern NRs are generally much smaller in size, support fewer habitat types and are subject to higher levels of anthropogenic disturbance. These factors, together with local knowledge reporting the long-term absence of several species, suggest that the reduced species richness is an ecological signal rather than a methodological limitation.
Species were not evenly distributed across NRs. Some species, such as the red fox (Vulpes vulpes), wild boar (Sus scrofa) and golden jackal (Canis aureus), were widely observed, reflecting their generalist ecology and adaptability to fragmented or human-modified environments (Krofel et al. Reference Krofel, Giannatos, Ćirovič, Stoyanov and Newsome2017, Stillfried et al. Reference Stillfried, Gras, Börner, Göritz, Painer and Röllig2017). In contrast, other species were detected only in a few locations, including threatened taxa such as the striped hyaena, the Eurasian otter (Lutra lutra) and the marbled polecat (Vormela peregusna), whose presence highlights the continued conservation value of Lebanon’s PAs, despite severe anthropic pressures.
Overall, line transect surveys detected more species than camera traps. In our study, camera traps failed to record rare and non-resident species, including three carnivores: wolf, hyaena and marbled polecat. For such species, camera trap efforts should be increased, and in small NRs monitoring should also extend beyond PAs. Nevertheless, we suggest that, for long-term monitoring, integrating both methods could provide a more complete understanding of mammal presence and conservation status.
As expected, species richness was positively associated with both NR area and habitat diversity. These two variables were themselves correlated, as larger NRs often encompass a broader array of habitat types, which in turn support a wider range of ecological niches and mammalian communities (Tews et al. Reference Tews, Brose, Grimm, Tielbörger, Wichmann, Schwager and Jeltsch2004). Habitat diversity was the strongest predictor of mammal richness, underscoring the ecological value of heterogeneous landscapes. Smaller NRs, often with limited habitat types, could benefit from functional ecological buffers that account for continuity with adjacent natural areas. Given their proximity and shared habitat mosaics, mammal populations, especially medium to large species capable of moving across several kilometres, are unlikely to remain confined within NR boundaries. This suggests the importance of integrating the surrounding matrix when planning or updating management and connectivity strategies (Ricketts Reference Ricketts2001, Hilty et al. Reference Hilty, Worboys, Keeley, Woodley, Lausche, Locke and Carr2020).
The negative trend between the HFI and species richness not being statistically significant suggests that human impacts may be mediated by other variables or might be context-dependent. Nevertheless, the expansion of the urban area in Lebanon by more than 100% between 1975 and 2010 (Government of Lebanon and Council for Development and Reconstruction 2016) must have contributed to habitat fragmentation, leading to ecological isolation even for species that are tolerant of human presence and increasing pressure on NRs. This negative trend is consistent with patterns observed in other Mediterranean and conflict-prone regions, where biodiversity conservation competes with socio-economic and developmental demands (Cincotta & Gorenflo Reference Cincotta, Gorenflo, Cincotta and Gorenflo2011, Daskin & Pringle Reference Daskin and Pringle2018). It is also the case that the HFI will not fully capture localized threats such as illegal hunting, an issue that is well-documented in Lebanon and often occurs even within formal PAs (Abi-Said et al. Reference Abi Said, Outa, Makhlouf, Amr and Eid2018, Raine et al. Reference Raine, Hirschfeld, Attard, Scott, Ramadan-Jaradi, Serhal and Driskill2021, Reference Raine, Gregg, Scott, Hirschfeld, Ramadan-Jaradi and Bamberghi2025).
We are aware of the limitations of the study; indeed, fieldwork was occasionally constrained, particularly in the latter part of 2023, by increased concerns regarding safety. As a result, full implementation of both methodologies was possible in 10 NRs, whereas in others only line transect surveys were conducted; Nmairieh NR could not be surveyed at all. However, over half of the NRs were successfully monitored using both techniques. These operational constraints highlight the challenges of conducting ecological monitoring in politically and logistically complex regions and point to the importance of developing flexible, responsive monitoring frameworks that can adapt to rapidly changing field conditions. Both monitoring techniques can be easily applied, and sign surveys remain a valid method for assessing species richness when conducted by experts. To effectively track biodiversity changes, monitoring must be repeated over time. The results of the current mammal monitoring study have already been integrated into NR management plans, thereby informing the identification of target species and the design of the monitoring schemes for each NR. We therefore strongly advocate for the full implementation of these plans to ensure ongoing and effective biodiversity conservation.
Supplementary material
To view supplementary material for this article, please visit https://doi.org/10.1017/S0376892925100283.
Acknowledgements
We acknowledge the United Nations Development Programme (UNDP) ‘STEPping up Nature Reserves Capacity – STEP4Nature’ project implemented in coordination with the Ministry of Environment of Lebanon for contributing to the field surveys. This work was made possible thanks to the collaboration of several key specialists within JV IndyACT (The League of Independent Activists) in association with the Association for Bird Conservation in Lebanon (ABCL), the University of Balamand (UOB) and Istituto Oikos ETS.
Financial support
This research was funded by the Ministry of Foreign Affairs and International Cooperation of the Italian Republic through the Italian Agency for Development Cooperation (AICS).
Competing interests
The authors declare none.
Ethical standards
Not applicable.


 Open access