


Psychopathy is complex. It is a deviation from normal mental function that impacts the entire personality spectrum. “Psychopaths” commit more violent crimes and have a higher risk of recidivism than other offenders (Douglas et al., Reference Douglas, Vincent, Edens and Patrick2018). Psychopathy is also associated with drug and alcohol abuse (Ellingson et al., Reference Ellingson, Littlefield, Vergēs, Sher and Patrick2018), sexual aggression (Knight & Guay, Reference Knight, Guay and Patrick2018), physical aggression (Porter et al., Reference Porter, Woodworth, Black and Patrick2018), toxic work environments (Mathieu et al., Reference Mathieu, Babiak, Hare, Felthous and Saß2020), and violation of public trust (Gao & Raine, Reference Gao and Raine2010; Neo et al., Reference Neo, Sellbom, Smith and Lilienfeld2018). There is no doubt that psychopathic individuals pose a significant threat to the community and are a public health concern (Reidy et al., Reference Reidy, Kearns, DeGue, Lilienfeld, Massetti and Kiehl2015).
1. The structure of psychopathy
There have been decades of debate as to what psychopathy is (see Miller & Lynam, Reference Miller and Lynam2015). We see psychopathy as having a four-factor structure: Affective | Interpersonal | Disinhibition | Boldness. This theoretically maps to three previously well-established domains: Affective | Interpersonal | Behavioural (e.g., Cooke & Michie, Reference Cooke and Michie2001). But we add the construct of Boldness. This has emerged from the triarchic psychopathy model (Patrick et al., Reference Patrick, Fowles and Krueger2009). In our hands, this four-factor structure emerged from a multi-modal factor analysis on the same population as the current study (Dickison & Sellbom, Reference Dickison and Sellbom2026).
Affective symptoms of psychopathy describe someone as emotionally shallow, socially contemptuous, detached, exploitative, cruel, and lacking in guilt, remorse, and empathy – often referred to as ‘callous-unemotional traits’ and considered to be a central component to psychopathy (e.g., Sellbom & Drislane, Reference Sellbom and Drislane2021).
Interpersonal symptoms of psychopathy describe someone as manipulative, dominant, and deceitful in their interactions with others (e.g., Draycott et al., Reference Draycott, Askari and Kirkpatrick2011).
Disinhibition describes an overall externalising proneness, embodying symptoms of antisocial behaviour, impulsivity, sensation-seeking, poor behavioural control, and emotion regulation (Dickison & Sellbom, Reference Dickison and Sellbom2026).
Boldness describes symptoms of fearlessness, social dominance, and self-assurance (Dickison & Sellbom, Reference Dickison and Sellbom2026).
2. Previous neural models of psychopathy
Several neurobiological and neurocognitive models of psychopathy have been developed (see Stratton et al., Reference Stratton, Kiehl and Hanlon2015 for review). But it is currently unclear how the proposed model processes manifest as traits in psychopathy.
Most of the literature has taken a top-down approach. Researchers first identify superficial patterns of symptoms of psychopathy and then seek their underlying neurobiological correlates. This has contributed useful information to the understanding of the neurobiological aetiology of psychopathy. But this approach makes it difficult to provide a multi-dimensional account of psychopathy that explains how multiple levels of brain functioning influence psychopathic traits.
Using a bottom-up approach – where an already defined neurobiological model is applied to see if or how it can explain psychopathy – would capture the interplay between neural structures, neurotransmitter systems, and behavioural manifestations. For this we need a detailed existing neuropsychological theory of motivational systems.
3. Reinforcement Sensitivity Theory (RST)
Reinforcement Sensitivity Theory (RST) is a neuropsychologically-based theory of systems where their overall sensitivities can be seen as underlying personality factors. RST as a personality theory has been applied widely across psychology domains, including personality, clinical psychology, and neuropsychology. RST was developed from Jeffery Gray’s initial pioneering research, spanning several seminal studies (Gray, Reference Gray1967, Reference Gray1969, Reference Gray1970a, Reference Gray1970b; Gray & Smith, Reference Gray, Smith, Gilbert and Sutherland1969), that focused on better understanding the intricate biological underpinnings of anxiety, associated behaviours, and their neurology. In particular, Gray linked anxiety (defined via anxiolytic drugs) to a Behavioural Inhibition System (BIS).
Gray (Reference Gray1982) expanded this to a detailed theory of three systems: The Behavioural Approach System (BAS), the BIS, and Fight, Flight, Freeze System (FFFS). The neural elements of the theory were updated by Gray and McNaughton (Reference Gray and McNaughton2000) and then by McNaughton and Gray (Reference McNaughton and Gray2024). The core function of these systems is the state control of ongoing behaviour. Trait descriptions of RST then derive from the long-term overall sensitivities that dispose to behaviours and emotions associated with each of the systems. These sensitivities constitute personality traits (Corr & McNaughton, Reference Corr, McNaughton and Corr2008) and their values determine the specific behaviours expressed by an individual given particular environmental circumstances. For example, at any given level of physical threat, a high trait fear individual acts as though they are closer to the threat than would a low trait threat individual.
From 1970 onwards, the BAS (approach) was seen as a ‘reward’ system. It was associated with sensitivity to the presentation of positive reinforcers or omission of expected negative reinforcers; and linked to personality traits of optimism and impulsivity. The BIS was initially seen as a “punishment” system – sensitive to presentation of negative reinforcers or the omission of expected positive reinforcers. But this needs clarification.
“[Gray] distinguished between a learning-related ‘punishment mechanism for passive avoidance [and] a separate punishment mechanism for organizing the unconditioned response to a punishment. We shall call this the “fight/flight” system’ (Gray, Reference Gray1971, p. 194; note that ‘punishment’ means three different things within this one quote).”
(McNaughton & Corr, Reference McNaughton, Corr and Corr2019, p. 129).
So “punishment” can control active avoidance, passive avoidance, and escape; or can be linked to linked to traits of fear-proneness or phobic avoidance or panic-proneness. Later, the BIS was clarified as the ‘goal conflict resolution’ system (activated by concurrent opposing approach and avoidance tendencies) controlling passive (as opposed to active) avoidance, arousal, attention, and risk assessment; and linked to high trait anxiety (Corr & McNaughton, Reference Corr, McNaughton, Beauchaine and Hinshaw2016).
4. “Rational” RST measures (rRST)
Much research investigating the relationship between personality traits and RST systems has used “rational” quasi-lexical approaches, representing the RST systems in self-report measures derived from experimenters’ expectations. We will refer to these rationally-derived measures as rRST. There is a wide range of noticeably different personality questionnaires for rRST (see Corr, Reference Corr2016 for review), and the rRST field has become muddled in assessment, which may impede the theory’s progress, not only for personality but psychopathology as a whole. Neural RST (nRST) is a multi-faceted theory that is difficult to condense down to rational, self-report scales that acknowledge the complexities involved in the theory and none have been validated via the underlying neurology or via the defining pharmacology. This has caused conflict within the literature and hindered comparison between studies (see Corr, Reference Corr2016 for review).
Carver and White’s (Reference Carver and White1994) BIS/BAS scales (C&W BIS/ C&W BAS) are the most commonly and widely used measures of rRST in personality (approaching 10,000 citations according to Google Scholar and 5,000 according to Web of Science). It should be noted that the C&W BIS scale was derived from Carver’s personal concept of “anxiety.” It contains no “behavioural inhibition” items but has 40% worry items. Critically, C&W BIS correlates with internalising disorders in general and is not specific to those disorders selectively sensitive to anxiolytic drugs (Griffith et al., Reference Griffith, Zinbarg, Craske, Mineka, Rose, Waters and Sutton2010). It shares 80% of its variance with NEO-PI-R Anxiety (which in turn shares 96% variance with Penn State Worry). It is, therefore, a worry scale that is not specific to Gray’s original neurally-defined BIS.
Heym et al. (Reference Heym, Ferguson and Lawrence2008) updated the use of the Carver and White’s scales in a way of particular relevance to the current study. They retained the original “BIS” items but split these into a BIS-anxiety scale and FFFS-fear scale to better match the neurology of Gray and McNaughton (Reference Gray and McNaughton2000). They retained the original BAS scale (which already consisted of 3 subscales and clearly did not match Gray’s neurology). Researchers using the updated scales to investigate psychopathy have found lower C&W BIS-anxiety and higher BAS scales to be associated with disinhibition-behavioural traits, deficient FFFS-fear and BIS-anxiety were associated with affective-interpersonal traits (Broerman et al., Reference Broerman, Ross and Corr2014; Hughes et al., Reference Hughes, Moore, Morris and Corr2012; Johnson et al., Reference Johnson, Sellbom and Phillips2014; Roose et al., Reference Roose, Bijttebier, Claes and Lilienfeld2011).
5. Neural RST measures (nRST)
McNaughton (Reference McNaughton2020) proposed a new nomenclature for the nRST systems to differentiate between rRST constructs and the neural structure sensitivities of nRST, described in Gray and McNaughton (Reference Gray and McNaughton2000) and further developed in the latest edition of the state theory (McNaughton & Gray, Reference McNaughton and Gray2024). Moreover, he emphasised the importance of employing neurobiological methodologies over rational/lexical measures to accurately capture the intended neurobiological constructs. Because Gray’s original RST is a neurobiological theory, it seems more fitting to explore the links between systems and personality using neural assessment rather than focusing solely on rational constructs based on “postulated roles.” We recognise that there may be practical barriers to this approach, and we need to acknowledge that the rational constructs are helpful in analysis. However, any difference between the questionnaire scales and the neural constructs must be determined and acknowledged. nRST is a neural theory that incorporates multiple levels of the brain, and proposes that each neural system controls multiple behaviours which depend on motivational distance (see Figure 1). This motivational distance depends both on, e.g., the physical level of threat (e.g. distance from a predator) and the trait sensitivity of the individual to threats in general.
The Interplay Between Micro and Macro Levels in the Brain of the RST Systems.
Note: Used with permission from McNaughton (2020) and abides by the copyright open policy of Oxford University Press. This figure presents the interplay between micro and macro levels concerning the motivational systems in the brain. repulsion refers to the goal repulsion system (GRS), conflict refers to the goal inhibition system (GIS) and approach refers to the goal attraction system (GAS). These systems are organised hierarchically and outlines the interplay between levels in the brain in response to appetitive and defensive distance of reinforcers. Hormonal compounds, such as benzodiazepine ligands and neuromodulators, interact with the systems. The gradation of purple shading in the figure refers to the capacity of serotonin to shift control from lower to higher levels of the systems.

Figure 1. Long description
A diagram of the brain’s response systems. The diagram is divided into three main columns labeled repulsion, inhibition, and attraction, and four rows labeled high order planning circuits, low order survival circuits, object general, and object specific. Each section contains labeled brain regions with their associated behaviors. The repulsion column includes regions like the orbitofrontal cortex (OFC) and amygdala, associated with deep obsession and avoidance. The conflict column includes regions like the hippocampus and cingulate, associated with risk aversion and rumination. The approach column includes regions like the OFC and amygdala, associated with approach and arousal. Arrows indicate the directional flow and interactions between these regions. The diagram also includes a gradient bar at the bottom labeled serotonin stability, indicating the role of serotonin in modulating these behaviors.
The theory has always involved three distinct neural systems, which from 2000 onwards were seen as having equivalent contributions. In 2020 they were renamed to match this: the Goal Attraction System (GAS), the Goal Repulsion System (GRS, previously FFFS), and the Goal Inhibition System (GIS). BAS, BIS-anxiety and FFFS-fear scales refer to rational/lexical descriptions of approach, passive avoidance, and active avoidance, respectively. In contrast, the GAS, GRS, and GIS, refer to neural constructs involving structures that control attraction, repulsion, and goal conflict (defined via anxiolytic drug action), respectively. Repulsion is sensitive to panicolytic drugs but not anxiolytic drugs. We provide neural measures of the trait sensitivities of these nRST systems.
6. Psychopathy and RST
There are long-standing theories about psychopathy that have used the concepts of reward (linked to GAS; approach), punishment (linked to GRS; active avoidance), and response inhibition (linked to GIS; passive avoidance/goal conflict). Specifically, psychopathic traits and behaviours have been explained through the out the literature by high sensitivity to reward (e.g., Bjork, Chen & Hommer, Reference Bjork, Chen and Hommer2012; Bjork, Knutson & Hommer, Reference Bjork, Knutson and Hommer2008; Bjork, Smith, Chen & Hommer, Reference Bjork, Smith, Chen and Hommer2010, Reference Bjork, Smith, Chen and Hommer2011; Buckholtz et al., Reference Buckholtz, Treadway, Cowan, Woodward, Benning, Li, Ansari, Baldwin, Schwartzman, Shelby, Smith, Cole, Kessler and Zald2010; Engelmann & Tamir, Reference Engelmann and Tamir2009), low sensitivity to punishment (see Patrick, Reference Patrick and Patrick2018 for review) and difficulties with response inhibition (see Gillespie et al., Reference Gillespie, Lee, Williams and Jones2022 for review). The explicit suggestion that a weak BIS was a key element of psychopathy was made many years ago (Fowles, Reference Fowles1980), but despite considerable discussion (McNaughton, pers. comm.) was never accepted by Gray and McNaughton.
In a previous published study (Dickison et al., Reference Dickison, Neo, McNaughton and Sellbom2024), we were the first to examine the associations between psychopathy measures and nRST constructs using EEG methodology. The GAS was operationalised through the Gold Bar / Lemon Task (Potts et al., Reference Potts, Martin, Burton and Montague2006), and the GIS and GRS were operationalised through the Shadli et al. (Reference Shadli, Glue, McIntosh and McNaughton2015) modification of the stop signal task (SST; Logan et al., Reference Logan, Cowan and Davis1984). Because the actions of anxiolytic drugs define the GIS, we used the well-established theta-frequency goal-conflict-specific-rhythmicity (GCSR; Neo et al., Reference Neo, Thurlow and McNaughton2011) to operationalise the GIS and goal-conflict. Although there are no direct biomarkers yet established for the GRS and GAS, we used EEG measures of sensitivities that input into each RST system. For the GRS, we used the EEG proxies that measure outcome conflict (P. S. H. Neo et al., Reference Neo, McNaughton and Sellbom2024) due to the GRS outlining active avoidance and response to negative reinforcers. For the GAS, we used dopamine-mediated reward-prediction-error (RPE; Wacker & Smillie, Reference Wacker and Smillie2015) due to the association between dopamine and engagement with positive reinforcers (DeYoung, Reference DeYoung2013).
We found that traits of psychopathic personality disorder may be associated with a dysfunction in the neural processes involved with the GRS and GIS, but there was no evidence of dysfunction involving the GAS. However, the effect sizes of our findings were small, and we observed an unexpected positive correlation between affective-interpersonal traits of psychopathy and the GRS. These results required further investigation and replication before any firm conclusions could be derived.
7. The current study
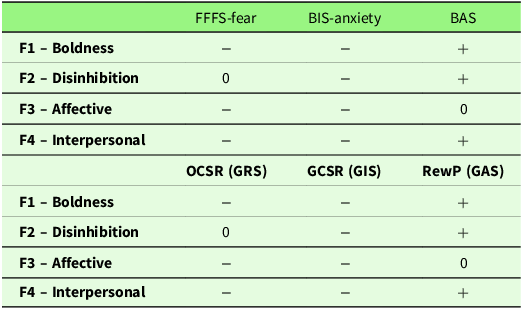
The goal of the current study was to further investigate the associations between psychopathy and neural RST, and specifically, to replicate and extend the findings in Dickison et al. (Reference Dickison, Neo, McNaughton and Sellbom2024) using a different population. We also considered the associations between psychopathy domains and the Heym et al. (Reference Heym, Ferguson and Lawrence2008) adaptation of Carver and White’s (Reference Carver and White1994) BIS/BAS scales to compare results between studies. As mentioned, there is a well-established literature that assesses psychopathy in terms of Carver and White’s (Reference Carver and White1994) BIS/BAS scales or other rational scales of RST. See Table 1 for hypothesised correlations.
Predicted zero-order correlations between the scores of the four-factor model of psychopathy with Carver and White’s (Reference Carver and White1994) BIS/BAS scales, and EEG measures associated with the RST constructs

Note: + = positive association hypothesised. − = negative association hypothesised. 0 = no association hypothesised. BIS = behavioural inhibition system. FFFS = fight, flight, freeze system. BAS = behavioural approach system. OCSR, outcome conflict specific rhythmicity (4–7 Hz); GCSR, goal conflict specific rhythmicity (4–7 Hz); RPE, reward prediction error; t2, 70–100 ms; t4, 200–300 ms. GRS = goal repulsion system, GIS – goal inhibition system, GAS = goal attraction system.
For associations with the C&W BIS/BAS scales, we expected positive associations between overall psychopathy and the C&W BAS scale as well as negative associations with the C&W BIS and C&W FFFS scales to align with the findings in Dickison et al., (Reference Dickison, Neo, McNaughton and Sellbom2024) and previous research findings (e.g., Broerman., Reference Broerman, Ross and Corr2014; Donahue & Caraballo, Reference Donahue and Caraballo2015; Hughes., Reference Hughes, Moore, Morris and Corr2012; Johnson et al., Reference Johnson, Sellbom and Phillips2014; Newman et al., Reference Newman, MacCoon, Vaughn and Sadeh2005; Roose et al., Reference Roose, Bijttebier, Claes and Lilienfeld2011; Ross et al., Reference Ross, Benning, Patrick, Thompson and Thurston2009; Satchell et al., Reference Satchell, Bacon, Firth and Corr2018; Uzieblo et al., Reference Uzieblo, Verschuere and Crombez2007; Wallace et al., Reference Wallace, Malterer and Newman2009). For associations with the specific psychopathy factors, we anticipated that the C&W BIS/BAS scales would follow the same associations as their neural parallels as reported below. Moreover, we hypothesised that Boldness would be negatively associated with the BIS-anxiety and FFFS-fear and positively with the BAS; Disinhibition would be positively associated with the BAS and negatively associated with the BIS-anxiety; Affective would be negatively associated with both the FFFS-Fear and BIS-anxiety; Interpersonal would be positively associated with the BAS, and negatively associated with the BIS-anxiety and FFFS-fear.
In the current study, we operationalised the GIS and GRS in the same way as reported in Dickison et al. (Reference Dickison, Neo, McNaughton and Sellbom2024); however, we used the doors task (Proudfit, Reference Proudfit2015) to operationalise the GAS and elicit attraction behaviours. The doors task elicits reward positivity (RewP), which also taps into reward processes definitive of the “dopaminergic” reward circuit (Becker et al., Reference Becker, Nitsch, Miltner and Straube2014; Carlson et al., Reference Carlson, Foti, Mujica-Parodi, Harmon-Jones and Hajcak2011; Foti et al., Reference Foti, Weinberg, Dien and Hajcak2011), indicating it is an appropriate input to the GAS.
We hypothesised that the Boldness factor would be associated positively with the GAS and negatively with the GIS and GRS. Boldness, within psychopathy, has been associated with personality traits such as extraversion and leadership (see Sleep et al., Reference Sleep, Weiss, Lynam and Miller2019 for meta-analysis). Aspects of boldness outlining extraversion, leadership, social dominance, and self-assurance describe approach and attraction behaviours prototypical to the GAS (Corr., Reference Corr, McNaughton, Beauchaine and Hinshaw2016; Gray & McNaughton, Reference Gray and McNaughton2000; McNaughton & Gray, Reference McNaughton and Gray2024). Moreover, the GRS and GIS are neural systems of fear and anxiety, respectively, and boldness has been negatively associated with both constructs (see Lilienfeld et al., Reference Lilienfeld, Watts, Smith, Latzman and Patrick2018 for review).
We hypothesised that the Disinhibition factor would be associated positively with GAS and negatively with GIS. The Disinhibition factor describes an overall externalising proneness, reflecting antisocial and impulsive aspects of psychopathy. Behavioural aspects of psychopathy are often associated with higher levels of anxiety than affective-interpersonal aspects (see Derefinko, Reference Derefinko2015 for review) and are characterised by behavioural manifestations representing excessive approach (e.g., impulsivity).
We hypothesised that the Affective factor would be associated negatively with both the GIS and GRS. The Affective factor represents the traits of psychopathy typically referred to as ‘callous-unemotional’, quintessential for Factor 1 of the PCL-R and primary psychopathy (e.g., Sellbom & Drislane, Reference Sellbom and Drislane2021). As mentioned, researchers have consistently found that affective traits of psychopathy are associated with low levels of anxiety (see Derefinko, Reference Derefinko2015 for review).
We hypothesised that the Interpersonal factor would be negatively associated with the GRS and GIS and positively with the GAS. Finally, the Interpersonal factor describes someone as dominant, manipulative, and deceitful towards others. Cluster analysis studies have found that interpersonal domains of psychopathy often differentiate primary from secondary psychopathy, with higher interpersonal callousness traits more closely aligning with primary psychopathy (Swogger & Kosson, Reference Swogger and Kosson2007; Vassileva et al., Reference Vassileva, Kosson, Abramowitz and Conrod2005). In addition, primary psychopathy is associated with lower fear and anxiety levels compared to secondary psychopathy (Hofmann et al., Reference Hofmann, Schneider and Mokros2021). Dominance in social interactions with manipulation and deceit reflects excessive approach behaviours reflective of the GAS (Corr & McNaughton, Reference Corr, McNaughton and Corr2019).
8. Methods
This study was not preregistered. We report below how we determined our sample size, all data exclusions, all manipulations, and all measures in the study.
8.1. Participants
Participants were recruited from a community sample in Dunedin, New Zealand, aimed towards individuals with symptoms of psychopathy as part of a wider project. A total of 250 participants were recruited. In a series of separate advertisements, we asked for people with one or more of the following features: (1) drug, alcohol, or anger management problems, (2) ADHD or impulsivity difficulties, (3) having criminal convictions, (4) having been suspended or expelled from school, (5) with one or more of the following characteristics: charming, good at manipulating or ‘conning’ people, good at taking care of number one, carefree, would do anything for a dare, and adventurous.
Our original grant proposal was for 240 people, based on a power analysis. Since 0.80 power to detect a 0.20 association at α = 0.05 requires 191 people; multiple regression analysis with three predictors, minimum R 2 = 0.05 (based on pilot effect sizes), and 0.80 power, requires 212 participants. A Monte Carlo simulation indicated that, to confirm the latent factor structure of psychopathy, all parameters would be associated with 0.90+ power at n = 240.
Of the 250 participants recruited, 19 participants were excluded due to deviant or inconsistent responses on the Minnesota Multiphasic Personality Inventory – 3 (MMPI-3; Ben-Porath & Tellegen, Reference Ben-Porath and Tellegen2020) profiles based on scores on Cannot Say ≥ 15, Combined Response Inconsistency, variable response inconsistency, or true response inconsistency ≥ 80T, and/or infrequent response (F) or infrequent psychopathology responses (Fp) ≥ 100T – with the final sample consisting of 231 participants. Of these, 54% were male, 45% female, and 0.9% were non-binary between 18 and 53 years old. Ethnicity represented a generic New Zealand community sample (65% NZ European, 17% Other European, 14% Māori, 12% Asian, 8% Pacific Islander, 7% Other Descent). The study used different data pools for each measure of RST due to EEG artefacts rendering some data unusable (described in more detail below). The University of Otago Ethics Committee (Health) issued ethical approval (approval number: H20/037).
8.2. Measures
8.2.1. Psychopathy measures
We measured psychopathy with a multi-method framework, using self-report and clinician-rated instruments. Clinician-rated measures of psychopathy included the Psychopathy Checklist: Screening Version (PCL:SV; Hart et al., Reference Hart, Cox and Hare1995) and the Comprehensive Assessment of Psychopathic Personality: Symptom Rating Scale (CAPP-SRS; Cooke et al., Reference Cooke, Hart, Logan and Michie2012). Four research assistants carried out clinical ratings, so we investigated the consistency of agreement between raters. For a small subsample (n = 25), two clinical research assistants completed independent clinical ratings. Inter-rater reliability was calculated via intra-class correlations (ICC) for each clinician-rated measure by using a two-way random model (absolute agreement). Self-report measures of psychopathy used were the Triarchic Psychopathy Measure (TriPM; Patrick, Reference Patrick2010) and the CAPP-Self Report (CAPP-SR; Sellbom et al., Reference Sellbom, Cooke and Shou2019).
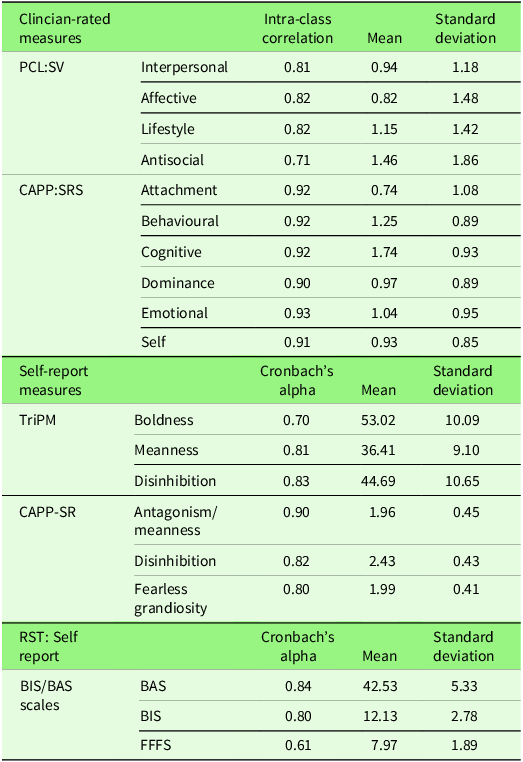
Table 2 reports the reliability coefficients for each measure. Cronbach’s alpha is generally considered acceptable at 0.7 and good at 0.8 (Nunnally, Reference Nunnally1967). The only unacceptably low score is for BIS/BAS-FFFS, but the scale is very brief, and alpha disproportionately penalises short scales.
Reliability coefficients for scale scores for clinician-rated and self-report measures

Note: PCL: SV = Psychopathy Checklist: Screening Version. CAPP: SRS = Comprehensive Assessment of Psychopathic Personality: Symptoms Rating Scale – the current study used the Clinical Interview. TriPM = Triarchic psychopathy measure. CAPP-SR = Comprehensive Assessment of Psychopathic Personality: Self-Report. MMPI-3 = Minnesota Multiphasic Personality Inventory – Third Edition. Intra-class correlations (ICC) are all (p ≤ .001).
We operationalised psychopathy via Dickison and Sellbom’s (Reference Dickison and Sellbom2026) four-factor model representing factors of affective, interpersonal, disinhibition, and boldness. Dickison and Sellbom’s (Reference Dickison and Sellbom2026) model was derived through exploratory structural equation modelling on the psychopathy measures listed above, while controlling for method variance.
8.2.2. RST measures: self-report
BIS/BAS Scales. We used Heym et al. (Reference Heym, Ferguson and Lawrence2008) updated Carver and White’s (Reference Carver and White1994) BIS/BAS scales to measure RST via self-report. The BIS/BAS scales are a 20-item self-report measure whereby a participant scores the degree that a statement is true or false for them on a 4-point Likert scale. Heym et al. (Reference Heym, Ferguson and Lawrence2008) updated version of Carver and White’s (Reference Carver and White1994) BIS/BAS scales consist of the BIS-anxiety scale (4 items), the FFFS-fear scale (3 items), and the BAS scale (13 items). Subsequent research has confirmed and supported these scales (e.g., Beck et al., Reference Beck, Smits, Claes, Vandereycken and Bijttebier2009; Dissabandara et al., Reference Dissabandara, Loxton, Dias, Daglish and Stadlin2012; Poythress et al., Reference Poythress, Skeem, Weir, Lilienfeld, Douglas, Edens and Kennealy2008).
8.2.3. RST measures: neural
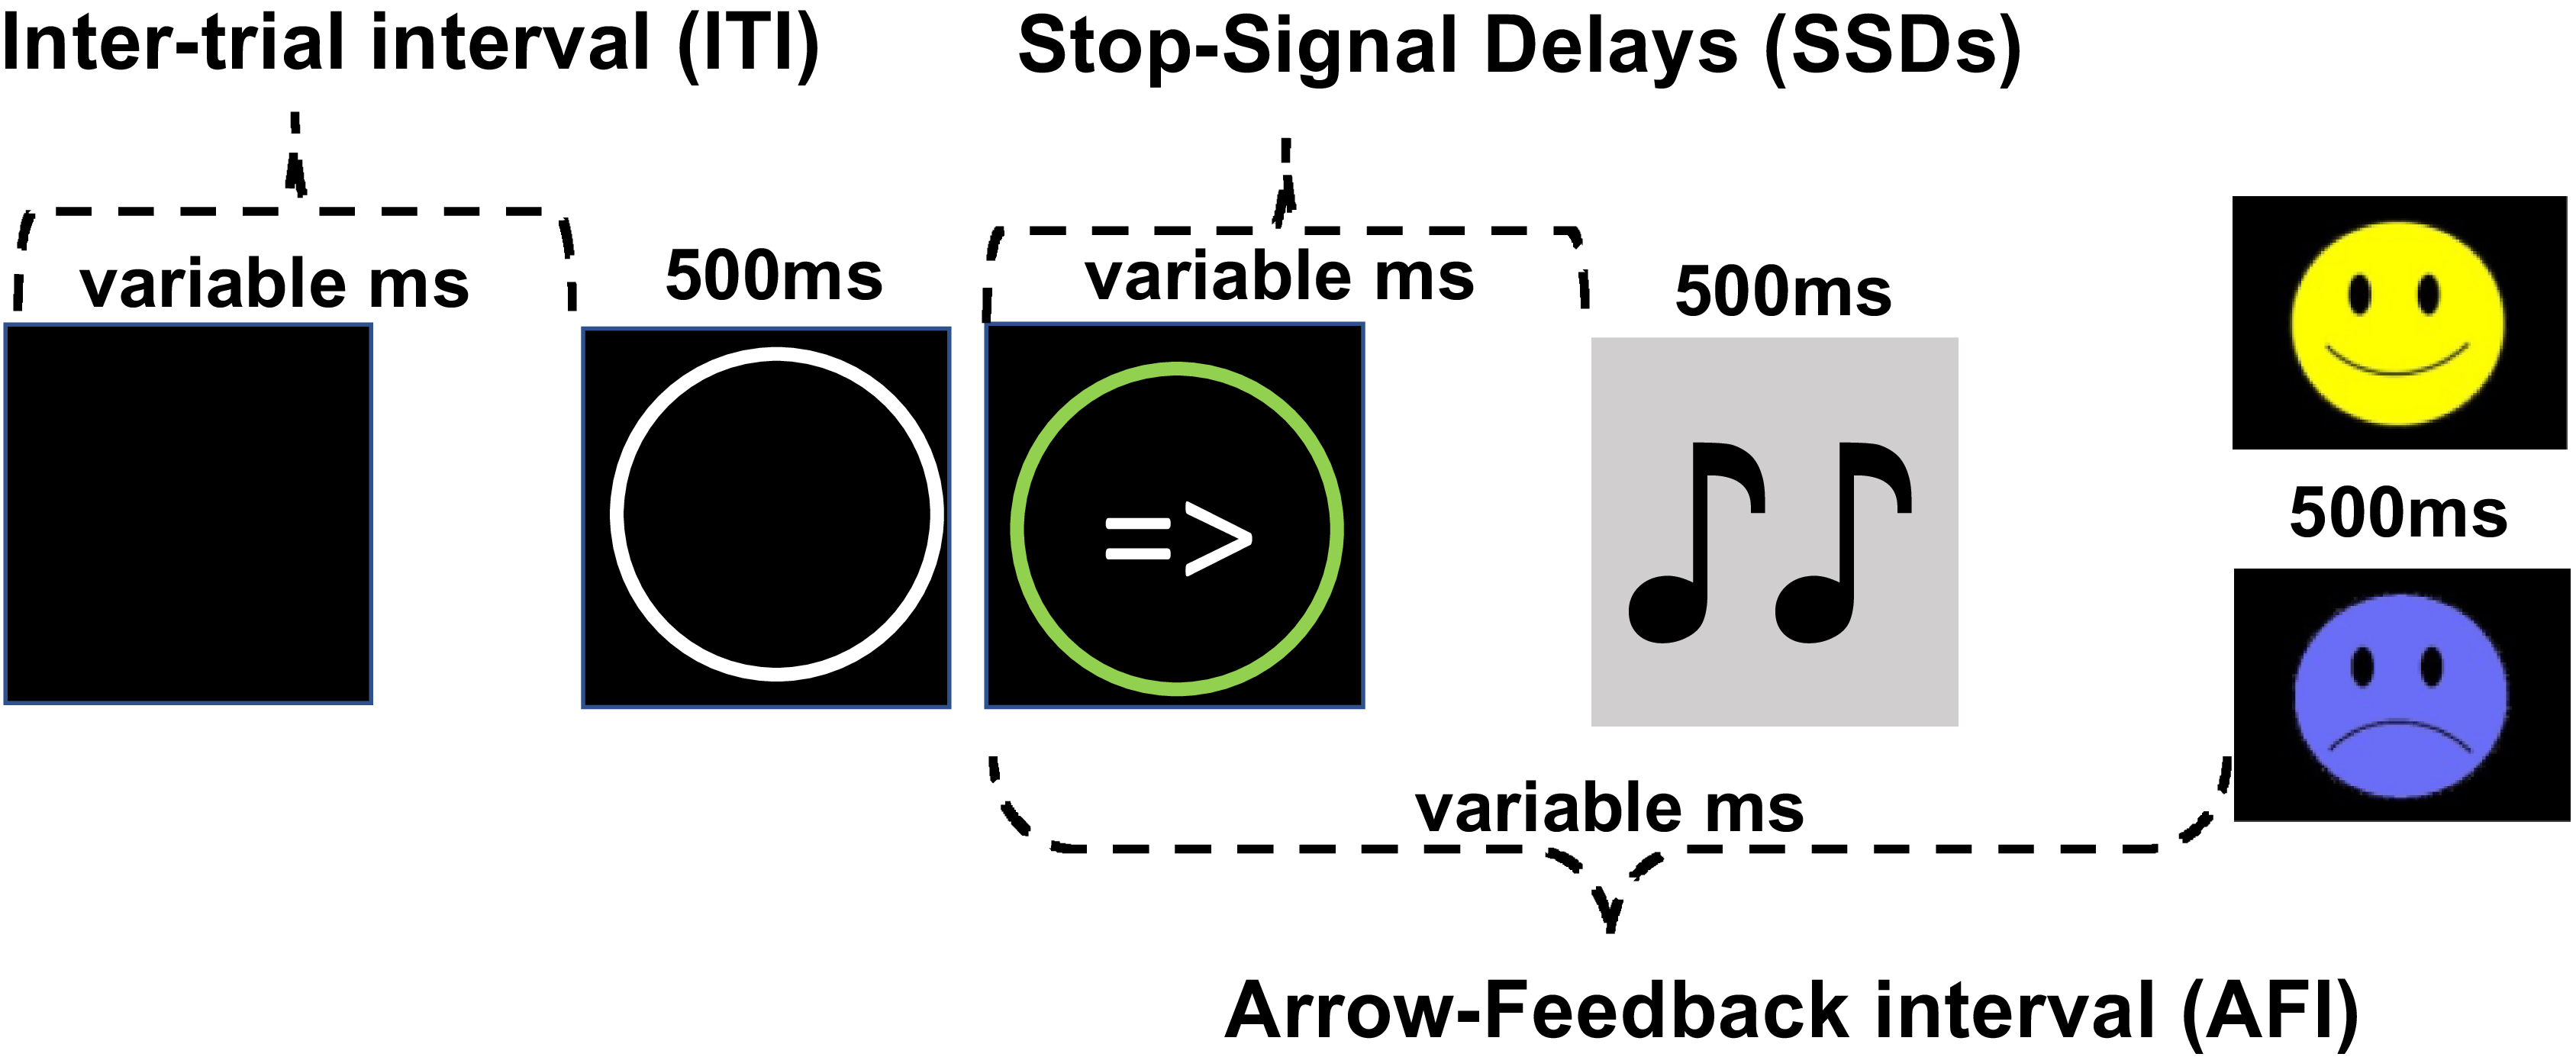
Stop Signal Task (SST). Footnote 1 The current study used the Shadli et al. (Reference Shadli, Glue, McIntosh and McNaughton2015) modified version of the Aron and Poldrack (Reference Aron and Poldrack2006) SST task. The modified SST task consists of both STOP and GO trials, as shown in Figure 2. During a GO trial, participants are shown a left or right arrow and must respond by making a corresponding left or right mouse click. In a STOP trial, after the arrow appears, a tone signals the participant to withhold their mouse click. STOP trials occur intermittently, with each STOP trial being counterbalanced by three GO trials (the sequence was fixed for all participants). The stop-signal delay (SSD) controls the interval between the presentation of the arrow and the tone. As SSD increases, the likelihood of failing to inhibit the response increases. If participants successfully or unsuccessfully inhibit their response, a happy or frowny face (GRS) provides feedback on the screen. Separate staircases were used to distribute STOP trials with varying delays – short, medium, and long. The short and long staircases adjusted the SSD based on recent reaction times during GO trials, while the medium staircase adjusted the SSD up or down by 30 ms depending on whether the participant stopped successfully, maintaining a balance of 50% correct stopping. GIS was assessed via the conflict-specific difference between the medium trials and the average of short and long. Before starting the test trials, participants completed 30 GO-only practice trials. The main test included 99 STOP and 296 GO trials across three blocks, with no breaks between blocks.
The Stop Signal Task (SST). The sequence of events in a trial. This figure is taken from our previous paper, Dickison (Reference Dickison, Neo, McNaughton and Sellbom2024), as both studies used the same task. The sequence of events in a trial. For a stop trial, the onset of the tone from the time that the arrow is presented (SSDs) are variable. The same event sequence follows for a Go trial, but without the onset of a tone. A smiley is presented for a successful withholding the mouse click, and a frowny is presented for an unsuccessful withholding of the mouse click in a Stop trial. A smiley/frowny is presented for correct/incorrect responses in a Go trial. ms: milliseconds; ITI: 500 ms to 4000 ms; AFI: Go correct = 100 mss; stop fail = 1500 ms; stop correct = 1700 ms. SSDs: the time between when the arrow and tone are presented.

The Doors Task. The Doors Task was developed by Proudfit (Reference Proudfit2015) to elicit responses to losses and gains to measure reward positivity (RewP). The Doors Task elicits reward prediction (RewP), that occurs in response to stimuli. RewP both taps into reward processes and is associated with the “dopaminergic” reward circuit (Becker et al., Reference Becker, Nitsch, Miltner and Straube2014; Carlson et al., Reference Carlson, Foti, Mujica-Parodi, Harmon-Jones and Hajcak2011; Foti et al., Reference Foti, Weinberg, Dien and Hajcak2011) theoretically linked to approach motivation traits (DeYoung, Reference DeYoung2013; Neo et al., Reference Neo, McNaughton and Sellbom2021; Wacker & Smillie, Reference Wacker and Smillie2015; Zisner & Beauchaine, Reference Zisner, Beauchaine, B.T. and H.S.2015).
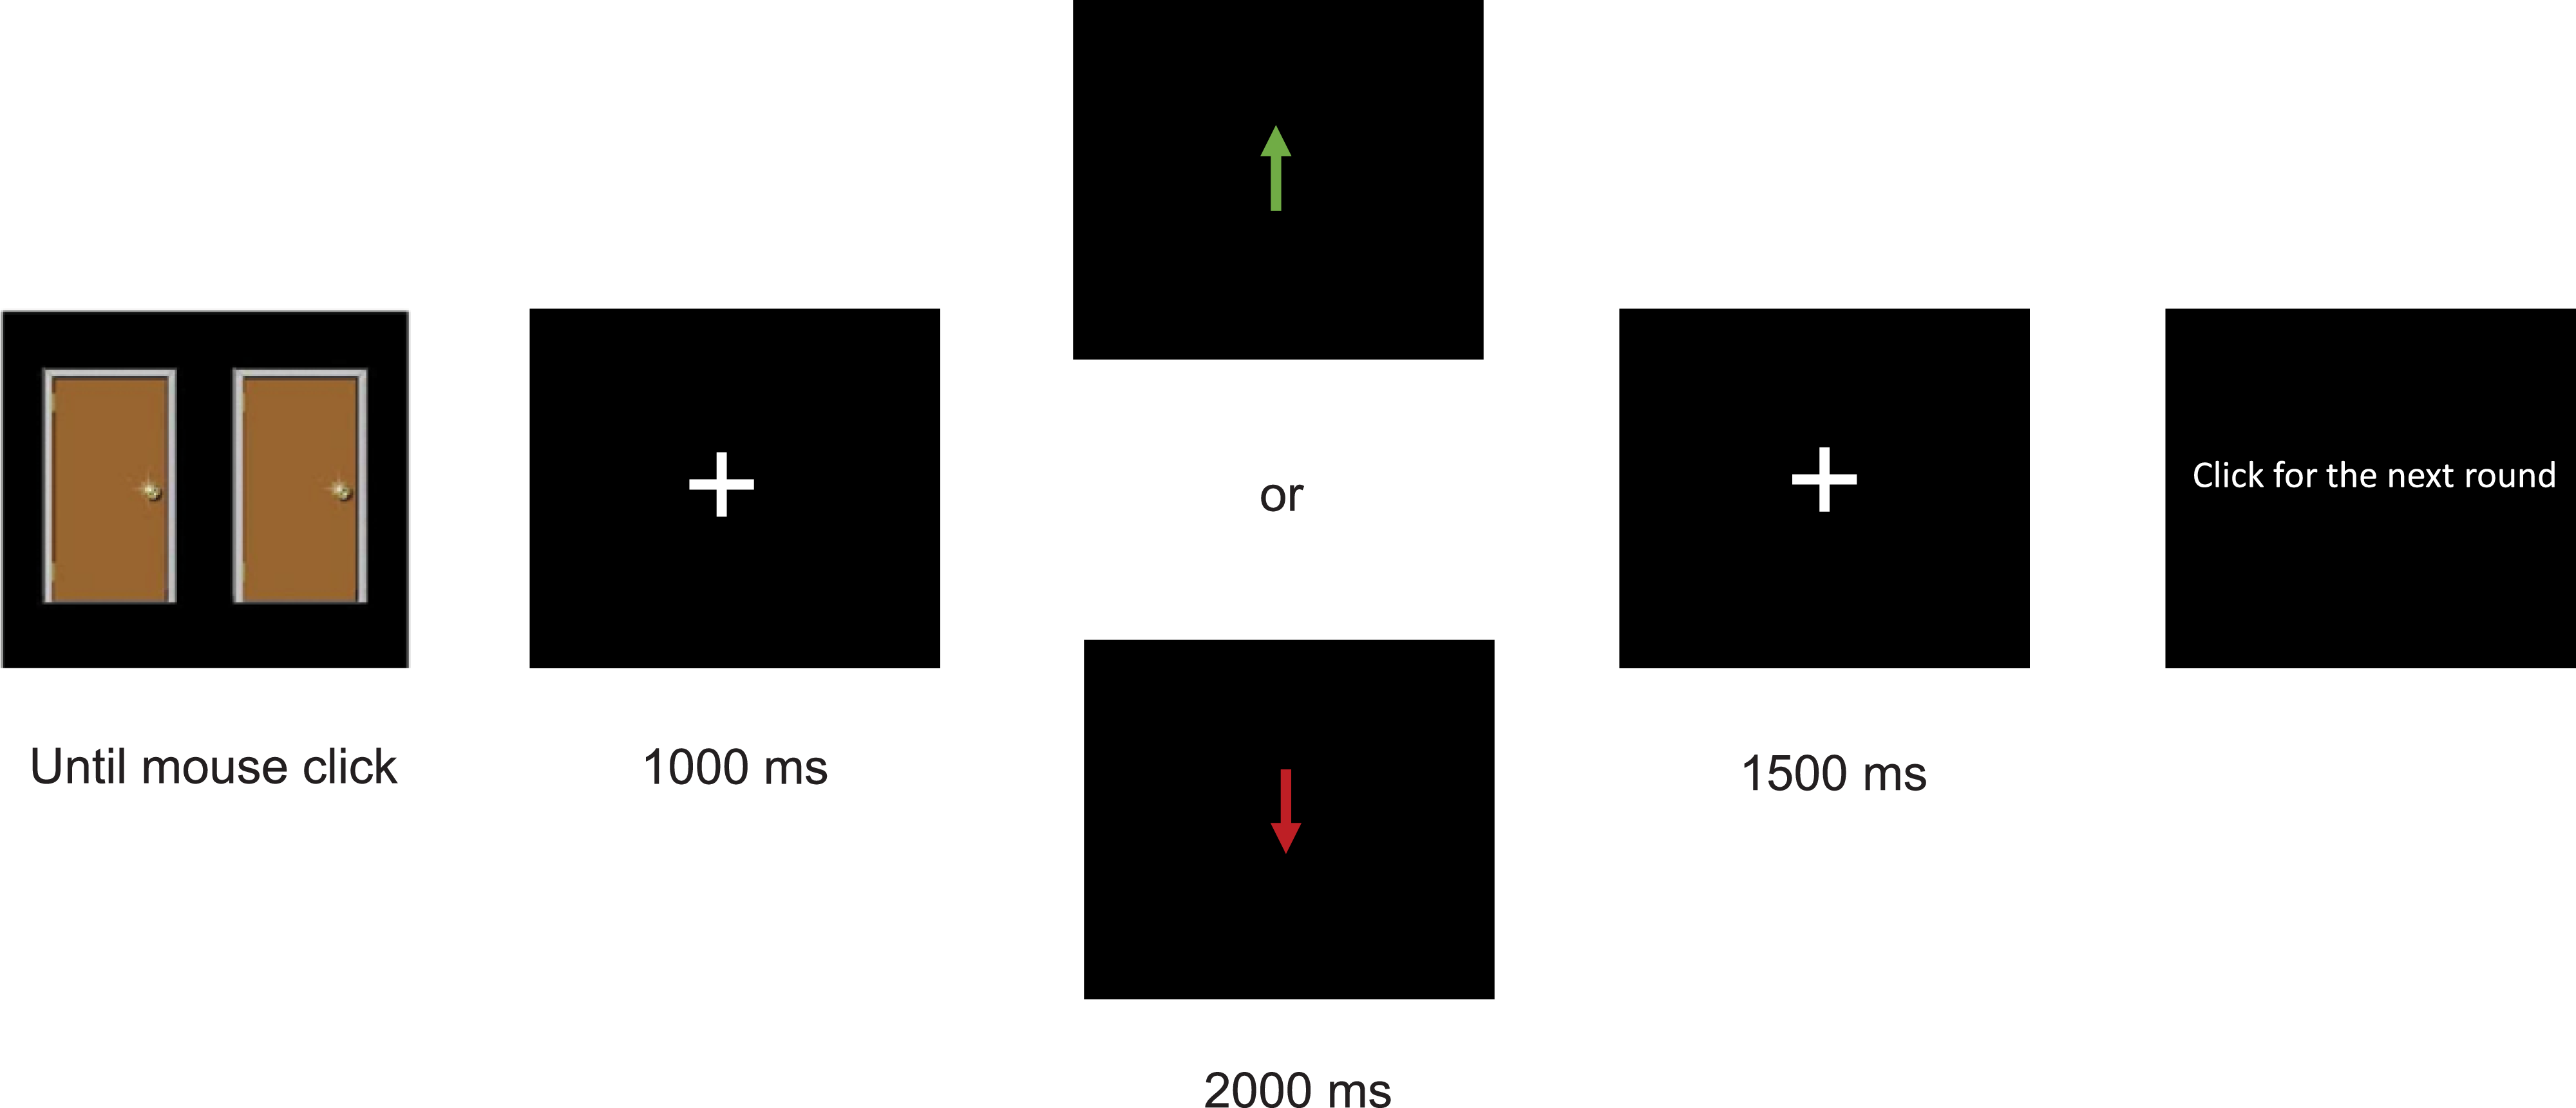
The Doors Task consists of 40 trials. On each trial, the participant is presented with two doors (see Figure 3), requiring them to make a left or right mouse click to select the left or right door, respectively. Once clicked, they are presented with a feedback arrow indicating whether they selected the correct door. An upward arrow indicated a gain of 50 cents, and a downward arrow indicated a loss of 25 cents. Participants were told they would keep the amount accumulated over all trials if there was a net gain; however, a net loss would have no consequences.
Visual representation of the sequence of events in the Doors Task.
Note: This figure demonstrates the sequence of events in a trial of the doors task. Green upwards arrow indicates they won money, red downwards arrow indicates that they lost money. ms = milliseconds.

The participants were unaware that the monetary outcomes were predetermined, with 20 gain and 20 loss trials counterbalanced and consistent across participants. Participants experienced the same sequence of outcomes regardless of which door they chose and were awarded $5 for the task.
8.2.4. EEG acquisition and processing
All EEG was recorded through an advanced neuro technology (ANT) amplifier at 1,024 Hz with ANT caps and AgCl electrodes. Impedances were kept below 10 KΩ as measured by ANT software (eego). EEG recording was referenced to CPz and sampled at 512 Hz from FP1, FPz, FP2, F7, F3, Fz, F4, F8, T7, T8, C3, Cz, C4, P7, P3, Pz, P4, P8, M1 and M2. The data were processed via Matlab 2019a plugins EEGlab (version 2019_0) and ERPlab (version 7.0.0).
The SST task. The EEG data for the SST task was segmented from the start of the first test trial to the end of the last one and filtered between 1 and 36 Hz using the function pop_eegfiltnew(). Eye movement components were identified via independent component analysis (ICA) run through the function runamica15(spectral power estimates) on all recording channels. Blink components were automatically removed using pop_icflag() with a 90% similarity threshold. Two 1.5-second EEG segments were extracted from each trial, centred at the onset of the Stop-Signal and at the mouse-click response. The pop_eegthresh() function removed any epochs where EEG activity exceeded ±70 µV at any sensor. Two consecutive 1-second Hanning windows, overlapping by 0.5 s, were applied to each 1.5-second segment, resulting in two 1-second epochs. The Hanning window cosine function reduced the weighting of edge data within an epoch. Spectral amplitude was extracted from each 1-second epoch using the fft() function, squared to obtain spectral power, and log-transformed to normalise the power distribution.
The Hanning window provided spectral power estimates weighted towards the central 0.5 s of each 1-second segment. The second segment of each pair was used to focus on: (1) the 0.5 s following the initial presentation of the Stop-Signal (goal-conflict; GIS), and (2) the 0.5 s after error feedback (GRS). The 0.5 s before these events and after the mouse click were excluded from the analysis. Goal-conflict-related changes in theta rhythmic activity (GIS) have been consistently observed at the right-frontal electrode (F8) (Corr et al., Reference Corr, McNaughton, Beauchaine and Hinshaw2016; Neo & McNaughton, Reference Neo and McNaughton2011; Neo et al., Reference Neo, Thurlow and McNaughton2011; Reference Neo, Tinker and McNaughton2020; Shadli et al., Reference Shadli, Ando, McIntosh, Lodhia, Russell, Kirk and McNaughton2021), while outcome-conflict-related changes (GRS) have been seen at the mid-frontal electrode (Fz) (Cohen, Reference Cohen2011; Pasion & Barbosa, Reference Pasion and Barbosa2019; Yeung et al., Reference Yeung, Botvinick and Cohen2004; Zavala et al., Reference Zavala, Tan, Ashkan, Foltynie, Limousin, Zrinzo and Brown2016). We, therefore, analysed theta activity at both electrode locations for each system to aid comparisons across systems.
For both goal-conflict (GIS) and outcome-conflict (GRS), the theta power during the corresponding time in a preceding GO trial was subtracted from the theta power in the STOP trial (if the preceding trial was also a STOP trial, the following GO trial was used). For the goal-conflict contrast (GCSR), the average STOP-GO theta power difference for early and late SSDs was subtracted from that of medium SSDs to calculate residual theta power. This residual theta power reflects reactivity to goal-conflict, driven by the balance between stop and go processes when stopping success occurs ∼50% of the time. As stopping is easier in early delay trials and harder in late delay trials, goal-conflict reactivity should peak in medium SSD trials. Trials were excluded if they had too few trials in any response blocks due to excessive EEG noise.
The outcome-conflict (GRS) contrast (OCSR) was calculated from the 0.5-second periods following the mouse-click in both STOP and GO trials. Only GO trials with mouse-clicks and STOP trials with mouse-clicks (indicating outcome conflict) were averaged, so the trials only differed based on whether the response was correct (GO trial) or incorrect (STOP trial). Participants with fewer than 15 trials in each block were excluded.identified three main issues that potentially
The Doors Task. The EEG data for the Doors Task were extracted and resampled from 1,024 to 512 Hz. The data were then bandpass filtered (1–36 Hz) using the pop_eegfiltnew() function before we used the runamica15() function for independent component analysis (ICA; Winkler et al., Reference Winkler, Debener, Müller and Tangermann2015). Eye component artefacts were automatically removed using the pop_icflag() function. Components with >90% similarity to eye components were removed. Following artefact removal, the data was re-referenced to the average of all EEG sensors (i.e. excluding M1 and M2; and after removal of EOG components), and epochs ranging from −1,200 ms to + 1800 ms from the onset of the arrow in the task were extracted. Linear drifts in the data were removed by applying the detrend() function to each epoch. Each epoch was segmented from −200 to + 800 ms from the onset of the arrow. Epochs were rejected if their signals were larger than −70/ + 70μV. Participants were also excluded from the analyses if they had less than five trials on average. The total number of participants in the doors task was 210.
8.3. Procedure
Participants first completed a battery of self-report questionnaires that were involved in a larger study. The questionnaires were delivered on a computer via Qualtrics and included the BIS/BAS scales, MMPI-3, TriPM, and CAPP-SR, among several others. While the participants completed the battery of self-report measures, the experimenter fitted the EEG cap, applied electro-gel, and reduced the impedance of the EEG cap sufficiently. The participants then completed a series of EEG tasks delivered via computer that included the SST (∼25 minutes) and the doors task (∼5 minutes), among others not used in the current study. After the participants completed the EEG tasks, a research assistant, enrolled in (or completed) a clinical psychology programme, administered a series of structured interviews (CAPP-SRS, PCL-SV, criminal history, substance use modules) under the supervision of a registered clinical psychologist. Participants were reimbursed for their time with a $75 supermarket voucher and up to $10 from winnings in the EEG tasks.
8.4. Data analysis
8.4.1. Initial replication
First, zero-order correlations were calculated between each psychopathy factor and the self-report BIS/BAS scales. A correlation of medium effect size (r ≥ |.30|) was considered meaningful. We used this threshold due to potential inflation in the correlations from non-construct related reasons (e.g., social desirability) due to the shared method variance across self-report measures. We applied Bonferroni correction to any significant association values adjusting for the total number of possible pair-wise comparisons.
Next, we investigated zero-order correlations between the four-factor psychopathy factor model and neural measures of RST. An a priori alpha level of 0.05 (two-tailed) was used for statistical significance to indicate evidence of an association rather than reliance on a medium-sized effect due to the lack of shared method variance between measures, as well as the magnitude of effect sizes that one typically observes across self-report and neural measures (e.g., Neo, McNaughton, et al., Reference Neo, McNaughton and Sellbom2024; Neo, Shadli, McNaughton & Sellbom, Reference Neo, Shadli, McNaughton and Sellbom2024). If there were any instances where at least two of the psychopathy factors were meaningfully associated with an RST measure, we planned to conduct linear regression analysis to determine which psychopathy factors were uniquely associated with the neural RST measure.
8.4.2. Post hoc analysis
As a result of null findings between psychopathy factors and neural RST constructs, described in the results section below, we decided on a series of unplanned post-hoc analyses for further investigation. The rationales for these post hoc analyses are reported in the results section. The EEG data and processing procedures for the SST and index of GIS (GCSR) and GRS (OCSR) followed the methodology outlined in the Methods section. However, instead of averaging the data over 4–7 Hz frequency range, we extracted the data at individual frequencies within the broader range of 3–13 Hz (theta and alpha).
For the GIS and GRS, a series of repeated measures ANOVAs were conducted with within-subjects factors of electrodes (Fz and F8) and frequency (3–13 Hz) and with a between-subjects factor of psychopathy. For the GAS, the repeated measures ANOVA used within-subjects factor as the time points (t1, t2, t3, t4, t5), and the between-subjects factor as the psychopathy grouping. Psychopathy groups were extracted for each of the four factors separately by splitting participants into groups with low, medium, and high psychopathy scores (relative to the sample), while aiming for an equal number of participants in each group.
8.3 Results
8.3.1. Zero-order correlations and regression analysis
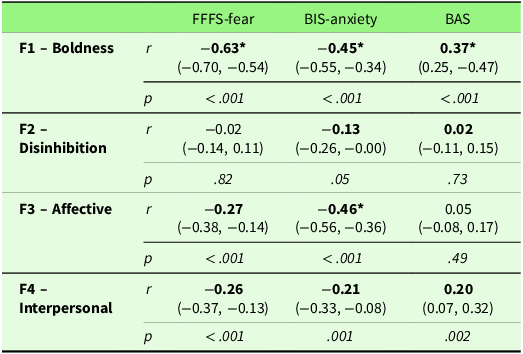
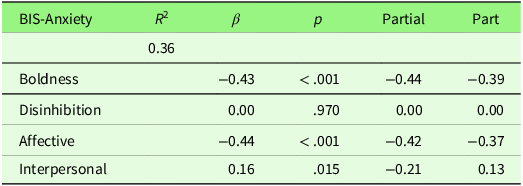
Table S1 in the Supplementary Materials presents correlations between all measures. Figure S1 in the Supplementary Materials shows scatterplots of any significant zero-correlations. Here, we will report on the findings that are directly relevant to the research aims. Table 3 shows bivariate correlations between the psychopathy factors and Carver and White’s (Reference Carver and White1994) BIS/BAS scales. A meaningful positive correlation (≥ |.30|) was observed between Boldness and the BAS scale. Negative correlations with BIS-anxiety were observed for both Boldness and Affective factors. Boldness was also negatively associated with FFFS-fear. To control for the risk of Type I errors due to multiple comparisons, we applied a Bonferroni correction by dividing the significance level by the number of tests conducted (0.05 / 12 = 0.004). These associations all remained significant after correction. Multiple regression analysis between psychopathy factors and the BIS-anxiety scale found that both Boldness and Affective factors contributed equally to the prediction of BIS-anxiety (see Table 4 for multiple regression results), with a suppression effect from the Disinhibition factor (part correlation = 0.00) on the Interpersonal factor (zero-order correlation = −0.21, part correlation = 0.13).
Zero-order correlations between the scores of the four-factor model of psychopathy and Carver and White’s (Reference Carver and White1994) BIS/BAS scales

Note: Correlations in bold were hypothesised. 95% Confidence intervals are in parenthesis. BIS = Behavioural inhibition system. FFFS = fight, flight, freeze system. BAS = Behavioural approach system. * = Correlation is of at least a medium effect size (0.30 or above).
Multiple regression analysis with the four psychopathy factors entered to predict Carver and White’s (Reference Carver and White1994) BIS-anxiety scale. Simple correlations are shown in Table 1

Note: p = significance. β = beta weight. R 2 = coefficient of determination. Partial = partial correlations (r). Part = part correlations (r).
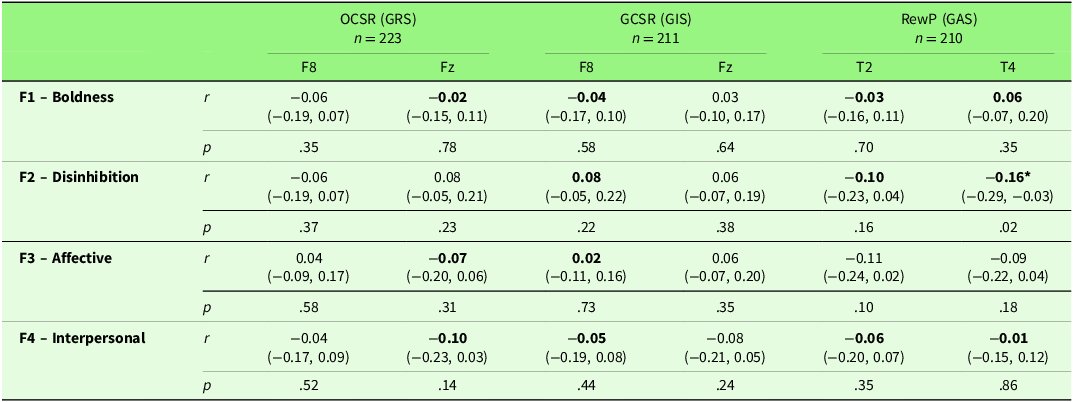
Table 5 reports correlations between psychopathy factors and neural measures of RST. There was one meaningful correlation between RewP and Disinhibition, but this finding was no longer significant after applying a Bonferroni correction to account for multiple comparisons. Given the critical p-value (.05) and the 16 tests conducted, the p-value of .02 was no longer significant after the adjusted significance level (0.05 / 16 = 0.0031). No meaningful correlations were found between any other psychopathy factor and neural RST measures.
Zero-order correlations between scores on the four-factor model of psychopathy and EEG measures associated with RST constructs

Note: Correlations in bold are hypothesised. 95% Confidence intervals are in parenthesis. OCSR, outcome conflict specific rhythmicity (4–7 Hz); GCSR, goal conflict specific rhythmicity (4–7 Hz); RPE, reward prediction error; t2, 70–100 ms; t4, 200–300 ms. GRS = goal repulsion system, GIS – goal inhibition system, GAS = goal attraction system. * = Correlation is significant at the 0.05 level (2-tailed).
Limitations of planned analyses. We identified three main issues that potentially indicate methodological limitations in the initial analysis.
First, by using bivariate correlation analysis, we assumed a linear relationship between psychopathy factors and neural RST indices. If a nonlinear relationship exists, the correlational analysis may fail due to inflation of the error component by the non-linearity.
Second, we averaged the data over 4–7 Hz for correlation analysis with the SST task and the GIS and GRS investigation. Averaging over 4-7 Hz may dilute the specificity of the analysis and, in turn, lose variations of patterns specific to particular frequencies. Indeed, research by McNaughton et al. (Reference McNaughton, Swart, Neo, Bates and Glue2013) found GCSR (the EEG biomarker for the GIS) within the range of 5–10 Hz with a peak at approximately ∼8 Hz. In addition, while there is evidence that theta is relevant within personality types with high extraversion and low neuroticism, personality traits, such as those involving behavioural inhibition (e.g., trait anxiety), are not linked exclusively to theta but also delta, alpha, and gamma (see Mitchell et al., Reference Mitchell, McNaughton, Flanagan and Kirk2008 for review).
Third, we limited the analysis within the Doors Task when investigating the GAS to time 2 (t2; 70–100 ms) and time 4 (t4; 200–300 ms) based on previous findings indicating that it is at these times where fundamental phasic dopamine components peak (Neo et al., Reference Neo, McNaughton and Sellbom2021; Redgrave & Gurney, Reference Redgrave and Gurney2006; Schultz, Reference Schultz2016; Schultz et al., Reference Schultz, Stauffer and Lak2017). Additionally, Neo et al. (Reference Neo, McNaughton and Sellbom2021) reported positive correlations between Carver and White’s (Reference Carver and White1994) BAS scale and t2 and t4 in the same population of participants as in Dickison et al. (Reference Dickison, Neo, McNaughton and Sellbom2024). However, key differences between the populations of interest may influence peaks within these time frames to vary between populations. Dopamine release patterns can vary across individuals and populations due to several factors such as genetic differences, neurobiological diversity, and environmental influences; therefore, using time points identified in one population may not generalise to another (Marinelli & McCutcheon, Reference Marinelli and McCutcheon2014), especially without several replications of the same finding.
In the post-hoc analysis, we explored nonlinear relationships across diverse frequencies for GIS and GRS and various times for GAS. This analysis will help to understand better the relationship between psychopathy factors and neural RST constructs.
8.3.2. Repeated measures ANOVA
Goal Inhibition System (GIS) – GCSR. Figure 4 presents the EEG power (log µV2) for the disinhibition group on GCSR at electrodes Fz and F8. A significant main between-subjects effect of the disinhibition group was observed (F(2, 209) = 4.12, p = .02), most evident at electrode F8 (electrode × group F(2, 209) = 3.51, p = .03). The high disinhibition group elicited higher levels of GCSR than the medium and low disinhibition groups in the 5–7 Hz frequency range (frequency [order 8] x group F(2, 209) = 3.32, p = .04).
EEG power of disinhibition groups on GCSR at Fz and F8.
Note: The Y axis represents the EEG power (log µV2) for the GIS (GCSR) measure. Disinhibition groups are: low (blue); medium (green; and high (orange). The X-axis is the frequency (Hz). A. Findings at Fz. B. findings at F8. The F8 group difference is significant (see text). Error bars represent standard error.

Figures 5–7 present the EEG power (log µV2) for boldness, affective, and interpersonal groups on GCSR at electrodes Fz and F8. No group or group × frequency differences were statistically significant.
EEG power of boldness groups on GCSR at Fz and F8.
Note: The Y axis represents the EEG power (log µV2) for the GIS (GCSR) measure. Boldness groups are: low (blue); medium (green; and high (orange). The X-axis is the frequency (Hz). A. Findings at Fz. B. findings at F8. Error bars represent standard error.

EEG power of affective groups on GCSR at Fz and F8.
Note: The Y axis represents the EEG power (log µV2) for the GIS (GCSR) measure. Affective groups are: low (blue); medium (green; and high (orange). The X-axis is the frequency (Hz). A. Findings at Fz. B. findings at F8. Error bars represent standard error.

EEG power of Interpersonal Groups on GCSR at Fz and F8.
Note: The Y axis represents the EEG power (log µV2) for the GIS (GCSR) measure. Interpersonal groups are: low (blue); medium (green; and high (orange). The X-axis is the frequency (Hz). A. Findings at Fz. B. findings at F8. Error bars represent standard error.

Goal Repulsion System (GRS) – OCSR. Figure 8 presents the EEG power (log µV2) for the disinhibition group on OCSR at electrodes Fz and F8. The high and medium disinhibition groups were significantly higher on OCSR than the low group across 5–8 Hz at electrode Fz but not F8 (group × electrode × frequency[cubic], F(2, 221) = 4.91, p = .01). See figure 9 for the interaction effects for disinhibition groups on OCSR.
EEG power of disinhibition groups on OCSR at Fz and F8.
Note: The Y axis represents the EEG power (log µV2) for the GRS (OCSR) measure. Disinhibition groups are: low (blue); medium (green; and high (orange). The X-axis is the frequency (Hz). A. Findings at Fz. B. findings at F8. Error bars represent standard error.

Interaction effects for disinhibition groups on OCSR.
Note: The Y axis represents the EEG power (log µV2) for the GRS (OCSR) measure. Disinhibition groups are: low (blue); medium (green; and high (orange). The X-axis is the frequency (Hz). A. Findings when the electrode interaction effect is isolated from subtracting Fz scores from F8 scores. B. Findings when the group-level interaction effect is isolated from subtracting the low group scores from the high group scores.

Figure 10 presents the EEG power (log µV2) for the affective group on OCSR at electrodes Fz and F8. There was a significant effect of electrode, frequency, and affective group (group × electrode × frequency[linear], F(2, 221) = 4.27, p = .02). When we isolated the interaction by subtracting the EEG power of F8 from Fz and outlined the difference between the high and low groups (see Figure 11), the difference between the high and low affective groups followed an upward trend as the frequency increased. The high affective group was lower than the medium and low affective groups at lower frequencies (6 Hz), but higher at higher frequencies (10 Hz).
EEG power of affective groups on OCSR at Fz and F8.
Note: The Y axis represents the EEG power (log µV2) for the GRS (OCSR) measure. Affective groups are: low (blue); medium (green; and high (orange). The X-axis is the frequency (Hz). A. Findings at Fz. B. findings at F8. Error bars represent standard error.

Interaction effects for affective groups on OCSR.
Note: The Y axis represents the EEG power (log µV2) for the GRS (OCSR) measure. Affective groups are: low (blue); medium (green; and high (orange). The X-axis is the frequency (Hz). A. Findings when the electrode interaction effect is isolated from subtracting Fz scores from F8 scores. B. Findings when the group-level interaction effect is isolated from subtracting the low group scores from the high group scores.

Figures 12 and 13 present the EEG power (log µV2) for the boldness and interpersonal groups on OCSR at electrodes Fz and F8. There were no statistically significant findings for differences in the EEG power for boldness and interpersonal groups on OCSR.
EEG power of boldness groups on OCSR at Fz and F8.
Note: The Y axis represents the EEG power (log µV2) for the GRS (OCSR) measure. Boldness groups are: low (blue); medium (green; and high (orange). The X-axis is the frequency (Hz). A. Findings at Fz. B. findings at F8. Error bars represent standard error.

EEG power of interpersonal groups on OCSR at Fz and F8.
Note: The Y axis represents the EEG power (log µV2) for the GRS (OCSR) measure. Interpersonal groups are: low (blue); medium (green; and high (orange). The X-axis is the frequency (Hz). A. Findings at Fz. B. findings at F8. Error bars represent standard error.

Goal Attraction System (GAS) – RewP. There was a clear RewP peak at time 4 for all groups for all psychopathy factors. Figure 14 reports the EEG power (log µV2) for the disinhibition group on RewP. The low disinhibition group exhibited significantly higher levels of RewP, particularly at times 2 and 4, than the medium and high groups (group × time[cubic] F(2, 211) = 3.23, p = .04). Figures 15–17 display the EEG power (log µV2) for boldness, affective, and interpersonal groups on RewP, respectively. Despite sharing the common time 4 peak, none showed any significant group differences.
EEG power of disinhibition group on RewP.
Note: The Y axis represents the EEG (log µV2) for the measure of the GAS – reward positivity (RewP). The X axis presents the time points (ms): 1 = 0–70; 2 = 70–100; 3 = 100–200; 4 = 200–300; 5 = 300–400. Disinhibition groups are: low (blue); medium (green; and high (orange). Poly. = polynomial. A = findings for disinhibition group on EEG measure for GAS. B = polynomial trend for each disinhibition group: low (blue); medium (green); and high (orange). Error bars represent standard error.

Figure 14. Long description
Two line graphs depict EEG power of disinhibition groups over time. Panel A: A line graph shows EEG power (RewP in log microvolts) on the vertical axis and time on the horizontal axis. The graph includes three lines representing low, medium, and high disinhibition levels. The low disinhibition line peaks at time 4, while the medium and high disinhibition lines show smaller peaks around the same time. Panel B: Another line graph shows polynomial fits for low, medium, and high disinhibition levels over time. The polynomial lines for low, medium, and high disinhibition levels show different trends, with the low disinhibition line peaking higher and later than the medium and high disinhibition lines.
EEG power of boldness group on RewP.
Note: The Y axis represents the EEG (log µV2) for the measure of the GAS – reward positivity (RewP). The X axis presents the time points (ms): 1 = 0–70; 2 = 70–100; 3 = 100–200; 4 = 200–300; 5 = 300–400. Boldness groups are: low (blue); medium (green; and high (orange). Error bars represent standard error.

EEG power of affective group on RewP.
Note: the Y axis represents the EEG (log µV2) for the measure of the GAS – reward positivity (RewP). The X axis presents the time points (ms): 1 = 0–70; 2 = 70–100; 3 = 100–200; 4 = 200–300; 5 = 300–400. Affective groups are: low (blue); medium (green; and high (orange). Error bars represent standard error.

EEG power of interpersonal group on rewP.
Note: The Y axis represents the EEG (log µV2) for the measure of the GAS – reward positivity (RewP). The X axis presents the time points (ms): 1 = 0–70; 2 = 70–100; 3 = 100–200; 4 = 200–300; 5 = 300–400. Interpersonal groups are: low (blue); medium (green; and high (orange). Error bars represent standard error.

8.4 Discussion
8.4.1. Initial replication
The goal of the current study was to extend the findings from Dickison et al., (Reference Dickison, Neo, McNaughton and Sellbom2024) and continue investigating the associations between psychopathy factors and RST constructs through traditional rational and novel neural methods. Results from the initial replication mainly were as expected for associations between psychopathy factors and Carver and White’s (Reference Carver and White1994) BIS/BAS scales and exhibited a similar pattern to that found by Dickison et al., (Reference Dickison, Neo, McNaughton and Sellbom2024). Boldness was negatively associated with FFFS-fear, BIS-anxiety, and positively related to the BAS, and the Affective scale was negatively associated with BIS-anxiety. Multiple regression analyses indicated that both Boldness and Affective contributed equally to predicting negative associations with BIS-anxiety.
However, in the attempt to replicate the results for associations between psychopathy variables and neural RST, we observed null results that were inconsistent with our initial significant findings in Dickison et al., (Reference Dickison, Neo, McNaughton and Sellbom2024). As noted in Dickison et al., (Reference Dickison, Neo, McNaughton and Sellbom2024), effect size magnitudes in the initial study were small, with a lack of Bonferroni correction. Therefore, the null findings in a new sample are not entirely dissimilar but require further investigation.
We identified three key methodological limitations in the initial analysis of the current study. First, bivariate correlation analysis assumed a linear relationship between psychopathy factors and neural RST indices, potentially over-simplifying the data. Second, averaging data over 4–7 Hz for EEG analysis may have diluted the specificity of findings, overlooking variations specific to different frequency bands. Third, limiting analysis in the Doors Task to specific time frames for investigating the GAS may not generalise across populations due to individual differences in dopamine release patterns. To address these limitations, we assessed nonlinear relationships between psychopathy and neural RST across a wider range of frequencies and times through repeated measures ANOVA.
8.4.2. Post hoc analysis
For the GIS (GCSR, goal conflict), GCSR levels were higher at electrode F8 than Fz for all psychopathy factors. This is not surprising as research has indicated that GCSR is found at electrode F8 (Corr & McNaughton, Reference Corr, McNaughton, Beauchaine and Hinshaw2016; Neo & McNaughton, Reference Neo and McNaughton2011; Neo et al., Reference Neo, Thurlow and McNaughton2011; Reference Neo, Tinker and McNaughton2020; Shadli et al., Reference Shadli, Ando, McIntosh, Lodhia, Russell, Kirk and McNaughton2021). Moreover, the results indicated that individuals higher on the disinhibition factor demonstrated higher levels of GCSR at F8 than individuals with medium or low disinhibition. This non-linear group relationship will have diluted correlations in our initial planned analysis. The findings for the GRS (OCSR, outcome conflict) indicated that individuals with high disinhibition scores elicited higher mean OCSR than medium and low groups at Fz. Individuals with higher affective scores demonstrated significantly lower levels of OCSR at 6 Hz compared to medium and low affective groups, but higher at 10 Hz. These results were observed at Fz, which is to be expected for OCSR (Cohen, Reference Cohen2011; Pasion & Barbosa, Reference Pasion and Barbosa2019; Yeung et al., Reference Yeung, Botvinick and Cohen2004; Zavala et al., Reference Zavala, Tan, Ashkan, Foltynie, Limousin, Zrinzo and Brown2016).
Results for the GAS (RewP, attraction) found a significant effect of time, with the highest response at time 4 for all psychopathy factors. There was a significant difference between disinhibition groups on RewP at time 4, with the low disinhibition group eliciting higher levels of RewP than the medium and high disinhibition groupings. The finding of higher disinhibition group scores with higher levels of both GIS and GRS and higher affective scores with lower levels of GRS was as hypothesised in the original analysis. However, the finding of lower disinhibition scores with higher levels of RewP was not expected and requires further investigation.
The following conclusions can be made when comparing the post-hoc findings to the limitations observed in the initial analysis. The first limitation identified in the initial analysis was assuming a linear relationship between variables. In cases where no significant differences between the psychopathy factor group mean on the neural RST measure were found, the observed variations between groups were minimal. Additionally, in cases where there were differences between group means on neural RST measures, this relationship was rarely linear and typically indicated a quadratic or cubic finding. Therefore, by initially assuming a linear relationship, we failed to detect potential relationships between psychopathy and neural RST measures. The second limitation identified was averaging over 4–7 Hz for the GRS and GIS. In cases where there were significant differences between groups on neural RST measures, this included frequencies outside of the 4–7 Hz frequency range. Additionally, this relationship did not necessarily follow a linear trend along frequencies. Therefore, by initially averaging over 4–7 Hz for GIS and GRS, the specificity of the analysis was diluted and, in turn, lost variations of patterns specific to frequencies. Finally, for the third limitation of time specificity with GAS, the results of psychopathy groups on RewP showed a clear and significant interaction at time 4, consistent with expectations. However, peaks at this point did not appear linear across psychopathy group scores. Altogether, post-hoc analysis has provided valuable insights into the possible relationship between psychopathy factors and neural RST and has indicated that the lack of associations in the initial linear correlation analysis was likely due to a lack of linear effect rather than a lack of statistical power.
8.4.3. Interpretation of findings
While we found some significant results in the post-hoc repeated measures ANOVA analysis, most psychopathy factors on each RST system did not elicit significant differences between groups and require further investigation and consideration. However, individuals with higher disinhibition scores exhibited elevated GIS (GCSR, conflict) scores compared to medium and low groups, suggesting a positive association between disinhibition and GCSR, aligning with the initial hypotheses due to the association between anxiety and behavioural traits related to secondary psychopathy (see Derefinko, Reference Derefinko2015 for review) but antithetical to the suggestion that a weak BIS is the basis of disinhibition (Fowles, Reference Fowles1980).
We had not hypothesised disinhibition to be associated with GRS (OCSR, fear) in the initial correlational analysis; but high and medium disinhibition groups elicited greater OCSR than the low group. This finding aligns with some literature indicating that secondary psychopathy is associated with ‘adequate’ or more elevated levels of fear compared to primary psychopathy (Corr, Reference Corr2010; Hofmann et al., Reference Hofmann, Schneider and Mokros2021). In addition, we found a non-linear relationship between the high affective group and OCSR, with the high group eliciting greater neural signal at 10 Hz, but lower at 6 Hz, when compared to the medium and low groups.
The finding of the low disinhibition group having higher levels of GAS (RewP) compared to the medium and high disinhibition groups was unexpected and did not align with the initial hypotheses with the GAS. However, the association between dopamine expression and externalising disorders, such as ADHD, is complicated. Notably, methylphenidate increases catecholamines including dopamine while reducing disinhibition in ADHD (Vaidya et al., Reference Vaidya, Austin, Kirkorian, Ridlehuber, Desmond, Glover and Gabrieli1998). However, it is not clear how this may present in psychopathy with further investigation is warranted.
8.4.4. Limitations of post-hoc analysis
While the post-hoc analysis provided some insights into the relationship between psychopathy and neural RST, this was not without limitations. We created psychopathy groups, and while this helped investigate nonlinear relationships between psychopathy and neural RST measures, it introduced range restriction within the post hoc analyses.
One methodological limitation is the sample size. While data were collected over three years, and we successfully recruited 250 participants before individual data were excluded in the data processing procedures, the findings are likely underpowered given the small effect size estimates needing detection (Schönbrodt & Perugini, Reference Schönbrodt and Perugini2013). However, increasing sample size has practical limitations due to the time taken to administer testing to each participant and the materials needed. Compared to other studies investigating psychopathy through EEG methods (see Clark, Bontemps, Batky, Watts & Salekin, Reference Clark, Bontemps, Batky, Watts and Salekin2019 for review), we have collected a relatively large sample. Moreover, given the effect sizes that are typically found in psychopathy research using EEG methods (e.g., Calzada-Reyes et al., Reference Calzada-Reyes, Alvarez-Amador, Galán-García and Valdés-Sosa2013; Clark et al., Reference Clark, Bontemps, Batky, Watts and Salekin2019; Reference Clark, Bontemps, Houser and Salekin2022), the presentation of these findings is valuable as they enhance our understanding of neurobiological mechanisms underlying psychopathy domains. These findings could be beneficial for future pharmacological and other intervention studies.
A further limitation in the ad-hoc analysis of the present study is the polychotomisation of continuous variables into three approximately equal-sized groups for each psychopathy factor relative to the sample. While this approach allows us to consider possible non-linear associations, it reduces variability and restricts range within groups.
It is not surprising that EEG studies in psychopathy typically yield low effect sizes. Specifically, achieving reliability in EEG studies is challenging due to the complexity of capturing dynamic brain activity (Lopes da Silva, Reference Lopes da Silva, Mulert and Lemieux2022). While EEG methods are a powerful tool for investigating neural dynamics due to the relatively low costs involved and non-invasive techniques, they have poor spatial resolution compared to other neuroimaging techniques and primarily capture surface brain activity, which makes it difficult to localise signals to deeper structures in the brain. EEG signals are susceptible to artefacts, both from the participant’s movements as well as external environmental noise resulting in loss of data (which may not be random). In addition, EEG data can vary from individual to individual due to anatomical differences, with limited diagnostic utility (Michel & Brunet, Reference Michel and Brunet2019). Finally, the challenge measures used here will have produced results that have state variations superimposed as error variance on trait variations.
8.4.5. Theoretical implications
RST is a dynamic neural theory spanning multiple levels (both macro and micro) of the brain. Specifically, each neural system controls multiple behaviours that tap into different levels and processes depending on motivational distance. With frontal recording our results will have tapped into only the cortical and not subcortical parts of the RST systems.
For example, the GRS controls many different behaviours ranging from flight, fight, freeze behaviours when a threat is proximal to anticipation and repulsion when the threat is distal to pre-emptive planning when it is far in the future. Further, neurotransmitters can interact with the GRS differently at each level (McNaughton, Reference McNaughton2020) with serotonin having opposite functional effects on proximal and distal threat (Graeff & Zangrossi, Reference Graeff and Zangrossi2010), essentially shifting from fast to slow thinking processes (Carver et al., Reference Carver, Johnson and Joormann2008; Kahneman & Patrick, Reference Kahneman and Patrick2011). Likewise, the GAS can output many different behaviours ranging from consummatory when the reinforcer is proximal to approach when the reinforcer is more distal to extensive goal-subgoal planning when it is far in the future. The GIS outputs risk assessment and behavioural inhibition when the conflict is proximal and rumination when the conflict is distal. All three systems also act to increase arousal and attention when the reinforcer is strong, with neurotransmitters having differential impacts on each level of activation for each neural RST system (McNaughton, Reference McNaughton2020). These effects of motivational distance must be taken into account when interpreting links with psychopathy.
It also remains unclear how effectively and comprehensively each of the EEG measures used here represents the overall sensitivity of each neural RST system. Our measures are only of the more rostral components of the system. An additional complication is that EEG measures (or any task-specific measure) will include both state and trait components. Where there is strong state variation superimposed on the trait component the result will have a high level of error from the trait point of view – and it is traits that the specific questionnaires we used are designed to capture.
Conversely, the psychopathic domains may be explained by dysfunction in components of a neural RST system that the EEG measures of overall sensitivity do not assess. For example, while a high score on a global GRS measure would predict higher levels of panic behaviour, some panic disorder is likely to be due to specific problems with the periaqueductal grey, independent of the rest of the GRS (Dantendorfer, Amering, et al., Reference Dantendorfer, Amering, Baischer, Berger, Steinberger, Windhaber and Katschnig1995; Dantendorfer, Windhaber & Maierhofer, Reference Dantendorfer, Windhaber and Maierhofer1995). We would not expect our EEG measures to capture such subcortical processes.
Finally, our results may simply indicate that RST may not be the most effective means to conceptualise and explain psychopathy domains. RST is a theory of personality derived from the state theory of the neuropsychology of anxiety (McNaughton & Gray, Reference McNaughton and Gray2024). While the theory is robust in explaining states and internalising disorders, translation to externalising and psychopathy may not be as clear as we initially expected it to be. Within the Big 5 (e.g., DeYoung, Reference DeYoung2015), the RST personality traits would be facets (or perhaps, with GRS, the aspect of withdrawal). With 10 aspects, each with multiple facets, there are many non-RST traits that could be fundamental to psychopathy that we do not assess through RST. Therefore, RST may not be the most appropriate personality theory to use to better understand psychopathy.
8.4.6. Conclusion
The current study provides some evidence for associations between psychopathy traits and neural deficits in goal conflict, outcome conflict, and attraction. Moreover, high disinhibition in psychopathy may be explained by elevated goal-conflict and outcome-conflict. High affective scores may be attributed to dysfunction in outcome-conflict at certain frequencies. While not expected, the results also indicated that high disinhibition in psychopathy might be associated with low attraction. However, discrepancies between findings challenge the theoretical and methodological approach taken to better understand psychopathy.
Supplementary material
The supplementary material for this article can be found at https://doi.org/10.1017/pen.2026.10008.
Acknowledgements
The writers acknowledge Emma Veltman, Claire Liggins, and Simon Wallace for serving as Research Assistants on the project. This study is adapted from a chapter in Dickison, E.M. Psychopathy and Reinforcement Sensitivity Theory (2024) PhD, University of Otago, which represents a preliminary version of the current study.
Financial support
This research was funded by a research grant from the Royal Society of New Zealand Marsden Fund (19-UOO-249).
Competing interests
Professor Martin Sellbom is a paid consultant to the University of Minnesota Press, publisher of the MMPI-3, which was used in this study.



 Open access

