


Hand hygiene is universally acknowledged to be one of the most important strategies to prevent healthcare-associated infections and the transmission of multidrug-resistant organisms, which both cause significant morbidity and mortality among hospitalized patients.Reference Barnes, Morgan, Harris, Carling and Thom 1 – Reference Hagel, Ludewig and Frosinski 3 Nevertheless, adherence to recommended hand hygiene practices remains low.Reference Erasmus, Daha and Brug 4 The main methods for hand hygiene adherence assessments are direct observations, indirect assessments by measuring the volume of consumed disinfectants or counting dispenser utilizations, and advanced automated adherence monitoring technology. Direct observation, in which the observers monitor the hand hygiene compliance of healthcare workers (HCWs) during their clinical tasks, is the most commonly used method and considered to be the gold standard.Reference Ellingson, Haas and Aiello 2 However, direct observation of HCWs is prone to the Hawthorne effect, which refers to the tendency of people to behave differently when they know that they are being observed.Reference Boyce 5 , Reference Haas and Larson 6 Proposed explanations for the Hawthorne effect include the psychological effect of being singled out, noticed, or made to feel important.Reference Holden 7 The Hawthorne effect is widely assumed to increase the hand hygiene compliance rates of HCWs when observers are present. However, only a few studies have examined the actual magnitude of the effect and only a few lacked methodologic weaknesses, including selection and observer biases.Reference Dhar, Tansek and Toftey 8 – Reference Gould, Chudleigh, Drey and Moralejo 15 The recent development of electronic systems for hand hygiene monitoring offers an alternative approach to direct observation and might overcome the aforementioned obstacles.Reference Boyce 5 These electronic systems monitor hand hygiene on a constant, real-time basis without requiring direct observation, hence making them a promising tool for reevaluation of the Hawthorne effect. Therefore, the objective of the study was to quantify the Hawthorne effect on direct hand hygiene compliance observations by means of electronic hand hygiene monitoring.
Methods
The study was performed in a 24-bed anesthesiological-surgical intensive care unit (ICU) at the University Hospital of Jena, a 1,500-bed tertiary care hospital, from October 1, 2013, through February 28, 2014. The ICU consisted of five 4-bed rooms, one 2-bed room, and two single-bed rooms. The study was approved by the facility’s institutional review board.
Electronic Hand Hygiene Dispensers
Overall, 70 electronic hand hygiene dispensers (ingo-man Weco, Ophardt) of alcohol-based handrub (AHR) were installed in the ICU in January 2013. Each of the 4-bed rooms was equipped with 7 to 11 dispensers located at each bedside, at the sink, and at the bench. Each time the lever of the dispenser is pushed, a time-stamped hand hygiene event (HHE) is recorded and subsequently transmitted via WiFi to a centralized database. The dispenser records only 1 HHE in any 2-second period even if the lever is pushed more than once. The energy for the WiFi data transfer is obtained by pushing the lever of the dispenser and it does not require any additional power supply. Other sources of AHR (eg, pocket bottles) were not commonly used. HCWs were aware that the electronic dispensers were used to monitor hand hygiene.
Direct Observation
Since 2012, direct observations of hand hygiene adherence measurements have been regularly performed by infection control practitioners. The last observation in summer 2013 in the ICU revealed an overall hand hygiene compliance of 41% according to the World Health Organization’s (WHO) “Five Moments for Hand Hygiene.”Reference Sax, Allegranzi, Uçkay, Larson, Boyce and Pittet 16 For this study, direct hand hygiene observations were performed by a medical student intern observer (J.R.) who was trained and validated in hand hygiene observation techniques by infection control practitioners. Fifty total episodes of direct observations were performed within the study, each lasting 2 hours. During the entire observation period, the observer stayed in the ward room and counted all HHEs and opportunities in accordance with the WHO’s “Five Moments for Hand Hygiene.” When 2 hand hygiene opportunities occurred at a single time point, the procedure that theoretically had a greater impact was recorded (eg, category 2 [before clean/aseptic procedure] rather than category 1 [before touching a patient]). When 2 consecutive hand hygiene opportunities occurred (eg, HCW leaves a patient and goes to next patient), only the first event was documented to avoid ‘‘double-counting’’ discrepancies. Applying and changing gloves without the use of AHR or glove disinfection was not counted as a proper HHE. Hand hygiene technique, such as the amount of time spent using an AHR and the extent to which all surfaces of the hands are covered, was not evaluated. To achieve an overall high number of HHEs, we decided to limit the observations to the 4-bed rooms only. Every HCW (eg, nurses, physicians, x-ray technicians, physiotherapists) within the patient room was observed. No feedback was given to the HCWs. When starting the observation, the observer introduced herself and the purpose of the observation (“hand hygiene compliance observation”) to the attending nurses (n=2) who were responsible for patient care in the observed 4-bed room. However, the primary objective of the study, quantifying the Hawthorne effect, was not communicated. The observer did not personally inform each additional HCW who entered the patient room about the purpose of the observation but did so when actively asked. All observations took place between Mondays and Fridays between 6:00 AM and 10:00 PM—that is, during 2 working shifts (morning shift 6:00 AM–2:00 PM and afternoon shift 2:00 PM–10:00 PM). The time of observation and the patient room were randomly selected by the observer at the day of the observation.
Statistical Analyses
Hand hygiene compliance was calculated as the number of observed HHEs according to the WHO’s “Five Moments for Hand Hygiene” divided by the total number of opportunities observed, expressed as a percentage. The agreement between the number of HHEs that were directly observed and the number that were electronically recorded was analyzed using a Bland-Altman plot that compared the mean of the values provided by the 2 methods and their differences. The Hawthorne effect was investigated by comparing the number of the electronically recorded HHEs in the observation period with those in the remaining 6 hours of the working shift. This value was standardized to a 2-hour interval to allow for comparability. We quantified the Hawthorne effect as the explained variability (R 2) of HHEs/2 hours (quantitative outcome) given the presence or absence of an observer using a general linear model. To describe the monotonic relationship between the 2 quantitative variables, we used the Spearman rank correlation coefficient ρ with 95% CIs. We applied a 2-sided significance level of 5% and reported 2-sided P values that are not corrected for multiple testing. The data were analyzed using the statistical language R, version 3.0.3 (R Foundation for Statistical Computing), and SAS, version 9.3 (SAS Institute).
Results
In total, 50 episodes of direct hand hygiene observation were performed, each lasting 2 hours. During 2 episodes, 1 electronic dispenser was broken, and the data were not transmitted to the centralized database. As a result, these 2 episodes were excluded from further analyses. Overall, 96 hours of direct observation and 288 hours without direct observation were included in the analyses. Apart from 8 observations with 1 vacant bed, all beds in the observed 4-bed rooms were occupied. Thus, there were 184 total patients included throughout the whole study period. Twenty-seven of the observations (56%) were performed during the morning shift, and 21 (44%) were performed during the afternoon shift.
Hand Hygiene Compliance
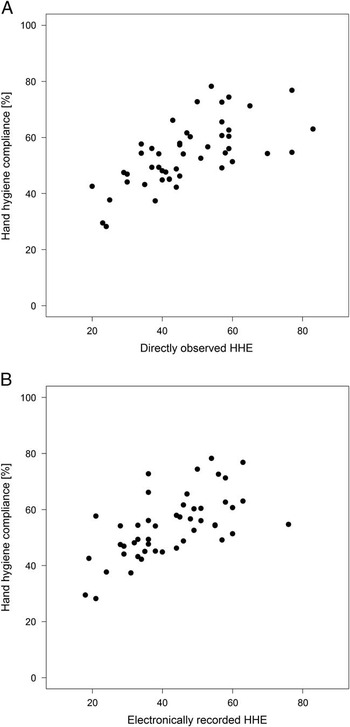
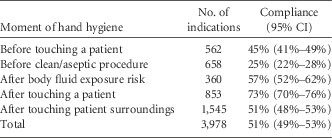
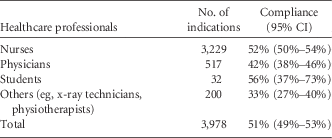
In total, 4,077 HHEs were observed during the 96 hours of direct observation. Of those, 3,978 events were considered to be hand hygiene opportunities according to the recommendations of the WHO’s “Five Moments for Hand Hygiene” (ie, 3,978 hand hygiene opportunities in 184 patients each 2-hour observation, or 11 opportunities for hand hygiene per patient per hour). Ninety-nine HHEs that were performed were not events that met the WHO recommendations. The overall rate of observed hand hygiene compliance was 51% (95% CI, 49%–53%); in 2,034 of the 3,978 opportunities, a hand hygiene performance was observed. Detailed compliance rates by specific opportunities and the profession of the HCWs are displayed in Tables 1 and 2. Next, we explored the Spearman correlations between hand hygiene compliance according to the WHO standards and directly observed HHEs (ρ=0.69 [95% CI 0.50–0.81], P<.0001) as well as electronically recorded HHEs during direct observation (ρ=0.68 [95% CI, 0.49–0.81], P<.0001). In both cases, we observed a strong monotonic relationship (Figure 1).
A, Hand hygiene compliance versus directly recorded hand hygiene events (HHEs) during the 2-hour direct observation period. B, Hand hygiene compliance versus electronically recorded HHEs during the 2-hour direct observation period.
Compliance With Hand Hygiene According to Indication
Compliance With Hand Hygiene According to Profession
Agreement Between Direct Observation and the Electronic Count System
The Bland-Altman plot indicates a good agreement between the average number of HHEs captured with direct observation and the average number of HHEs registered by the electronic dispensers during the same 2-hour period. The mean difference between both methods was 2 HHEs per 2 hours of observation (95% CI, -7–11). On average, 2 additional HHEs were recorded in each 2-hour period with direct observation compared with electronic recording (Figure 2).
Bland-Altman plot of the agreement between the average number of hand hygiene events in 2 hours assessed by the following 2 methods: direct observations or the electronic count system. In total, 48 episodes (each dot is 1 episode) are displayed. The horizontal lines are the average difference of the methods and corresponding 95% CI. obs., observation.

Hawthorne Effect
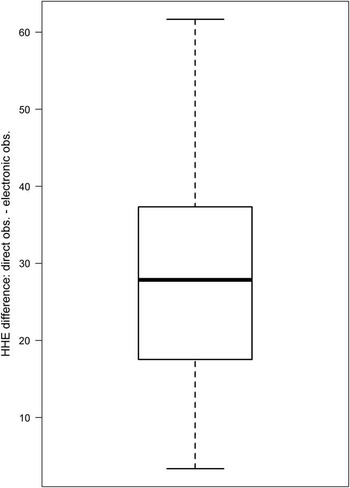
In total, 4,180 HHEs were recorded by the electronic dispensers over 384 hours of the 48 analyzed working shifts. Of those, 2,029 HHEs were simultaneously recorded with the 96 hours of direct hand hygiene observation, and 2,151 HHEs were recorded in the remaining 288 hours of the same working shift that did not have direct hand hygiene observation. The mean difference in the number of HHEs per 2-hour period between episodes of direct hand hygiene observation and episodes without observation was 27 HHEs (95% CI, 23–31 HHEs) (Figure 3). Healthcare workers performed 8 HHEs per hour when not under observation compared with 21 HHEs per hour during observation. This figure translates into 5 HHEs per patient per hour under observation and 2 HHEs per patient per hour in the periods without observation. In a general linear model with HHEs as the quantitative outcome, 61% of the observed total HHE variability was explained by the presence or absence of a direct observer (ie, the Hawthorne effect).
Box plot of the differences in hand hygiene events (HHEs) between the episodes under direct observation and the episodes not under observation in a 2-hour period of the electronic count system. obs., observation.
Discussion
Our study demonstrates the marked influence of the Hawthorne effect on hand hygiene performance. We observed an average increase from 8 HHEs per hour without direct observation to 21 HHEs per hour under direct observation in a 4-bed room, which corresponds to 2 HHEs and 5 HHEs per patient per hour, respectively. This result confirms the findings of the studies addressing the Hawthorne effect on hand hygiene performance that have been published so far. Srigley et alReference Srigley, Furness, Baker and Gardam 14 likewise observed an approximately 3-fold increase of HHEs in the hallways when the auditors were visible compared with when they were not. Cheng et alReference Cheng, Tai and Ho 17 used an electronic monitoring system to quantify the Hawthorne effect and observed an approximately 180% increase in hand hygiene compliance during audits (32% vs 89%). Eckmanns et al,Reference Eckmanns, Bessert, Behnke, Gastmeier and Ruden 9 however, reported a less pronounced increase of 55% in compliance between covert and overt observations in 5 German ICUs (29% vs 45%). Whether differing baseline levels of hand hygiene compliance determines the impact of known observers on hand hygiene performance was assessed by Kohli et al.Reference Kohli, Ptak, Smith, Taylor, Talbot and Kirkland 11 They demonstrated that the Hawthorne effect was more pronounced in units with a high baseline level (79% without observation vs 98% with observation) than in units with a low baseline level (40% without observation vs 47% with observation). Because the Hawthorne effect varies with different baseline levels, it is therefore unfeasible to generally estimate the true compliance of hand hygiene by merely dividing the observed rate by 3, assuming a 3-fold increase under observation as recorded in our study. To minimize the Hawthorne effect, some facilities have used covert observers or “secret shoppers,” which may improve the validity of the measurements.Reference Ellingson, Haas and Aiello 2 However, some experts have raised ethical concerns about not receiving informed consent of those being observed, and it is unlikely that the covert nature of the observation can be sustained over a long period.Reference Gould, Chudleigh, Drey and Moralejo 15 Thus, there are a number of studies that have undeniably shown the marked influence of the Hawthorne effect during direct hand hygiene observation. In contrast to the aforementioned studies, however, our results are not limited to a specific indication or location (eg, hallways). Furthermore, our study estimated the Hawthorne effect by using electronic dispensers in contrast to studies that relied on observers unknown to HCWs, who also might themselves provoke the Hawthorne effect.
In addition to the biased estimates due to the Hawthorne effect, direct human observation is labor intensive and costly. Furthermore, direct human observations are subject to observer and selection biases and often provide information for only a small sample (1%–3%) of all hand hygiene opportunities occurring in healthcare settings.Reference Boyce 5 Conclusions about an entire ward, department, or profession may thus be subject to both systematic and random errors. Automated hand hygiene monitoring technologies could improve methods for hand hygiene adherence measurement. They can record much greater numbers of HHEs than can be achieved by direct observation while also avoiding a Hawthorne effect or observer bias, and they can provide specific data on the number of HHEs occurring per patient-day.Reference Ellingson, Haas and Aiello 2 The results of our study demonstrate that hand hygiene compliance may be measurable without requiring direct human observation. Prerequisite for using automated hand hygiene monitoring technology in hand hygiene adherence measurements is the concordance between the number of electronically recorded and the directly observed HHEs. We observed no evidence to assume that the number of directly observed and electronically recorded HHEs substantially differed. Additionally, our study revealed a strong correlation between the electronically recorded HHEs and the directly observed compliance rate. During direct observation, we recorded approximately 11 average necessary HHEs per patient per hour according to the recommendations of the WHO. This number is in line with the results of a study by Scheithauer et alReference Scheithauer, Haefner and Schwanz 18 who observed 10 necessary HHEs per patient per hour in the morning shift and 8 HHEs per patient per hour in the afternoon shift. Based on these 11 necessary HHEs per patient per hour, 5 HHEs per patient per hour translates to a compliance of 45%, which is close to the directly observed compliance of 51%. In contrast, only 2 HHEs per patient per hour were performed without observation, which translates to a compliance of less than 20%. One point often highlighted is the fact that electronic counting devices cannot determine whether HHEs are performed at appropriate moments (ie, the WHO’s “Five Moments for Hand Hygiene”), and an estimation of hand hygiene compliance rates would therefore not be correct. However, we could show for the first time that during the whole period of direct observation of 2,133 total HHEs, less than 5% (n=99) were not indicated according to the recommendations of the WHO’s “Five Moments for Hand Hygiene.” The bias of unindicated HHEs seems to be negligible, at least for the ICU setting with a high density of opportunities for hand hygiene.
However, several limitations of electronic counting devices must be considered. These limitations include the inability to distinguish between product use by HCWs versus patients and visitors, the inability to identify specific HCWs or type of HCW using the AHR, and the inability to evaluate hand hygiene techniques or the identification of specific issues that warrant further education of HCWs.Reference Boyce 5 Furthermore, they have upfront costs related to the installation of new hardware and maintenance costs. In contrast, direct observation can discern all opportunities for hand hygiene within patient care encounters, can provide detailed information about hand hygiene technique and compliance rates for HCWs of different types and levels of seniority, and can identify specific situations that require further education of HCWs.Reference Ellingson, Haas and Aiello 2 , Reference Boyce 5 Above all, direct observation allows for direct individual performance feedback (ie, “just in time training”), making the observation part of an intervention.
Limitations of the Study
The generalizability of our findings is unknown because our study was limited to 1 ICU in a single healthcare facility. However, we have no reason to believe that our general conclusions will be different in other settings. Furthermore, we could not match with individual HHEs and had to work with summary measures during a certain period. The same is true when trying to differentiate the HHEs between individual HCWs given that no individual HCW identification was recorded. Additionally, we did not evaluate the hand hygiene technique and did not include HCWs within the night shift, who might have responded differently to the observation. In addition, we cannot rule out that visitors may also have used the electronic dispensers, which may have led to an overestimation of the number of HHEs performed by the HCWs. Finally, we could not control for the possibility of a variable workload of the HCWs during the different observed episodes, including with and without direct observation.
In summary, our study adds to other studies demonstrating the impact of the Hawthorne effect on hand hygiene adherence in HCWs. Because many healthcare facilities use infection control practitioners as observers of hand hygiene adherence, it is important to recognize that this practice most likely leads to overestimation of the true rate of hand hygiene compliance. Furthermore, our study demonstrates a good agreement between directly and electronically observed HHEs and reveals a strong correlation between the electronically recorded HHEs and the directly observed compliance rate, hence making electronic counting devices a promising tool for assessing hand hygiene compliance. For the future, we envision a combined approach of direct observation without measuring compliance, giving only individual performance feedback, and using automated adherence monitoring to realistically estimate hand hygiene adherence while minimizing observer bias and the Hawthorne effect.
Acknowledgments
Financial support. German Ministry of Education and Research (grants 01KI1204 and 01EO1002). The electronic hand hygiene dispensers were provided for free by Ophardt.
Potential conflicts of interest. S.H. reports that he received travel grants from Ophardt. All other authors report no conflicts of interest relevant to this article.
Authorship and manuscript preparation. Ophardt had no role in the gathering or preparation of data or in the writing of the manuscript.



