INTRODUCTION
Since the early 1970s, linguists have shown interest in the acquisition of second languages (L2) in childhood. Important studies such as Dulay and Burt (Reference Dulay and Burt1974a, Reference Dulay, Burt and Richards1974b) and Krashen, Long, and Scarcella (Reference Krashen, Long and Scarcella1979), among others, must be credited for offering seminal contributions that formed the modern field of second language acquisition (SLA). Notwithstanding, since the early days of SLA, the study of L2 acquisition in children has been far less explored as compared to L2 acquisition in adulthood. In recent years, however, the study of child L2 acquisition has witnessed a sharp increase in interest (see Haznedar, Reference Haznedar2013, for review). This increase parallels both a better understanding of child L2 acquisition as an instance of acquisition that must be studied as a separate form of bilingualism in its own right as well as the recognition that child L2 data can be used as a novel way of adjudicating between competing claims for contentious debates in other areas of bilingualism, language acquisition, and language impairment more generally (e.g. Haznedar, Reference Haznedar2013; Paradis, Reference Paradis2010; Schwartz, Reference Schwartz, Beachley, Brown and Conlin2003).
Child L2 learners, even at very young ages, are possibly no longer universal learners and thus exhibit crucial differences from simultaneous bilinguals based on previous linguistic experience with their first language (L1). Although, unlike adults, L2 learners at young ages are still in the process of acquiring their L1, some researchers contend that child L2 learners have lost the ability to acquire language like native speakers as early as ten months for phonological perception and as early as four years for syntax (e.g. Meisel, Reference Meisel2011). Also different from adults, but similar to child L1 learners, child L2 learners are not yet fully cognitively developed. For example, depending on age of L2 onset exposure, Theory of Mind might not be developed and memory systems are not yet optimized, which we know has consequences for language acquisition processes (e.g. de Villiers, Reference de Villiers2007; Long & Rothman, Reference Long and Rothman2014; Tsimpli, Reference Tsimpli2014). These facts justify inclusion of child L2 datasets alongside other types of learner datasets to tease apart otherwise inherently confounded variables pertaining to conflicting proposals in adult L2 acquisition and simultaneous child bilingualism research (e.g. Haznedar & Schwartz, Reference Haznedar, Schwartz, Hughes, Hughes and Greenhill1997; Schwartz, Reference Schwartz, Beachley, Brown and Conlin2003; Unsworth, Reference Unsworth2005, Reference Unsworth, Gavruseva and Haznedar2008). Related to the claim that differences in developmental sequencing between child L1 and adult L2 constitute evidence that the processes are fundamentally different, Schwartz (Reference Schwartz1992, Reference Schwartz, Beachley, Brown and Conlin2003) problematizes this view, showing that the child L2 developmental sequence can look much more like adult L2 than child L1. Following the most widely accepted claims that the critical/sensitive period for syntax closes around puberty (see Long, Reference Long2005, for review), Schwartz rightly points out that such data from child L2 questions the validity of using developmental sequence differences between L1 and adult L2 to make any definitive claims regarding the critical period. Paradis (Reference Paradis, Gavruseva and Haznedar2008, Reference Paradis2010, Reference Paradis2011), among others, has called attention to the fact that child L2 data can inform discussions on general linguistic and cognitive development and, crucially, their interdependence. It is within this vein of child L2 acquisition research that the present study best makes its contribution.
Importantly, child L2 leaners do not form a monolithic group, but rather they form identifiably distinct groups that should be distinguished in empirical investigations. For example, the case most typically thought of as child L2 acquisition is perhaps characterized by naturalistic acquisition in an environment where the L2 is the native majority language. Such cases describe child L2 acquisition through immigration at a young age, or the case of a subset of young heritage speakers born in a country with a different majority language, yet whose first significant exposure to the majority language occurs at school age. In such a context, these learners acquire the L2 via a combination of naturalistic experience with the L2 – with sufficient richness of input that being in a native environment conveys – as well as classroom intervention. As we know from the growing literature on adult heritage language acquisition, many of these child L2 learners will eventually become dominant speakers of the L2 in adulthood (for review see Benmamoun, Montrul & Polinsky, Reference Benmamoun, Montrul and Polinsky2013; Montrul, Reference Montrul2008; Rothman, Reference Rothman2009).
Another group of child L2 learners that has received far less attention in language acquisition studies to date are those that are exposed to the L2 in a non-native environment through bilingual immersion education. Distinct from the previously described child L2 learners, they have much less access to and overall richness of L2 input. It is prudent to acknowledge from the outset that child L2 learners of this sort do not have a homogeneous profile, but rather can vary considerably from context to context. For example, in the North American context where bilingual education is (often) provided in public schooling and where minority communities in considerable numbers exist (e.g. Spanish communities in the US and French communities in English-speaking Canada), it is not necessarily the case that bilingual education is considerably costly and/or functionally unsupported linguistically outside of the school environment. However, in many other places of the world, such as Latin America, English-immersion schools are typically private and considerably expensive, making them available mostly to populations with high socioeconomic status (SES). Moreover, although English has a place in the greater society as a language of considerable prestige, it is usually not the case that there are minority native English-community enclaves within the majority Spanish or Portuguese environments. Simply put, a native majority language child (English-native) in a two-way immersion program of English–Spanish in Houston, Texas, is different in many ways from a child in English–Spanish one-way immersion in Cali, Colombia. Even if the children match in terms of SES, the English-native child in the US will have access to native peers of her L2 Spanish in her classroom experience, and possibly outside the classroom, both of which the Colombian child will likely lack by circumstance for her L2 English. Irrespective of the aforementioned differences across immersion, child L2 learners of these types all share the commonality that they are not immigrants; rather they remain in their native countries where the L2 is largely restricted to the school environment. Nevertheless, these child L2 learners can be exposed to the L2 consistently from as early as the age of three for as much as 80% of the time they spend in school. Unlike the immigrant or heritage language child L2 learners, these child L2 learners are not usually at risk of losing dominance in the native language precisely because they remain in an L1 native-speaking environment.
With these above distinctions in mind, the present study examines child L2 acquisition in the latter case presented above, that is, child L2 acquisition in an immersion context of bilingual education where the L2 is not a native language in the external environment. More specifically, it involves a subset of all such child L2 learners who are in an environment where indeed school constitutes virtually the only input in the L2 the child is exposed to, and where immersion education is not provided in public school, but rather in private schools at considerable expense. We report on a longitudinal comprehension study of (long) passive constructions in child L2 acquisition of English in a one-way immersion school setting in Cali, Colombia, where English and Spanish are distributed in equal 50% proportions in pre-primary and primary school. We report data from three intervals of testing with the same subjects over the course of three consecutive years. Our main research question is whether earlier exposure is more advantageous to the child L2 learner, generally speaking, or if for certain domains of grammar, specifically (long) passives in the present study, older children have an advantage for more efficient – operationalized as quicker in absolute time – acquisition. Indeed, we hypothesize that some domains of grammar, like passives, take longer in absolute time for younger child L2 learners to acquire as compared to older child L2 learners, and that determining which domains is at least partially predictable from insights in the child L1 and simultaneous child bilingual (2L1) literatures.
The acquisition of passives
To address our research goal, we compare two native-Spanish child L2 English groups that differ most crucially by age of initial exposure to English: a younger and an older group. We examine the interpretation of English passives because passives are a late-acquired property in most languages (e.g. Babyonyshev & Brun, Reference Babyonyshev and Brun2003 (Russian); Bartke & Siegmüller, Reference Bartke and Siegmüller2004 (German); Borer & Wexler, Reference Borer and Wexler1989 (English); Chang, Reference Chang, Gao and Hoosain1986 (Mandarin); Fox & Grodzinsky, Reference Fox and Grodzinsky1998 (Spanish, English); Fox, Grodzinsky & Crain, Reference Fox, Grodzinsky and Crain1995 (English); Gabriel, Reference Gabriel2001 (Portuguese); Gavarró & Parramon, Reference Gavarró and Parramon2011 (Catalan); Maratsos, Fox, Becker & Chalkley, Reference Maratsos, Fox, Becker and Chalkley1985 (English); Pierce, Reference Pierce1992 (Spanish); Sugisaki, Reference Sugisaki1999 (Japanese); and Terzi & Wexler, Reference Terzi and Wexler2002 (Greek)) because it is cognitively more costly than actives. In English and Spanish, children have problems with the interpretations of examples (1c) and (2c), respectively, until roughly the age of five, whereby they do not reliably restrict the meaning to (1a) and (2a) only (e.g. Borer & Wexler, Reference Borer and Wexler1989; Pierce, Reference Pierce1992).Footnote 1
- (1)
a. John kissed Mary.
b. Mary kissed John.
c. Mary was kissed by John.
- (2)
a. Juan besó a María.
Juan kiss-pst.3sg. to María.
‘Juan kissed María.’
b. María besó a Juan.
María kiss-pst.3sg. to Juan.
‘María kissed Juan.’
c. María fue besada por Juan.
María is-pst.3sg. kiss-ptcp. by Juan.
‘María was kissed by Juan.’
The younger group was first exposed to English upon starting the first year of full-time school (pre-jardín in the Colombian system) between the ages of 3;0 and 4;0, whereas the older group was first exposed to English at the ages of 6;0 and 7;0 upon starting first grade. As we will see in greater detail in the next subsection, the amount and type of input to English as well as other possibly deterministic variables are controlled for across the groups. Both groups are tested after three years of exposure to English, meaning the younger group was 6;0–7;0 and the older group 9;0–10;0 when first tested. And so, even the younger group was first tested in L2 English after passives should have been acquired in the L1. However, only the older group, first exposed to English at age 6;0–7;0, compared to the younger group first exposed at 3;0–4;0, would have likely fully acquired passives in the L1 at the time of initial exposure (but see evidence suggesting passives are acquired as early as 3;0–4;0 via early priming experiments; e.g. Huttenlocher, Vasilyeva & Shimpi, Reference Huttenlocher, Vasilyeva and Shimpi2004; Thatcher, Branigan, McLean & Sorace, Reference Thatcher, Branigan, McLean and Sorace2008).
Many accounts have been put forth in an attempt to explain why passives are acquired so late. Such accounts range from the maturation of certain syntactic structures over time throughout early childhood (so-called maturation of A-chains; Borer & Wexler, Reference Borer, Wexler, Roeper and Williams1987, 1989), to claims that children have problems with interpretation/syntax of the by-phrase itself, to frequency-based claims highlighting the scarcity of passives in relevant input (Tomasello, Reference Tomasello2000) (seemingly supported by claims that children as young as three to four years can be coaxed into producing passive constructions through training (Brooks & Tomasello, Reference Brooks and Tomasello1999)).
Our goal is not to weigh in on the above debates per se. Irrespective of the full explanation for why they are acquired late in monolingual children, it suffices for our purposes to have a general agreement that passives are cognitively more costly than actives given the reanalysis of theta-role mappings they require. Both English and Spanish have canonical Subject–Verb–Object (SVO) word order. In active structures, a faithful relationship between grammatical and thematic role assignment aligns and is reflected in SVO word order – the thematic role of Agent is mapped to the subject and Patient/Theme on the object straightforwardly. In passive structures, the non-canonical structure, the thematic role mapping is reversed – the Patient is mapped to the structural subject and the Agent to the NP in the by-phrase. Ferreira (Reference Ferreira2003) offers an account of how the non-canonical relationship of grammatical and thematic role assignment affects processing of passives. She proposes an incremental view of processing with a parser that has a general bias for assigning the thematic role of Agent to the first encountered NP. In an active structure, for example, as in (1a) and (2a) above, Agent is assigned to John/Juan, the morphology of kissed/besó is perfectly compatible with this assignment, and Patient can be assigned to Mary/María. However, in passives, as in (1c) and (2c), Mary/María is originally assigned the Agent role, the morphology of was/fue is, to this point, compatible, but upon hearing the past participle morphology in kissed/besada, the parser knows it is a passive. Thus, the Agent role is no longer possible and a reanalysis is required to assign the Patient role to Mary/María and eventually the Agent role to the NP in the by-phrase. Other complexities conspire with passive structures to make processing more costly, such as the ambiguity of the preposition by, which could introduce an agentive interpretation (as in example (1c) and (2c)) or a locative interpretation if the sentence were Mary was kissed by the side of the road. Given Ferreira's (Reference Ferreira2003) account, non-canonical sentences are predicted to be more costly to process and this thus explains why even native-speaking adults have some difficulty processing passives relative to actives.
In previous research on child L2 acquisition, of which there is very little for passives, bilinguals have been shown to demonstrate delays in passives relative to actives, reflecting earlier normative developmental stages, argued to be due to reduced exposure inherent to L2 acquisition and related to the aforementioned complexities of passive syntactic structure and processing (e.g. Marinis & Saddy, Reference Marinis and Saddy2013). Marinis (Reference Marinis, Belikova, Meroni and Umeda2007) provides evidence showing that child L2 learners as compared to monolinguals are slower to process passives; however, the child L2 learners showed evidence that they do use morphological cues to differentiate between active and passive (-ed vs. -ing) and, thus, the accurate assigning of theta-roles. We therefore assume that in the present case of child L2 English, actives should emerge before passives in both learner groups. To the extent that passives are linguistically complex and impose greater cognitive demands for processing, their acquisition might be differentially delayed not only as a factor of less input overall, but also conditioned by age of initial exposure to the L2. The older children might be quicker to acquire passives in absolute time because they are better equipped cognitively to process this domain of grammar.
Linguistic setting
The child L2 participants in this study were all students enrolled in a private Jesuit school in Cali, Colombia. At the time of initial data collection in 2011, the school had celebrated the start of its fourth year since switching from a strictly Spanish-medium school to a 50/50 Spanish–English immersion structure. This school offers enrolment from the three years of pre-primary school traditionally offered in Colombia through the last year of high school. When the school decided to transition from a monolingual to a bilingual program, they elected to make this change non-progressively in pre-school and beginning primary. This meant that in 2008, when the school transitioned on its opening day in autumn, all the youngest children, whether aged 3;0–4;0, 4;0–5;0, or 5;0–6;0 in the three years of pre-primary, or aged 6;0–7;0 in grade one of primary all received 50/50 immersion for the first time and from that moment onwards. The model adopted at this school is akin to one person–one language approach that some parents wishing to raise their children bilingually employ. Specifically, teachers that provide English input do not use Spanish with the children, and vice versa for Spanish, in and out of the classroom. Groups of students divided into ‘home rooms’ remain together throughout the day, which means that teachers rotate by subject and dedicated language. Teachers who use English for their content areas are not exclusively native, although some are, but all have an impressively high level of English, often having lived and studied in the US. The school adopted a specific policy on language distribution whereby, to the extent possible, all aspects of school life is in both languages, including signs, technologies, bilingual administration, and across all subjects and activities even including playtime and physical education. Throughout the progress of years, topics taught in either English and Spanish are rotated so that the children receive topical exposure to specific vocabulary in both languages. Before undertaking the project, and throughout our trips over three years, we observed dozens of hours of instruction across a large selection of teachers and grade levels. Moreover, for the first year of data collection (including four months prior to the onset of any data collection), one of the co-authors, a native speaker of English placed as a teacher in the bilingual program, was working in the school. From the depth of these observations, we felt very confident that this school was ideal in terms of keeping, to the extent possible, its policy of 50/50 distribution and that the quality of the input the children was exposed to was of a varied and high-quality level.
The manner in which the school switched to bilingual instruction is not inconsequential for our selection purposes. Their decision to start all children with immediate 50/50 exposure in 2011 meant that we would have the unusual opportunity to test younger and older children with similar quality and quantity of exposure to input in the same location, over the same time period, and under the same carefully planned conditions. It was this unique situation that prompted us to select this school in the first place. Only in such a context would we be able to meaningfully isolate the variable of age of onset to see if, for certain domains of grammar, age is deterministic for development in child L2 acquisition. We acknowledge that there are bound to be some differences between child groups that cannot be fully controlled for, and this fact is not restricted to age of onset differences between groups. That is, even groups of the same age that happen to have different teachers and experiences with others will inevitably have, at various levels, minor quantitative and qualitative differences in their input exposure. To counterbalance this unavoidable variable, participants in younger and older aggregates for this study were chosen randomly from three ‘home rooms’. It is useful to note as well that in the context of Colombia, or at least this school, the youngest children are taught with the same pedagogical model and principles adopted at the highest level of the school. Literacy, mathematical, and science training start as soon as the children enter pre-primary school. Impressively, the youngest children do read basic texts in both languages after the first year of pre-primary. The school has a full-time assistant principal with an advanced degree in bilingual education. She plans, links together, and runs the entirety of the programs in pre-primary and primary grade levels. Understanding that the youngest children might have differential linguistic, educational, and cognitive needs, the teachers employed in the pre-primary grades have the most specialized training and the highest levels of proficiency in English. During our observations, we were especially impressed with how effectively the pre-primary program was run, and how skillful the teachers were in engaging the children to use English even among themselves in times when they could otherwise have reverted to Spanish, the dominant, more natural language. Based on our observations, if there is any imbalance in quality and quantity of input in comparable time spans (e.g. years one, two, and three exposures of the younger to the older group), it might very well be in the favor of the younger children. Nevertheless, as we will see, they were not privileged in their development as a result.
Research questions and hypotheses
Before introducing the empirical portion of the study, it is useful to more explicitly outline the research questions that follow from the discussion thus far. As such, the research questions that guide this study are as follows:
1. Is early exposure in child L2 acquisition beneficial for the acquisition of passives? In other words, can children of all ages make use of qualitatively and quantitatively similar types of input such that there are no differences in their development for passives in absolute time in the L2?
2. If asymmetric ages of exposure between child bilinguals suggest that older children acquire passives more quickly, why might this be so?
The hypotheses for these two questions are as follows:
i. Older children will have an advantage for the acquisition of some domains of grammar, particularly those that are late-acquired in all instances of child language and especially those that are related to some level of linguistic complexity and impose more demands for processing. Evidence supporting this hypothesis would be found if older L2 children require less absolute time to perform at ceiling on passives.
ii. We hypothesize that there is selectivity of domains; that is, older children are not (as) advantaged for the acquisition of all domains of grammar, but rather some specific domains. Even though both groups are tested at a point in chronological age where passives have been acquired in their L1, we must consider the age they were first exposed to the L2. At first exposure, the older group was more cognitively developed and had more linguistic experience in the L1 with structures that are later acquired, such as passives. Our hypothesis is that this is the locus of advantage for older children for these selective domains; that is, that they can make use of even the same input more effectively, resulting in quicker acquisition times for properties such as passives. This general line of reasoning is supported if, in both groups, actives are acquired before passives, as is the case in child L1 acquisition, and, despite similar input, the older group outperforms the younger group in absolute time, especially for passives.
It is important to explicitly describe what we mean by absolute time. Absolute time refers to measurable time, which in the case that children start at different ages inherently means that we are not looking at time as defined by chronological age. Concretely, absolute time refers to number of years, months, and days it takes to get from point A to point B, which in this case is the time span it takes after three years and seven months of exposure – the amount of exposure to L2 English both groups had had at the point of first testing – until they reach ceiling performance with passive and active comprehension experiments. Since the groups are separated by three years of age, and assuming that any delay for the younger group will in principle be less than three years, this means that the younger group is hypothesized to take longer in absolute time, but may well still be younger in chronological age as compared to the older group when they reach ceiling. For example, it might take the older group four years total to reach ceiling, which would mean that they perform at ceiling on the experiments by the second interval of testing (i.e. at the age range of 10;0–11;0). If the younger group takes five years to accomplish the same performance, this would mean that they score at ceiling in the third interval of testing, or at the ages of 8;0–9;0. Under such a scenario, the younger children will still be younger in chronological age when they reach ceiling, but will have taken longer in absolute time.
METHOD
We report intervals of data collection from an experiment testing comprehension of actives and passives in a 4 × 4 design where actives and passives are counterbalanced. The passives experiment was completed three times over a three-year span, starting in April of 2011. Testing participants at the end of the academic year gave them more exposure overall and also helped us to ensure that the younger children had had some exposure to primary school as well, since the older group already had four years total of academic experience in primary school (grades 1 to 4) at that point.
Participants
We report data from three experimental groups, two child L2 learner groups and a native English control group (n = 11). Given our specific research questions, the relevant comparisons will be between the two child L2 groups at each testing interval in isolation and then charting their development over time.
By circumstance of the private nature of the school itself, all children come from high SES backgrounds. To be selected for the study, the children could not have significant access to English outside of the classroom, including not having parents that report high levels of English proficiency. All participants must also have been at the school for the entirety of their education. Since the younger group started the school at the age of 3;0–4;0, it was not possible that they were students at other schools; however, in principle this would be possible for the older group, whose onset to English was at age 6;0–7;0. Excluding children who were previously enrolled at other schools meant that we could be assured that they did not have previous exposure to English. This means that for each child included in the study, irrespective of chronological age, she has had three years of exposure to English primarily as provided by the school education experience.
At interval 1, the younger group of L2 children was comprised of 27 grade 1 students (ages 6;0–7;0); the older group of L2 children was comprised of 25 grade 4 students (ages 9;0–10;0). As is normal for a study of this type, there was some attrition throughout the three years of data collection and size of the groups used for data analysis was smaller (n = 23 for the younger group and n = 20 for the older group). The rate of attrition was impressively low, however, reflecting the parents’ satisfaction with the bilingual program since almost no children left the school during this three-year period. The vast majority of the children in each group had siblings, and in the case that these siblings were of school age, they too were students at the school.
Procedures
Testing for MLU. Because the focus of this paper involves the results of the experiments over time, we will both explain the MLU tasks and provide a summary of results in this section. Before administering the experimental tasks, we had a preliminary meeting with the children in January of 2011 to accomplish the following goals: (a) select students for the experiment based on fulfillment of the criteria outlined in the subsection ‘Participants’; (b) familiarize the children with the researchers – recall that only the main researcher for the experiments was located at the school as a teacher for this academic year and was thus known to children; and (c) to perform an initial set of elicitation tasks with each participant from which we could establish Mean Length of Utterance (MLU) measures to gauge overall proficiency.
In the initial meeting, each child individually performed two types of elicited production tasks, a story-telling task and follow-up questions, taken from the Edmonton Narrative Norm Instrument (ENNI) (Schneider, Hayward & Dubé, Reference Schneider, Hayward and Dubé2006). Table 1 provides the MLUs for the individual tasks, as well as a composite MLU for each group.
MLUs for child L2 groups
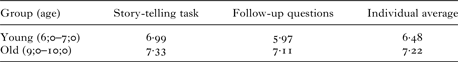
Examining the two ENNI story-telling tasks, numerically there are marginal differences in the MLUs derived from the story-telling task and a greater numerical difference in the follow-up questions task. However, a mixed-effects ANOVA with by-participant random intercepts and slopes showed that, despite these numerical differences, there were no significant differences between the groups across tasks (F(1,41·529) = 3·881; p = ·056; β = ·76; Cohen's d = ·60). To the extent that we can take MLU to be an accurate measure of proficiency in child L2, it seems that the two groups are comparable at this level.
The above analysis does not, however, mean that the two groups were qualitatively equivalent in their productions. It is the case that the older children showed higher development at the level of narrative structure, for example, as especially reflected in the follow-up questions task. That is, on average they demonstrated greater ability in narrative macro-structure such as cohesion of plot, use of transition words, adopting the perspective of the characters in their answers, and showing evidence of inference. This is, of course, not surprising since older children, irrespective of being monolingual or bilingual, are generally better with macro-structure as this requires a diverse range of pragmatic skills (e.g. Bamberg, Reference Bamberg1997; Karmiloff-Smith, Reference Karmiloff-Smith1985). Nonetheless, the MLUs are high in both groups and not statistically distinct.
Despite the differences just described, as it relates to language itself, the groups did not differ greatly in terms of the qualitative profile of their errors. That is, the same types of errors are characteristic for both groups. For example, errors included instances of omission of obligatory morphology, suppletive errors in pronominal case choice, and commission errors (oversuppliance) in morphology, examples of which are provided respectively in (3)–(5) below:
(3) The giraffe play with the airplane and the elephant want to play too.
(4) She take (hesitation) the airplane and play with they, but the giraffe was scarily of um the toy.
(5) The elephant throwed the airplane to the pool.
Additionally, there was a greater than expected use of the present tense overall in both groups. Because English allows for the present tense to be used in past event contexts when reporting a story, it is not clear what this reveals. Nevertheless, it is clear that the present is used even in contexts that would be pragmatically odd, stylistically speaking, in native English. That said, all children did provide instances of past morphological production. Other errors that can be likened directly to Spanish transfer were noted as well, such as use of null referential subject and expletive pronouns. Despite the errors, both sets of children produced complex language such as coordinated clause structures and subordinate clauses appropriately and accurately. Epistemic verbs such as to think (e.g. and I think she can't swim because she doesn't go to the airplane) were used mostly by the older children who, as mentioned, showed evidence of greater macro-structure narrative ability overall.
Passives experiment. As this study is a longitudinal one, over three consecutive years, the passives experiment was repeated three times, with a year between each interval. There were two versions of presentation, corresponding to ordering of stimuli. The version a child saw in the first interval was randomly assigned and recorded such that they received alternating versions in the subsequent intervals. The experiment was a modified picture forced-choice task to gauge the children's interpretation of counterbalanced active and passive sentences provided by the task narrator. The children were introduced to three puppets operated by two researchers. The Elmo puppet (the red character from Sesame Street) was used to narrate the experiment. At each interval, Elmo's character was played by the researcher who had worked at the school as a teacher during the first year of testing. The two other puppets were generic boy and girl puppets and were introduced as beginning learners of English. The boy and girl puppets were used to choose opposing answers (picture A or picture B) after listening to Elmo say a sentence. Each puppet chose an equal number of right and wrong pictures, and accurate pictures were equally distributed in the participants’ right and left visual fields in a randomized order. The children were told that they could help the puppets on the ‘game’ Elmo wanted to play with them because the puppets were not as good yet in English as the participant. Thus, the task of the child was to ‘help’ the boy and girl puppets as opposed to being directly questioned on their own comprehension by adults (e.g. Crain & Thornton, Reference Crain and Thornton2000). Before starting, the researcher playing the role of Elmo, a native speaker of English, engaged the children in English for 5 to 10 minutes to help them become at ease with the task, on the one hand, and into English mode, on the other.
The pictures used in this experiment contained characters from the cartoon SpongeBob Squarepants since this is a popular cartoon in Colombia. All children were familiar with the five characters, pictured from left to right in Figure 1: Squidward, Patrick, Mr Krabs, Spongebob, and Gary.
Introduction slide.

Before the test sentences and corresponding pictures were presented, Elmo asked the participant to help the boy and girl puppet learn the names of the five characters in Figure 1 in English. This was a necessary step since some of the names differ in Spanish. Thus, the experimental sentences were not presented until the participant could name all the characters correctly at least three times, once in order, once naming them backwards, and once naming them in random order as pointed to by Elmo.
Four verbs were used in a 4 × 4 design (kick, kiss, touch, find).Footnote 2 By counterbalancing active and passive sentences and switching the subjects and objects, children saw the same picture set (n = 4 sets) four times, randomized as described above, each time hearing a different sentence. Figure 2 depicts an example picture set with the characters Spongebob and Patrick.
Picture set ‘Patrick found Spongebob / Spongebob found Patrick’.
In example (6) below, the four sentences the child heard separately with this picture set are given as the target answers, A or B, in parenthesis.
- (8)
a. Patrick finds Spongebob. (A)
b. Spongebob finds Patrick. (B)
c. Spongebob was found by Patrick. (A)
d. Patrick was found by Sponge bob. (B)
RESULTS
Here we examine the results for the three participant groups: the native English control (n = 11), the younger child L2 group (n = 23), and the older child L2 group (n = 20). Only those children who completed all intervals of the task – three intervals for the younger group and two intervals for the older group – were included in the data analysis. The data for the control group was collected only once. Given our research questions, our focus is definitively not on any comparisons between English controls and the child L2 group, but rather the comparative development of the two child L2 groups over time. Therefore, we report the English control data only to show that the methodology is valid in that it yields the expected results with a native-speaker population. Moreover, it should be stated from the outset, although obvious in the data themselves when presented below, that the older children were only tested in intervals 1 and 2 precisely because they performed at ceiling already by interval 2.
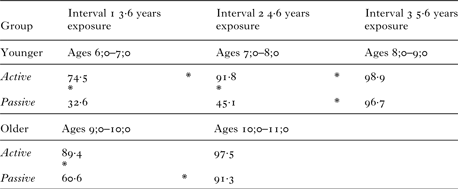
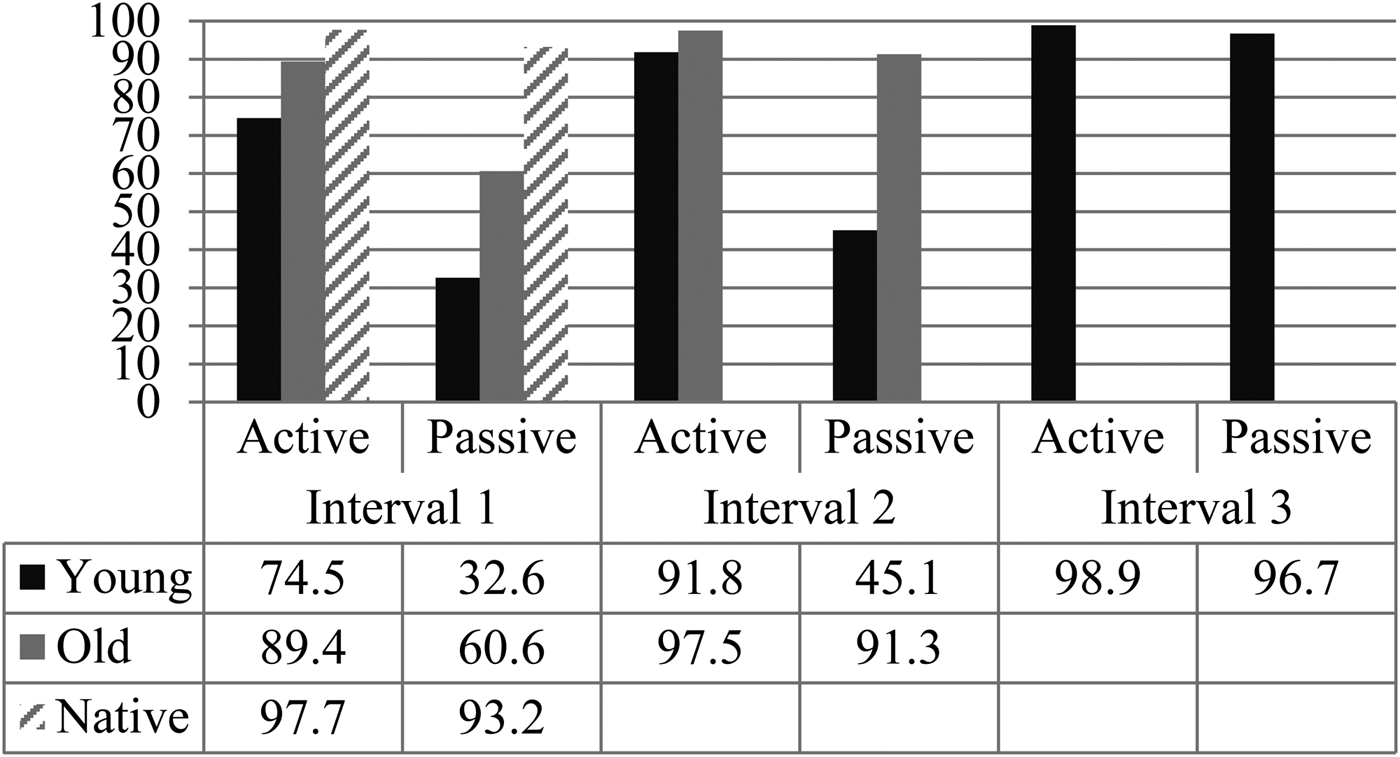
Recall that there were two item types on this task, Actives (n = 8) and (long) Passives (n = 8). Participant responses were coded as either correct or incorrect. The mean percentage correct for each group for each item type at applicable intervals is displayed in Figure 3. As a reminder, at intervals 1, 2, and 3 the younger group was aged 6;0–7;0, 7;0–8;0, and 8;0–9;0, respectively, and at intervals 1 and 2 the older group was aged 9;0–10;0 and 10;0–11;0, respectively.
Percentage correct on passives experiment (n = 8 for each item type).
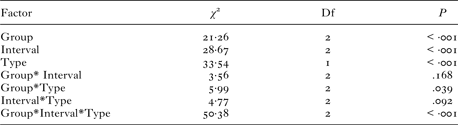
The data were analyzed using a mixed-effects logistic regression model, and pairwise contrasts. Sidak corrections were performed when necessary, as indicated by the model. The initial model included variables of Group, Type (active vs. passive), and Interval (1, 2, and 3), and all higher-order interactions of these variables; the random effects structure was the maximal structure supported by the data (see, e.g. Barr, Levy, Scheepers & Tily, Reference Barr, Levy, Scheepers and Tily2013), and included random by-subjects intercepts and slopes. Chi-square likelihood ratio tests showed that this model performed significantly better than the null model containing only random effects (χ 2(13) = 458, p < ·001), and significantly better than a model not containing the three-way interaction term (χ 2(2) = 50·38, p < ·001). Output of the full model showed a significant Group*Type*Interval interaction (χ 2(2) = 50·38, p < ·001); this interaction was further explored using post-hoc tests with Sidak correction. Significance tests of each variable in the model are given in Table 2.
Results of the mixed logistic regression model
The native control group performed as expected on the task, with mean scores above 90%. They performed similarly with both active and passive items (p = ·236), thus demonstrating the validity of the task. Furthermore, when examining the final stage for each group (interval 2 for the older group, interval 3 for the younger group), there were no differences among the three groups’ performances (F(2,858) = 1·031; p = ·357). By the end of their respective testing stages, each child L2 group performed comparably to the native speakers.
While each groups’ end-state was not different, the course of development of the child L2 groups differed from each other. The older group performed well with active items at interval 1, with a mean score of about 90%; this was significantly better than their performance with passives (around 60%; p < ·001) at this interval. At interval 2, their performance with respect to passives increased significantly from interval 1 (to around 90%; p < ·001), and there was no significant difference in performance between active and passive items (p = ·161). As performance with active items was already high at interval 1, there was, unsurprisingly, no significant increase in performance at interval 2 (p = ·078). The older group outperformed the younger in both actives (p = ·012) and passives (p < ·001) at interval 1, and in passives (p < ·001) at interval 2. As already stated, the older group's performance at interval 2 was on par with that of the native-speaker control group.
Interestingly, the pattern of development differed for the younger child L2 group. At interval 1 they fared better than chance, but not at ceiling, with active items, scoring around 75%. This was significantly better than their below-chance (around 30%) performance with passive items (p < ·001). This difference between item types was also present at interval 2 (p < ·001), where they scored above 90% with actives, but only 45% with passives. At interval 3, there were no significant differences between the item types (p = ·08); as previously mentioned, their performance at interval 3 was comparable to the native-speaker control. Performance with active items increased significantly from interval 1 to interval 2 (p = ·002), and from interval 2 to interval 3 (p = ·013). Their performance with passives, on the other hand, showed no significant increase from interval 1 to interval 2 (p = ·239), but this was followed by a significant jump in performance from interval 2 to interval 3 (p < ·001).
Ultimately, each group showed native-like knowledge of both active and passive structures. However, there were differences in both the absolute timing and path of development. At interval 1, the older group already performed well with actives, but lagged in their knowledge of passives. This discrepancy was resolved by interval 2, at which point the older group had received around 4·6 years of exposure to English. Despite having received the same amount of exposure to English as the older child L2 group at each point of testing, the younger child L2 group had less developed knowledge of actives at interval 1 and even less knowledge of passives. At interval 2, their performance reached ceiling for actives only, which means they caught up to the older group's development at interval 1 and no longer showed differences to the native-speaker control. It was not, however, until interval 3 that the younger group performed at native-like levels with passives, at which point they had had around 5·6 years of exposure to English. For ease of exposition, this information is summarized visually in Table 3.
Percentage correct for each L2 group at each interval a
notes:a * indicates p < ·05 for the adjacent percentages. For example, a statistically significant difference was found between the younger child L2 group's performance on actives in interval 1 as compared with interval 2. The same is true of their performance on actives vs. passives in interval 1.
Given these two distinct patterns of development, it is apparent that absolute time of exposure to English, which was equal between the two groups, interacts with age of exposure differentially. The acquisition of both actives and passives took longer in absolute time for child L2 learners with earlier exposure and, despite a general delay by age of exposure, actives always developed before passives.
DISCUSSION
In light of the results presented in the above section, we now revisit the research questions and their connection with the hypotheses of the present study. Essentially, our research questions can be summarized as asking: Does age at time of first significant exposure in child L2 acquisition matter for the developmental timecourse of certain domains, specifically passives, irrespective of quality and quantity of input? Or, is early exposure sufficient and always better for all grammatical domains? We tested the hypothesis that older children would be advantaged (faster) for some domains of grammar (cf. e.g. Long & Rothman, Reference Long and Rothman2014; Paradis, Reference Paradis2011) by comparing two groups of child L2 learners that have received comparable qualities and quantities of input over the same time period, yet crucially differ in age of first exposure. If access to input alone is the deterministic variable explaining overall development, then, given the comparability of the other main factors in the scenario we present, the prediction is that the data would show no significant difference in development of actives or passives in absolute time. That is, after 3+ years of exposure at interval 1, the two groups of child L2 learners should not have been significantly different in their performances, whether at ceiling or still developing. This, however, was not the case.
We hypothesized that older L2 children would have an advantage for the acquisition of (at least) some domains of grammar. Properties that are late-acquired in child language in general, such as passives, are good candidates to test this hypothesis because they can usually be related to greater complexity in terms of being computationally more involved, and thus impose greater demands on cognitive resources for processing. In the present case, following Ferreira (Reference Ferreira2003) and others, passives require more computational space given a general predisposition that leads to interpreting the first encountered noun as an agentive subject, which must be revised upon the parsing failure caused by the past participial morphology. Reanalysis of this type might be more difficult for younger learners in general, and compounded in (child) L2 acquisition, given greater dispersion of finite cognitive resources. As summarized in the ‘Results’ section, this hypothesized trend is exactly what materialized in the data. Descriptively, our hypothesis is supported. To interpret why this should be so, we first need to be clear about what we take to be cognitively more demanding and then why older children would have an advantage with such properties in absolute timing of development. For the domain of passives, complexity is taken to be a combination of the non-canonical nature of its syntactic structure and computational space required to compute them.
The child L1 literature reviewed in the ‘Introduction’ shows that children at the age of 6;0–7;0, the earliest age of the child L2 participants tested at interval 1, are able to compute and process passive structures in the L1. If it were the case that children show late knowledge of passives strictly due to properties that must mature in syntax – for example, that A-chains mature at roughly the age of 5;0–6;0 as suggested by Borer and Wexler (Reference Borer, Wexler, Roeper and Williams1987, 1989), then it should not be the case that either child L2 group here would show a different path for passive development, because they both would have a mature syntax in the abstract sense available to them at interval 1. However, if the delayed acquisition of passives in general has more to do with processing complexities (see Ferreira, Reference Ferreira2003; Marinis, Reference Marinis, Belikova, Meroni and Umeda2007; Marinis & Saddy, Reference Marinis and Saddy2013, and works cited within), then we might see protracted delays in child L2 performances across the board, and further conditioned by age across child L2 subgroups as we hypothesized. We must keep in mind that being in L2 mode itself consumes/diverts cognitive resources used for linguistic computation (see Sorace, Reference Sorace2011, and works cited within). Older children with greater working memory and presumably more developed cognitive abilities might be advantaged for properties that require more computational space. This characterization seems to fit well with our data. Despite comparable exposure to the L2 and similar proficiency as measured by MLU, the older group shows ceiling performance with passives an entire year in absolute time before the younger group. It is important to acknowledge that we are using ‘older’ as a proxy to determine greater cognitive maturity and/or skills that facilitate processing. Ideally, we would have some independent measures to show that older children indeed have more mature cognitive development, such as tests on (verbal) working memory, amongst others. Because we had limited access to and time with our populations, we were unable to do all the testing we would have liked, and thus we do not have these independent measures. Future research, however, especially in light of the results of our study that demonstrate age-conditioned differences, would benefit greatly from including these measures. Claims of cognitive maturity operationalized by older age as a proxy cannot tease apart which aspects of cognition are implicated for the apparent age effects that we see in the data. Clearly, this is a limitation in our study and indeed all studies that have used age as such a proxy.
It is informative to point out a difference between the significant changes in performance in the domain of passives across the two child L2 groups. Recall that, at interval 2, the younger L2 children still performed slightly below chance with passives, yet one year later they performed at ceiling at interval 3. The older children moved from non-ceiling to ceiling with passives between interval 1 and interval 2; however, already at interval 1 they were well above chance. Thus, the significant change for the younger children was more dramatic between intervals 2 and 3 than for the older group between intervals 1 and 2. We take this to also be a reflection, at some level, of increases in ability to process passives as a factor of age combined with exposure. These effects seem to be intertwined, because at interval 3, the younger group was at ceiling with passives, but was one year younger than the age of the older group at interval 1, in which the older group was still below ceiling with passives.
To this point, we have not committed to any specific formal description of the representational nature of passives; however, there are some aspects of our data that seem to speak in favor of a formal linguistic account of how passives work computationally. Although different in absolute time, the developmental pattern across the two groups is the same in one regard, which we believe to be revealing. Actives are mastered (i.e. acquired) first, and only after this does convergence on passives result. From such limited data it is difficult to claim definitively that actives are a necessary precursor to passives, but these data are consistent with such a developmental constraint. One advantage to our methodology that seems to support such a claim is the longitudinal nature of the data collection through which we can see that, in both groups examined, once actives were mastered, the acquisition of passives followed in the very next testing interval. Consider the fact that at interval 1, the older group shows mastery of actives, and only at interval 2, after a statistically significant increase in performance from interval 1 (p < ·001), do they show mastery of passives. This contrasts with the younger group, who from intervals 1 to 2 perform significantly better with actives (p = ·002), showing mastery, but not with passives (p = ·239). Only at interval 3 does the younger group master the passives, showing significant improvement from interval 2 (p < ·001). In both cases, the children show mastery of active sentences before reaching ceiling with passives; however, across groups, the mastery of passives does not correspond to a certain length of exposure or chronological age. There is no reason a priori why this should be. Actives being more frequent than passives as a primary explanation is tenuous at best, since it does not address the difference across our groups in age. A formal linguistic approach to the syntax of passives that proposes movement would expect an actives-before-passives scenario, as our data show for our learners. If passives are really the result of some type of manipulation of an active sentence (minimally object-to-subject movement), then one should not be able to compute passives at greater than chance levels – on average – without already having intact knowledge of the computational processes necessary for formation of active sentences. Support that actives precede passives is evident in both groups’ sequencing data over time, and is strengthened by the fact that we did not find simultaneously equal development of actives and passives in the younger group.
Considering the patterns of all the data together, it is not only evident that actives are acquired before passives, but also that actives reach ceiling necessarily – in our datasets – before passives significantly increase, and at the very next time of testing. The fact that near ceiling performance on actives seems to be a predictor for comprehension of passives in our groups favors an analysis where passives are in fact derived by movement. If movement is required, then this adds to the burden of computing passives and processing them, something that apparently can be done more efficiently by a more mature brain in childhood. Frequency of passives in input is generally low, so why does the change in state from chance performance (or less) with passives to complete target knowledge happen so dramatically over relatively short periods of time? We believe it is because they have acquired actives as supported in the data. Passives do not become any more frequent in the input between intervals, but their ability to compute them changes over time. It is possible to claim general cognitive maturity, where older age is used as a catch-all proxy for this. Our point is simply to suggest that an analysis that relates processing difficulty to syntactic movement operations implied by a formal conceptualization as described above gives a more nuanced claim as to what this complexity is for passives. Moreover, such a theory suggests further predictions about which domains of grammar will and should not be affected similarly by cognitive maturity (see, e.g. Tsimpli, Reference Tsimpli2014).
As pointed out by reviewers, an important question this study leaves open is whether similar conclusions can be reached about other aspects of grammatical development in child L2 acquisition, like tense or agreement marking, for example, which are acquired earlier than passives, but show protracted development nonetheless. In other words, do age of onset in child L2 acquisition and/or length of instruction in immersion settings such as the present one matter more generally, perhaps for all or most linguistic properties? In addition to the data presented here, there does seem to be an initial advantage for older child L2 learners with respect to verbal morphology in Dutch (e.g. Blom & Baayen, Reference Blom and Baayen2012) and English (e.g. Blom & Paradis, Reference Blom and Paradis2015; Paradis, Reference Paradis2011), suggesting that there may indeed be an overall initial advantage for older child L2 learners. However, further research examining a multitude of properties in similar populations as the present ones in combination with theoretically motivated hypotheses is needed.
To be sure, this study addresses a perennial question – ‘Is earlier always better?’ – in child bilingualism. This is of significance for the applied and practical sides of bilingualism (e.g. language policy, language education), as opposed to being of interest solely to researchers investigating the cognitive side of acquisition and processing in child L2 acquisition. Putting aside the subjective nature of first defining what ‘better’ is, it is clear that not all cases of child bilingualism are the same; the exact variables that differentiate subtypes can conspire to make that question even more difficult to answer generally, or make the answer differ by subtype. In the present study, we examined child L2 acquisition in a specific context; that is, in 50/50 bilingual immersion in school. It seems to be the case that if we take ‘better’ to mean ‘quicker’, then the answer to the earlier question is ‘no’, at least in this context of child L2 acquisition and for some domains of grammar, passives included. For the domain of grammar we focused on, the results were not neutral in the sense of showing no advantage for earlier age exposure, but seemingly suggest a disadvantage in absolute timing terms because it took the younger child L2 learners longer. This does not mean that exposing children earlier is not beneficial overall. It simply means that we need to be realistic with respect to what children L2 learners can do with limited input (both in overall quantity and in richness of variation) in immersion contexts; especially when such contexts are outside of a native environment such as the present case, for domains of grammar that require much more than exposure to input. If by ‘better’ we mean ‘sooner’ in chronological age, then the results of our study are promising. While it is true that the younger learner group took one year longer to reach ceiling, they are still one year younger than the older group in chronological age by time of convergence. It seems that it is a question of earlier or more efficient acquisition, and each outcome has its own situation-dependent value.