


Introduction
Much has been written analyzing the middle-income trap. With evidence from multiple countries across different regions, the concept describes how and why emerging economies may experience declining growth and stagnate at the middle-income level.Footnote 1 However, the middle-income trap remains contentious. Some scholars see it as a threat for emerging economies and recommend industrial and economic policy solutions.Footnote 2 Others argue it may no longer be salient because newly emergent industries offer sources of growth without relying on labor arbitrage or innovation capabilities.Footnote 3 Still others question the middle-income trap’s very existence, arguing it is not the product of insufficient skill and capital formation, but rather the result of premature economic liberalization which undermines long-term growth mechanisms.Footnote 4
A key empirical question in this debate is whether the People’s Republic of China will become trapped.Footnote 5 As China has driven global economic growth since the 1990s and is a major trading partner for other emerging economies, becoming trapped would have massive negative global impacts.
There is evidence for stagnation. China’s GDP growth rates have slowed to less than 5%.Footnote 6 Public and private debt doubled over the 2010s. Export growth has severely declined, achieving only 0.6% in 2023. Inward foreign direct investment declined by 8%. The bursting of China’s real estate bubble sparked fears of a Japan-style decade(s) of lost growth.Footnote 7 Nonetheless other scholars aver China will become a high-income country given its economy’s increased knowledge and capital intensity and sustained investment in innovation.Footnote 8 The question therefore remains: Will China fall into the middle-income trap?
This study of China’s participation in global value chains (GVC) suggests it is unlikely to remain trapped at middle-income status despite rising costs and geopolitical challenges. Evidence from the export-oriented manufacturing base in the coastal city of Dongguan, illustrates how a distinct broad approach to GVC participation created conditions for avoiding the middle-income trap: (1) agglomeration and manufacturing scale incorporating multiple stages of production, (2) a mix of foreign-invested and domestic enterprises, (3) participating in GVCs for multiple industries, (4) domestic production demand, and (5) continuously shifting government policy as the economy grows and matures. By doing all five, China has been able to, and should, continue to grow.
The city of Dongguan was chosen because it was an early participating region in GVCs, but unlike the neighboring Shenzhen Special Economic Zone, it received little central government support.Footnote 9 Dongguan is a least likely case for successful sustained development as it developed through intense dependence on foreign investment and exports, making it highly sensitive to labor cost changes that could undermine its comparative advantage. Finally, the city has witnessed multiple reinventions since 1978, showing resilience despite its reliance on low value-added export processing. This makes it a critical case, as it is much less likely than regions with broader industrial and economic bases or central government support to be able to transition away from this unsustainable approach to development. Hence, the lessons it provides suggest the efficacy of GVC participation for sustained growth even under suboptimal business environmental conditions.
This article first presents background literature on the middle-income trap, GVCs and economic development, and perspectives on China and the middle-income trap. The methodology presents the single case method used to develop the empirical arguments. This is followed an in-depth description of four decades of GVC participation in Dongguan, demonstrating how shifting patterns of GVC participation and government policy have enabled sustained growth. The discussion and conclusion section expands these lessons for China more broadly and presents comparative implications for other emerging economies. It also describes threats to the future development of China and other middle-income countries and potential boundary conditions from studying Dongguan as the sub-national case.
Literature background
Concerning the middle-income trap
The middle-income trap is a condition in which countries achieve rapid economic growth and escape from the “poverty-trap” of stagnant development at extremely low levels of income, but then stagnate at lower or upper middle-income status.Footnote 10 Doner and Schneider define trapped countries as having per capita income between $2000 and $7500 for over 28 years, $7500 and $11500 for over 14 years, or over 42 years in total.Footnote 11
Two intersecting forces drive stagnation. Increasing wealth creates new opportunities for workers, decreasing the number willing to accept low wage manufacturing work, increasing wages and undermining labor-intensive export industries. These higher costs lead foreign enterprises to increasingly source from lower cost locations. Following the pattern of development since the industrial revolution, this is to be expected. As wages rise, capital- and innovation-intensive industries should supplant labor-intensive manufacturing.Footnote 12 However, in many middle-income countries, labor costs rise faster than the country can develop the capabilities for capital- and knowledge-intensive industries.Footnote 13 Uncompetitive in both labor-intensive and high-technology industries, the economic growth rate falls below that of population growth, producing stagnation. This explanation has helped account for experience of countries including Malaysia, Mexico, and Thailand.Footnote 14 Other instances of the middle-income trap such as Brazil and Argentina are argued to be the product of cycles of investment fueled growth and debt-crisis-driven contraction which inhibit the ability to sustain growth over time, even without initial reliance on labor-intensive export manufacturing. However, as these countries have not followed the GVC participation approach to development, the analysis which follows does not claim to address their experience with the middle-income trap.
GVC participation and development
GVCs are networks in which goods are sourced, produced, distributed, and sold by multiple actors in disparate international locations.Footnote 15 GVCs reduce costs and provide access to unique external resources.Footnote 16 Unlike vertically integrated or nationally oriented firms, GVCs offer economies of scale and scope which reduce costs and larger potential markets.Footnote 17 Lead firms lower production costs through outsourcing to narrowly specialized producers. Producers benefit from selling their production capacity to multiple lead firms. Suppliers sell identical components to multiple producers, affording them larger markets than possible if relying on domestic buyers.Footnote 18
GVC participation is associated with greater rates of national economic development and knowledge transfer than in regions pursuing autarkic or import-substitution development.Footnote 19 The economies which achieved high-income status in the 1980s and 1990s—South Korea, Taiwan, Hong Kong, Singapore, Costa Rica, Mauritius, Ireland, and Israel—all actively participated in GVCs.Footnote 20 Access to global markets made it possible for manufacturers in these small economies to grow larger than they could relying on domestic sales. Producers improved their skills and quality by producing for the most sophisticated lead firms in the global economy.Footnote 21 These economies’ successful development also hinged on an active, often local, state which leveraged GVC participation and varied local organizations to foster capabilities development.Footnote 22
GVC participation is not a panacea, however, as not all economies which do so avoid the middle-income trap. Mexico, Malaysia, the Philippines, and Indonesia all host extensive export-oriented foreign manufacturing sectors as well as networks of suppliers and contract manufacturers.Footnote 23 Yet these countries are also commonly cited as examples of the middle-income trap. These contrary examples suggest it remains to be seen how GVC participation can result in sustained economic growth.
China and the middle-income trap
After 2008 China experienced rising labor costs amid limited innovative capacity. The 2008 Labor Law significantly increased manufacturing wages.Footnote 24 Decreased supply of migrant labor increased manufacturing wages by ten percent or more annually throughout the 2010s.Footnote 25 Despite sustained R&D investment, high technology industries, particularly electronics and IT hardware, remained heavily dependent on foreign intellectual property and components.Footnote 26 The impact of restricting access to integrated circuits on leading firms such as Huawei has revealed the depth of China’s reliance on foreign technology.Footnote 27 Concerned about the US-China trade war and bottlenecks during the COVID-19 pandemic, many GVC lead firms have begun reducing orders from China.Footnote 28 Decreasing orders and falling foreign investment threaten to undermine the manufacturing engine that powered China’s economic growth.Footnote 29 China also faces massive deleveraging following debt-fueled growth of the 2010s.Footnote 30 These forces reduced GDP growth to 3% in 2022, widely considered too slow to attain high-income status. Despite these negative trends, some recent articles still argue China’s overall economic health remains robust and sustained growth likely.Footnote 31 This further suggests the need to study the middle-income trap in the Chinese context.
Methodology
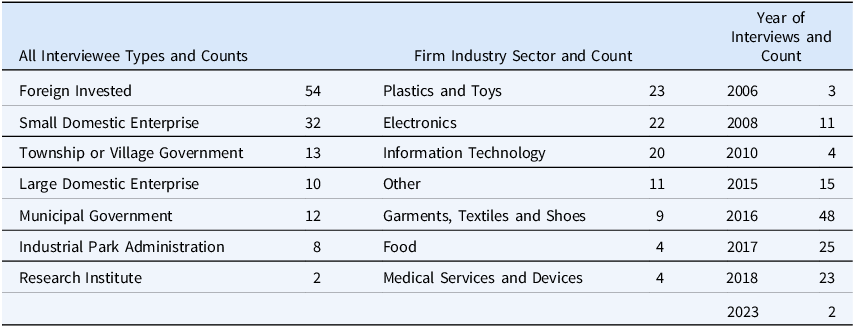
This article uses the case of Dongguan to consider GVC participation and avoidance of the middle-income trap. Longitudinal fieldwork from 2006 to 2023 yielded a sample of 131 interviews. All but nine were conducted in Mandarin Chinese. Interpreters were not used as the authors are fluent in Mandarin and English. To encourage active participation, interviewees were guaranteed anonymity and are referenced with a descriptor and year, keeping with the need for contextual sensitivity.Footnote 32 Interviews were semi-structured and lasted between 60 and 180 minutes.Footnote 33 The interviewed organizations were small and large domestic enterprises, foreign-invested enterprises, township and city-level government offices, industrial park management, research institutions, and industry associations. Domestic enterprises were interviewed to understand their roles in GVCs and the opportunities and challenges they face. Foreign-invested enterprises were chosen to understand why they invested, why they remain, how they were adjusting to changes in overseas demand and domestic costs, and their long-term plans regarding China. Government offices provided information on policies, regulations, research, and incentives used to encourage FDI, upgrading and changes in business practice. Government offices’ input was important as much of the policy promoting GVC participation was crafted at the township level.Footnote 34 Industrial parks’ management offered insights into their enterprises’ performance and support practices used to encourage firms to invest. Research institutions provided insights on skill building and innovation. Industry associations discussed the economic climate facing exporters. Interviewing top leaders in these organizations corresponds with the approach established in prior globalized manufacturing studies.Footnote 35 Table 1 provides summary statistics on the interviews.
Interviewee summary counts

Case introduction and justification
Dongguan serves as a critical case of China’s potential for continued growth. Dongguan was China’s first city open to foreign-invested exporters. It exemplifies China’s broader transformation like that experienced in other second or third tier export hubs such as Wenzhou and Wuxi. Like Dongguan, these cities grew thanks to participation in GVCs and heavy, especially in Wuxi, influence of foreign investment. Like Wenzhou, in 1978, Dongguan was rural, underdeveloped, and devoid of academic research infrastructure.Footnote 36 Through GVC participation focused on assembly and component production, Dongguan achieved double digit economic growth from the 1990s through 2008 (See Figure 1).
China and Dongguan growth rates (1995–2023).
Source: China Statistics Bureau; Dongguan Statistics Bureau.

As elsewhere in China, growth rates declined after 2008. Dongguan began experiencing labor shortages, rising wages, and declining overseas orders in the early 2010s, even before these conditions began impacting the nation more broadly. Dongguan experienced steeper declines in growth rates than the national average.Footnote 37 Dongguan thus illustrates the challenges facing China’s economy. However, despite this slowdown, Dongguan has continued to grow. If Dongguan, fully dependent on export demand and labor cost arbitrage, without any significant research and academic infrastructure or preferential treatment from the central government, can transition to higher value-added industries and activities in GVCs, it suggests such a transition is possible in other GVC-oriented regions and that its approach to GVC participation may lead to growth out of the middle-income trap. The same forces are testing the sustainability of other export manufacturing hubs. Like Dongguan, growth in cities including Suzhou and Shenzhen is increasingly driven by domestic demand and new lead firms. The Dongguan experience thus helps highlight the changes wrought by GVC participation and how these make sustained growth possible.
Empirical findings
In 1978, China’s per capita GDP was $156. Over 100 million peasants’ grain allocation was the equivalent of 1500 calories per day.Footnote 38 Agricultural communes had massive underemployment. The end of the “Sent Down Youth” program of sending graduates to rural communes saw millions of young people return to cities where the planned economy was unable to absorb them.Footnote 39 Dongguan and the surrounding region had been deliberately starved of investment since 1949.Footnote 40 To meet these challenges, Deng Xiaoping pushed aggressive reforms in agriculture, foreign investment and light industry.Footnote 41 These reforms authorized foreign investment in Dongguan, launching its participation in GVCs.Footnote 42 Under a mandate to promote rapid economic growth, Dongguan’s authorities turned to deepening connections with the global economy.Footnote 43 Lacking an existing industrial base, Dongguan pushed for foreign investment in labor-intensive export-processing.Footnote 44
GVC participation began through manufacturing investment from Hong Kong and, later, Taiwan. Early foreign investments were small, averaging only $11,538 USD in 1980 and $25,641 in 1981. As late as 1989, the average foreign-invested manufacturing project committed less than $40,000.Footnote 45
Dongguan authorities developed policy innovations to attract foreign investment. Through the 1990s, policies focused on providing road, port, electricity, telecommunications and industry park infrastructure. Industrial parks offered pre-fabricated factory buildings, dormitories, and shared industrial assets like quality control or testing labs. A township foreign trade office explained:
Cheap space is provided to favoured industrial sectors and enterprises. In our township industrial park, land can be provided for the firm to develop itself or we provide prefabricated factories which are leased cheaply. Village-level parks like Xie Hang Cun generally provide prefabricated factories leased cheaply to investing firms. (2008)
Government policy shifted with changes in foreign investors’ demands.Footnote 46 In response to frustrations with bureaucratic obstacles to investment permits, governments set up one-stop shop offices where foreign businesses could complete all necessary paperwork for export-processing enterprises. The municipal government established promotional offices in Hong Kong to facilitate investment. Barriers to enter were further lowered by not mandating knowledge- or capital-intensity. The only requirement was commitment to produce goods solely for export. These policies, combined with Dongguan’s low labor costs and proximity to Hong Kong and Taiwan, fueled an investment boom. Inward foreign investment increased year on year through the 1980s and 90s.
The volume of inward FDI led to a geographic shift. Foreign factories in specific products (shoes, furniture, knitwear, electronics) concentrated in different townships, creating specialized production agglomerations. By the 2000s, Chang’An was well-known for electronics, Dalang for knit goods, Houjie for furniture and Humen for shoes. These one-industry towns developed as a result of their role in GVCs. Large foreign final goods assemblers such as Delta Power Supplies in Shijie or Bubukao in Chang’An invested to take advantage of inexpensive labor and facilities. These anchor factories then encourage or demanded their suppliers follow:
(Our township) specializes in electronic components and computer peripherals. 90% of computer parts are made right here. Industrialization here started with Hong Kong and Taiwanese firms seeking low land and labor costs. Delta Power Supplies and Dongju Electronics came here and brought a huge number of electronics enterprises with them. They were able to convince their friends, other bosses, to come here. These two came, and they were able to attract their suppliers and customers. (2015)
As suppliers clustered, towns gained industry-specific capabilities, with the main industry becoming the “Dragon’s Head” of the local economy and an incentive for further inward investment. A township economic development board explained:
The computer hardware industry is our Dragon’s Head. This is the pillar industry…Hong Kong and Taiwanese firms started moving their hardware assembly here early. Investors chose the location for investment by the production chain and supplier network. We have a nearly complete computer production system which means investors want to set up here because the suppliers and customers for component manufacturers are close. (2008)
Local government policy supports these dragon’s heads by identifying missing suppliers, components, or sources of demand and then recruiting foreign enterprises to fill them. For skill and infrastructure gaps, local authorities established training and upgrading facilities. The director of the technology and quality improvement department of Dongguan’s municipal economic and trade bureau explained:
Our office knows what areas need improvement as well as investment and support because we produce an annual report which shows the industry statistics and gaps in the industry chain. Officials go and interview companies to get their perspectives on what is needed and use this insight to inform local policy. (2008)
From these agglomerations of lead and supporting foreign-invested firms producing for overseas buyers, domestic firms began to embed into the same value chains. In the 2000s, global demand grew faster than Dongguan’s export processors’ capacity, creating entrepreneurial opportunities. Experienced local workers launched new ventures to capitalize on co-located sources of demand for output (large assemblers) and supply of components (from existing foreign-invested suppliers). Many began by subcontracting for overwhelmed foreign-invested factories. Township authorities explained the skill transfer and entrepreneurship process:
We had so many Hong Kong and Taiwanese firms here bringing technology and knowledge. They employed over one million people and upgraded [workers’] capabilities. These trained workers are now the bosses of the indigenous firms in Dongguan. (2017)
Workers in foreign-invested factories recognized new opportunities and launched ventures supplying co-located foreign factories or offering contract manufacturing.Footnote 47 Through frequent interactions, under the auspices of local business associations, foreign subsidiaries and Chinese start-ups began exploring avenues for cooperation.Footnote 48 Township officials noted they worked with new local enterprises to help connect them to potential locally based foreign buyers:
Step by step, the minyingFootnote 49 industrial enterprises completely developed. The government helped along the way with production, introduction to markets, and assistance with human resources. (2008)
Another noted:
For local private firms, what the government can help with is introduce some local manufacturers to foreign firms so that they can learn from the talented professionals. (2008)
As quality control improved, foreign-invested firms increasingly became willing to source from indigenous firms as well:
We now source almost entirely from domestic firms—80%. About 20% of our inputs come from Taiwanese-invested firms here in Dongguan. The fact is, the best local firms are now good enough and they are highly competitive and competent manufacturers so why not use their inputs? (2015)
During this time, the availability of components and potential buyers and deep familiarity with foreign demand patterns through GVCs led Chinese brands to emerge. Firms such as Oppo, Vivo, Huawei, Haier, Lenovo, and TCL became competitive global brands. Dongguan’s municipal government has actively worked to encourage these brands to invest and become new local anchor firms for co-located suppliers:
We now have some projects to bring in anchoring firms. Dongguan has always had a problem of having many stars but no moon. This means there are thousands of small enterprises but no major anchor firms. We need to bring in a moon. Huawei, for instance, recently finished a 50 billion RMB investment in Songshan Lake, the first investment of this scale in Dongguan. (2015)
Having originally focused on the domestic market, Chinese brands developed networks of domestic suppliers, further driving domestic demand for co-located suppliers. Later brands such as Transsion, which actually does its final assembly outside of China, draw upon Chinese component suppliers to facilitate their manufacturing. This practice of drawing on existing China-based suppliers has continued as other Chinese lead firms expand internationally.Footnote 50 The presence of large lead firms increases Dongguan’s attractiveness to other lead firms, making this promotion a key portion of the ongoing development strategy:
We are going to bring in larger anchor firms. You may have heard of CEC, one of the largest electronics manufacturers and cell phone makers in China. They are shrinking their Shenzhen factory and moving here—partly because even though Dongguan is expensive, it is still cheaper than Shenzhen. Large firms can attract high-end workers because they have their own distinct culture and advantage. With CEC coming, the government is planning to attract more of these large anchor firms to help bring in better human resources. (2015)
With the greater human resource requirements of these new anchor firms, Dongguan officials began tailoring promotional policies to encourage innovation and increase industrial value-added, while preserving labor-intensive manufacturing. The integrated and complete production chain was seen as key to preserving economic growth by helping retain low- and high-end manufacturing. As a Chang’An township official noted:
The production chain is still a major source of sustained economic advantage for manufacturers here. It is like ordering food in a restaurant. They have all the ingredients right over there so they can put it together right away. (2015)
Resilience in Dongguan—how to avoid the middle-income trap
This section explores the impact from the combination of multiple industries, stages of production, foreign and domestic suppliers and lead firms developed from 1978 to 2008. Continued development became increasingly difficult after 2008 as the global business environment shifted. In Dongguan, growth rates fell from nearly twenty percent to five percent between 2007 and 2008 during the “Great Recession.” However, rather than economic stagnation, changes in the manufacturing economy pushed shifts in GVC participation and activities’ upgrading.
Rather than simply closing facilities and relocating to lower-cost locations in response to Dongguan’s rising labor costs, foreign companies saw the complete local production chain as an important external resource. Labor costs have declined in importance compared with co-location of suppliers as a foreign executive who decided to stay in Dongguan stated frankly:
Yes, Vietnam would be cheaper. But whatever you want to make you can find the parts immediately in this area. If the factory was in Vietnam, the components would not be there. This would be bad for a firm like ours. (2016)
Firms which committed to maintaining a presence in Dongguan began increasing local value-added to offset higher operating costs through adding design, development and research capabilities. As a Taiwanese electronic components firm explained:
Our administrative office and main R&D facility is still in Taiwan. But we now have a major R&D center in Guangzhou, another in Beijing and one here. We have over 400 R&D workers in Guangzhou and another 1000 performing R&D in Dongguan. (2016)
Other firms remain dedicated manufacturers but have upgraded the types of products made in Dongguan. With strong local demand, firms can offer other, higher-value, types of components, and manufacturing services confident there will be demand for their new outputs.Footnote 51 A Japanese contract manufacturer explained:
We have a strong hardware capacity for higher-end goods in our contract offerings. Lower end goods can be produced at our Thai or Vietnamese factories. We will do the more sophisticated work here. (2015)
The local government took an active role in promoting upgrading and industry retention by incentivizing automation, development of independent brands, marketing capacity, and domestic sales. The resulting changes in business approach have become drivers of renewed economic growth, even as thousands of foreign-invested firms have left Dongguan and many labor-intensive domestic-owned factories closed.
To promote automation, the Dongguan city government offers manufacturers matching funds up to 20% of the cost of acquiring new automated production equipment. A municipal government interviewee was blunt about the policy objective:
The Jiqi Huanren Footnote 52 subsidy is a tool by which we are guiding manufacturers to upgrade their production technology and move away from labor-intensive production methods. (2016)
To encourage additional local development, the maximum 20% subsidy requires that the automation equipment be produced in Dongguan. Industrial automation technology thus becomes a part of the local GVC-linked production system. It increases the capabilities and attractiveness of local manufacturers, helping maintain their competitiveness for attracting overseas orders. The rising adoption of automation technologies has been observed in other recent scholarship which highlights the changing demands for labor that result—shifting from unskilled migrant labor to high skilled workers.Footnote 53
This nascent industrial automation sector is possible thanks to the scope and scale of Dongguan’s electronics industry. With the large number of firms, at all levels of production and sophistication, it was reasonable for the local government to demand, and for businesses to positively respond by, diversifying to produce automation equipment suited to their specific production demands. A science park director spoke proudly of the former shoe manufacturer that now specialized in automated shoe production equipment. A Hong Kong-invested toy manufacturer is now developing automated production equipment. The ability to design and manufacture advanced production equipment further cements Dongguan’s position in GVCs. This is akin to the high-end machine tool industry in which German control over the manufacture of production equipment gave German firms a significant advantage over North American competitors who were also using the German machinery to produce.Footnote 54 Dongguan’s municipal government researched different automation technology firms in the 2010s and encouraged them to invest locally, usually by demonstrating that between the subsidies available to potential customers and the cost-control motivation to adopt automation, they were ensured significant demand for Dongguan-based production.
Beyond automation technologies, Dongguan’s municipal government encourages foreign-invested and domestic firms to adopt information technology solutions to upgrade their business models. The head of Dongguan’s informationalization office explained the situation, again linking it to the problem of rising costs:
In the past, workers were very cheap so factories were set up here. When labor was cheap, labor-intensive industries rationally ignored applying expensive automation or management software and other tools. When the export markets were strong, online sales were less important. Now, the labor is limited, wages are rising, so the old model won’t work. (2015)
Many domestic firms that had initially followed the same production and order sourcing models for GVC participation as their foreign-invested peers actively adopted information technologies to upgrade their capabilities and increase their visibility and competitiveness. A director of the municipal informationalization office explained:
Actually, domestic enterprises are better at adopting informationalization compared with foreign export-processing enterprises. They are trying to move from OEM to ODM and use platforms for innovation and upgrading. There were all once just assembly but since 2008 they have had to grow in an all-around way. (2015)
This process is occurring even at the more traditional manufacturing companies, as the official continued:
I recall company X, an underwear firm. About 20 years ago the firm had lots of overseas orders and very large production scale, but it had no sales department. It only received 10 cents wholesale for each pair it shipped. During an international trip we organized, the boss saw their underwear selling for $7 a pair in US stores. He saw that his firm’s model was terrible. The firm started looking for small orders with many different customers, producing specialized underwear. The revenue increased from 10 cents to 70 cents and then to 2 dollars per pair. Specialized orders command higher margins. (2016)
While not all firms do so, the practice of creating a distinct brand while continuing to produce as contract manufacturers in GVCs, has also become widespread. A foreign business association pointed to the efforts they are making with the local government to encourage firms to launch independent brands:
In the export processing model, margins are very low. If you have your own brand, you get much higher margins and can actually gain market share as opposed to waiting for, and fighting over, processing orders. But brands require R&D. Many bosses never did this. Many bosses have never thought about marketing, identity, innovation or upgrading. (2016)
Dongguan is now home to brands like Oppo and Cosmo Lady. Their branded sales focus on China’s domestic market. They simultaneously pursued independent brands for domestic sales while also performing contract production for overseas brands. These firms showed the potential value of the domestic market, an area that other GVC-linked firms increasingly pursue. A foreign business association noted that there has been a need to convince Taiwanese-invested component and final products factories to consider sales within China rather than exports:
The Taiwanese businessmen, we must admit, are still oriented toward exports first. But in meetings, we are pushing this idea of: ‘Exports as the base, but domestic sales for wealth’. (2016)
This reticence is understandable, however, as domestic sales were effectively banned for many years.Footnote 55 However, in response to the post 2008 collapse in overseas demand, local governments throughout China began encouraging foreign-invested enterprises to sell on the domestic market to offset declining overseas demand. China’s domestic market offers an anchor for foreign subsidiaries. While overall domestic consumer demand has grown slowly, it increasingly functions as a driver of overall economic growth.Footnote 56
Firms seeking to maximize domestic sales cannot easily relocate out of China for fear of losing market access, especially in the context of broader geopolitical concerns. For export-oriented GVC production centers like Dongguan, the presence of Dongguan’s collocated supplier base makes it cost effective to manufacture within China for domestic customers. Export-processors have responded to this opportunity, finding the domestic market helps sustain revenue as overseas demand falls. Given that Dongguan-based manufacturers perform many production activities apart from final assembly, much local demand is for intermediate components to be consumed by other co-located manufacturers, many of whom still emphasize exports of final goods. This incentivizes firms to remain in China, even when lower-cost locations are available. A Taiwanese electronic components manufacturer explained:
The domestic market is here in China and still growing so it only makes sense to remain. Further, we will go to our customers. For customers in the Pearl River DeltaFootnote 57 (other manufacturers), we should keep a factory here. We have a factory in Suzhou to serve customers there. Maybe in the future we will open a factory in Vietnam too, but we would not close down here, we are now serving the local market with our factories in China. (2015)
Promoting automation, informationalization, branding and domestic sales has sustained growth, even as labor-intensive export-processing is increasingly unprofitable. Growth has continued as firms see opportunities from upgrading in China rather than relocating to lower cost locations. A Taiwanese factory manager who had been in Dongguan since the late 1980s explained this perspective:
Firms will fail if they keep their old mindset. I see this at the meetings we go to; everyone gripes. Some moved factories to Vietnam, but we still outproduce them. Moving to a cheaper location is only a temporary, maybe 5-year, fix before wages rise. The boss went to Vietnam to look but decided it would be better to stay here and upgrade. With transformation and upgrading, many firms will stay in Dongguan. (2016)
Further, entrepreneurial opportunities remain, since there are multiple streams of revenue from foreign and domestic sales, contract production and self-branded products. Local entrepreneurs see continued opportunities, so long as they remain willing to take risks and build on the region’s existing capabilities, as a former factory worker turned entrepreneur explained:
The foreign firms in Dongguan which dominated contract manufacturing for thirty years are now getting beaten by us. They don’t know how to change their management or methods. They can’t shift products. But then we have nothing to lose so we are fearless. (2017)
Table 2 shows the growth rates for various industries in the city of Dongguan since 2012. Heavy industry, high technology products, electronics, and advanced manufacturing continue to grow even with the advent of the US-China trade war in 2018 and the difficult post COVID-19 global recovery. Light industry, with low value-added and heavy reliance on labor-cost arbitrage and overseas demand, had slower growth over the 2010s and is now steadily declining. However, this is not surprising as labor-intensive industry gives way to capital and knowledge-intensive industry. This is the expected transition to upper income in which knowledge, capital, and services, not labor-cost arbitrage, drive growth. Even increased focus on domestic demand, the vast majority of Dongguan’s industrial output is ultimately destined for export, showing the resilience of higher value-added manufacturing for the global market.
Select industry growth rates (2012-2023)
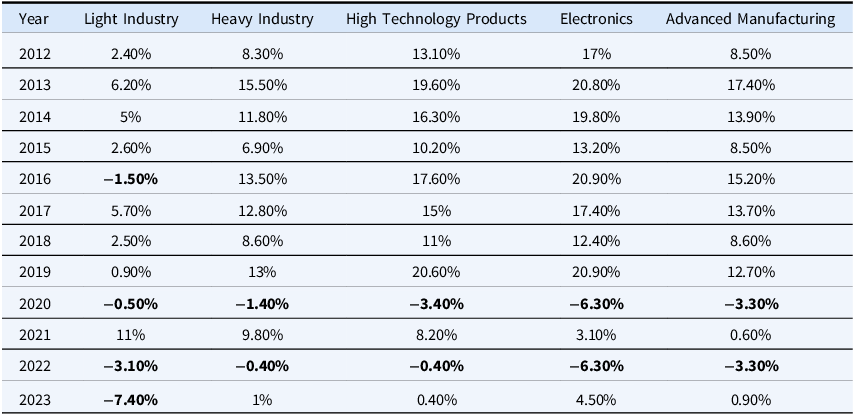
Source: Dongguan Statistics Bureau.
China’s overall economic performance is still heavily influenced by its ability to export manufactured products. The recent declines in demand from the United States and, increasingly, European Union as a result of rising trade tensions have not reduced overall exports. New sources of demand including the Belt and Road Initiative countries and the 2022 Regional Comprehensive Economic Partnership (RCEP) trade block with Southeast Asia, Australia, and New Zealand. Exports to these regions increased by 6.9% and 6.3%.Footnote 58 RCEP now accounts for 53.5% of all China’s trade. The capabilities developed through GVC participation oriented toward the United States and Europe have translated into new vitality in exporting to these alternative growing markets.
Discussion and conclusion
Since beginning to participate in GVCs in 1978, China experienced nine percent average annual GDP growth for thirty years. It took 27 years just to reach lower middle-income status. China has spent only nineteen years as a middle-income country. Accordingly, by the Doner and Schneider (Reference Doner and Schneider2016) definition, China cannot be said to be trapped. Furthermore, despite slower GDP growth after 2007, China reached upper middle-income status after only eight years, faster than the East Asian Tiger economies. Finally, with the 2023 World Bank definition of high-income countries as having per capita income of 13,205 USD, China is on the cusp as it had had per capita income of $12,741 in 2022.Footnote 59
As China is not currently subject to the middle-income trap, the question to be answered is whether it can sustain growth to achieve upper income status in the short to medium term. The case of development and continued growth in Dongguan suggests the combination of characteristics from its (and hence, China’s) GVC participation may foster sustained growth amid rising costs and changing global conditions.
First, the Dongguan case suggests the critical importance of co-located foreign-invested firms operating at multiple levels within the value chain. Like other emerging economies, China’s attracted large amounts of foreign direct investment with foreign-owned production subsidiaries taking defined orders for fully designed and standardized products and producing for export. However, unlike other emerging economies such as Thailand or Malaysia which have become trapped, China’s approach to GVC participation emphasized the building of regional clusters. In this way it follows the Taiwanese development experience of attracting multiple levels of investments, such as Japanese motorcycle firms as well as their suppliers and sub-suppliers. Having investments at multiple levels of production affords varied sources of growth from local and global demand. The Dongguan case suggests even if the final markets are overseas, sustainable GVC-based economic growth requires locally based suppliers to contract manufacturers. Local business-to-business sales for components, raw materials, and business services (accounting, marketing, design) create more opportunities, attracting further foreign investment and capabilities, and broadening the scope for local entrepreneurship. This affords more sustainable growth than a focus solely on final assembly for export.
Second, heavy—or exclusive—reliance on foreign investment is insufficient for sustained development. Dongguan, like Hong Kong and Taiwan in previous decades, promoted development of locally owned suppliers. Dongguan’s experience since the mid-2010s has shown that foreign-invested enterprises are likely to close or relocate to lower-cost locations. In the immediate aftermath of the 2008 Financial Crisis, thousands of foreign-invested firms either went bankrupt or relocated under the combination of rising labor costs and declining demand.Footnote 60 Foreign investment-based GVC participation thus may not yield sustainable growth because foreign firms are highly mobile in the face of rising costs or other challenges. In contrast, Dongguan’s mix of foreign and domestically owned firms provides a more sustainable environment. In Dongguan, as elsewhere in China, some domestic enterprises have become lead firms in their own right. As producers of final branded products, they draw on the co-located locally and foreign owned manufacturing base, making them globally competitive and able to access the same high-quality resources as incumbent foreign lead firms.Footnote 61 Domestic lead firms provide a further source of demand for domestically owned local suppliers. This does not discount the importance of a strong foreign presence. Foreign firms bring global knowledge and best practice, especially in production management, order solicitation, and quality control. Their presence is thus essential, especially when the local economy lacks these capabilities. However, the strong involvement of domestic suppliers is critical as well. A vibrant domestic supplier base helps prevent the enclave effect in which foreign enterprises only look vertically to suppliers and customers outside the host region, limiting their contact with, and contribution to, the host region economy. Thailand’s experience in the rubber manufacturing industry shows how total control by foreign enterprises limits growth potential and opportunities for domestic firms.Footnote 62 The Malaysian experience in the same industry shows that a focus on promoting domestic manufacturers alongside foreign-invested facilities creates greater growth opportunities.Footnote 63 However, as both Thailand and Malaysia are arguably still facing the middle-income trap, having a multi-production stage mixture of foreign and domestic enterprises is likely insufficient.
Third, the emergence of multiple locally integrated industry-specific towns suggests overall reliance on a single industry is unlikely to yield sustainable growth benefits. Even economies famous for a single industry, such as ICT hardware in Taiwan, did not wholly rely on this industry to drive regional growth. During Taiwan’s rapid development period, manufacturers participated actively in GVCs for textiles, shoes, consumer and industrial plastics, general electronics, and personal accessories. Having multiple industries, like Dongguan—with townships individually focused (although not exclusively) on single industries—creates a sustainable development base. Raw materials and components can be shared or supplied across sectors (like plastics firms producing toys and hunting decoys but also plastic parts for electronics).Footnote 64 Capabilities and knowledge from one sector can be used to spur innovation and upgrading in others. The combination of characteristic one with industry-focused towns means Dongguan’s industry participates in GVCs at multiple levels across multiple industries, helping insulate the broader economy from slow-downs in any single sector as well as providing greater sales and sourcing opportunities for firms producing a variety of industrial inputs.
Fourth, domestic demand—both business and consumer—is a key feature of Dongguan’s GVC participation. The existing middle-income trap literature largely neglects the role played by the domestic market as a source of sustained growth. In Dongguan, even where products were ultimately destined for export, the multiple levels of production and emergence of domestic lead firms provide substantial business demand in the local economy. This generates more resilient growth than final assembly alone. Whether foreign invested or domestic, companies which hitherto specialize in production for export, should focus on the potential offered by the domestic consumer market. In the Dongguan case, the domestic market was directly promoted through changing regulations on export requirements and focus on fostering capabilities for domestic branding and marketing. Government attention to promoting the domestic market played a major role in creating the conditions for sustained growth. While China’s uniquely large population and middle-class consumer base may be difficult for other countries to replicate, it will be critical in similarly large emerging economies such as India, Indonesia and Nigeria, to focus on the potential offered by the domestic market. For emerging economies that have historically focused on their domestic markets—Brazil and Argentina—the opposite focus on greater exports and attracting inward FDI should be encouraged.
Finally, the Dongguan case suggests government policies and promotion must be flexible over time. The demands of development when initiating GVC participation, building clusters, or promoting upgrading require different government policies. Unlike the “developmental state” concept used to explain Japan and Korea’s development, the Dongguan case suggests government need not be a commanding guiding hand nor necessarily initiate strong industrial policy, even at the local level.Footnote 65 Instead, the government needs to be highly flexible. It needs to first attract a broad selection of foreign investments across multiple stages and industries. It must also encourage or facilitate local entrepreneurship to serve niches in these GVCs. Crucially, governments should bridge domestic and foreign firms, both those already located in the region and potential overseas buyers. In some cases, this may resemble mandatory local content requirements or joint ventures, but it can also take the form of less command-based policies such as formation of social spaces where local and foreign firms and government can interact and build trust for knowledge, sourcing and work sharing.Footnote 66 Governments should encourage the upgrading of local firms through examining their capabilities, as well as weaknesses, and working to build upon, or mitigate, them as necessary. The promotion of domestic sales is also crucial as domestic consumption should be the ultimate source of demand for sustainable growth over the long term.
To accomplish these various objectives, government policy must change over time. The policies for attracting FDI when a region is economically backward will differ widely from those necessary once an emergent cluster is forming. Further, different policies are required to foster linkages between foreign invested and collocated domestic firms. Government policies must be based on continual study of the local industry to identify gaps and opportunities for upgrading. Providing incentives for automation, R&D, marketing, branding, new exports, and new domestic sales should be part of any government policy package but must be applied at different times based on research into the capabilities, and challenges, of GVC-participating firms. Countries that have escaped the middle-income trap should have such flexible states. South Korea, for instance, favored its integrated Chaebols during much of its catch up but has since shifted to aggressive promotion of entrepreneurship and SMEs. Taiwan once favored small manufacturers but now has shifted to promoting its largest leading manufacturing firms.
Escaping the middle-income trap has repeatedly occurred through GVC participation. Fragmentation of design and definition, component production, assembly, marketing and after-sales services among many dedicated firms creates opportunities for regions to industrialize and benefit from global demand and knowledge flows even without necessarily developing capabilities for the full production chain. These opportunities allowed the Tiger economies to develop by facilitating high levels of investment which fostered entrepreneurial opportunities as government also promoted multiple pathways for upgrading in globally connected industries. Through Hong Kong and Taiwanese investments in Mainland China, these opportunities were passed on again. However, the Chinese case as evidenced in Dongguan shows that passively relying on foreign investment and GVC participation will not be successful. Instead, it takes a focus on developing a broad export-oriented industrial base, participation in the GVCs for multiple industries, a mix of foreign and domestic enterprises, a focus on developing domestic demand, and flexible shifting government policy.
Although these lessons have been suggested through the experiences of other now-developed economies, this article has synthesized them through a broad examination of the development experience in one of China’s leading industrial cities. With these five characteristics in GVC participation, China will likely avoid the middle-income trap which suggests a pathway for other emerging economies.
Despite these potentially applicable lessons for avoiding the middle-income trap, there remain risks to long-term economic development through participation in GVCs. First, it must be reiterated that GVC participation alone does not ensure sustained development. The cases of Mexico, Thailand, the Philippines, and Malaysia all attest to the limits of GVC participation as an end in itself. In these cases, participating in GVCs primarily as final assemblers of export products in foreign-invested enterprises, as in the maquiladora sector in Mexico, failed to result in sustained technology transfer and undermined the performance of local enterprises, helping fuel dependence on low value-added labor-arbitrage dependent manufacturing. China’s different experience, as suggested by Dongguan, suggests GVC participation remains viable, but at least two caveats are in order.
First, the recent rise in trade protectionism, and desire for redundancy in production chains especially in the United States and Europe, will reduce the number of available interstices in emerging economies. This is because concerns for resiliency often favor regionalization of production, bringing manufacturing stages geographically closer to sources of final demand. If lead firms primarily seek production within their home region, diffuse GVCs will cease to be the avenue for sustained economic growth they have been since the 1970s. This is not to suggest that firms should not seek resilience in their production chains. Indeed, a regionalization of United States’ and European production could benefit economies in Latin America and Africa, but it may reduce lead firms’ willingness to source from distant emerging economies. On the other hand, the risk from regionalization by lead firms based in Europe or the United States may be tempered by new demand for components and final assembly for Chinese brands. As costs continue to rise within China, Chinese domestic firms may become lead firms building their own value chains across east and southeast Asia in particular. The increasing importance of Belt and Road Initiative as well as RCEP member countries as trade partners suggest deep economic links are already forming which will facilitate continued growth for Chinese firms and neighboring countries.
A further risk arises from government policies in developed economies designed to encourage supply chain resiliency through reshoring, self-sufficiency or technology autarky. If sustained these policies may undermine the growth system outlined in this article as the Dongguan, and broader Chinese experience, was heavily reliant on sustained high levels of diverse foreign investment for decades before domestic suppliers and lead firms matured. Unlike the potential risk from greater regionalization, these policies threaten the very growth benefits of GVCs for countries regardless of their locations. Declining foreign investment into China is likely to slow economic growth and technology transfer, but the rise of domestic lead firms and demand, as well as new sources of demand outside Europe and the United States is likely to drive development onward.
This research has argued that the Chinese experience of development through participation in GVCs suggests that a combination of factors can enable GVC participation to result in sustained and higher value-added development. However, potential limitations must be acknowledged and considered as a basis for future study. As the research is based on the coastal city of Dongguan, the level of foreign investment was uniquely high, enabling a deeper embedding in GVCs than occurred in other regions. Further, the region’s geographic proximity and cultural homophily with Hong Kong likely encouraged earlier and more extensive investment than occurred elsewhere. Other Chinese cities lack the coastline or geographic proximity to major transhipment centers making the Dongguan experience not perfectly translatable. Nonetheless, given the extent of its reliance on foreign investment and demand, that Dongguan has overcome challenges from rising costs, falling investment and declining overseas demand suggests other regions with stronger domestic ties will be even better placed to continue to grow. Future research on China’s development experience should consider other regions connected to GVCs and their experiences with the transition to higher value-added and sustained development to develop a more complete picture of the GVC participation pathway to avoiding the middle-income trap.


 Open access