


Introduction
The COVID-19 pandemic emerged in China at the end of 2019. The disease burden of COVID-19 has been reduced by imposing non-pharmaceutical interventions (NPIs), and by vaccination after COVID-19 vaccines became available. Typically, NPIs have aimed at limiting the spread of infections (SARS-CoV-2) by reducing relevant social contacts or by reducing transmission per contact. COVID-19 vaccination started at the end of 2020 but due to limited supply, the vaccination coverage in Europe and North America increased slowly in the first half of 2021. Many countries started vaccine roll-out from various risk groups, for example, the elderly and those with underlying diseases, and healthcare professionals. In the second half of 2021, that is, during the era of the Delta variant (B.1.617.2), the vaccination coverage rose to at least moderate levels [Reference Mathieu1], which asks a natural question of the population level effectiveness of vaccination.
To fully evaluate the population level effectiveness of COVID-19 vaccination, different components of effectiveness must be assessed [Reference Wilder-Smith2]. Following the terminology of Halloran et al. [Reference Halloran3], direct effectiveness of vaccination is defined as the reduction of risk of a given infection endpoint in the vaccinated part of a partially vaccinated intervention population, compared to the unvaccinated part of the same population. To expand from direct effectiveness to total effectiveness of vaccination, the vaccinated part of the population is compared against a completely unvaccinated control population, comparable to the intervention population in all other aspects relevant to pathogen transmission and disease risk, such as the demographics and level of contacts. The total effectiveness describes the total reduction of risk for the vaccinated individuals. Indirect effectiveness compares the unvaccinated part of the intervention population against the control population, capturing the reduction of risk for the unvaccinated individuals in a partially vaccinated population. Overall effectiveness of vaccination compares the overall intervention population, including both vaccinated and unvaccinated individuals, against the control population. This measures the full benefits of vaccination on the population level. In addition, comparisons of the overall intervention population against the unvaccinated part of the intervention population have been reported [Reference Kayano4, Reference Baum5], to which we refer here by direct benefits.
In Finland, the COVID-19 vaccination was initiated in the beginning of 2021 using a 3-month interval between the first and second doses. Vaccination started from those over 80 years old and risk groups and progressed to the younger age groups following the imported vaccine deliveries. When the Delta variant started to spread in mid-June 2021, over 80% coverage of the first dose had been reached in those over 50 years old, as well as for the second dose in those over 80. Young adults had just started to receive their first doses [6]. At the time, Finland had one of the lowest cumulative incidences (< 2%) of COVID-19 cases (detected SARS-CoV-2 infections) among the European countries [Reference Mathieu1], confirmed by low levels of immunity from preceding SARS-CoV-2 infections in a population based serological study [Reference Solastie7]. Moreover, NPIs in the country were at an internationally low level during the Delta era [8], thus diminishing the influence of NPIs on the assessments of effectiveness of vaccination.
In this work, we estimate the different components of the population level effectiveness of vaccination on the COVID-19 disease burden, using the Finnish population during the Delta variant era as our intervention population. A mathematical infectious disease model, calibrated with register data on the COVID-19 epidemic in Finland, is used to simulate an unvaccinated control population, identical to the intervention population except for vaccination. In particular, we compare the magnitudes between the direct and indirect components of effectiveness. Simultaneously, we achieve estimates of the averted disease burden in Finland.
Methods
The study period was from mid-June through December 2021, which corresponds to the era of the Delta variant in Finland. The starting point is set to the week the Delta variant was the most common observed variant for the first time in the country, to Monday 14 June 2021 [9]. The end is set to Sunday 5 December 2021, just before the rapid spread of the Omicron variant (B.1.1.529) began.
Data description
To monitor the COVID-19 epidemic, the Finnish Institute for Health and Welfare (THL) has collected COVID-19 data from several national healthcare registers and made publicly available aggregated data with variable age, time, and areal stratifications [10–13]. The registers are individual based, enabling linkage between them. In this study, the COVID-19 data, retrieved from the register databases on 28 September 2022, were used both for determining the realized disease burden and for model parameter estimation. The aggregated weekly-level data by 10 years age groups and vaccination status are made available (decision by THL COVID-19 research executive committee, 10 May 2023) in the Supplementary Material.
Different COVID-19-related disease endpoints (registered COVID-19 cases, hospitalizations, intensive care admissions, and deaths) were retrieved from the national health registers and included in the analysis with the following definitions. Laboratory confirmed COVID-19 cases were retrieved from the National Infectious Diseases Register (NIDR) [14]. Hospitalizations from the Care Register for Health Care [15] were included if there existed a record of confirmed COVID-19 in the NIDR within a time window of −14/+7 days from the date of hospitalization, and a relevant primary or secondary ICD-10 diagnosis code (U07.1, U07.2, J00–22, J46, J80–84, J85.1, J86).
Laboratory-confirmed ICU COVID-19 admissions were retrieved from the Finnish Intensive Care Consortium’s Database [Reference Reinikainen16]. Multiple records for an individual within 30 days apart were considered as one episode. Deaths from the Population Information System [17] with a COVID-19 case registered within 30 days were included.
All disease endpoints were stratified by the vaccination status (0/1/2+ doses), based on the individuals’ recorded COVID-19 vaccination dates in the National Vaccination Register [6, 18]. To account for the time needed to obtain protection, the classification of vaccination status was delayed by 21 days for the first dose, and 7 days for the subsequent doses. The corresponding time- and age-specific coverages by dose were determined by combining the information from the National Vaccination Register and the Population Information System.
Model description
A mathematical model of SARS-CoV-2 transmission and development of COVID-19 disease was used to simulate an unvaccinated Control Population. First, the parameters of the model were estimated using the healthcare register data and the model with the realized vaccination programme. The model was then run from the start of 2020 with the estimated parameters but with vaccine efficacy parameters set to zero to produce a population that experienced the same epidemic and level of NPIs as the Finnish one, but without the vaccination programme. The model and the parameter estimation are briefly described next. A detailed description of the model is presented in the Supplementary Methods.
Model for transmission and development of disease
The transmission of SARS-CoV-2 infections within the population was modelled as a deterministic compartmental SEIR (Susceptible–Exposed–Infectious–Removed) model. The population was stratified into $ 9\times 3=27 $
subgroups by nine age groups and three vaccination statuses (0, 1, or 2+ received doses). The spread of infection within and between the age groups was modelled through a
$ 9\times 3=27 $
subgroups by nine age groups and three vaccination statuses (0, 1, or 2+ received doses). The spread of infection within and between the age groups was modelled through a $ 9\times 9 $
contact matrix (Finnish matrix from POLYMOD study [Reference Mossong19]), adjusted by age-specific factors
$ 9\times 9 $
contact matrix (Finnish matrix from POLYMOD study [Reference Mossong19]), adjusted by age-specific factors $ ({f}_a) $
acting equally on susceptibility and infectiousness. The next-generation matrix (NGM) for the 27 subgroups was formed by 3 × 3 blocks of contact matrices between individuals with different vaccination statuses. In each block, both the susceptibility to SARS-CoV-2 and the infectiousness, risk of onwards transmission conditional on being infected, were reduced according to the age- and dose-specific vaccine efficacy (Table 1). In addition to the within-population transmission, the model included an option for external incidence due to imported infections, which was used at the beginning of the epidemic in 2020 and at the arrival of the Delta variant when a peak in imported cases was observed [9]. The computational time step of the model was 1 day.
$ ({f}_a) $
acting equally on susceptibility and infectiousness. The next-generation matrix (NGM) for the 27 subgroups was formed by 3 × 3 blocks of contact matrices between individuals with different vaccination statuses. In each block, both the susceptibility to SARS-CoV-2 and the infectiousness, risk of onwards transmission conditional on being infected, were reduced according to the age- and dose-specific vaccine efficacy (Table 1). In addition to the within-population transmission, the model included an option for external incidence due to imported infections, which was used at the beginning of the epidemic in 2020 and at the arrival of the Delta variant when a peak in imported cases was observed [9]. The computational time step of the model was 1 day.
Model parameters in the sensitivity analysis scenarios
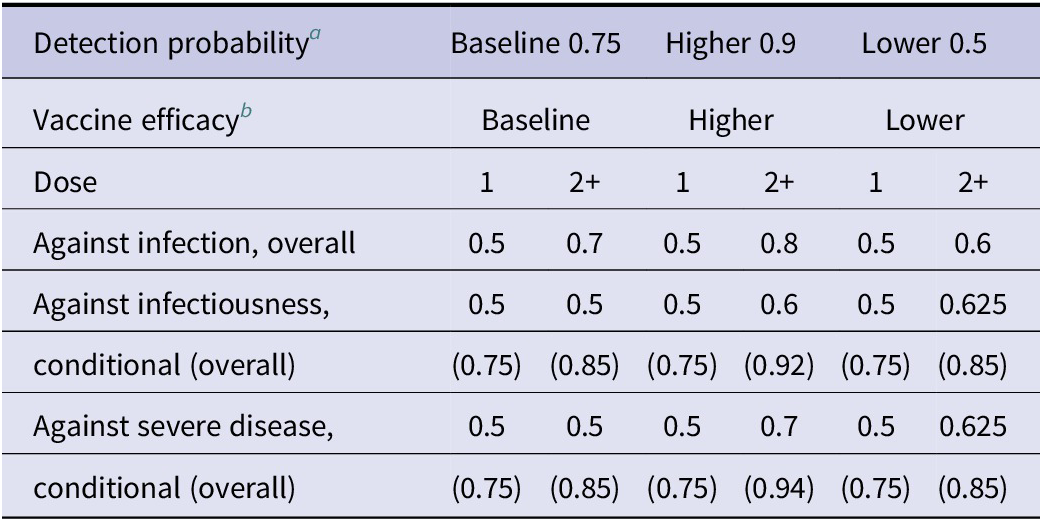
a Probability of COVID-19 case per SARS-CoV-2 infection.
b Vaccine efficacy parameters for ages 0–69. A reduction in efficacy against infection of 2+ doses was applied for ages 70–79 (25%), and 80+ (50%).
The model produced the incidence rates of disease endpoints (COVID-19 case, hospitalization, ICU admission, death) in each of the 27 subgroups by attaching endpoint-specific risks and delays to the SARS-CoV-2 incidence in the subgroup. The risks were assumed to depend on both age and vaccination status. Vaccine efficacy against the different disease endpoints was implemented with a hierarchical structure. For the vaccinated and infected individuals, the risk of severe disease endpoints (hospitalization, ICU admission, death) was reduced by the vaccine efficacy parameter against severe disease conditioned on infection.
Model parameters
The age-dependent risks for ICU admission per hospitalization and death per confirmed case were estimated using data from the beginning of 2021 to the end of the study period. Vaccine efficacy parameters (Table 1) were set so that the overall efficacy against severe disease was in agreement with the vaccine efficacy observed in COVID-19 vaccine studies [Reference Baum5, Reference Lopez Bernal20–Reference Hall23]. All vaccine efficacy parameters were taken to depend on age and the number of vaccine doses and vaccine efficacy was set to wane with time since vaccination to approximately 75% of initial efficacy after three months and 65% six months after vaccination [Reference Baum22, Reference Poukka24]. Sensitivity analyses with higher and lower vaccine efficacy against infection were performed (Table 1). In the higher vaccine efficacy scenario the efficacy against both infectiousness and severe disease were increased. A sensitivity analysis with 0% efficacy against infectiousness was also performed. The probability for an infection to become detected under intensive COVID-19 testing was set as 75% in the baseline scenario. The cumulative PCR-confirmed incidence and SARS-CoV-2 nucleoprotein seroprevalence (corresponding to immunity from infection but not vaccination) were not markedly different up until the end of the study period [Reference Solastie7], suggesting a relatively high detection probability. To consider the uncertainty related to the parameter a sensitivity analysis was performed using higher (90%) and lower (50%) detection probabilities.
Given the earlier listed parameters, for each sensitivity analysis scenario, the posterior distribution of the following parameters was estimated from the number of cases and hospitalizations: the age-specific adjustment factors $ {f}_a $
, age-specific risk of hospitalization per infection, time-dependent reproduction number
$ {f}_a $
, age-specific risk of hospitalization per infection, time-dependent reproduction number $ R(t) $
, and model hyper-parameters of the negative binomial likelihood. The number of cases and hospitalizations were assumed to be Poisson distributed and the Poisson rates were assumed to be Gamma distributed around the model incidence rates. Thus, the likelihood consisted of the corresponding negative binomial distributions at each time point, for each age, and vaccination status.
$ R(t) $
, and model hyper-parameters of the negative binomial likelihood. The number of cases and hospitalizations were assumed to be Poisson distributed and the Poisson rates were assumed to be Gamma distributed around the model incidence rates. Thus, the likelihood consisted of the corresponding negative binomial distributions at each time point, for each age, and vaccination status. $ R(t) $
is the expected number of people one infectious individual infects over their entire infectious period, assuming everyone they contact are susceptible. The effective reproduction number
$ R(t) $
is the expected number of people one infectious individual infects over their entire infectious period, assuming everyone they contact are susceptible. The effective reproduction number $ {R}_{eff}(t) $
is
$ {R}_{eff}(t) $
is $ R(t) $
scaled by the probability that a contact is susceptible, that is, the actual expected number of secondary cases in the population in question. As such,
$ R(t) $
scaled by the probability that a contact is susceptible, that is, the actual expected number of secondary cases in the population in question. As such, $ R(t) $
describes the combined effect of the variant properties and the overall level of contacts on transmission. In other words, both changes in behaviour and variant result in a change over time in the estimated
$ R(t) $
describes the combined effect of the variant properties and the overall level of contacts on transmission. In other words, both changes in behaviour and variant result in a change over time in the estimated $ R(t) $
, whereas an increase in levels of immunity in the population, either from infection or vaccine induced, results in divergence of
$ R(t) $
, whereas an increase in levels of immunity in the population, either from infection or vaccine induced, results in divergence of $ {R}_{eff}(t) $
from
$ {R}_{eff}(t) $
from $ R(t) $
. In practice,
$ R(t) $
. In practice, $ R(t) $
was represented as a piece-wise constant function changing logistically between dates set to observed inflection points in case numbers.
$ R(t) $
was represented as a piece-wise constant function changing logistically between dates set to observed inflection points in case numbers.
The Bayesian estimation of the posterior distribution of the model parameters was performed using the weekly data on confirmed cases from an extended estimation period (1 July 2020–20 December 2021) and hospitalizations (15 April 2020–20 December 2021), both stratified by age and vaccination status. Using an uninformative prior distribution of the model parameters, the posterior distribution was sampled with an adaptive Metropolis algorithm [Reference Haario, Saksman and Tamminen25]. See Supplementary Methods for the full list of parameters.
Vaccine effectiveness components
We defined the populations needed to assess the different effectiveness components as follows. The Overall Population was the Finnish population containing both vaccinated and unvaccinated individuals, that is, the intervention population. The Vaccinated Population was defined as those in the intervention population who had received at least one dose, and the Unvaccinated Population was defined as those with no doses received. The Control Population was the intervention population in a counterfactual scenario of no vaccination, simulated with the model and the estimated parameters.
The age structure in the Vaccinated and Unvaccinated Populations changed over the study period, as the vaccination coverage increased in all targeted ages, but at different rates. In these populations, the incidence rates (events per week per 100000 persons) were age standardized with the intervention population, that is, the entire Finnish population as the reference. Only the age-standardized rates are comparable to those in the Overall and Control Populations. The age-standardized incidence rate for the disease endpoint $ d $
in the population of those with vaccination status
$ d $
in the population of those with vaccination status $ v $
$ v $ $ (v=0,1+ $
) at time
$ (v=0,1+ $
) at time $ t $
was determined by formula:
$ t $
was determined by formula:
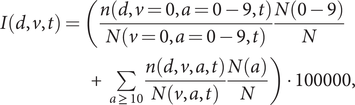 $$ {\displaystyle \begin{array}{l}I(d,v,t)=(\frac{n(d,v=0,a=0-9,t)}{N(v=0,a=0-9,t)}\frac{N(0-9)}{N}\\ {}+\hskip2px \sum \limits_{a\ge 10}\frac{n(d,v,a,t)}{N(v,a,t)}\frac{N(a)}{N})\cdot 100000,\end{array}} $$
where $ n\left(v,d,a,t\right) $
is the number of events
$ n\left(v,d,a,t\right) $
is the number of events $ d $
among individuals in age group
$ d $
among individuals in age group $ a $
with vaccination status
$ a $
with vaccination status $ v $
at time
$ v $
at time $ t $
,
$ t $
, $ N\left(v,a,t\right) $
the size of the corresponding population, and
$ N\left(v,a,t\right) $
the size of the corresponding population, and $ N(a)/N $
the fraction of age group
$ N(a)/N $
the fraction of age group $ a $
in the intervention population. The age group 0–9 years, not targeted by vaccination, were also included in the Vaccinated Population
$ a $
in the intervention population. The age group 0–9 years, not targeted by vaccination, were also included in the Vaccinated Population $ (v=1+ $
) when defining the age-standardized incidence rates, thus making the corresponding effectiveness estimates conservative.
$ (v=1+ $
) when defining the age-standardized incidence rates, thus making the corresponding effectiveness estimates conservative.
The vaccine effectiveness components compared the corresponding populations as presented in the Introduction. The vaccine effectiveness was defined as the relative reduction of the cumulative incidence over the study period (14 June–5 December 2021), based on the age-standardized weekly incidence rates.
Results
Data
Figure 1 presents the weekly numbers of COVID-19 cases, hospitalizations, ICU admissions, and deaths by vaccination status in the overall, that is, the Finnish population with vaccinated and unvaccinated individuals during the study period. The study period included two phases of increasing incidence for all endpoints. Following the high levels of vaccination coverage in most age groups (Figure 2a), the numbers of all four disease endpoints increased also among vaccinated individuals. The distribution of disease endpoints varied between ages, see Supplementary Figures S5–S8 for age- and dose-specific numbers. Younger ages had the highest numbers of COVID-19 cases, whereas severe disease endpoints occurred mostly in the older ages.
Weekly data from Finland (population approximately 5.6 million) during the Delta variant era. Darker coloured bars indicate the vaccinated (1+ doses) share of the total observations. (a) COVID-19 cases, (b) hospitalizations, (c) ICU admissions, (d) deaths. The figures include the posterior prediction means and 90% credible intervals of the calibrated model for the total number of events per week in the baseline scenario.

(a) The coverage of the first (solid line) and second (dashed line) COVID-19 vaccine doses by 10-year age groups in Finland in year 2021. (b) Estimated reproduction number $ R(t) $
(grey) in Finland in year 2021, and the corresponding effective reproduction numbers
$ R(t) $
(grey) in Finland in year 2021, and the corresponding effective reproduction numbers $ {R}_{eff}(t) $
in the partially vaccinated Overall Population (yellow) and completely unvaccinated Control Population (green). The two curves for
$ {R}_{eff}(t) $
in the partially vaccinated Overall Population (yellow) and completely unvaccinated Control Population (green). The two curves for $ {R}_{eff}(t) $
were calculated with the calibrated model using the estimated
$ {R}_{eff}(t) $
were calculated with the calibrated model using the estimated $ R(t) $
under differing assumptions on vaccination. The vertical line marks the beginning of the study period, that is, of the Delta variant era in Finland.
$ R(t) $
under differing assumptions on vaccination. The vertical line marks the beginning of the study period, that is, of the Delta variant era in Finland.

The calibrated model
Figure 1 shows the aggregated posterior predictions of the total number of events per week for all four endpoints in the Overall Population, corresponding to the model calibration on the age and vaccination status level. The posterior predictive distributions of the model corresponding to the Overall Population include both the posterior uncertainty of the parameter estimation, and the uncertainty from a model of the measurement process (Supplementary Methods, Section S3). The posterior predictions of the incidence rates in the 27 subgroups (nine groups by age, three by vaccination) are presented in Supplementary Figures S5–S8. All estimated parameter values are given in the Supplementary Methods. The model agreed well with the observed data in all scenarios (Supplementary Figures S1–S24), except for an underestimation of the total number of deaths to some extent towards the end of the study period. In the age-specific and vaccination status-specific predictions, the underestimation of deaths was less pronounced, stemming mostly from those over 80 years of age. The sensitivity analysis with a higher vaccine efficacy produced a slightly better agreement with the observations than the two other efficacy scenarios for hospitalizations in the adult age groups with two or more vaccine doses.
Estimated $ R(t) $

In the Overall Population, the model was calibrated to the observed data assuming the realized vaccination. The estimated time-dependent reproduction number $ R(t) $
(Figure 2b, grey line) increased from below one at the start of the study period to almost two in the beginning of July 2021. The increase occurred simultaneously to the Delta variant displacing the previous, less transmissible variants in circulation. During the autumn, the reproduction number estimates increased to around three by December, reflecting the gradually increasing frequency of contacts in Finland. The corresponding effective reproduction number
$ R(t) $
(Figure 2b, grey line) increased from below one at the start of the study period to almost two in the beginning of July 2021. The increase occurred simultaneously to the Delta variant displacing the previous, less transmissible variants in circulation. During the autumn, the reproduction number estimates increased to around three by December, reflecting the gradually increasing frequency of contacts in Finland. The corresponding effective reproduction number $ {R}_{eff}(t) $
(Figure 2b, yellow line), remained initially close to
$ {R}_{eff}(t) $
(Figure 2b, yellow line), remained initially close to $ R(t) $
, reflecting the low level of immunity in the population. In early July,
$ R(t) $
, reflecting the low level of immunity in the population. In early July, $ {R}_{eff}(t) $
started to decline after peaking at around 1.4, as the progressing vaccination programme led to an increased proportion of protected individuals in the population. By early August,
$ {R}_{eff}(t) $
started to decline after peaking at around 1.4, as the progressing vaccination programme led to an increased proportion of protected individuals in the population. By early August, $ {R}_{eff}(t) $
had declined to below one. Thereafter it remained close to one, even as
$ {R}_{eff}(t) $
had declined to below one. Thereafter it remained close to one, even as $ R(t) $
increased considerably, because the pool of susceptibles was steadily decreasing by vaccination.
$ R(t) $
increased considerably, because the pool of susceptibles was steadily decreasing by vaccination.
In the Control Population, that is, when running the calibrated model with the vaccine efficacy parameters set to zero, the $ {R}_{eff}(t) $
(Figure 2b, green line) had a markedly different trajectory. Increasing almost as much as the reproduction number
$ {R}_{eff}(t) $
(Figure 2b, green line) had a markedly different trajectory. Increasing almost as much as the reproduction number $ R(t) $
after the arrival of the Delta variant,
$ R(t) $
after the arrival of the Delta variant, $ {R}_{eff}(t) $
in the Control Population did not decline to below one until the beginning of October. In this case, the estimated decline was solely due to immunity from infections as there was no vaccination.
$ {R}_{eff}(t) $
in the Control Population did not decline to below one until the beginning of October. In this case, the estimated decline was solely due to immunity from infections as there was no vaccination.
COVID-19 incidence rates in the different populations
Figure 3 presents the age-standardized COVID-19 incidence rates for all four endpoints in the Overall, Vaccinated, Unvaccinated, and Control Populations, and Table 2 the cumulative incidences. For example, the cumulative incidence for hospitalizations was 39/100000 in the Overall Population, 16 in the Vaccinated Population (relative risk [RR] 0.4 vs. the Overall Population), 200 in the Unvaccinated Population (RR 5.1), and almost 4000 in the Control Population (RR 98.1). For ICU admissions and deaths, the cumulative incidences in the Overall Population were 7.9 and 8.3, compared to 860 (RR 108.9) and 1208 (RR 145.5) in the Control Population. In a population of 5.6 million the Control Population incidence rate for cases would correspond to 300000 new weekly cases before the epidemic starts to decline.
Realized age-standardized weekly incidence rates in the Overall (yellow), Vaccinated (beige), and Unvaccinated (blue) Populations and model-predicted weekly incidence rates with 90% credible intervals in the Control Population (green) for COVID-19 cases (a), hospitalizations (b), ICU admissions (c), and deaths (d). Solid lines are on the scale of the left y-axes, while the green dashed lines are on the scale of the right y-axes to illustrate the shape of the epidemic in the Control Population.

Cumulative incidences per 100000 over the study period in the different populations for all endpoints. The Vaccinated and Unvaccinated Population numbers were obtained from the age-standardized incidence rates. The rates for the Control Population are from the model in the baseline and sensitivity analysis scenarios, and include the 90% credible intervals of the posterior predictive distribution. The relative risks (RR, mean) are against the Overall Population
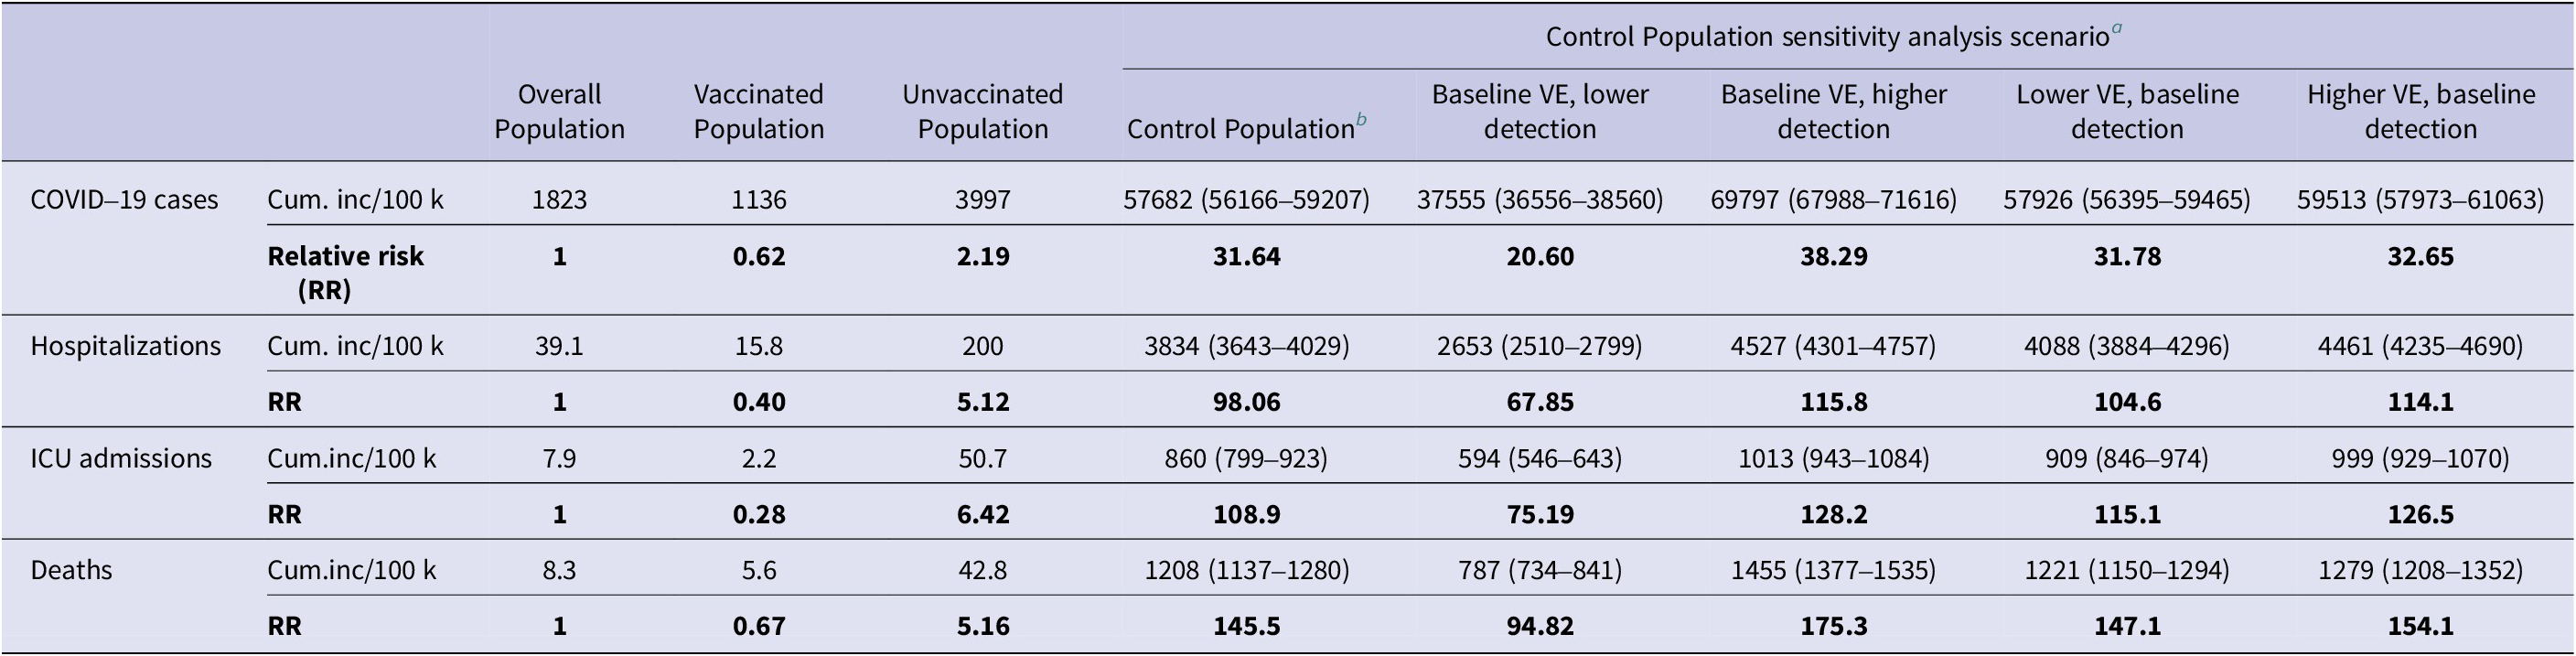
a Sensitivity analysis scenarios: Lower detection probability 0.5, higher detection 0.9. Lower VE: 0.6 against infection, 0.85 against infectiousness, 0.85 against severe disease. Higher VE: 0.8 against infection, 0.94 against infectiousness, 0.92 against severe disease.
b Baseline scenario: 0.75 detection probability, vaccine efficacy of 2+ doses (VE) 0.7 against infection, 0.85 against infectiousness, 0.85 against severe disease.
In all sensitivity analyses, the epidemic formed similar large waves in the Control Population, and the cumulative incidence was at least tens of times higher compared to the Overall Population. The cumulative incidence increased with the assumed detection rate of infections. For hospitalization, RR was 68/98/116 in the low/baseline/high detection rate scenario, respectively. In the sensitivity analyses for vaccine efficacy, the changes in RR were smaller, from RR 105 for hospitalization in the lower vaccine efficacy scenario to 114 in the higher efficacy scenario.
Vaccine effectiveness components
The estimates for the different components of effectiveness of vaccination, based on the cumulative incidences, are given in Table 3. The direct effectiveness (Vaccinated vs. Unvaccinated Population) improved with severity of endpoint (72% against COVID-19 cases, 92% against hospitalization, 96% against ICU admission), except for death (87%), and the direct benefits (Overall vs. Unvaccinated Population) ranged from 54% against cases to 84% against ICU. The direct effectiveness values correspond to the observed vaccine efficacy in the entire Finnish population during the Delta era. The indirect effectiveness of vaccination (Unvaccinated Population vs. Control Population) was 93% against COVID-19 cases and 94–97% against severe endpoints. Together, the direct and indirect components combine to as high as 98% total effectiveness (Vaccinated Population vs. Control Population) against cases and more than 99.5% against severe endpoints. Also, the estimated overall effectiveness (Overall Population vs. Control Population) was exceedingly high, from 97% against cases to over 99% against all other endpoints. The sensitivity analyses or changing the efficacy against infectiousness to 0% (Supplementary Table S1) did not substantially change the results.
The vaccine effectiveness components, that is, the relative reduction of the cumulative incidences over the study period in the different populations. The components calculated from the Control Population incidences include the 90% credible intervals of the posterior predictive distribution from the model
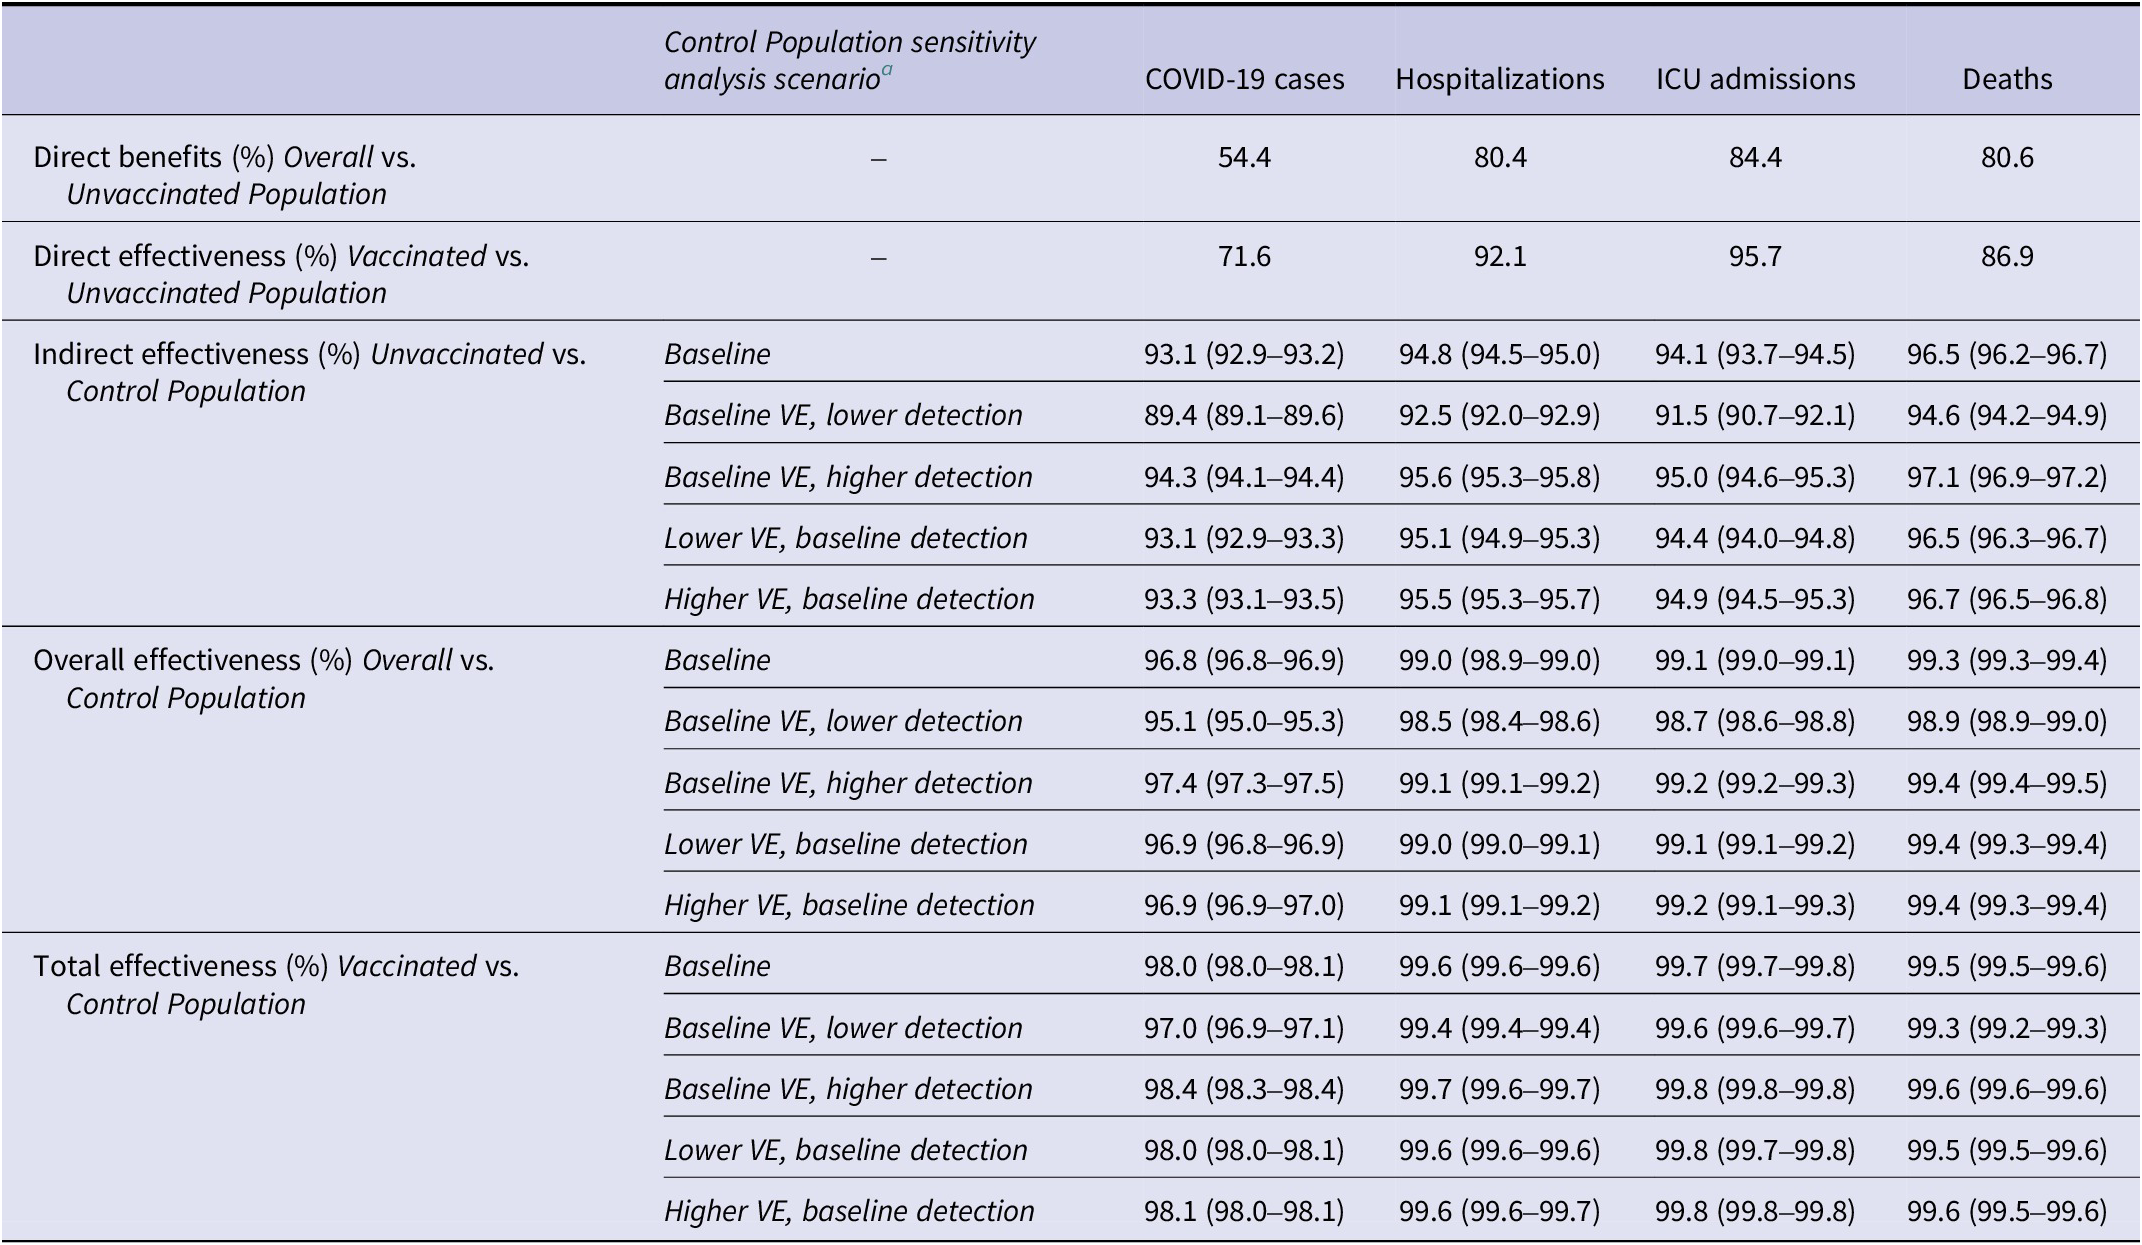
a Baseline scenario: 0.75 detection probability, vaccine efficacy of 2+ doses (VE) 0.7 against infection, 0.85 against infectiousness, 0.85 against severe disease. Sensitivity analysis scenarios: Lower detection probability 0.5, higher detection 0.9. Lower VE: 0.6 against infection, 0.85 against infectiousness, 0.85 against severe disease. Higher VE: 0.8 against infection, 0.94 against infectiousness, 0.92 against severe disease.
Averted disease burden in Finland
In Finland, with 5.6 million inhabitants, the realized disease burden was 102286 COVID-19 cases, 2194 hospitalizations, 442 ICU admissions, and 467 deaths registered during the study period. The estimated 97–99% overall effectiveness in the baseline Control Population scenario corresponds to 3.1 million COVID-19 cases, 209000 hospitalizations, 47000 ICU admissions, and 66000 deaths averted during the study period (Supplementary Table S2). These numbers include the burden averted both directly and indirectly, illustrated in Figure 4. For example, of all averted hospitalizations 96% were due to indirect effectiveness, and 4% due to direct benefits. The averted disease burden estimates do not include the potential additional detrimental effects of reaching the limits of healthcare capacity, as the risks of the different infection endpoints were estimated with data from a period without serious capacity issues.
The different components of vaccine effectiveness illustrated with the cumulative age-standardized incidence of hospitalizations during the study period, on two different scales (a and b) for the Overall (yellow), Vaccinated (beige), Unvaccinated (blue), and Control (green, with 90% credible intervals of model prediction) Populations. Arrows correspond to (a) Total effectiveness, (b) Overall effectiveness, (c) Indirect effectiveness, (d) Direct effectiveness, (e) Direct benefits. Total effectiveness (a) comprises of indirect effectiveness (c) and direct effectiveness (d). Overall effectiveness (b) comprises of indirect effectiveness (c) and direct benefits (e).

Discussion
Our analysis based on the Finnish register data and infectious disease modelling shows the crucial role of indirect protection in the overall effectiveness of COVID-19 vaccination during the Delta era. The direct effectiveness of vaccination experienced by the vaccinated part of the intervention population was 72% against COVID-19 cases and 87–96% against severe disease, in line with previous estimates of vaccine efficacy in different parts of the Finnish population [Reference Baum5, Reference Baum22]. In the vaccinated part of the population, the direct and indirect components of vaccine effectiveness combine to the total effectiveness of 98% against COVID-19 cases and over 99.5% for all severe disease endpoints. Note that an increase in the effectiveness from 0% to 90%, or from 90% to 99%, both reduce the incidence of an endpoint to one tenth from the original level. The indirect effectiveness alone, protecting also the unvaccinated part of the population, was as high as 93% against COVID-19 cases and 94–97% against severe disease. Consequently, in the intervention population, including both vaccinated and unvaccinated individuals, the overall effectiveness was 97% against COVID-19 cases and over 99% against severe disease.
Without vaccination under the low level of NPIs, the Delta variant would have reached roughly four fifths of the population in only a few months. Such high COVID-19 waves as in the simulated Control Population were not observed in any country during the Delta variant era. This kind of counterfactual model analysis is, however, the only way to evaluate the indirect effects in this context. Vaccination was ongoing in many countries, and countries with low vaccination coverage typically had extensive NPIs in place [Reference Mathieu1, 8]. Also, without vaccination the huge wave would likely have been lowered in Finland, as an increase in the incidence of infection and disease would have led to increasing the level of NPIs in use. However, during the subsequent Omicron variant era, when the vaccine protection against infection had weakened, the number of cases increased worldwide, even if NPIs were still in place. In Finland, even if intensive testing was not anymore recommended at the time, 60000 weekly cases were registered mid-January 2022, and a level of weekly 50000 cases persisted up to mid-March 2022. Under intensive testing, these numbers would likely not have differed much from the peak of 300000 weekly cases in the simulated Control Population. During the Omicron era, however, the observed disease burden was much lower by the persisting strong vaccine protection against severe disease [Reference Andrews26–Reference Lau28] and the lower severity of Omicron [Reference Lewnard29].
The estimated relative risk in the Control Population versus Overall Population increased with disease severity, which can be explained as follows. Older age groups had both higher coverage of vaccination and higher risk for severe disease compared to the younger age groups. Thus, removing vaccination resulted in stronger relative increase of infections in older age groups, and consequently, of severe disease overall. This effect is amplified by the large size of older age groups in the Overall Population.
The direct benefits and direct effectiveness of COVID-19 vaccination, and corresponding averted disease burden, have been studied in many countries under different levels of NPIs and variants [Reference Kayano4, Reference Meslé30–Reference Nordström, Ballin and Nordström35]. A study from Sweden using the same methodology as us to analyse also the indirect effects during the roughly the same time period had notably similar results [Reference Bergström, Gunther and Britton36]. In Japan, total effectiveness of vaccination during the Delta era was estimated to 92.6% for infections and 97.2% for deaths, with indirect effectiveness accounting for 89.0% and 92.1% of reduction in disease burden [Reference Kayano37]. Indirect effects of vaccination have also been estimated applying other methods [Reference Watson38–Reference Panovska-Griffiths40]. The estimates of the different components of vaccine effectiveness are in general not comparable from country to country as, for example, age structure, vaccine roll-out, and NPI levels vary. Even so, in all studies the key observations are consistent – direct effects of COVID-19 vaccination have been good, the corresponding averted disease burden was large, and indirect effects were substantial against the Delta variant, leading to an even larger averted disease burden. These analyses also reveal the immense potential of the Delta variant to spread and cause disease burden, which was hidden by vaccination in many countries, consistent with the estimates of transmissibility compared to preceding variants [Reference Panovska-Griffiths40].
A strength of this study was the use of comprehensive age- and vaccination status-specific health register data from the entire Finnish population. Even so, uncertainty remains whether the severe disease extracted from the registers with the chosen definitions were due to or with COVID-19. However, during the Delta era COVID-19 cases were still relatively rare in Finland, so that the fraction of with COVID-19 was low compared to the subsequent Omicron era, as observed later [41]. The inherently unknown proportion of detected infections was a limitation. In addition, our choice of vaccine efficacy parameter values is based on several studies, but especially efficacy against infectiousness after infection is highly uncertain. To account for these unknowns, we ran sensitivity analyses varying the detection probability and the parameters for vaccine efficacy. Indeed, the higher vaccine efficacy scenario corresponded better to the observations for adult hospitalizations than the baseline scenario, indicating that the baseline efficacy parameters were perhaps too conservative. Still, all scenarios produced notably similar results.
The choice of the model structure is a potential source of bias. For example, the model overshot COVID-19 cases in fully vaccinated young adults and underestimated deaths in the 80+ age group in the last weeks of the study period, compared to observations in the calibration phase. The overestimation of cases may stem from using the same detection probability for all ages. To compensate, we estimated an age-specific adjustment factor for the contact matrix, adjusting for age-specific susceptibility, infectiousness, and infection detection, as well as the contacts themselves. The discrepancy between the model and the observations was in fact expected, as test seeking behaviour after vaccination likely fell during the study period. The bias did not play a role in the simulation of the Control Population, as everyone was unvaccinated. The underestimation of age-dependent risks for death per confirmed case was likely caused by being estimated with data from a period when the most vulnerable groups were especially well isolated. This might have led to an underestimation of averted deaths in Finland. As it is never possible to identify all influencing factors from the available data, the choice of model structure must strike a balance between rigidity and over-fitting to data.
The realized disease burden in Finland during the Delta era, with an estimated SARS-CoV-2 seroprevalence of only 6% (2–22%) at the end of 2021 [Reference Solastie7], was remarkably low compared to the potential burden illustrated in the simulated Control Population, reflecting close to optimal timing of vaccination. In addition to disease burden, the need for additional NPIs was averted by vaccination. When the Delta variant started to spread, younger age groups with high transmission potential were rapidly being vaccinated with their first dose, already providing good protection against infection. By then the oldest age groups had also obtained a good second dose coverage. Finally, the rapid displacement of Delta by Omicron happened in Finland before any possible waning of vaccine efficacy against Delta infections was observed.
In conclusion, the indirect effectiveness was an essential factor in the excellent overall and total effectiveness against the Delta variant of SARS-CoV-2, providing extraordinary protection also to the unvaccinated. The population level impact of vaccination shown here is substantially larger than in analyses of direct efficacy and effectiveness alone. When strong indirect effects exist, looking only at the data about the realized disease burden does not reveal the whole story. Quantifying the full impact of vaccination requires also analysing the mechanisms that result in the observed disease burden.
Supplementary material
The supplementary material for this article can be found at http://doi.org/10.1017/S0950268825000354.
Data availability statement
The data are available in the Supplementary Material. Model codes are available upon reasonable request from the corresponding author.
Acknowledgements
The authors want to acknowledge the THL data management team, especially Toni Lehtonen and Oskari Luomala.
Author contribution
Conceptualization: S.V., M.S., T.L., K.A., A.S.; Formal analysis: S.V., A.S.; Methodology: S.V., M.S., K.A., A.S.; Software: S.V., M.S., A.S.; Supervision: S.V., T.L.; Visualization: S.V., M.S., A.S.; Writing – original draft: S.V., A.S.; Writing – review & editing: S.V., M.S., T.L., K.A., A.S.; Investigation: T.L.
Funding statement
The Finnish Institute for Health and Welfare has received research funding from several pharmaceutical vaccine manufacturing companies until March 2022.
Competing interests
The authors declare no competing interests exist.


 Open access