





Introduction
Chrysoperla carnea (Stephens) (Neuroptera: Chrysopidae), the commonly known as green lacewing, is an important biological control agent (Ismoilov et al., Reference Ismoilov, Wang, Jalilov, Zhang, Lu, Saidov, Sun and Han2020; Mahzoum et al., Reference Mahzoum, Villa, Benhadi-Marín and Pereira2020; Eldessouky and Korish, Reference Eldessouky and Korish2023). Green lacewings (Chrysopidae) are cosmopolitan predators, among which C. carnea is one of the most widely distributed species and used for managing insect pests in field crops and orchards (Farrokhi et al., Reference Farrokhi, Gharekhani, Iranipour and Hassanpour2017; Taylor, Reference Taylor2020; Youssef et al., Reference Youssef, Ibrahim, Bazazo, Khattab, Ueno and Mousa2020; Sattar and Zahra, Reference Sattar and Zahra2022). Adults feed on pollen, nectar, and honeydew (Villa et al., Reference Villa, Santos, Benhadi-Marín, Mexia, Bento and Pereira2016), and its three larval stages voraciously feed on soft-bodied insect pests, including Pyrilla perpusilla (Walker) (Umer et al., Reference Umer, Khan, Fan, Yang, Li, Iqbal and Wei2023), Nasonovia ribisnigri (Mosley), Frankliniella occidentalis (Pergande) (Shrestha and Enkegaard, Reference Shrestha and Enkegaard2013), Phenacoccus solenopsis (Tinsley), and Sitrotroga cerealella (Oliver) (Shaukat, Reference Shaukat2018). The characteristics of C. carnea, such as a high predation rate (Pathan et al., Reference Pathan, Sayyed, Aslam, Liu, Razzaq and Ahmed Gillani2010), short development duration along with high adaptability to environments (Suarez-Lopez et al., Reference Suarez-Lopez, Hatem, Aldebis and Vargas-Osuna2023), and minimum handling time (Khalil et al., Reference Khalil, Shaheen, Abdel-Hady and Saleh2020; Suarez-Lopez et al., Reference Suarez-Lopez, Hatem, Aldebis and Vargas-Osuna2023), make it one of the most important predators. It also has a high potential to develop resistance to different insecticides (Sayyed et al., Reference Sayyed, Pathan and Faheem2010; Mansoor and Shad, Reference Mansoor and Shad2019a).
Insecticide resistance in pests is one of the major issues in insect pest management, and it also affects non-target species (Ambethgar, Reference Ambethgar2009; Cloyd, Reference Cloyd2012; Bras et al., Reference Bras, Roy, Heckel, Anderson and Karlsson Green2022). Compared to other predators, green lacewings are more frequently compatible with various Integrated Pest Management (IPM) systems because they have evolved resistance to many insecticidal groups, including pyrethroids, organophosphates, carbamates, neonicotinoids, spinosyns, diamides, and pyroles (Pathan et al., Reference Pathan, Sayyed, Aslam, Liu, Razzaq and Ahmed Gillani2010; Sayyed et al., Reference Sayyed, Pathan and Faheem2010; Abbas et al., Reference Abbas, Mansoor, Shad, Pathan, Waheed, Ejaz, Razaq and Zulfiqar2014; Mansoor and Shad, Reference Mansoor and Shad2022; Hassan and Shad, Reference Hassan and Shad2024; Abubakar and Shad, Reference Abubakar and Shad2025). This predator can develop resistance to various insecticides either through direct contact or by consuming other insects that have been exposed to the insecticide (Morsy, Reference Morsy2017). Bifenthrin, a pyrethroid, is a broad-spectrum insecticide (Balakrishnan et al., Reference Balakrishnan, Kumar and Sivasubramanian2009) that has a contact mode of action (Coleman et al., Reference Coleman, Smith, Jones, Graves and Strom2016). It acts as an opener of the sodium channel, causing hyperactivity of the depolarising pulse (IRAC, 2025). It has been used effectively in IPM programmes with no or minimal deleterious effects towards biological control agents such as Coccinella septempunctata (Linnaeus) (Hussain et al., Reference Hussain, Mustafa, Malik, Zulifqar and Abbas2017), Trichogramma chilonis (Westwood) (Salim et al., Reference Salim, Arif, Ayaz, Saljoqi, Gökçe, Khan, Sattar, Ahmad and Khan2025), and Solenopsis saevissima (Smith) (Do Carmo et al., Reference Do Carmo, Costa, Santana Junior, Santana, Marsaro Junior, Pereira, Santos and Picanço2023).
Fitness is the potential of an individual’s genotype to survive, reproduce, and transfer its specific traits to the next generation (Gassmann et al., Reference Gassmann, Carrière and Tabashnik2009). Fitness cost is a trade-off in which resistance to an insecticide is associated with higher energetic costs compared to that of a susceptible strain (Kliot and Ghanim, Reference Kliot and Ghanim2012). Insecticide resistance can affect the fitness of an insect population that results in significant changes in the biological parameters of resistant populations (Abbas et al., Reference Abbas, Shah, Shad, Iqbal and Razaq2016). Previously, fitness cost of insecticide resistance has been reported in several beneficial and harmful insects, including imidacloprid resistance in the ladybird beetle Propylaea japonica (Thunberg) (Tang et al., Reference Tang, Qiu, Cuthbertson and Ren2015) and Paederus fuscipes (Curtis) (Feng et al., Reference Feng, Bong, Dai and Neoh2019), alpha-cypermethrin resistance in Musca domestica L. (Hafez and Abbas, Reference Hafez and Abbas2023), and clothianidin resistance in Nilaparvata lugens (Stål) (Jin et al., Reference Jin, Mao, Xu, Wang, Liao, Wan and Li2021). Previously, resistance in C. carnea to several insecticides used in IPM programmes, like chlorantraniliprole, chlorfenapyr, and deltamethrin, has been reported in Pakistan (Sayyed et al., Reference Sayyed, Pathan and Faheem2010; Abubakar and Shad, Reference Abubakar and Shad2024, Reference Abubakar and Shad2025; Khan et al., Reference Khan, Shad, Atta, Zaman and Abubakar2025). This study was conducted to evaluate the biological parameters of a bifenthrin-resistant C. carnea strain to ensure its compatibility and selective use in IPM programmes.
Understanding the impact, degree of resistance, and stability of insecticide resistance is a crucial requirement for combining the biological and chemical control strategies of an effective IPM programme. Practical applications of resistance development and stability research can enhance effective resistance management strategies (Abbas and Hafez, Reference Abbas and Hafez2023). Numerous biological control agents that have developed a high level of resistance after selection under laboratory conditions have been observed to exhibit stable resistance (Mansoor and Shad, Reference Mansoor and Shad2020; Hassan and Shad, Reference Hassan and Shad2024; Nell et al., Reference Nell, Kishinevsky, Bosch, Sinclair, Bhat, Ernst, Boulaleh, Oliver and Ives2024). Major factors that influence the stability of pesticide resistance include changes in relative fitness, allele dominance relationships, and starting gene frequencies in strains established with or without selection pressure (Roush and McKenzie, Reference Roush and McKenzie1987). There have been numerous studies on the stability of resistance to various pesticides (Rodrigues et al., Reference Rodrigues, Guedes, Siqueira and Torres2020; Balanza et al., Reference Balanza, Mendoza, Cifuentes and Bielza2021; Hassan and Shad, Reference Hassan and Shad2024).
In many agricultural systems, where chemical control is the predominant tool for pest management, the use of insecticide-resistant natural enemies can reduce secondary pest outbreaks and pest resurgence. Knowing the life history characteristics associated with insecticide resistance can be useful in a resistance management programme. This study was carried out to ascertain the fitness cost of bifenthrin-selected (Bifen-Sel), unselected (Unsel), and their reciprocal cross populations under laboratory conditions. Moreover, the stability of bifenthrin resistance was also examined.
Materials and methods
Rearing of C. carnea
A population of C. carnea was collected from fields of sorghum located in Bahauddin Zakariya University (BZU), Multan, and brought to the Insecticide Resistance laboratory in BZU, Multan, Pakistan. The collected adults of C. carnea were placed in transparent Plexiglas rearing cages (38 × 23 × 38 cm) having ventilation holes on the lateral sides. Adults were provided with an artificial diet (10 g sugar, 10 g Cerelac, and 10 mL honey in 150 mL water). The Cerelac used in this study is a commercially available wheat-based infant cereal having the following components: wheat flour, milk solids, vegetable oil, soy lecithin, probiotic cultures, and a fortified vitamin–mineral premix. A cotton wick moistened in water was placed in cages for water requirements. A black glossy paper sheet was placed on the upper side of the cage for egg laying. Eggs were removed daily with the help of forceps and placed in gelatin capsules (capacity = 500 mg) (1 egg/capsule) with the help of a camel hairbrush. After the eggs hatched, larvae were given frozen Sitotroga cerealella (Oliver) eggs as food till pupation. After pupation, pupae were removed from capsules and placed on tissue paper in rearing cages. The population was reared under laboratory conditions at 25 ± 2ºC, 60 ± 5% relative humidity, and 14:10 (Light:Dark) photoperiod and named as the Field population.
Insecticide
A commercially available formulation of bifenthrin (Talstar® 10EC, FMC, Pakistan), was used in this experiment.
Bifenthrin selection
The collected field population was divided into two further populations at the first generation (G1). One population was treated for 44 generations with bifenthrin and named the Bifen-Sel strain. The other population remained untreated with an insecticide and named the Unsel strain. A total of 120 third instar larvae of C. carnea were treated in each selection with increasing concentrations of bifenthrin with a topical application applied with a micro-applicator using a 1-mL glass syringe (Burkard Manufacturing Co. Ltd, Hertfordshire, England). Initially, 125 mg/L of bifenthrin concentration was used to start selection experiment. Each larva was exposed with 0.5 µL drop of insecticide concentration on the dorsal side of the thorax. The treated larvae were placed in capsules (1 larva/capsule) and were fed on the eggs of S. cerealella till pupation. Mortality data were taken 48 h after treatment. The larvae were considered dead upon showing no movement when touched with a camel hair brush. The larvae that survived were the parents of the next generation. Selections were done under the laboratory conditions as mentioned in the ‘Rearing of C. carnea’ section.
Bioassays
Bifenthrin bioassays were conducted on third instar larvae of C. carnea. In each bioassay, four concentrations of insecticide were made as a serial dilution. Each concentration was replicated four times. These serial concentrations were applied topically on the thorax of the larvae with the help of a micro-applicator. Thirty larvae were treated in each concentration, and after that larvae were transferred in gelatin capsules (1 larva/capsule) and fed on eggs of S. cerealella till pupation. Mortality data of each strain were taken 48 h after treatment. Larvae were considered dead if they showed no movement after touching with camel hair brush.
Two-sex life table experiment
Two reciprocal crosses were also established in the laboratory by crossing the Bifen-Sel and Unsel strains, named as cross 1 (C1) and cross 2 (C2). Male adults of the Bifen-Sel strain were crossed with female adults of the Unsel strain in C1, while in C2, females of the Bifen-Sel strain were crossed with males of the Unsel strain. The ratio of males to females was maintained equally in both crosses to determine toxicity and their fitness parameters.
To construct the life table parameters of all experimental strains of C. carnea, 150–200 eggs were collected and placed in gelatin capsules (1 egg/capsule) for each strain. Thirty newly hatched (first instar) larvae were weighed within 24 h after hatching in three replications in a petri dish (6 cm). After that, larvae were placed in capsules with the frozen eggs of S. cerealella until pupal formation. Larval mortality was checked daily. The pupal weight was also recorded 24 h after pupal formation. Thirty pupae were weighed within 24 h of pupation in three replications in a petri dish. All experiments were conducted under laboratory conditions at 25 ± 2ºC, 60 ± 5% relative humidity, and 14:10 (Light:Dark) photoperiod.
The following parameters were calculated according to Chi and Su (Reference Chi and Su2006) and Tuan et al. (Reference Tuan, Lee and Chi2014).
The age-specific survivorship (lx) was determined by
 \begin{equation*}{l_x} = \sum\limits_{j {\text{ = 0}}}^m {{S_{xj}}} \end{equation*}
The age-stage-specific fecundity was determined by
 \begin{equation*}
m_x = \frac{\sum_{j=0}^{m} S_{xj} f_{xj}}{\sum_{j=0}^{m} S_{xj}}
\end{equation*}
\begin{equation*}
m_x = \frac{\sum_{j=0}^{m} S_{xj} f_{xj}}{\sum_{j=0}^{m} S_{xj}}
\end{equation*}The net reproductive rate was determined by
 \begin{equation*}{R_{\text{0}}}{\text{ = }}\sum\limits_{j {\text{ = 0}}}^m {{l_x}} {m_x}\end{equation*}
The finite rate of increase was calculated as
 \begin{equation*}\lambda {\text{ = }}{e^r}\end{equation*}
The intrinsic rate of increase (r) was assessed by the Lotka–Euler equation with the age indexing zero as follows:
 \begin{equation*}\sum\limits_{x {\text{ = 0}}}^\infty {{e^{ - r\left( {x + 1} \right)}}} {l_x}{m_x} {\text{ = 1}}\end{equation*}
The generation time was determined by
 \begin{equation*}T{\text{ = }}\frac{{{\text{In }}\left( {{R_{\text{0}}}} \right)}}{r}\end{equation*}
 The life expectancy ( ${e_{xj}}$) was calculated as follows:
 \begin{equation*}{e_{xj}}{\text{ = }}\sum\limits_{i{\text{ = }}x}^n {\sum\limits_{j{\text{ = }}y}^m {{S_{ij}}} } \end{equation*}
The gross reproductive rate was calculated by
 \begin{equation*}{\text{GRR = }}\sum\limits_{}^{} {{m_x}} \end{equation*}
 The reproductive value ( ${V_{xj}}$) was calculated by:
 \begin{equation*}{V_{xj}} = \frac{{{e^{r{\text{(}}x + {\text{1)}}}}}}{{{S_{xj}}}}\sum\limits_{i = x}^e {{e^{ - r{\text{(}}i + {\text{1)}}}}} \sum\limits_{j = y}^m {{S_{ij}}} {f_{ij}}\end{equation*}
Stability of bifenthrin resistance
To evaluate resistance stability in C. carnea, the Bifen-Sel population was reared consecutively without insecticide exposure for five generations (G55–G59) to determine if resistance to bifenthrin remained stable. Bioassays were conducted with bifenthrin at G55 and G59. The DR (decline rate of resistance) value was calculated using the following equation (Tabashnik et al., Reference Tabashnik, Groeters, Finson and Johnson1994):
DR = log final LC50 − log initial LC50/n,
where ‘n’ is the number of generations reared without exposure to insecticide.
Statistical analysis
Concentration–response data were analysed with Polo Plus Software by using probit analysis (Finney, Reference Finney1971) to obtain the LC50 values, 95% FLs (fiducial limits), slopes with standard errors, and Chi-square (χ2). The LC50s were considered significantly different if 95% FLs did not overlap each other (Litchfield and Wilcoxon, Reference Litchfield and Wilcoxon1949). The resistance ratio (RR) was determined by dividing the LC50 values of the resistant population by the LC50 of the susceptible population.
The life table parameters, including developmental period of immature stages, survival, pre-oviposition, oviposition, post-oviposition period, and adult longevity of both field and susceptible populations, were analysed by using the age-stage two-sex stage life table method (Chi and Su, Reference Chi and Su2006). The means and standard errors of the population were calculated by 100,000 bootstrap replications using the bootstrap technique in two-sex MS-chart programme (Chi et al., Reference Chi, Güncan, Kavousi, Gharakhani, Atlihan, Özgökçe, Shirazi, Amir-Maafi, Maroufpoor and Taghizadeh2022). The graphs of vxj, exj, Sxj, lxmx were plotted by Prism software (Version 8, GraphPad Software Inc., CA, USA).
Results
Toxicity of bifenthrin on different strains of C. carnea
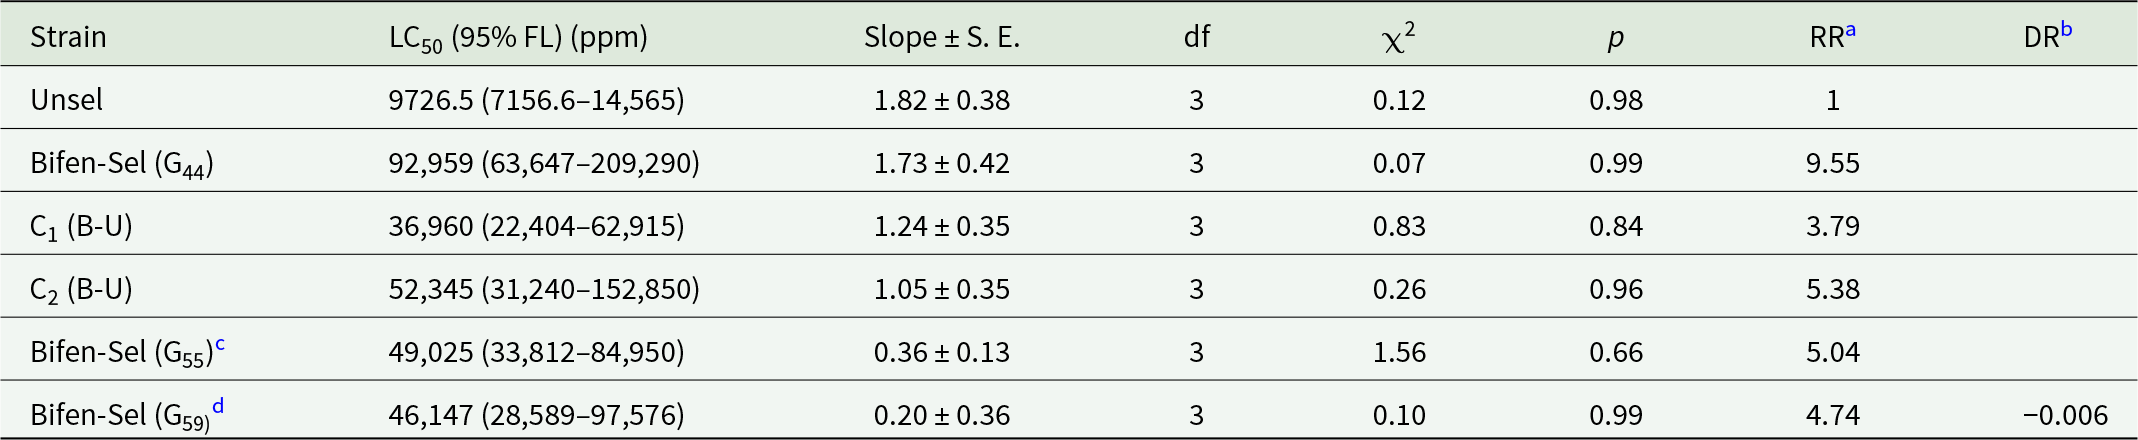
The survival rate of Bifen-Sel strain of C. carnea during 44 cycles of selection with increasing concentration of bifenthrin from 125 to 50,000 ppm was 74.5% to 84.7%, respectively. The toxicity of bifenthrin to Bifen-Sel, Unsel, C1, and C2 of C. carnea is presented in Table 1. The Bifen-Sel strain developed resistance of a 9.55-fold when compared to that of the Unsel strain. There was a significant difference in the LC50 of the Bifen-Sel strain as compared to Unsel strain, as the 95% FLs did not overlap. On the other hand, there was no significant difference in hybrid crosses as the 95% FLs overlapped and the RRs of C1 and C2 were 3.79- and 5.38-fold, respectively, compared to the Unsel strain.
Toxicity of bifenthrin on Unsel and Bifen-Sel strains of Chrysoperla carnea

Table 1 Long description
The table reports bifenthrin toxicity estimates for multiple Chrysoperla carnea strains, listing LC50 values with 95 percent confidence limits, dose response slope with standard error, degrees of freedom, chi squared, p values, and resistance ratios relative to Unsel. Unsel has an LC50 of 9,726.5 ppm with confidence limits from 7,156.6 to 14,565 and a resistance ratio of 1. The selected Bifen-Sel strain at generation 44 has the highest LC50 at 92,959 ppm with confidence limits from 63,647 to 209,290, corresponding to a resistance ratio of 9.55 compared with Unsel. Crosses labeled C1 and C2 fall between these extremes, with LC50 values of 36,960 ppm and 52,345 ppm and resistance ratios of 3.79 and 5.38, respectively. Later Bifen-Sel generations show lower LC50 values than generation 44, at 49,025 ppm for generation 55 and 46,147 ppm for generation 59, with resistance ratios near 5. The slope estimates generally decline in later selected generations, indicating a flatter dose response, and the fit statistics show high p values across rows, suggesting no strong lack of fit in these models. A small negative value is reported for the decline rate in generation 59, and it should be interpreted cautiously because it depends on the study’s calculation method and the limited set of generations shown.
a RR = LC50 of respective strain/LC50 of Unsel strain.
b DR is calculated by following Tabashnik et al. (Reference Tabashnik, Groeters, Finson and Johnson1994).
c Reared without selection pressure from the 44th to 55th generation.
d Reared without selection pressure from the 55th to 59th generation.
After five generations (G55–G59) of no exposure to bifenthrin, there was a non-significant decrease in the LC50 value (from 49,025 to 46,147 ppm), with a rate of decline in bifenthrin resistance (DR) of −0.006. The overlapping of 95% FL values of LC50 of both generations G55 and G59 indicates that bifenthrin resistance is stable (Table 1).
Two-sex life table parameters of Bifen-Sel, Unsel, C1, and C2 strains
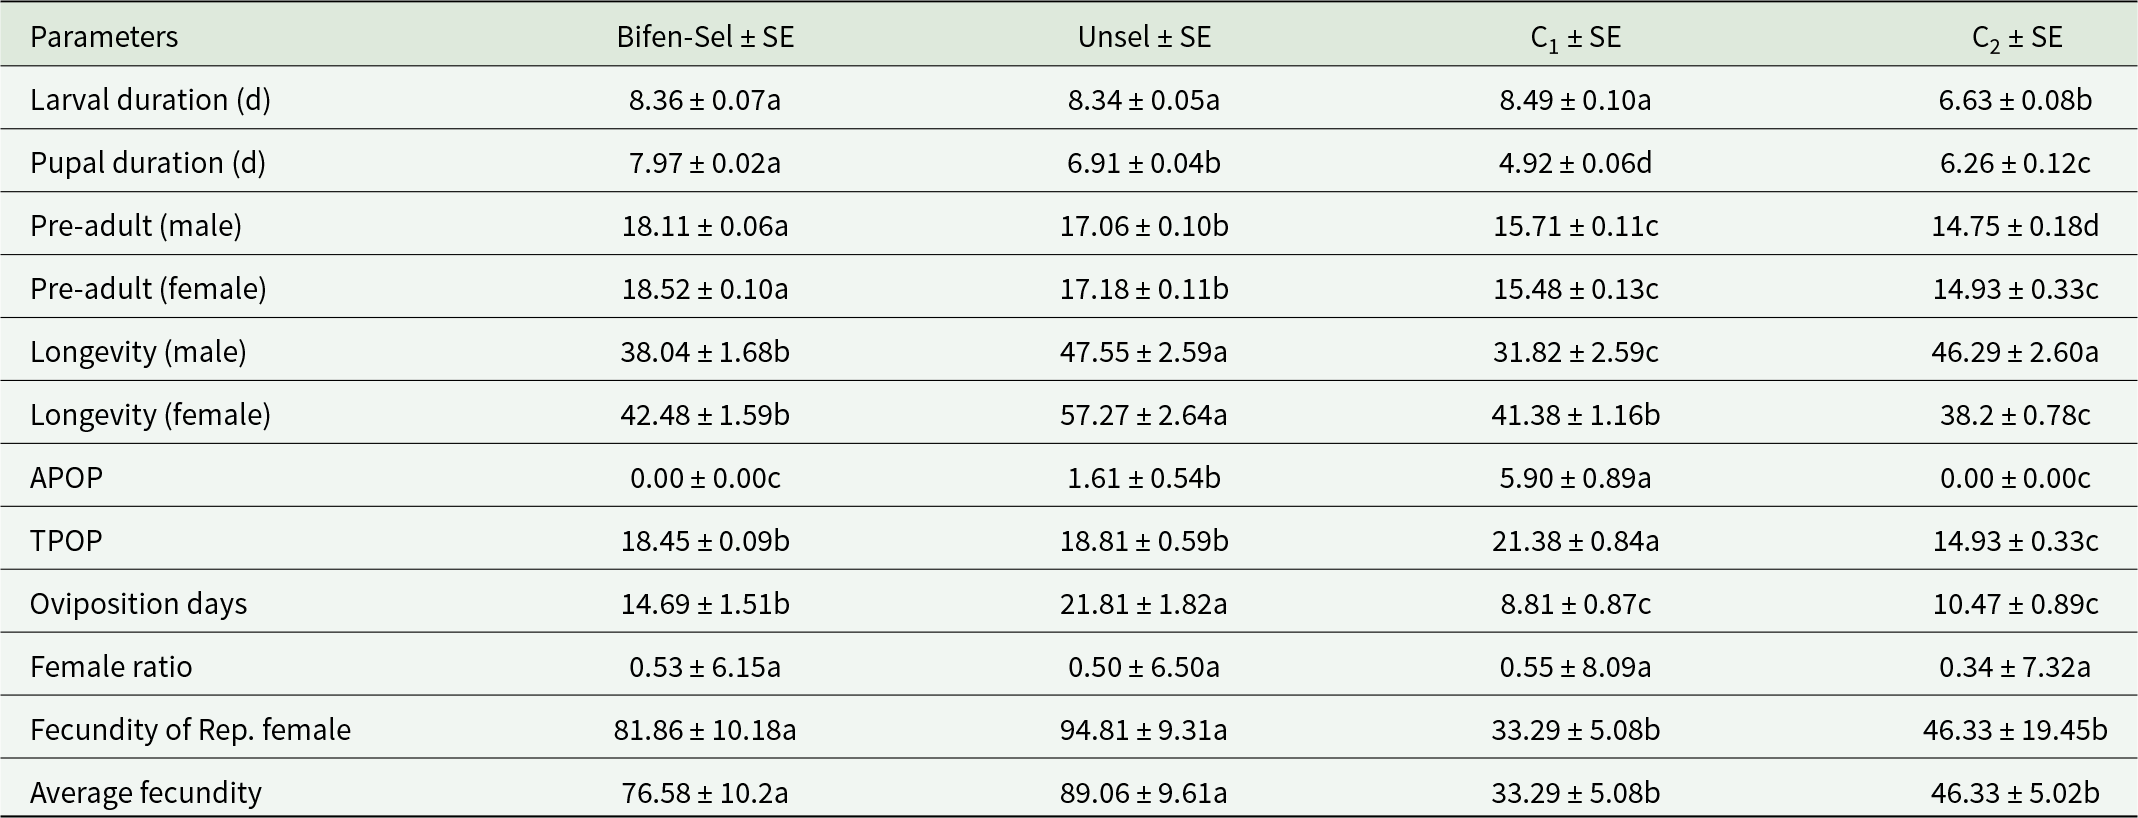
The means of various life stages with standard errors of Bifen-Sel, Unsel, C1, and C2 strains of C. carnea are presented in Table 2. The larval duration of Bifen-Sel and C1 was not significantly different from that of Unsel but significantly longer than that of C2 (p < 0.05). The pupal duration was significantly affected (p < 0.05) and decreased in the following order: Bifen-Sel < Unsel < C2 < C1. The pre-adult duration of male and female C. carnea was significantly longer in the Bifen-Sel strain compared to all other tested strains of C. carnea (p < 0.05). Male and female longevity of Bifen-Sel was significantly shorter than that of the Unsel strain (p < 0.05). The adult pre-oviposition period (APOP) of Bifen-Sel and C2 was similar (p > 0.05), while that of Unsel and C1 strains were significantly affected (p < 0.05). The total pre-oviposition period (TPOP) of Bifen-Sel and Unsel was similar, while that of the C1 and C2 strains were significantly different (p < 0.05). The oviposition period of Bifen-Sel was significantly shorter than that of Unsel (p < 0.05), while C1 and C2 had statistically similar oviposition periods. The female ratio and reproductive female ratio of Bifen-Sel, Unsel, C1, and C2 strains were not significantly different (p > 0.05). The fecundity of the Bifen-Sel and Unsel strains was similar but significantly higher than that of their hybrid crosses C1 and C2 (p < 0.05).
Means of various life history parameters of experimental strains of Chrysoperla carnea
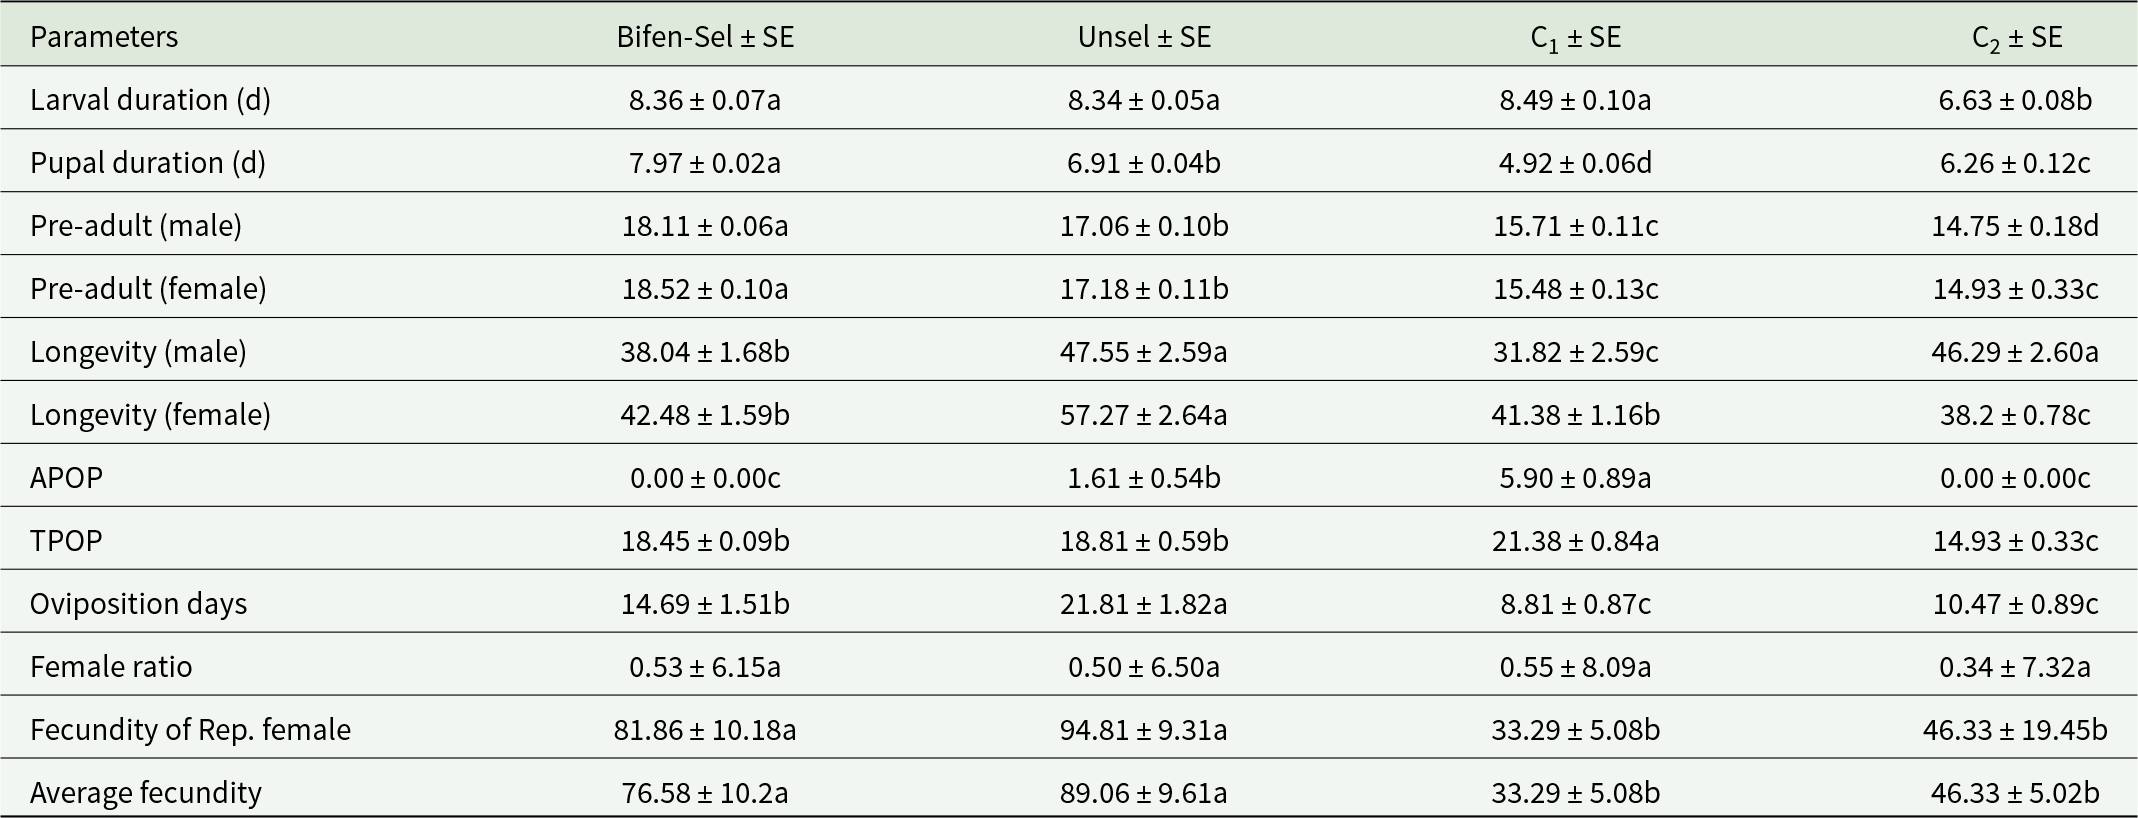
Table 2 Long description
The table reports mean life history traits with standard errors for four experimental strains (Bifen-Sel, Unsel, C1, C2), including development times, adult longevity, reproductive timing, sex ratio, and fecundity. Larval duration is similar for Bifen-Sel, Unsel, and C1 (about 8.3 to 8.5 days) but shorter in C2 (about 6.6 days). Pupal duration differs strongly, shortest in C1 (about 4.9 days) and longest in Bifen-Sel (about 8.0 days), with Unsel and C2 intermediate. Pre-adult duration declines across strains from Bifen-Sel (about 18.1 days for males and 18.5 for females) to C2 (about 14.8 to 14.9 days). Male longevity is highest in Unsel and C2 (about 47.6 and 46.3 days) and lowest in C1 (about 31.8 days); female longevity is highest in Unsel (about 57.3 days) and lowest in C2 (about 38.2 days). Reproductive timing varies: adult pre-oviposition is zero in Bifen-Sel and C2, about 1.6 days in Unsel, and longest in C1 (about 5.9 days), while total pre-oviposition is shortest in C2 (about 14.9 days) and longest in C1 (about 21.4 days). Oviposition days are greatest in Unsel (about 21.8 days) and lowest in C1 (about 8.8 days). Fecundity is higher in Bifen-Sel and Unsel (about 82 to 95 eggs per reproductive female; average about 77 to 89) than in C1 and C2 (about 33 to 46). Letter groupings indicate which means differ statistically within each row, so comparisons should be made within a trait rather than across different traits.
Means within a row having different letters are significantly different based on bootstrap method (100,000 resamplings) using TWOSEX-MSChart (p < 0.05). APOP = Adult pre-oviposition period. TPOP = Total pre-oviposition period.
Demographic parameters of Bifen-Sel, Unsel, C1, and C2
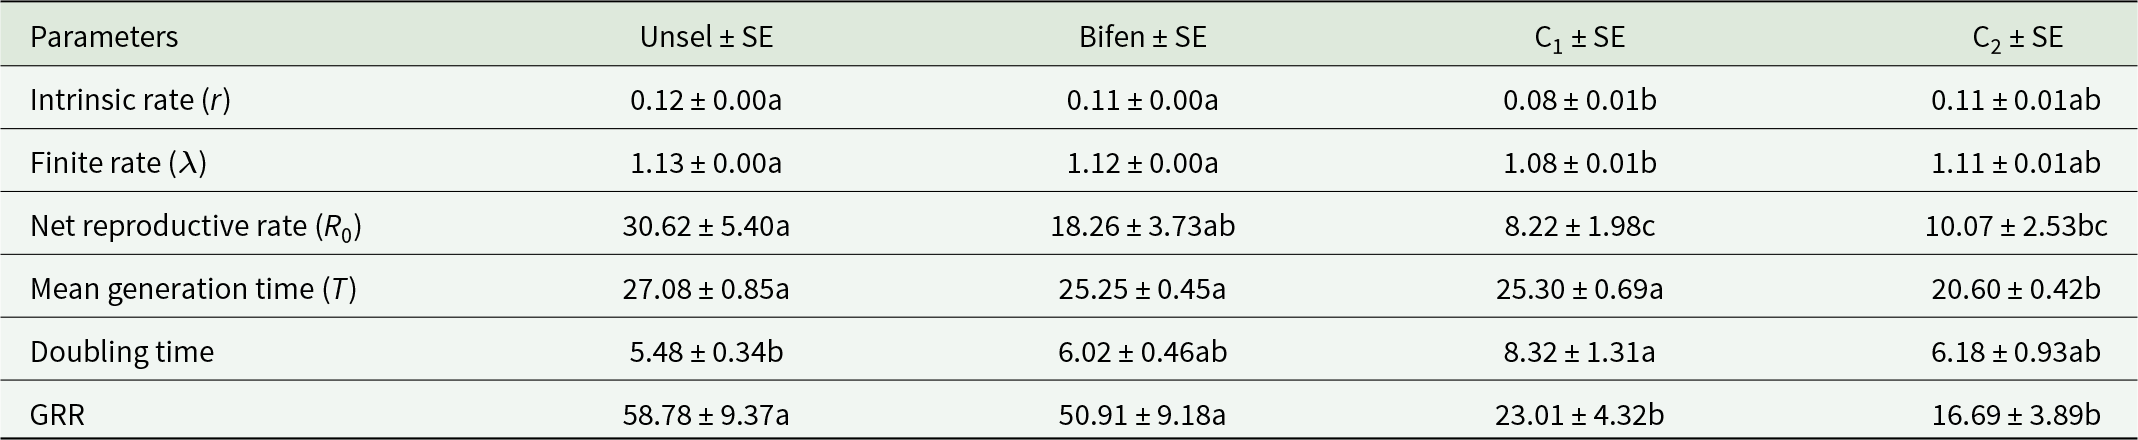
The intrinsic rate and finite rate of Bifen-Sel were statistically similar to that of Unsel and C2 strains, while significantly less than that of C1 (p < 0.05). The net reproductive rate of the Bifen-Sel strain was not significantly different from that of Unsel and C2, while statistically longer than that of C1 (p < 0.05). The mean generation rates of Bifen-Sel, Unsel, and C1 strains were similar (p > 0.05), while that of the C2 strain was significantly lower (p < 0.05). The doubling time of Bifen-Sel was statistically similar in all tested strains, while that of the C1 strain was significantly longer than that of the Unsel strain (p < 0.05). The gross reproductive rate (GRR) of the Bifen-Sel and Unsel strains was similar to each other but significantly greater than that of both crosses C1 and C2 (p < 0.05) (Table 3).
Means of various demographic parameters of experimental strains of Chrysoperla carnea

Table 3 Long description
The table reports mean values with standard errors for six population growth and reproduction parameters across four Chrysoperla carnea strains: Unselected, Bifen, C1, and C2. For intrinsic and finite rates, Unselected and Bifen are highest and similar (about 0.12 and 1.13 for Unselected; about 0.11 and 1.12 for Bifen), C1 is lowest (about 0.08 and 1.08), and C2 is intermediate (about 0.11 and 1.11). Net reproductive rate is greatest in Unselected (about 30.62), lower in Bifen (about 18.26), and much lower in C2 (about 10.07) and C1 (about 8.22). Mean generation time is similar for Unselected, Bifen, and C1 (about 25 to 27), but shorter for C2 (about 20.60). Doubling time is shortest in Unselected (about 5.48), longest in C1 (about 8.32), with Bifen and C2 in between (about 6.02 and 6.18). GRR is highest in Unselected and Bifen (about 58.78 and 50.91) and markedly lower in C1 and C2 (about 23.01 and 16.69). Letter groupings indicate which strain means are statistically similar within each row, so some apparent differences may not be significant.
Means within a row having the same letters are not significantly different at p > 0.05.
Age-stage survival rate
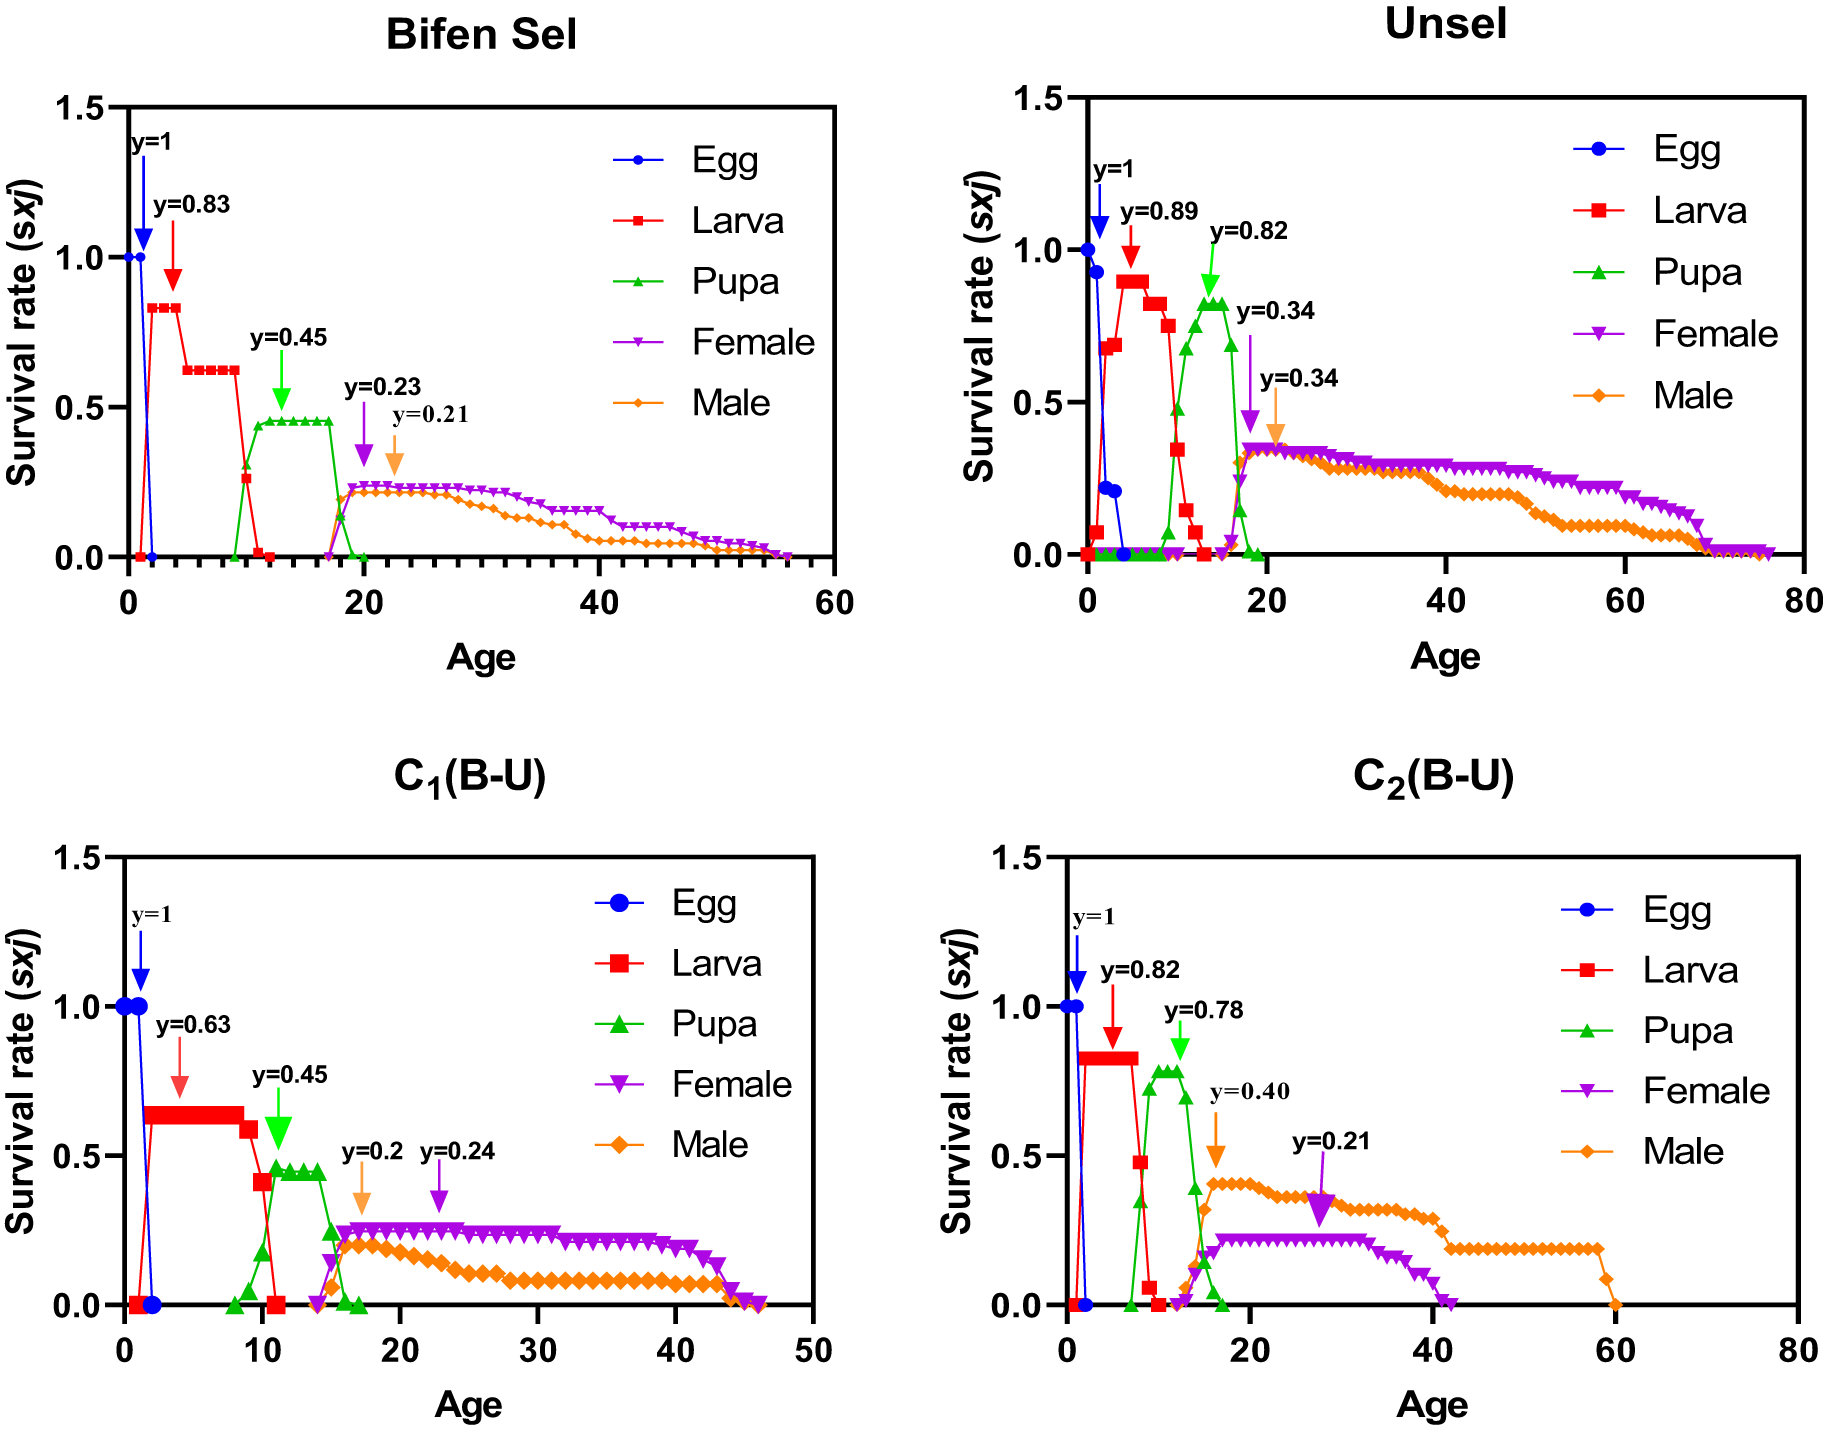
The peak value of age-stage survival rate (Sxj) for the egg of Bifen-Sel, Unsel, C1, and C2 strains was similar. The highest Sxj values for larvae were 0.89 days for Unsel and 0.83 days for Bifen-Sel, followed by 0.63 days for C1 and 0.82 days for C2. The peak Sxj value of pupa was higher in Unsel (0.82) and C2 (0.78), while that of Bifen-Sel and C1 (0.45 days) strains was similar. The highest value of Sxj in females was 0.34 days for Unsel, and 0.24 days for C1, as compared to 0.23 days of Bifen-Sel and 0.21 days of C2. The highest Sxj value of males was for that of Unsel (0.34) as compared to that of C1 (0.20), and Bifen-Sel and C2 (0.21) which were similar. The survival rate of all stages decreases with increasing age, as evident from the age-stage survival curves (fig. 1).
Age-stage survival rate (Sxj) of various experimental strains of Chrysoperla carnea.

Figure 1 Long description
The image A showing Bifen Sel. Vertical axis label: Survival rate (sxj). Vertical axis range: 0.0 to 1.5. Horizontal axis label: Age. Horizontal axis range: 0 to 60. Legend labels with marker shapes: Egg shown with circle markers, Larva shown with square markers, Pupa shown with triangle markers, Female shown with inverted triangle markers, Male shown with diamond markers. Text annotations near curves: y equals 1; y equals 0.83; y equals 0.45; y equals 0.23; y equals 0.21. Egg curve: a point at age 0 with y equals 1, then the curve drops to near 0 by about age 1. Larva curve: starts near 0 at age 0, rises to a short plateau near the annotated y equals 0.83 at early ages, then steps down and reaches 0 by about age 12. Pupa curve: rises from 0 around age 10 to a plateau near the annotated y equals 0.45, then drops to 0 by about age 20. Female curve: begins around age 18 to 20 near the annotated y equals 0.23, then declines gradually toward 0 by about age 58 to 60. Male curve: begins around age 18 to 20 near the annotated y equals 0.21, then declines gradually toward 0 by about age 58 to 60. The image B showing Unsel. Vertical axis label: Survival rate (sxj). Vertical axis range: 0.0 to 1.5. Horizontal axis label: Age. Horizontal axis range: 0 to 80. Legend labels with marker shapes: Egg shown with circle markers, Larva shown with square markers, Pupa shown with triangle markers, Female shown with inverted triangle markers, Male shown with diamond markers. Text annotations near curves: y equals 1; y equals 0.89; y equals 0.82; y equals 0.34; y equals 0.34. Egg curve: a point at age 0 with y equals 1, then drops to near 0 by about age 2. Larva curve: rises to the annotated y equals 0.89 at early ages, then declines to 0 by about age 15 to 16. Pupa curve: rises to the annotated y equals 0.82 around the mid-teen ages, then drops to 0 by about age 20. Female curve: begins around age 18 to 20 near the annotated y equals 0.34, then declines gradually toward 0 by about age 75 to 80. Male curve: begins around age 18 to 20 near the annotated y equals 0.34, then declines gradually toward 0 by about age 75 to 80. The image C showing C1(B-U). Vertical axis label: Survival rate (sxj). Vertical axis range: 0.0 to 1.5. Horizontal axis label: Age. Horizontal axis range: 0 to 50. Legend labels with marker shapes: Egg shown with circle markers, Larva shown with square markers, Pupa shown with triangle markers, Female shown with inverted triangle markers, Male shown with diamond markers. Text annotations near curves: y equals 1; y equals 0.63; y equals 0.45; y equals 0.2; y equals 0.24. Egg curve: a point at age 0 with y equals 1, then drops to near 0 by about age 1. Larva curve: rises to the annotated y equals 0.63 at early ages, then declines to 0 by about age 12. Pupa curve: rises to the annotated y equals 0.45 around the early to mid-teen ages, then drops to 0 by about age 18 to 19. Female curve: begins around age 16 to 18 near the annotated y equals 0.24, then stays near a low plateau and declines toward 0 by about age 45 to 48. Male curve: begins around age 16 to 18 near the annotated y equals 0.2, then declines toward 0 by about age 45 to 48. The image D showing C2(B-U). Vertical axis label: Survival rate (sxj). Vertical axis range: 0.0 to 1.5. Horizontal axis label: Age. Horizontal axis range: 0 to 80. Legend labels with marker shapes: Egg shown with circle markers, Larva shown with square markers, Pupa shown with triangle markers, Female shown with inverted triangle markers, Male shown with diamond markers. Text annotations near curves: y equals 1; y equals 0.82; y equals 0.78; y equals 0.40; y equals 0.21. Egg curve: a point at age 0 with y equals 1, then drops to near 0 by about age 1 to 2. Larva curve: rises to the annotated y equals 0.82 at early ages, then declines to 0 by about age 12 to 13. Pupa curve: rises to the annotated y equals 0.78 around the early teen ages, then drops to 0 by about age 18 to 19. Female curve: begins around age 16 to 18 near the annotated y equals 0.21, then declines to 0 by about age 40. Male curve: begins around age 16 to 18 near the annotated y equals 0.40, then declines gradually and reaches 0 at about age 60. Across all four images, the egg curve starts at y equals 1 at age 0 and drops to near 0 at early ages. The larva and pupa curves rise to the annotated peak y values in each image and then drop to 0 at later ages. The female and male curves begin at later ages and decline toward 0 over longer age ranges, with the longest age range in Unsel and the shortest female age range in C2(B-U).
Age-stage life expectancy
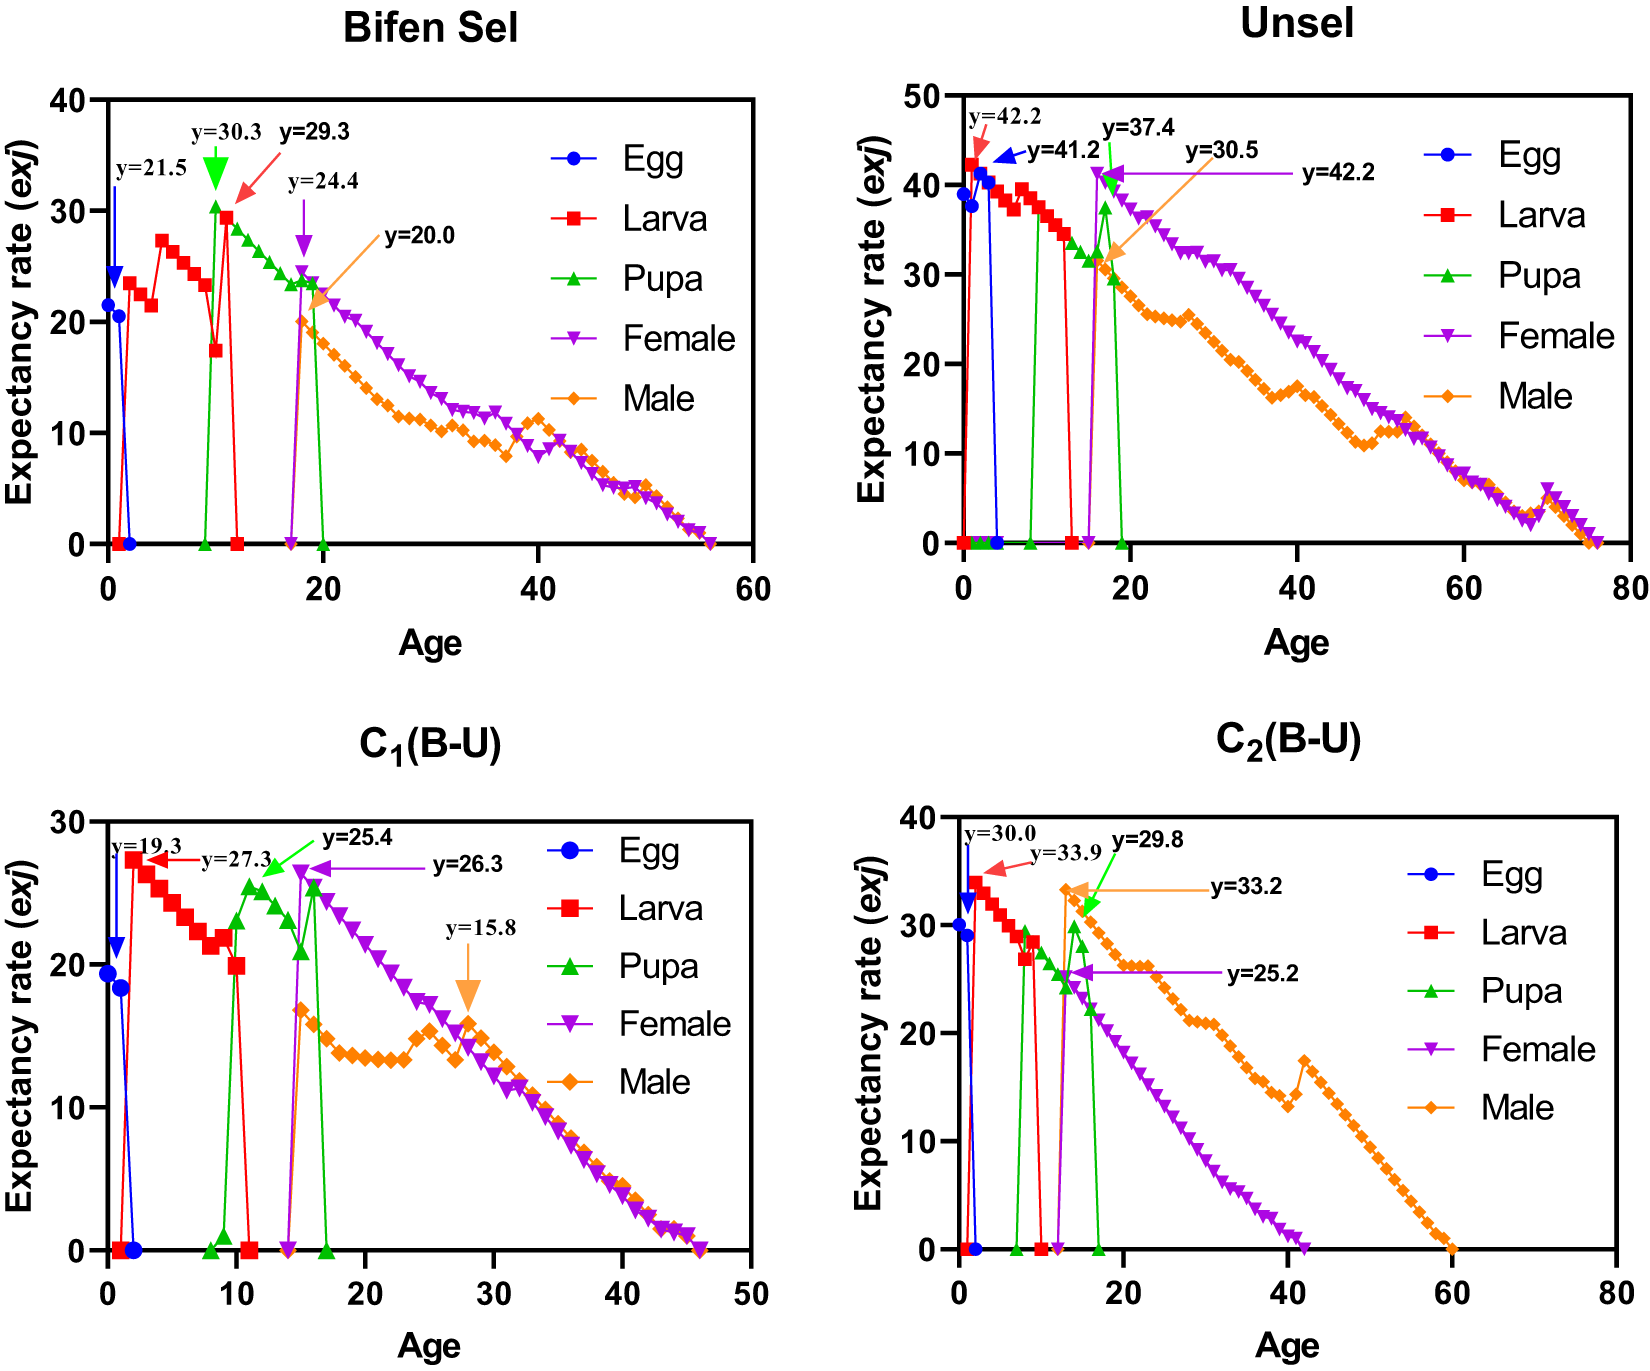
The patterns of age-stage life expectancy (exj) demonstrate the survival expectancy among the different strains. Unsel (41.2 days) and C2 (30.0 days) strains had a higher maximum value for eggs as compared to that of Bifen-Sel (21.5 days) and C1 (19.3 days). The peak exj value of larva was 42.2 and 33.9 days in Unsel and C2 strains, respectively, which was higher than that of Bifen-Sel and C1 (29.3 and 27.3 days), respectively. Similarly, the pupa peak value was higher in the Unsel (37.4) than in Bifen-Sel (30.3), C2 (29.8), and C1 (26.4) strains. The peak value of females was higher in the Unsel (42.2) than in C1 (26.3), C2 (25.2), and Bifen-Sel (24.4). The peak exj value of males was higher in C2 (33.2) than in Unsel (30.5), Bifen-Sel (20.0), and C1 (15.8), respectively. The expectancy rate of all strains decreases with increasing age, as evident from the age-stage expectancy curves (fig. 2).
Age-stage expectancy rate (exj) of various experimental strains of Chrysoperla carnea.
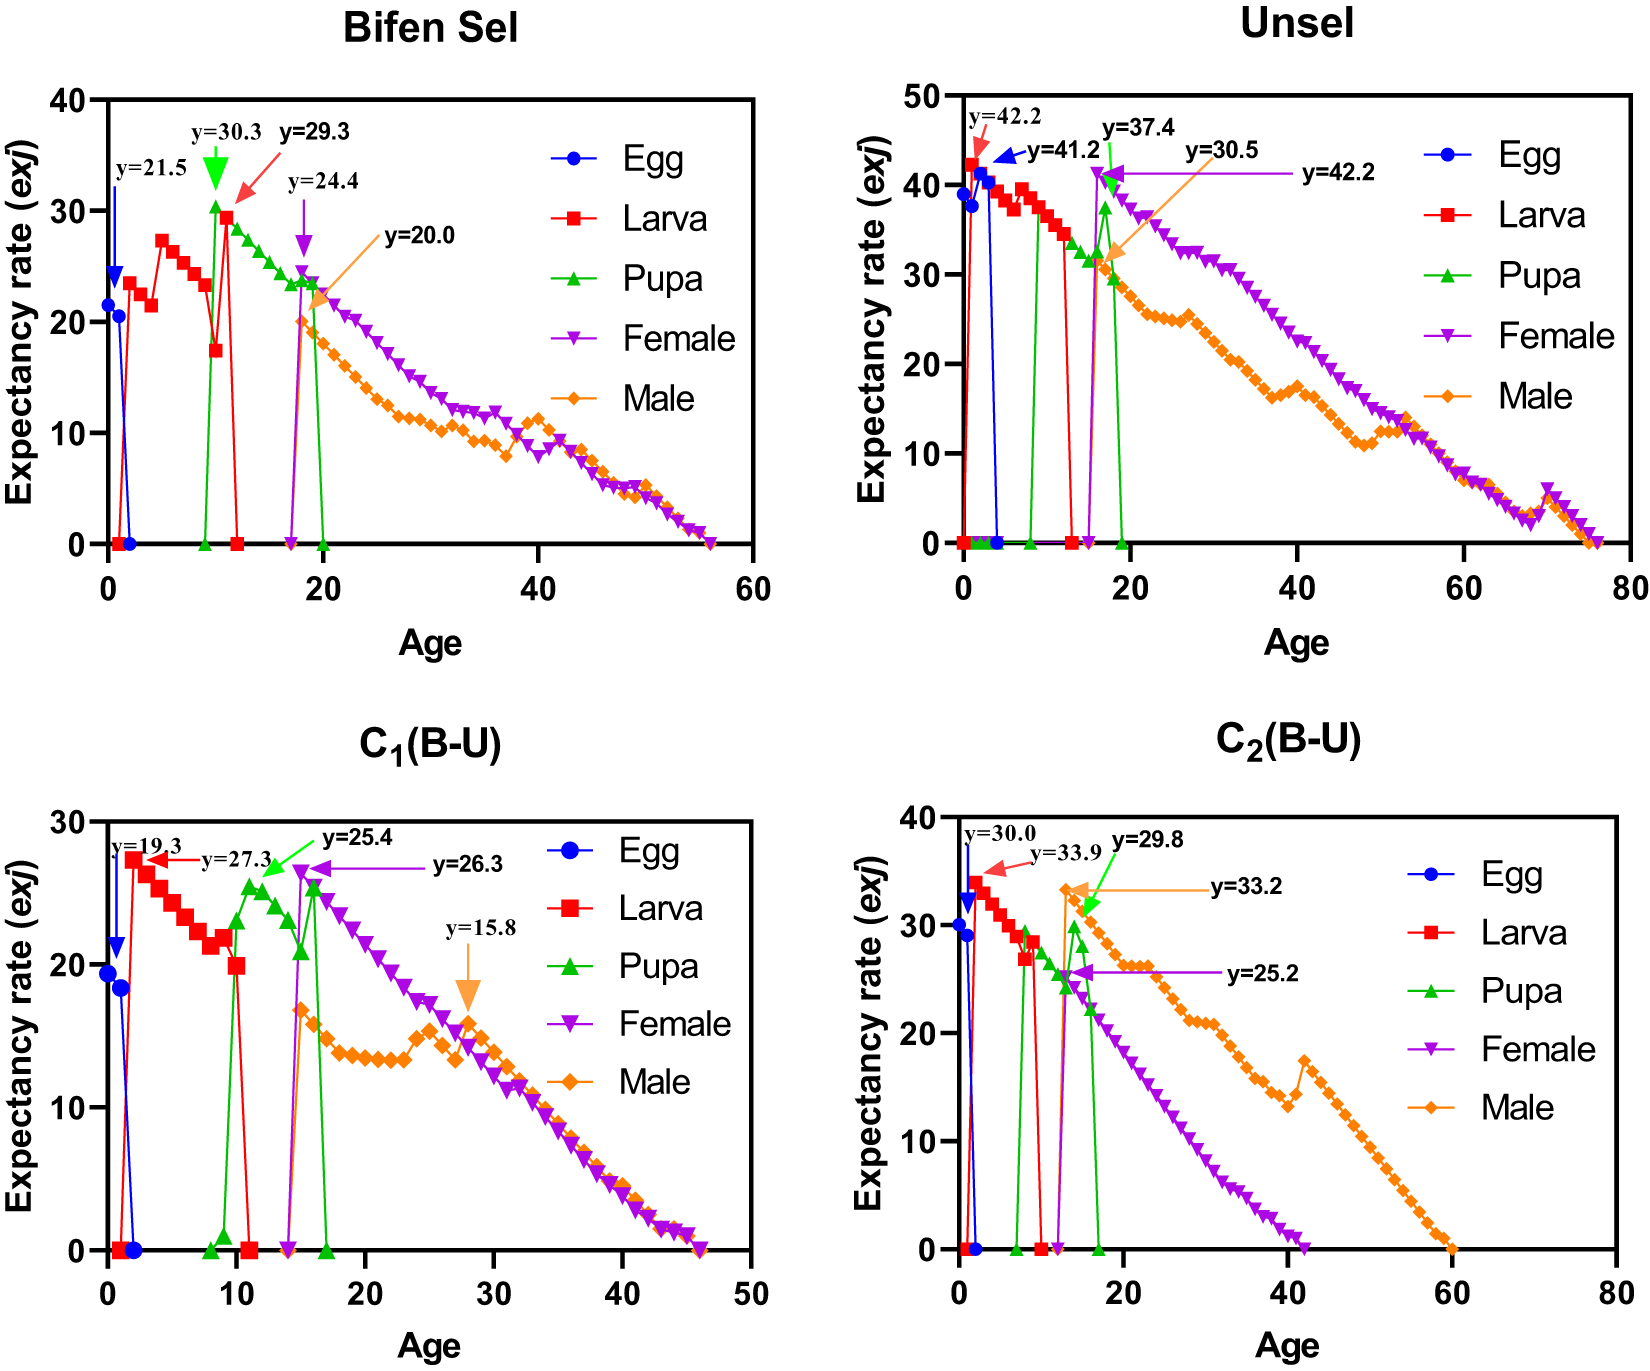
Figure 2 Long description
The image contains four multi-line graphs comparing age-stage expectancy rates (exj) of various experimental strains of Chrysoperla carnea: Bifen Sel, Unsel, C1(B-U) and C2(B-U). Each graph displays data for Egg, Larva, Pupa, Female and Male stages, distinguished by both color and shape markers. Graph A: Bifen Sel - X-axis: Age (days), ranging from 0 to 60. - Y-axis: Expectancy rate (exj), ranging from 0 to 40. - Egg peaks at 21.5 days, Larva at 30.3 days, Pupa at 29.3 days, Female at 24.4 days, Male at 20.0 days. - Sharp declines are observed at stage transitions, with adult curves approaching zero around age 50. Graph B: Unsel - X-axis: Age (days), ranging from 0 to 80. - Y-axis: Expectancy rate (exj), ranging from 0 to 50. - Egg peaks at 42.2 days, Larva at 41.2 days, Pupa at 37.4 days, Female at 42.2 days, Male at 30.5 days. - Unsel shows higher early-stage peaks and longer tails for Female and Male stages, with curves nearing zero around age 70. Graph C: C1(B-U) - X-axis: Age (days), ranging from 0 to 50. - Y-axis: Expectancy rate (exj), ranging from 0 to 30. - Egg peaks at 19.3 days, Larva at 27.3 days, Pupa at 25.4 days, Female at 26.3 days, Male at 15.8 days. - Sharp drops to zero at stage transitions, with adult curves nearing zero around age 40. Graph D: C2(B-U) - X-axis: Age (days), ranging from 0 to 80. - Y-axis: Expectancy rate (exj), ranging from 0 to 40. - Egg peaks at 30.0 days, Larva at 33.9 days, Pupa at 29.8 days, Female at 25.2 days, Male at 33.2 days. - C2 shows a more gradual decline for Male compared to Female, with curves nearing zero around age 60. Overall, the graphs illustrate differences in survival expectancy among strains, with Unsel generally showing higher peaks and longer adult stages compared to others. Each stage is marked by distinct colors and shapes, aiding visual differentiation.
Age-stage reproductive value
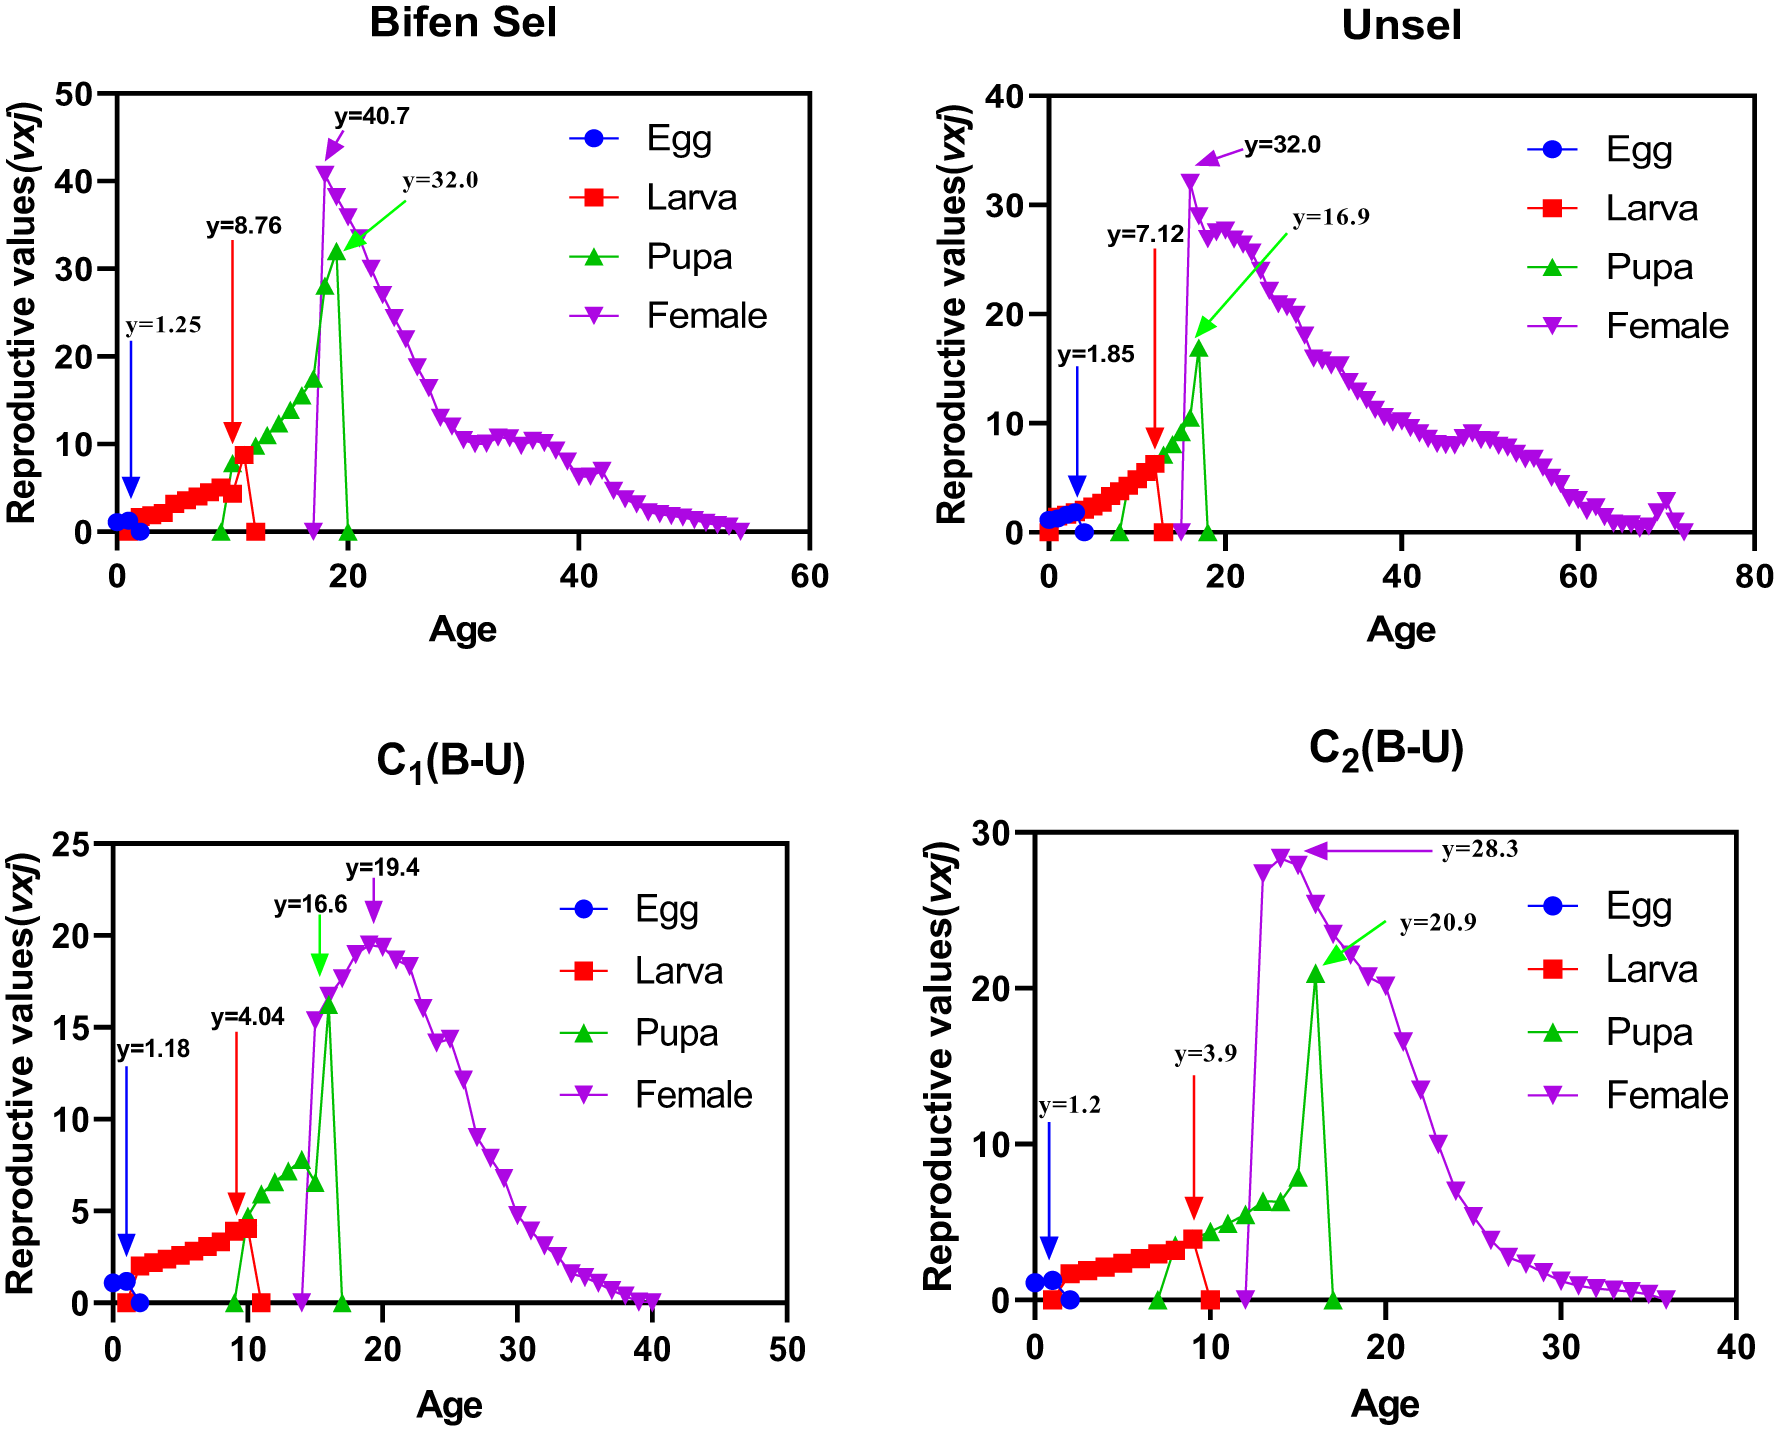
The age-stage reproductive value (vxj) value of the Unsel strain was 1.85, which was comparatively higher than that of Bifen-Sel, C1, and C (1.25, 1.18, and 1.20), respectively. The peak value of vxj of Bifen-Sel and Unsel was 8.76 and 7.12 days, respectively, which was higher compared to that of C1 and C2 (4.04 and 3.90 days). The highest value of vxj for the pupa of the Bifen-Sel strain was 32.0, which was higher than that of Unsel (16.9), C1 (16.6), and C2 (20.9). The peak vxj value for females of the Bifen-Sel (40.7) was higher compared to that of Unsel (32.0), C1 (19.4), and C2 (28.3) strains. The age-stage reproductive value of females of all strains decreases with increasing age, as evident from fig. 3.
Age-stage reproductive rate (vxj) of various experimental strains of Chrysoperla carnea.

Figure 3 Long description
The multi-line graphs compare the age-stage reproductive values (vxj) for different life stages of Chrysoperla carnea across four experimental strains: Bifen Sel, Unsel, C1(B-U) and C2(B-U). Each graph has the horizontal axis labeled 'Age' and the vertical axis labeled 'Reproductive values(vxj)'. In Bifen Sel, the Egg stage peaks at approximately age 0 with a value of 1.25. The Larva stage peaks around age 8 with a value of 8.76. The Pupa stage reaches its peak at age 16 with a value of 32.0 and the Female stage peaks at age 20 with a value of 40.7. In Unsel, the Egg stage peaks at age 0 with a value of 1.85. The Larva stage peaks around age 7 with a value of 7.12. The Pupa stage peaks at age 15 with a value of 16.9 and the Female stage peaks at age 18 with a value of 32.0. In C1(B-U), the Egg stage peaks at age 0 with a value of 1.18. The Larva stage peaks around age 4 with a value of 4.04. The Pupa stage peaks at age 10 with a value of 16.6 and the Female stage peaks at age 12 with a value of 19.4. In C2(B-U), the Egg stage peaks at age 0 with a value of 1.2. The Larva stage peaks around age 3 with a value of 3.9. The Pupa stage peaks at age 9 with a value of 20.9 and the Female stage peaks at age 11 with a value of 28.3. Comparatively, Bifen Sel shows the highest peak for the Female stage, while C2(B-U) has the longest tail with age. The Pupa stage peaks earlier in C1(B-U) and C2(B-U) compared to Bifen Sel and Unsel. Each graph uses distinct markers for Egg (circle), Larva (square), Pupa (triangle) and Female (inverted triangle) to differentiate the stages visually.
Age-specific maternity
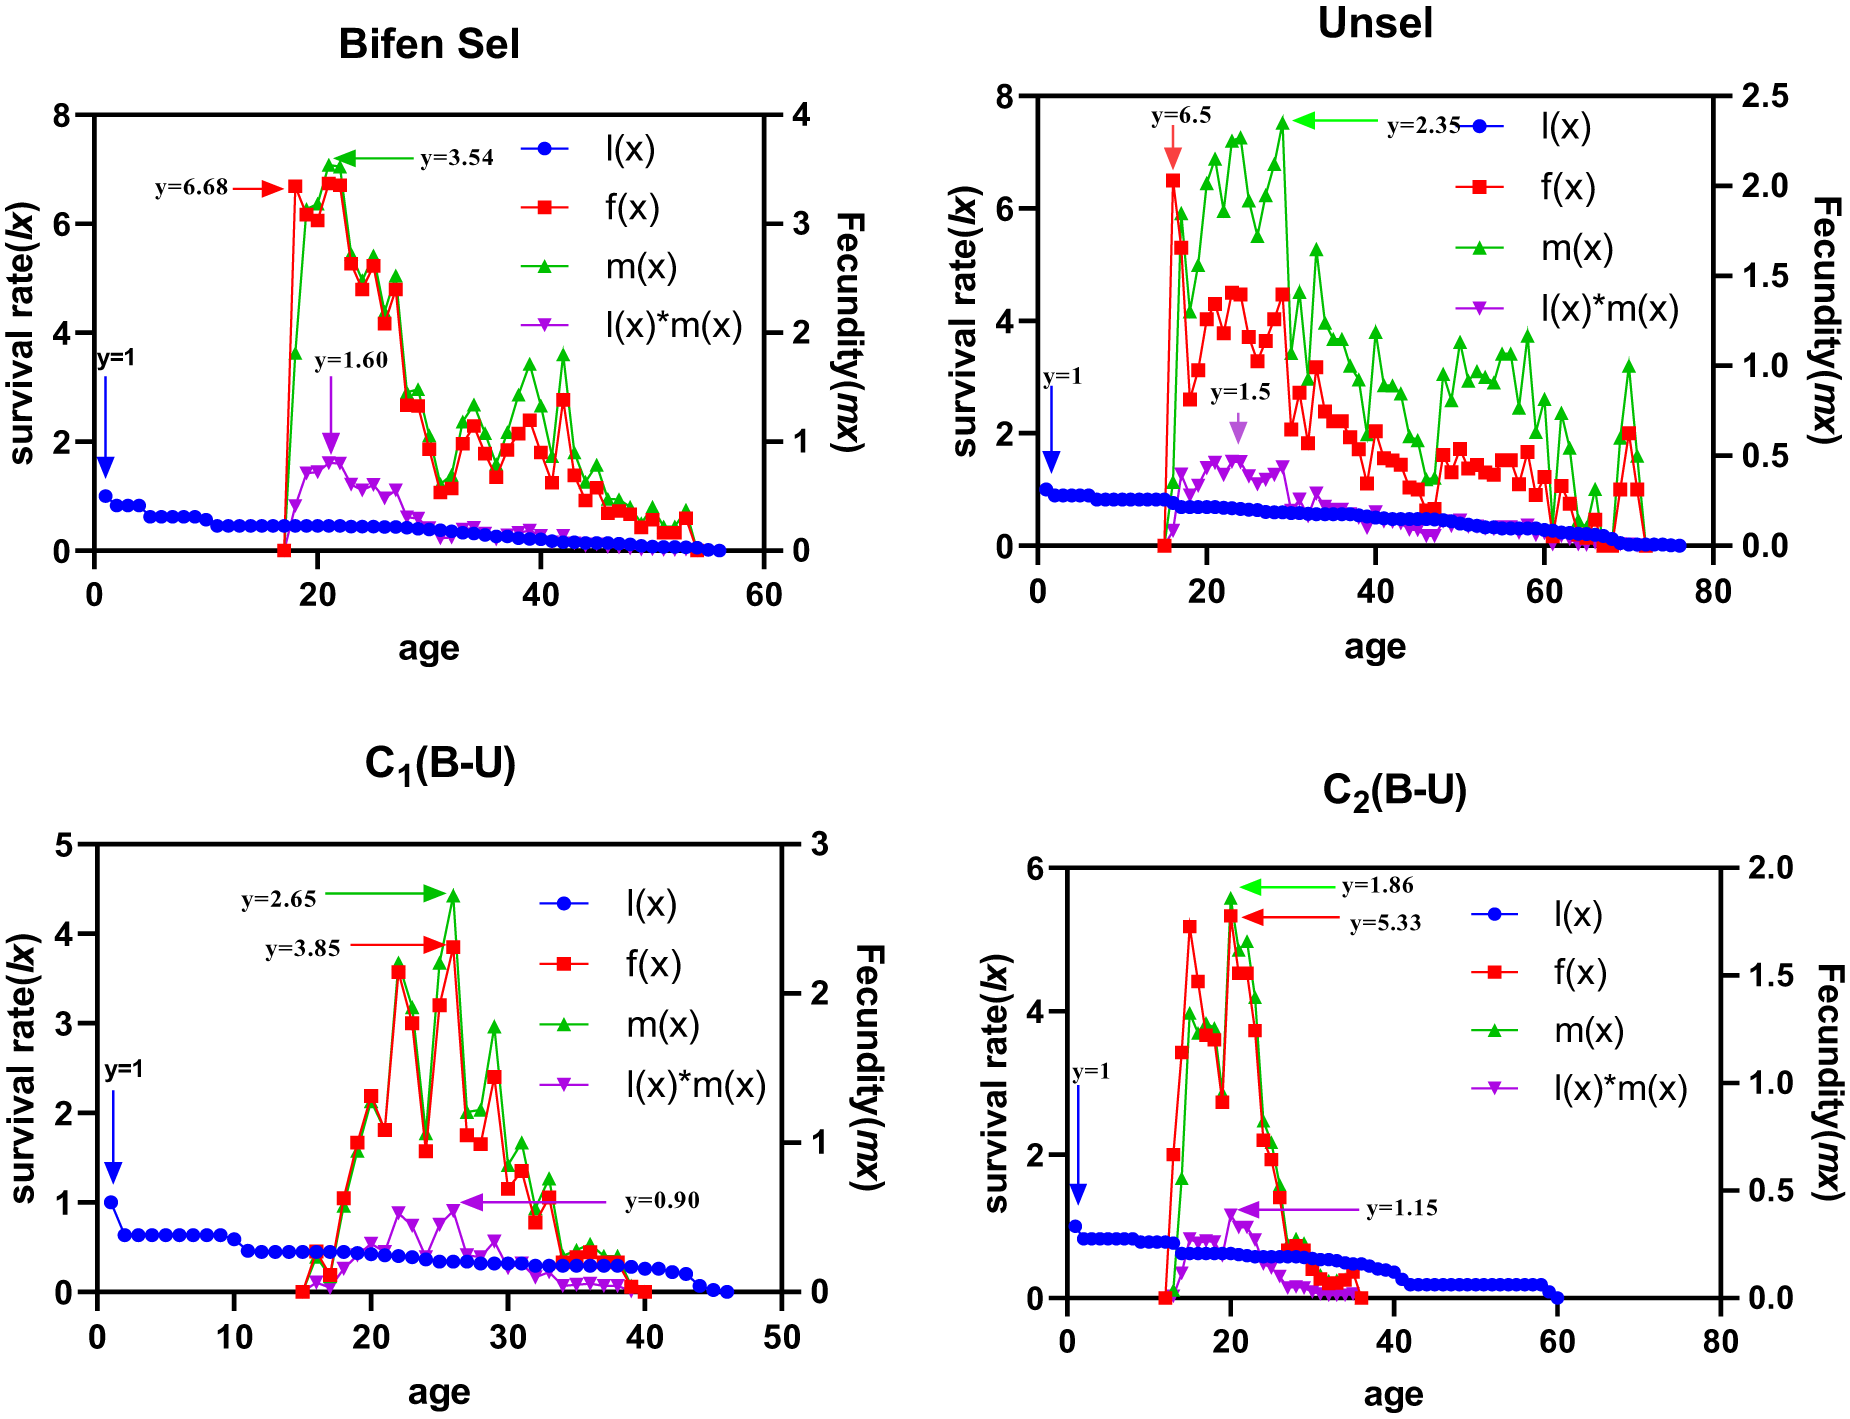
The peak lx value of the Bifen-Sel, Unsel, C1, and C2 strains was similar (p > 0.05). The Bifen-Sel and Unsel strains aged 54 and 72 days and had an fx of 6.68 and 6.50/day, which was higher than that of C1 and C2 (3.85 and 5.33), respectively. The maximum peak of mx of the Bifen-Sel (3.54 eggs/day) strain was observed at age 53 days, which was greater than that of Unsel, C1, and C2 strains (2.35, 2.65, and 1.86 eggs/day) at ages of 71, 38, and 29 days, respectively. Bifen-Sel and Unsel strains exhibited maximum age-specific maternity (lxmx) (1.60 and 1.50 offspring/day) when they were 23 days old, while C1 and C2 strains had 0.90 and 1.15 offspring/day, which were comparatively lower (fig. 4).
Age-stage fecundities of various experimental strains of Chrysoperla carnea.

Figure 4 Long description
The image A showing a line graph titled Bifen Sel. The horizontal axis label is age, with a range from 0 to 60. The left vertical axis label is survival rate l(x), with a range from 0 to 8. The right vertical axis label is Fecundity (mx), with a range from 0 to 4. The legend lists l(x), f(x), m(x) and l(x) times m(x). The l(x) series is drawn with circular markers and starts near 1 at age 0, then declines gradually across the age range and approaches 0 near the end of the axis. The f(x) series is drawn with square markers and is near 0 through the early ages, then rises sharply around the late teens to early twenties, reaches a high region marked by the annotation y equals 6.68 and then declines with fluctuating values through later ages. The m(x) series is drawn with triangle markers and rises around the same age region as f(x), with a peak region marked by the annotation y equals 3.54, then declines with fluctuations. The l(x) times m(x) series is drawn with inverted triangle markers and forms a hump in the early to mid adult ages, with a marked value y equals 1.60, then declines toward 0. A vertical arrow annotation near the left side is labeled y equals 1. The image B showing a line graph titled Unsel. The horizontal axis label is age, with a range from 0 to 80. The left vertical axis label is survival rate l(x), with a range from 0 to 8. The right vertical axis label is Fecundity (mx), with a range from 0.0 to 2.5. The legend lists l(x), f(x), m(x) and l(x) times m(x). The l(x) series with circular markers starts near 1 at age 0, stays near 1 through early ages, then declines gradually and approaches 0 near the highest ages. The f(x) series with square markers is near 0 in early ages, then rises sharply around the mid teens, reaches a high region marked by y equals 6.5 and then declines with repeated fluctuations across a long span of ages, including smaller rises later in the age range. The m(x) series with triangle markers rises after the mid teens, reaches a peak region marked by y equals 2.35, then declines with fluctuations across later ages. The l(x) times m(x) series with inverted triangle markers forms a hump after the onset of fecundity, with a marked value y equals 1.5, then declines toward 0. A vertical arrow annotation near the left side is labeled y equals 1. The image C showing a line graph titled C1(B-U). The horizontal axis label is age, with a range from 0 to 50. The left vertical axis label is survival rate l(x), with a range from 0 to 5. The right vertical axis label is Fecundity (mx), with a range from 0 to 3. The legend lists l(x), f(x), m(x) and l(x) times m(x). The l(x) series with circular markers starts near 1 at age 0, drops early to a lower level, then continues a gradual decline and approaches 0 near the end of the axis. The f(x) series with square markers is near 0 through early ages, then rises in the late teens to twenties, with a peak region marked by y equals 3.85, followed by a decline with fluctuations into the thirties and then toward 0. The m(x) series with triangle markers rises in the same general age region, with a peak region marked by y equals 2.65, then declines with fluctuations. The l(x) times m(x) series with inverted triangle markers forms a hump during the fecundity period, with a marked value y equals 0.90, then declines toward 0. A vertical arrow annotation near the left side is labeled y equals 1. The image D showing a line graph titled C2(B-U). The horizontal axis label is age, with a range from 0 to 80. The left vertical axis label is survival rate l(x), with a range from 0 to 6. The right vertical axis label is Fecundity (mx), with a range from 0.0 to 2.0. The legend lists l(x), f(x), m(x) and l(x) times m(x). The l(x) series with circular markers starts near 1 at age 0, declines gradually and reaches 0 around the mid to later ages, then remains at 0 through the remaining ages shown. The f(x) series with square markers rises from near 0 in the early teens, reaches a peak region marked by y equals 5.33 around the late teens to early twenties, then drops rapidly and stays near 0 afterward. The m(x) series with triangle markers rises in the same early adult age region, with a peak region marked by y equals 1.86, then declines toward 0. The l(x) times m(x) series with inverted triangle markers forms a smaller hump with a marked value y equals 1.15, then declines toward 0. A vertical arrow annotation near the left side is labeled y equals 1. Across the four graphs, l(x) decreases with age in each title. The f(x), m(x) and l(x) times m(x) series rise from near 0 after early ages, form one main peak region in each title and then decline toward 0, with the Unsel graph showing fluctuations over a longer age range than the other titles.
Discussion
A key component of IPM programmes is a combination of chemical and biological control. Natural enemies play a key role as biological control agents, but their stability in the field is dependent on a lack of disturbance due to the excessive use of insecticides and their common physiology (Wang et al., Reference Wang, Yang, Su, Shen, Gao and Zhu2008). However, ensuring compatibility between natural enemies and chemical insecticides can be a challenging task. Chemical selectivity is influenced by various factors, including the physicochemical properties of the product, the mode of exposure, the target species, behaviour, the insect’s developmental stage, and detoxification mechanisms (Fernandes et al., Reference Fernandes, Bacci and Fernandes2010). It is essential to examine the different insecticidal effects on resistance development and the impact of resistance on the fitness cost of C. carnea. Therefore, using resistant natural enemies along with insecticides could be an alternative approach to control insect pests (Sayyed et al., Reference Sayyed, Pathan and Faheem2010). In this study, C. carnea was exposed to bifenthrin in the laboratory for 44 generations. This led to a Bifen-Sel population developing a 9.55-fold resistance when compared to an Unsel population. Our results showed that a laboratory-selected population of C. carnea had the potential to develop insecticide resistance. Previously, development of high resistance to different insecticides in C. carnea has been reported when selected with chlorfenapyr (217-fold) (Abubakar and Shad, Reference Abubakar and Shad2024), chlorantraniliprole (100.32-fold) (Abubakar and Shad, Reference Abubakar and Shad2025), and buprofezin (392.37-fold) (Mansoor and Shad, Reference Mansoor and Shad2019a) as compared to a susceptible population. Bifenthrin would be effective in agroecosystems to control insect pests because of C. carnea’s exceptional durability. Because of its high LC50 value, the Bifen-Sel strain would very likely tolerate field-recommended doses of bifenthrin and perform admirably in the field.
Assessing the stability of insecticide resistance offers valuable insights for IPM programmes and contributes to effective resistance management strategies for insect pests (Abbas and Hafez, Reference Abbas and Hafez2023). Understanding insecticide resistance stability, i.e., whether it is stable or not, is valuable information for the practical application of resistant biocontrol agents such as C. carnea and their conservation in pest management strategies (Abubakar and Shad, Reference Abubakar and Shad2025). When a population has unstable resistance to an insecticide, the population that had once become resistant may revert to susceptibility after a few generations without insecticide exposure (Shah and shad, Reference Shah and Shad2020). In our study, resistance to bifenthrin was stable when the Bifen-Sel strain was reared without its exposure to an insecticide for five generations in C. carnea. Unlike our findings, previously unstable resistance to indoxacarb, chlorfenapyr, acetamiprid, and methoxyfenozide has been reported in C. carnea from Pakistan (Mansoor et al., Reference Mansoor, Raza, Abbas, Aqueel and Afzal2017; Mansoor and Shad, Reference Mansoor and Shad2019b, Reference Mansoor and Shad2022; Abubakar and Shad, Reference Abubakar and Shad2025). Furthermore, unstable bifenthrin resistance has also been reported in Bemisia tabaci (Basit, Reference Basit2019) and Oxycarenus hyalinipennis (Banazeer et al., Reference Banazeer, Shad and Afzal2020). Similar to our findings, previously stable resistance to pyriproxifen, deltamethrin, and nitenpyram has been reported in C. carnea (Sayyed et al., Reference Sayyed, Pathan and Faheem2010; Mansoor et al., Reference Mansoor, Raza, Abbas, Aqueel and Afzal2017; Mansoor and Shad, Reference Mansoor and Shad2020). The possible reasons for stable resistance to bifenthrin might be the absence of fitness cost linked with resistant phenotype, and the involvement of factors that provide a survival advantage, i.e. biochemical or ecological factors. These factors contribute to the persistence of bifenthrin resistance even in the absence of continuous insecticide selection pressure (Crow, Reference Crow1957; Pathan et al., Reference Pathan, Sayyed, Aslam, Liu, Razzaq and Ahmed Gillani2010).
By exposing successive generations to insecticide, laboratory selection increased C. carnea’s genetic resistance to them, ensuring their survival in treated environments and strengthening their function in biological control programmes (Gopalkrishna et al., Reference Gopalkrishna, Chakravarthy and Prasad2022). However, insecticide exposure may have toxic and sublethal effects on natural enemies, changing their development, longevity, behaviour, sex ratio, and fertility, which eventually affect the effectiveness of biological control. For this reason, it is crucial to evaluate the impact of insecticides on natural enemies (Golmohammadi et al., Reference Golmohammadi, Torshizi, Vafaei-Shooshtari, Faravardeh and Rafaei-Karehroudi2021). The Bifen-Sel population demonstrated no fitness advantage linked to insecticide resistance when compared to the Unsel population. The following biological parameters of the Bifen-Sel population were not significantly different from that of the Unsel population of C. carnea: larval duration, TPOP, female ratio, and fecundity. Corroborating our findings, C. carnea strains resistant to several insecticides showed no significant difference in fecundity compared to Unsel populations, i.e. chlorantraniliprole (Abubakar and Shad, Reference Abubakar and Shad2025), bifenthrin (Khan et al., Reference Khan, Shad, Atta, Zaman and Abubakar2025), and spinosad (Rimoldi et al., Reference Rimoldi, Schneider and Ronco2008). Therefore, there is a high possibility that physiological variations among the resistant strains are not only fitness cost-related but also consequences of diverse genetic backgrounds. According to Kliot and Ghanim (Reference Kliot and Ghanim2012), with prolonged evolutionary pressure over many generations, genetic adaptations are likely to occur, reducing the negative impacts of the initial adaptation and fine-tuning the trait so that any fitness costs become undetectable. Although the Bifen-Sel strain showed no fitness advantage, it may have potential to survive under insecticide exposure in the field without a noticeable fitness cost. Thus, a bifenthrin-resistant C. carnea population would have a major advantage over an Unsel one.
Information regarding the APOP of natural biological control agents provides useful knowledge for both mass production populations in laboratories and their release in pest management programmes (Chi Hsin et al., Reference Chi Hsin, Fu Jianwei and You Minsheng2019; Lillo et al., Reference Lillo, Perez‐Bañón and Rojo2021; Abubakar and Shad, Reference Abubakar and Shad2025). In previous studies, APOP has been reported in several natural enemies, including Aphidius gifuensis (Ashmead, 1906) (Chi and Su, Reference Chi and Su2006), Propylaea japonica (Thunberg, 1781) (Chi and Yang, Reference Chi and Yang2003), Orius strigicollis (Ali et al., Reference Ali, Zhu, Jaleel, Rehman, Rasheed, Khan, Islam, Hafeez and Zhou2020), and Arma chinensis (Fallou, 1881) (Cao et al., Reference Cao, Lan, Yang, Gong, Zhang, Zhou and Jin2023). In our study, the APOP of the Bifen-Sel and C2 strains was significantly lower compared to that of the Unsel strain and reached zero. It means that females of the Bifen-Sel strain tend to mate and lay eggs within 24 h. Exploitation of these strains is highly advantageous in the management of insect pests in high-value crops. It suggests that diet and density variation can alter the oviposition period. Ali et al. (Reference Ali, Zhu, Jaleel, Rehman, Rasheed, Khan, Islam, Hafeez and Zhou2020) showed that food source also had an impact on the oviposition behaviour and period of insects. The fitness costs linked to insecticide resistance in natural enemies typically do not follow the same pattern as in insect pests. Different natural enemy species may experience distinct effects from adaptive resistance.
This study concluded that C. carnea has the potential to develop bifenthrin resistance, ensuring its effectiveness and survival in rigorous insecticidal spray programmes, and performing well in agroecosystems. While resistance in the Bifen-Sel strain was stable, this strain could rapidly develop resistance with repeated field application doses of bifenthrin. Bifenthrin-resistant C. carnea was an effective natural biocontrol agent that successfully completed its biological parameters under laboratory conditions and had statistically similar larval duration, TPOP, female ratio, and fecundity compared to the Unsel strain as measured by using an age-stage two-sex life table. While the Bifen-Sel strain had no fitness advantage compared to the Unsel strain, it could survive insecticide exposure under field conditions due to its genetic background. Thus, employing insecticide-resistant natural predators offers a unique approach to boost their utility in combination with insecticides in the field. Some limitations of this study need to be addressed, as the findings are based on laboratory environment and fitness parameters only, and results may differ under semi-field or field conditions, where prey dynamics, ecological interactions, and environmental variability act simultaneously. Further studies are needed to evaluate the efficacy of a Bifen-Sel-resistant strain of C. carnea at the field level.
Acknowledgements
The authors express their sincere gratitude to Prof. (Rtd.) Dr. Gerald Wilde from Kansas State University, USA, for providing a thorough review of the manuscript and enhancing its English language proficiency.
Author contributions
I.K. and O.K. performed the experiment, statistical analysis, and writing – original draft. S.A.S. supervised the experiments, reviewed, and edited the manuscript.
Financial support
No funds, grants, or other support were received.
Competing interests
The authors have no relevant financial or non-financial interests to disclose.
Ethical approval and consent to participate
This research does not contain any studies with human participants.
Data availability statement
The datasets used and/or analysed during the current study are available from the corresponding author upon request.
Consent for publication
Not applicable.

 Open access

