


Impact statements
The results presented in this article demonstrate the ability of image classification techniques can be successfully used to accurately identify instances of debris blocking. The research is based on analysis of 1089 real-world CCTV images from a single location in the City of Cardiff (United Kingdom), manually labelled as ‘low risk’, ‘high risk’ or ‘unknown risk’. The results show that a relatively simple logistic regression model was able to correctly identify image labels with an accuracy of approximately 78%, comparable to the performance of more advanced machine learning models. The practical application of these results includes the potential for developing an autonomous real-time debris monitoring system that can issue warnings to operators and maintenance crews without the need for an intermediate human operator.
Introduction
Urban flooding is a costly problem across the world and is widely expected to become even more critical because of the twin pressures of climate change and the growth of urban and peri-urban areas. Engineered structures such as culverts are an essential part of the urban water system and maintaining their continued operation is key to managing local flood risk. Often, a trash screen is installed at the entrance of a culvert to prevent debris from damaging the culvert and causing internal blocking. However, debris blocking of culverts and trash screens is a common cause of local flooding, as discussed by, for example, Rigby et al. (Reference Rigby, Boyd, Roso, Silveri, Davis, Strecker and Huber2002), Blanc et al. (Reference Blanc, Wallerstein, Arthur and Wright2014), Agonafir et al. (Reference Agonafir, Lakhankar, Khanbilvardi, Krakauer, Radell and Devineni2023), Miranzadeh et al. (Reference Miranzadeh, Keshavarzi and Hamidifar2023) and Fallowfield and Motta (Reference Fallowfield and Motta2024). Research aimed at mitigating the problems of debris blocking has traditionally focused on the physical design of the trash screens (e.g. Blanc et al. Reference Blanc, Wallerstein, Arthur and Wright2014; Zayed et al. Reference Zayed, El Molla and Sallah2020). However, in practice, owners and operators of culverts and trash screens undertake labour intensive and time-consuming manual inspections of trash screens to detect and remove accumulated debris. Attempts to make this process more efficient have been made by installing closed-circuit television (CCTV) systems to allow remote monitoring of critical structures. This approach has been recommended as best practice by Benn et al. (Reference Benn, Kitchen, Kirby, Fosbeary, Faulkner, Latham and Hemsworth2019), but there are tens of thousands of culverts in the United Kingdom alone, and many have not yet been equipped with CCTV. Also, these recommendations still require manual inspection of the CCTV images and thus rely on timely inspection to function as effective real-time warning systems.
Image analysis of CCTV images has previously been used to detect defects in sewer pipes (Halfawy and Hengmeechai Reference Halfawy and Hengmeechai2015; Zhang et al. Reference Zhang, Liu, Zhang, Xi and Wang2023 and many more). In contrast, the scientific literature on the use of machine learning and computer vision for real-time classification of CCTV images of trash screens is relatively sparse, suggesting this technology is still in its infancy. Iqbal et al. (Reference Iqbal, Bin Riaz, Barthelemy and Perez2022) demonstrated the potential use of image analysis for detecting blocking by applying four deep-learning models to 352 images obtained from flume experiments. The study tested k-nearest neighbour (k-NN), artificial neural networks (ANNs), support vector regressor (SVR) and one-dimensional convolutional neural network (1D CNN) and reported the ANN as the best-performing model. The authors also highlighted the lack of real-world images showing impacts of actual flood events. Subsequently, Iqbal et al. (Reference Iqbal, Bin Riaz, Barthelemy and Perez2023) analysed a dataset of 447 real-world images of circular culvert openings located in Wollongong City, Australia using a Mask R-CNN model. The dataset contained images of culverts in different states of blocking, illumination, image resolution, etc. Each image was labelled according to the fraction of the culvert opening covered by debris (0–10%, 10–50%, 50–75%, >75%). Using the NASNet convolutional neural network (CNN) model (Zoph et al. Reference Zoph, Vasudevan, Shlens and Le2018), the authors reported a test accuracy of about 81% and a 14% type-II error (high rates of blocking misrepresented as low rates). Vandaele et al. (Reference Vandaele, Dance and Ojha2023) discussed application of machine learning to image analysis for block detection. They trained a CNN on 40,000 labelled images (clean, blocked, other) from 46 different trash screens located across the Southwest of England. They reported a prediction accuracy of 87%, highlighting that their approach outperformed the method proposed by Streftaris et al. (Reference Streftaris, Wallerstein, Gibson and Arthur2013), which achieved an accuracy of 74%.
The literature has shown that while the use of different image classification methods has shown promise for use in block detection, little or nothing is currently known about the reliability of these predictions, and in particular on the sensitivity to data-specific circumstances such as sample size and model complexity. The reliability and robustness of different models under real-world conditions, in particular sample size and data quality, are essential to ensure trustworthy operational models assisting decision makers. In response to this knowledge gap, this study uses a case-study trash screen in Cardiff, UK to investigate the operational uncertainty of different models to the training data used to train them.
Case study and datasets
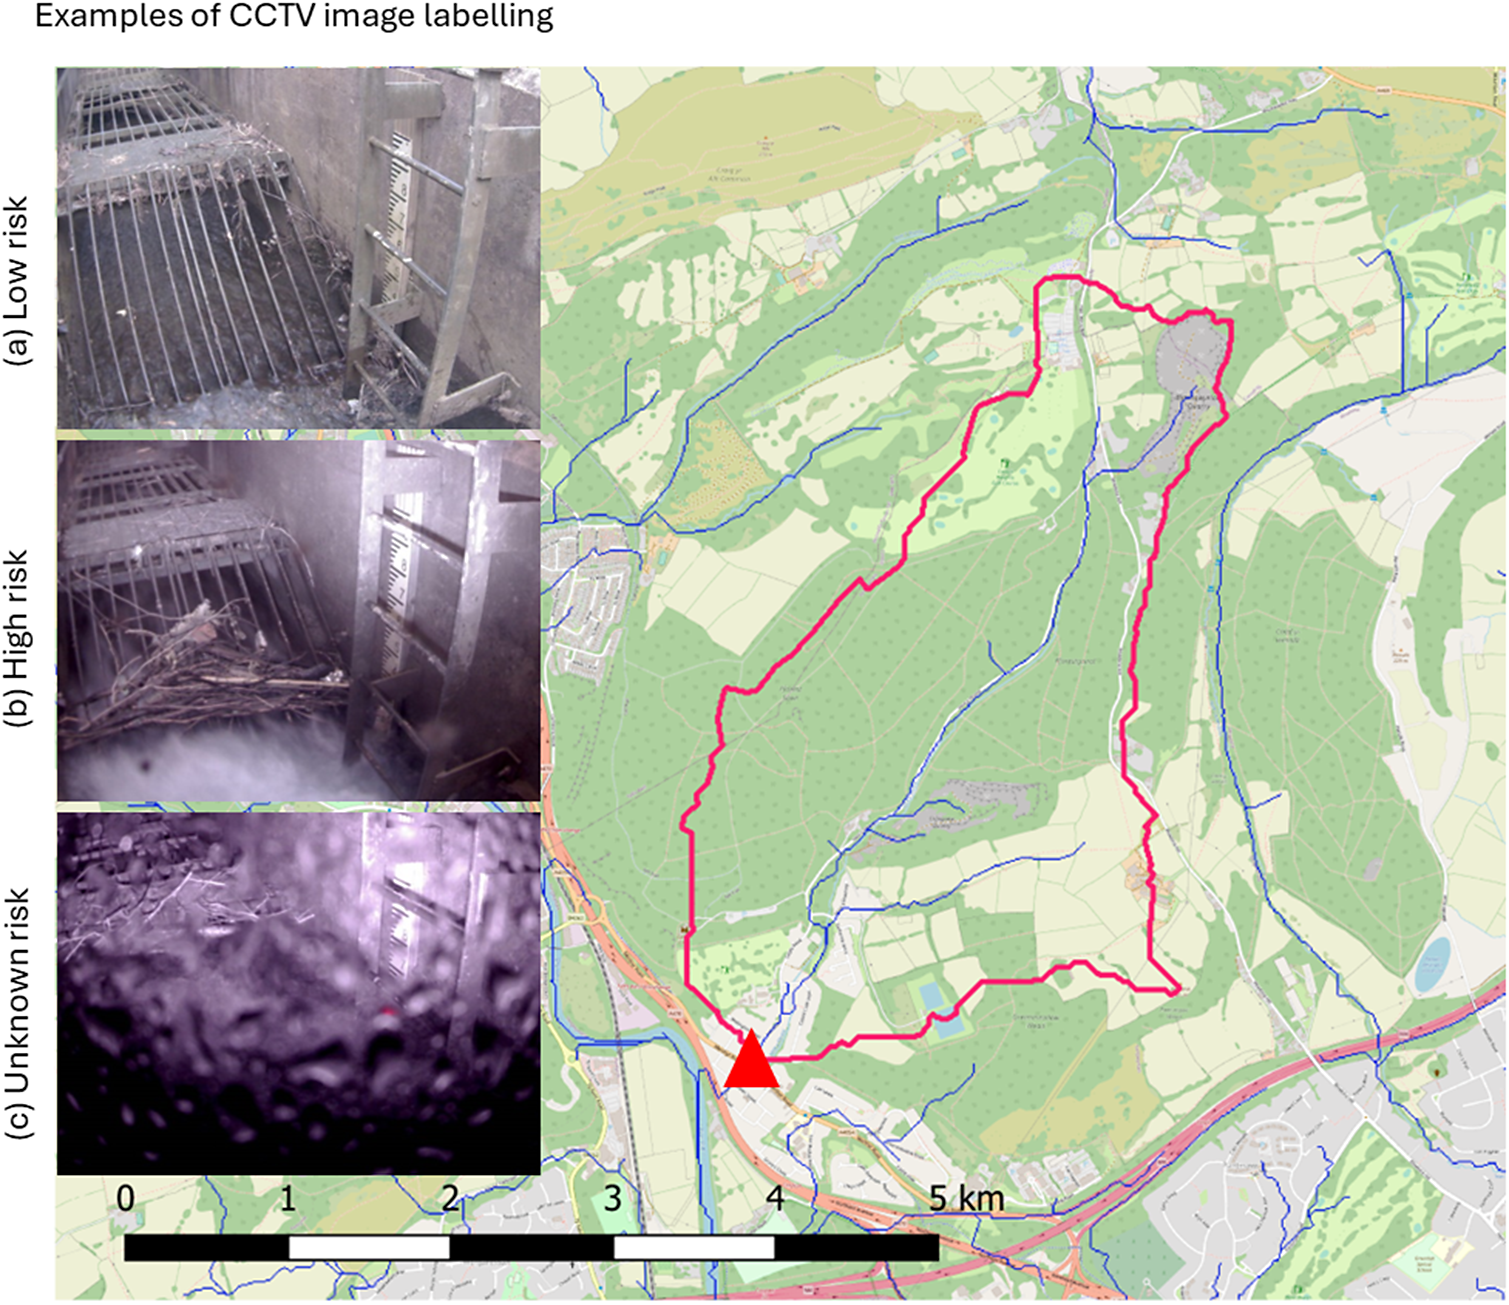
This study focuses on images obtained from a CCTV installation in the City of Cardiff in Wales that monitors a trash screen located on the Nant Y Forest watercourse in Tongwynlais (a northern suburb of Cardiff, see Figure 1). The CCTV camera was installed by Cardiff City in 2020 to monitor debris accumulation on the trash screen to mitigate local flooding. The CCTV camera is triggered in three ways: automatically at a fixed time each day (8 am), when the recorded water level in the stream exceeds a pre-defined threshold and manually by the system operators. Due to this variability in triggering an image capture, the dataset contains images at varying levels of daylight and with varying seasonal effects.
Catchment of the Nant Y Forest watercourse (red polyline) and the location of the CCTV installation in Tongwynlais (red triangle). Examples image classification labels of (a) low risk, (b) high risk and (c) unknown risk.

The sample dataset is formed using 1095 CCTV images from the Tongwynlais trash screen obtained over the period of June 2020 to November 2023. Images that were deemed to have quality issues (such as a dirty camera lens) or an indication of movement were retained in the dataset. However, images that are either corrupted or contained no image were removed from the dataset prior to analysis, leaving a total of 1089 images. Each image in the dataset has been manually labelled as one of three possible categories: low risk, high risk or unknown risk, of future blockage. The method follows the labelling procedure developed by Smith et al. (Reference Smith, Barnes, Wang, Dooley, Rowlatt and Kjeldsen2025), which involved cross-checking of labelling subsets with operational staff from Cardiff City flood management team. In general, images where substantial debris is visible are classified as ‘high-risk’, while images with little or no debris are classified as ‘low-risk’. For images where the status could not be inferred from a visual assessment (e.g. due to the scree being submerged) an ‘unknown-risk’ classification was assigned. In total, the dataset contains 594 images labelled as high risk (55%), 265 images labelled as low risk (24%) and 230 images labelled as unknown risk (21%). Examples of images classified as low risk, high risk or unknown risk are shown in Figure 1.
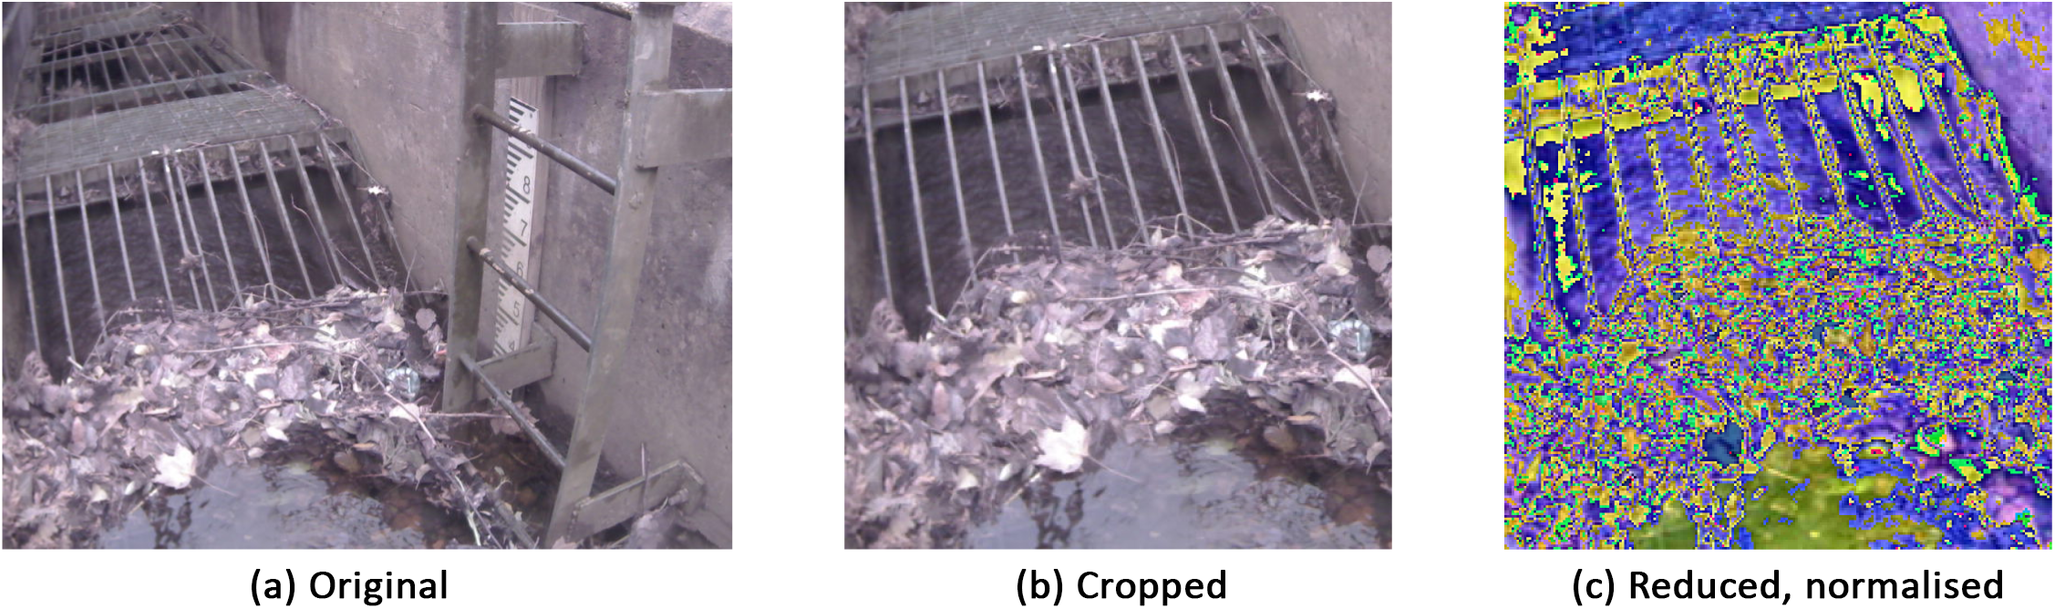
The sample dataset used in this study is composed of 1089 images, where each image has a resolution of 800 × 600 pixels in the red–green–blue (RGB) 8-bit depth format. For computational reasons, the datasets are pre-processed using the Python Pillow library by following the procedure used by the pre-trained models: each image is cropped to the front of the trash screen (the area which is most likely to contain the primary blockage), resulting in a resolution of 475 × 475 pixels. The cropping was defined manually for this one screen and applied automatically to all images, as no movement or otherwise interference with the camera position was detected in the dataset. Interpolating neighbouring pixels, the images are further reduced in size to 224 × 224 pixels and each pixel is normalised to the range [−1,1] using the mean and standard deviation of the pixel intensities for each RGB channel provided by the pre-trained models. Figure 2 illustrates the pre-processing of a sample image. The reduction in pixel resolution was introduced to allow more efficient computational experiments while maintaining the important image features. Despite the dataset being limited to 1095 images, the process of fine-tuning the pre-trained models only requires a limited number of samples as is evidenced by Yang et al. (Reference Yang, Wang and Zhu2022).
Demonstration of the (b) cropping and (c) reduction and normalisation of an (a) original image.

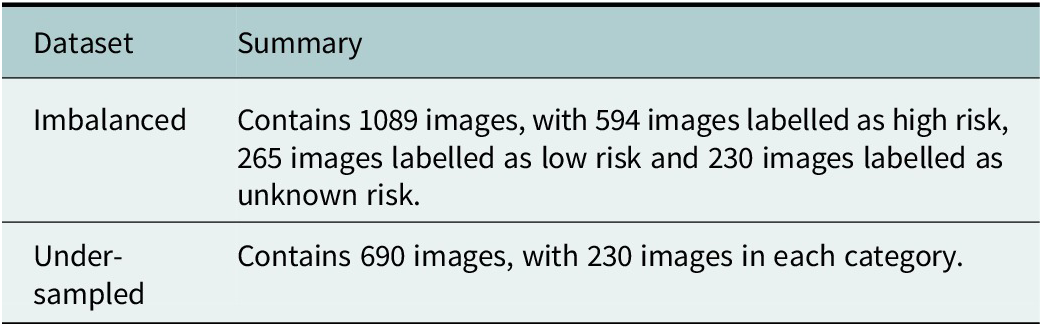
The sample dataset used in this study is imbalanced, with the number of images classified as high risk of future blockage (594 images) being greater than twice the number of images classified as either low (265 images) or unknown risk (230 images) of future blockage, and such an imbalance is known to impact the performance of machine learning models (Khalifa et al. Reference Khalifa, Loey and Mirjalili2022). To provide a thorough investigation of the operational uncertainty of the models, two variations on this dataset will be used to train the models: imbalanced dataset and under-sampled dataset (as used in Smith et al., Reference Smith, Barnes, Wang, Dooley, Rowlatt and Kjeldsen2025). The imbalanced variation of the dataset is as described earlier and summarised in Table 1, the classes remain imbalanced with a higher number of high-risk images compared to the low-risk category. To construct the under-sampled dataset, we identify the classification label from the imbalanced dataset that contains the lowest number of images (here, the unknown risk category containing 230 images). Then, we randomly sample, using uniform random numbers, images from the imbalanced dataset with classification labels from the remaining categories (here, the low-risk and high-risk categories) until each classification label has the same number of images. Note that the uniform random sampling was conducted without replacement to ensure that the under-sampled dataset does not contain any repeated images.
Summary of imbalanced and under-sampled datasets

Method and machine learning models
Four different machine learning algorithms (as described next) are used to generate models using the imbalanced and under-sampled datasets separately. For each algorithm and dataset combination, 100 models are trained. Each model is trained using 80% and tested using 20% of the dataset randomly sampled such that each model is trained with a different training and testing sample of the images. This random sample and repeated simulation will reveal the variability and dependence of each algorithm on the training data.
Machine learning algorithms
The models considered in this study constitute a subset of the models identified in the literature review as well as popular image analysis methods not yet applied to debris detection. The models include: (1) a residual network model (ResNet50) (He et al. Reference He, Zhang, Ren and Sun2016); (2) two vision transformer models (ViT-B-16 and ViT-L-16) (Dosovitskiy et al. Reference Dosovitskiy, Beyer, Kolesnikov, Weissenborn, Zhai, Unterthiner, Dehghani, Minderer, Heigold, Gelly and Uszkoreit2021); (3) three multilayer perceptron models composed of input and output layers, as well as zero (MLP-0), five (MLP-5) and ten (MLP-10) hidden layers, where each hidden layer is assumed to have 100 neurons and, finally, (4) a logistic regression model (LogReg).
Multilayer perceptron (MLP) models are classical deep neural networks, with an input and output layer connected by multiple hidden layers of differing number of neurons in each layer. Moving from one layer to another is performed by a non-linear activation function. In this study, three MLP models were considered: MLP-0, MLP-5 and MLP-10, with 0, 5 and 10 hidden layers of 100 neurons respectively. The activation function is the rectified linear unit (ReLU). He et al. (Reference He, Zhang, Ren and Sun2016) introduced the concept of deep residual networks to overcome the difficulties associated with training a classical deep network (such as the MLP model). By constructing residual functions that are relative to layer inputs, their framework demonstrated superior performance in classification tasks when compared to classical deep networks. In this study, we consider the ResNet50 model (He et al. Reference He, Zhang, Ren and Sun2016) available in PyTorch (Paszke et al. Reference Paszke, Gross, Massa, Lerer, Bradbury, Chanan, Killeen, Lin, Gimelshein, Antiga and Desmaison2019). The model has been pre-trained on the ImageNet database and applied with full transfer learning. This model is chosen due to its popularity in image classification tasks. Vaswani et al. (Reference Vaswani, Shazeer, Parmar, Uszkoreit, Jones, Gomez, Kaiser and Polosukhin2017) introduced the concept of the transformer for natural language processing tasks. Transformers are based on attention mechanisms, which indicate the importance of a feature (such as a word in a sentence) and are related to convolutional layers (Cordonnier et al. Reference Cordonnier, Loukas and Jaggi2020). Ramachandran et al. (Reference Ramachandran, Parmar, Vaswani, Bello, Levskaya and Shlens2019) demonstrated state-of-the-art performance on image-related tasks when attention-based mechanisms entirely replaced convolutional layers in a neural network. Following this, Dosovitskiy et al. (Reference Dosovitskiy, Beyer, Kolesnikov, Weissenborn, Zhai, Unterthiner, Dehghani, Minderer, Heigold, Gelly and Uszkoreit2021) demonstrated that learning transfer of pre-trained vision transformer (ViT) models can obtain state-of-the-art performance when applied to a relatively small dataset, such as considered in this study. In this article, we utilise two vision transformer models: the base model (ViT-B-16) and the large model (ViT-L-16) (Dosovitskiy et al. Reference Dosovitskiy, Beyer, Kolesnikov, Weissenborn, Zhai, Unterthiner, Dehghani, Minderer, Heigold, Gelly and Uszkoreit2021), which have been pre-trained on the ImageNet database and applied with full transfer learning. These models have been chosen due to their potential to outperform convolutional neural networks.
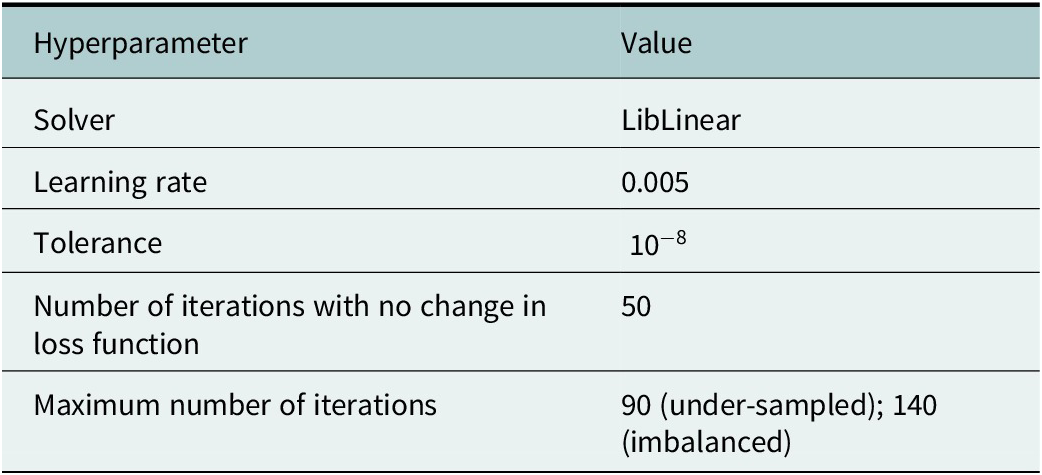
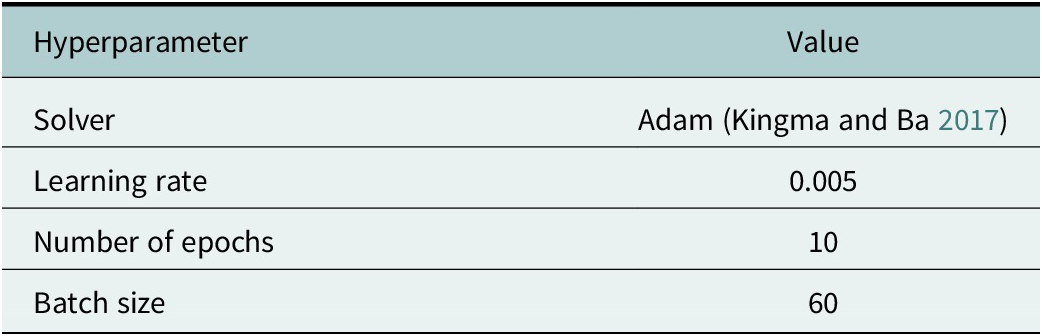
The ResNet, ViT and MLP models are implemented using PyTorch with the CUDA backend (Paszke et al. Reference Paszke, Gross, Massa, Lerer, Bradbury, Chanan, Killeen, Lin, Gimelshein, Antiga and Desmaison2019), while the LogReg model is implemented using SK-Learn (Pedregosa et al. Reference Pedregosa, Varoquaux, Gramfort, Michel, Thirion, Grisel, Blondel, Prettenhofer, Weiss, Dubourg, Vanderplas, Passos, Cournapeau, Brucher, Perrot and Duchesnay2011). The default hyperparameters for the PyTorch and SK-Learn implementations are given in the Appendix A (Tables A1 and A2) Note that for the models implemented in PyTorch, we use 10 epochs with a batch size of 60, which equates to 90 and 140 iterations for the under-sampled and imbalanced datasets respectively. For the LogReg model, we set the maximum number of iterations to be 90 or 140 depending on the dataset. In all cases, the loss function is the categorical cross entropy loss. Fine-tuning of large pre-trained models, such as ResNet50 and ViT, only requires a few epochs (5–10) as is evidenced by Touvron et al. (Reference Touvron, Cord, Douze, Massa, Sablayrolles and Jégou2021) and Wang et al. (Reference Wang, Huang, Song, Huang and Huang2021).
Evaluation
To assess the performance of each model applied to the available image datasets, three metrics are used: (1) balanced accuracy, (2) recall and (3) precision. Balanced accuracy can be interpreted as a weighted sum of the accuracy for each category (where the accuracy is the proportion of correctly identified images and category refers to our labelling of each image as low risk, high risk or unknown risk) and can avoid over-estimation of accuracy on imbalanced categories (e.g. Brodersen et al. Reference Brodersen, Ong, Stephan and Buhmann2010). For each classification, recall is defined as number of correctly identified images in a category divided by the total number of images in that category and measures the ability of the classifier to correctly identify all the samples of a category. Finally, for each classification, precision is defined as the number of correctly identified images in a category divided by the total number of predictions for that category and measures the ability of the classifier not to classify an image in the wrong category. All performance metrics are implemented using the SK-Learn environment (Pedregosa et al. Reference Pedregosa, Varoquaux, Gramfort, Michel, Thirion, Grisel, Blondel, Prettenhofer, Weiss, Dubourg, Vanderplas, Passos, Cournapeau, Brucher, Perrot and Duchesnay2011).
Results
In each of the experiments presented next, the random sample from either the imbalanced or under-sampled datasets is split into training and testing datasets, with a ratio of 80:20 (80% training, 20% testing). A total of 100 repeated simulations were conducted, where the training and testing datasets are re-generated for each simulation. Note that in all cases, the performance metrics are evaluated for the test dataset only. Furthermore, for the precision and recall scores only the high-risk category is presented as, from the perspective of risk aversion, this is the most important category for the models to predict accurately.
Classification accuracy
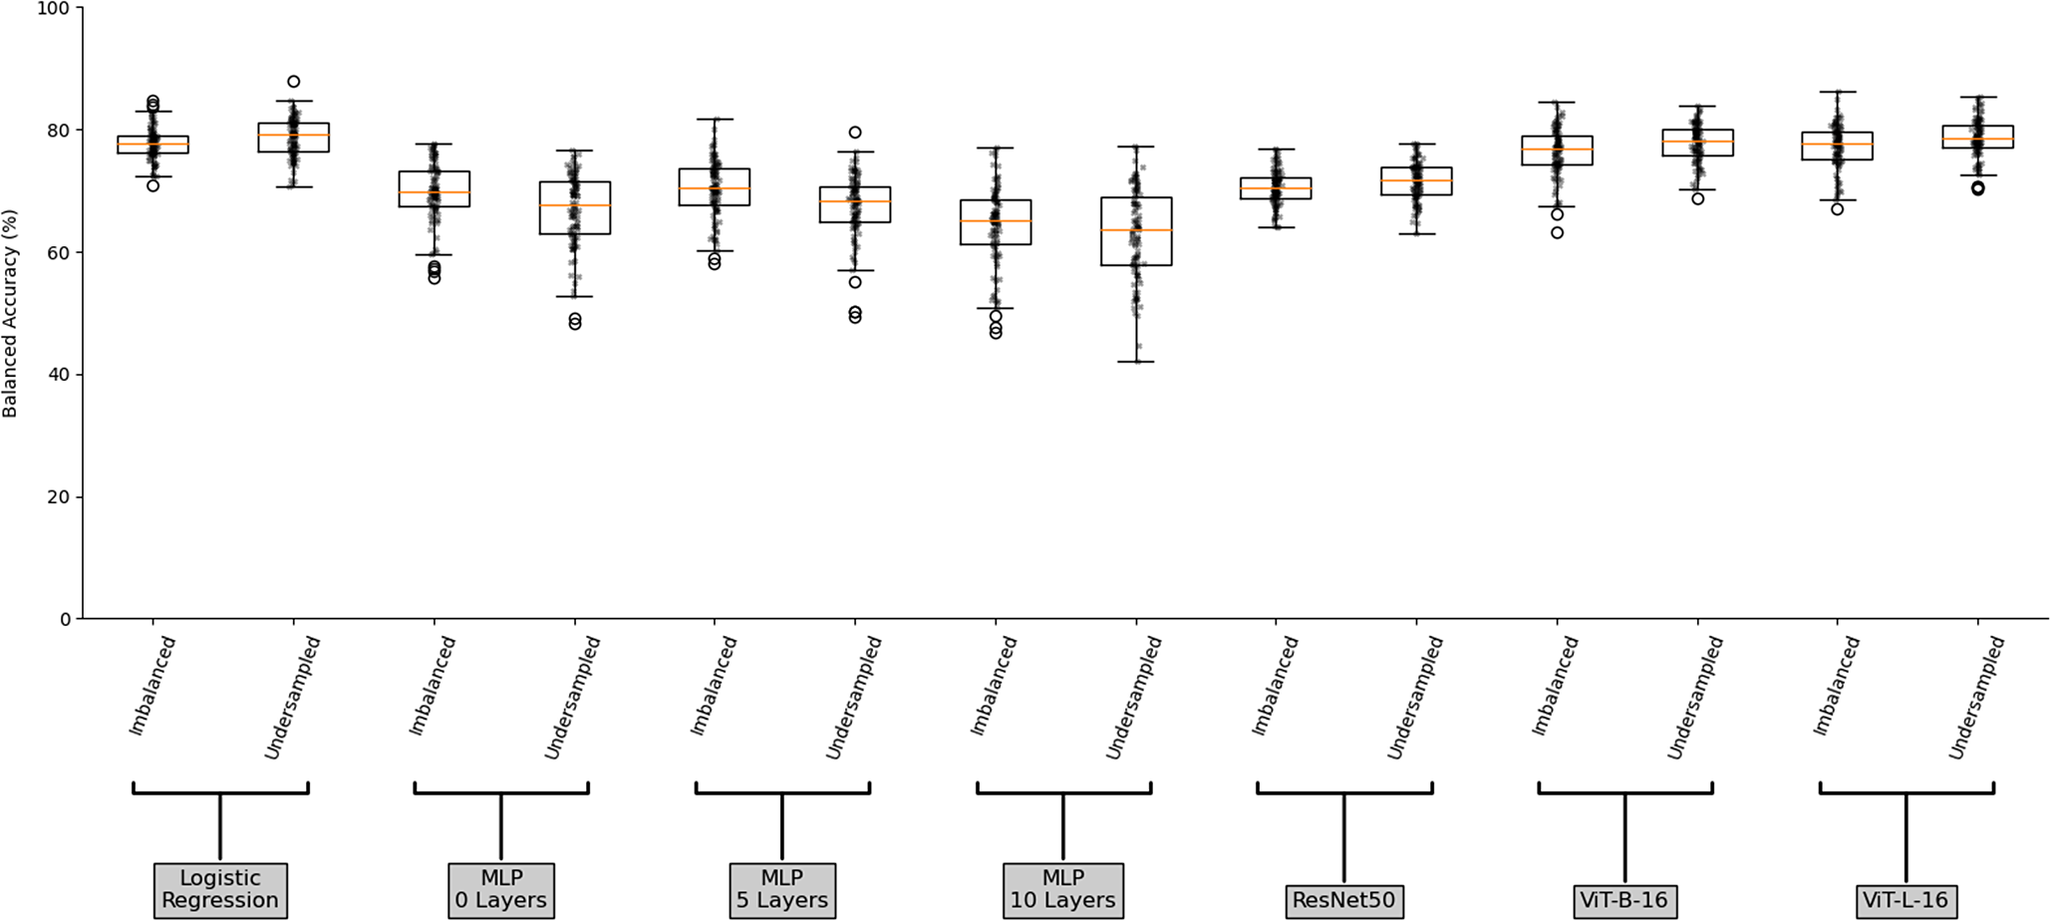
Figure 3 illustrates the accuracy scores for the imbalanced and under-sampled datasets, for each model. The multilayer perceptron (MLP) models overall perform the worst as their median scores across the 100 simulations are lower than the other models. Moreover, the MLP models display larger score ranges over the 100 simulations across both the imbalanced and under-sampled datasets than the other models. This is further exacerbated by increases in the number of layers due to an increasing number of model parameters being optimised from an initial random state, with the interquartile range (IQR) of the MLP models on the imbalanced dataset rising from 5.73 to 5.85 and finally to 7.36 for the MLP 0 layer, 5 layers and 10 layers respectively. By contrast, due to the fewer model parameters being optimised, the pre-trained models utilising transfer learning on the imbalanced dataset all display significantly smaller score ranges (with IQRs of 3.45, 4.73 and 4.51 for each of the ResNet50, ViT-B-16 and ViT-L-16 respectively), this low variability is also present in the logistic regression model which had an IQR of 2.88. The vision transformer models, ViT-B-16 and ViT-L-16, perform better than the ResNet50 model in both their maximum and minimum scores, as well as their median. Indeed, we observe a 77% and 78% median accuracy on the imbalanced dataset and 78% median accuracy on the under-sampled dataset for the vision transformer models, compared to 70% and 72% median accuracy for the ResNet50 model on the imbalanced and under-sampled datasets respectively. Surprisingly though, the LogReg model performs comparably to the more powerful vision transformer models, displaying a 78% and 79% median accuracy on the imbalanced and under-sampled datasets respectively. This may be the result of several (possibly compounding) reasons: first, non-optimal hyperparameters, such as the low number of epochs considered in these experiments or too large a learning rate which decreases the chance of converging; second, the subjective classification of the images in the dataset or finally, the pre-training having little effect on the classification.
Boxplot of balanced accuracy score for the imbalanced and under-sampled datasets for each model.

High-risk precision and recall
For the purposes of the identification of flood prevention, the detection and correct classification of high-risk blockages are seen as more important than the accidental classification of a low-risk image as high risk. In practical terms, missing a potential flood-causing blockage has more severe consequences than a low- to high-risk misclassification. This section explores the results through this lens and illustrates how a focus on high-risk classification can affect our understanding of what is happening.
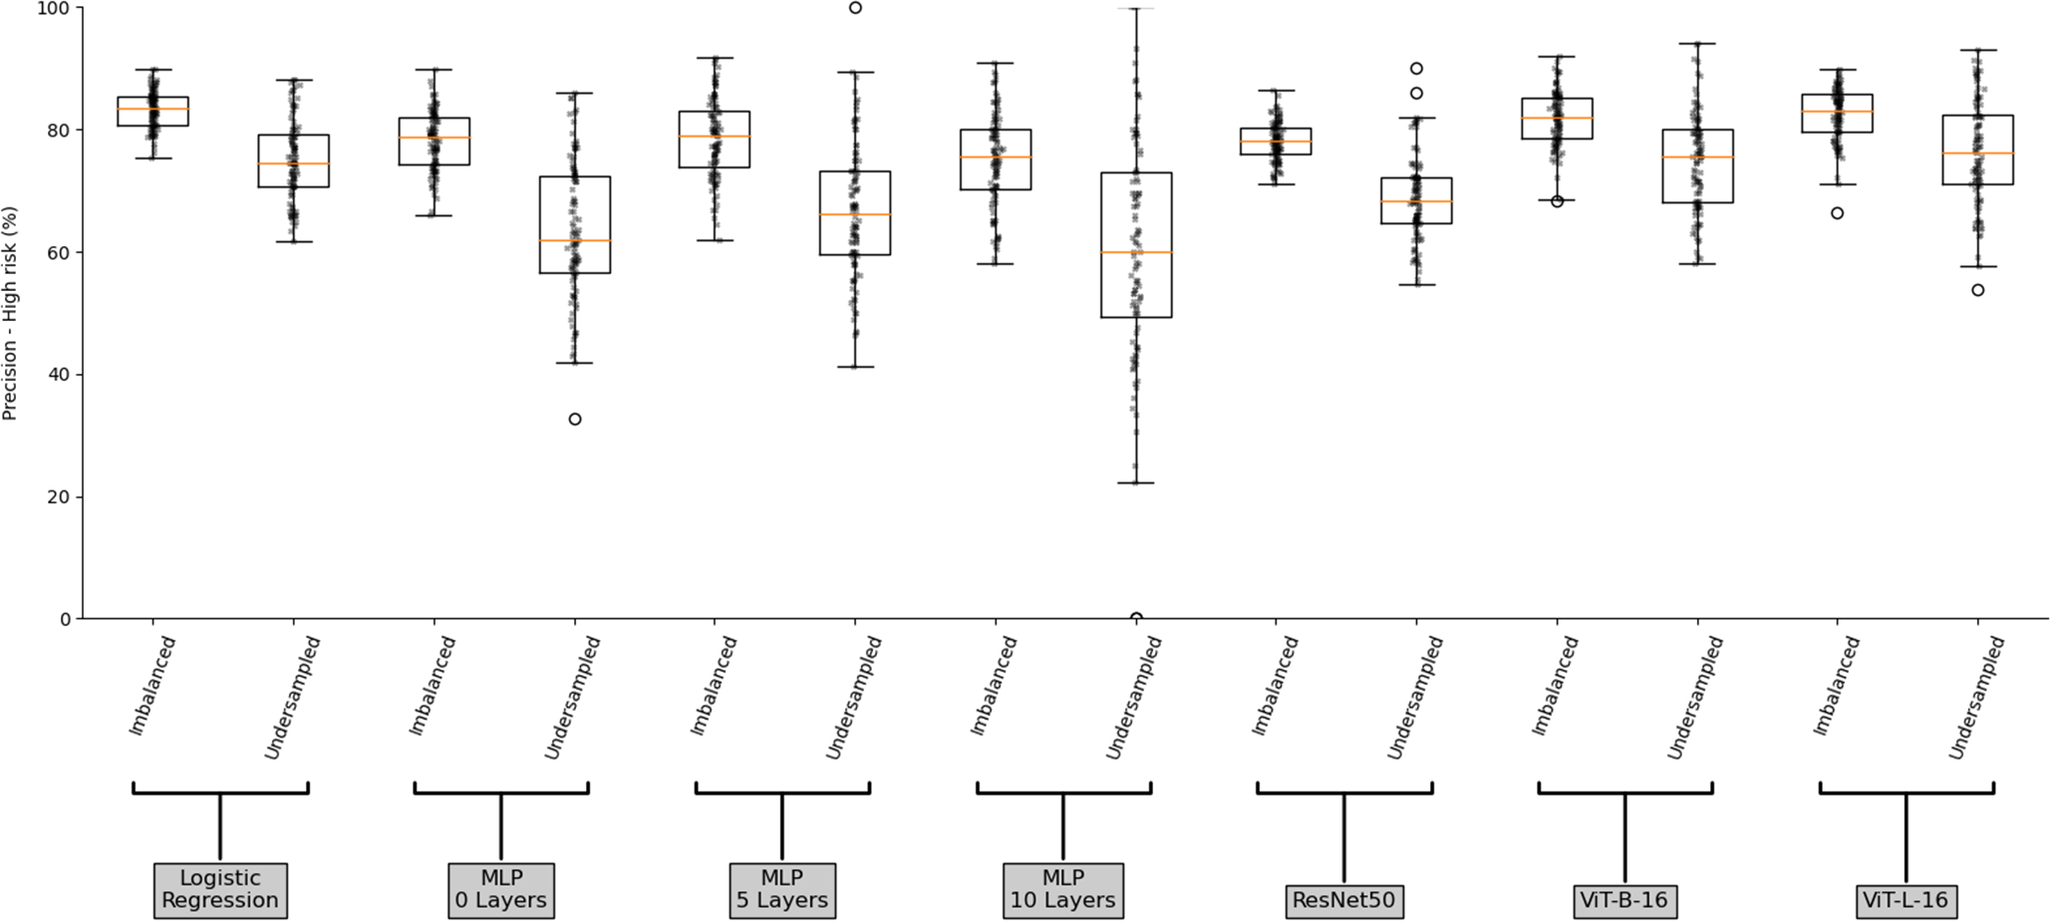
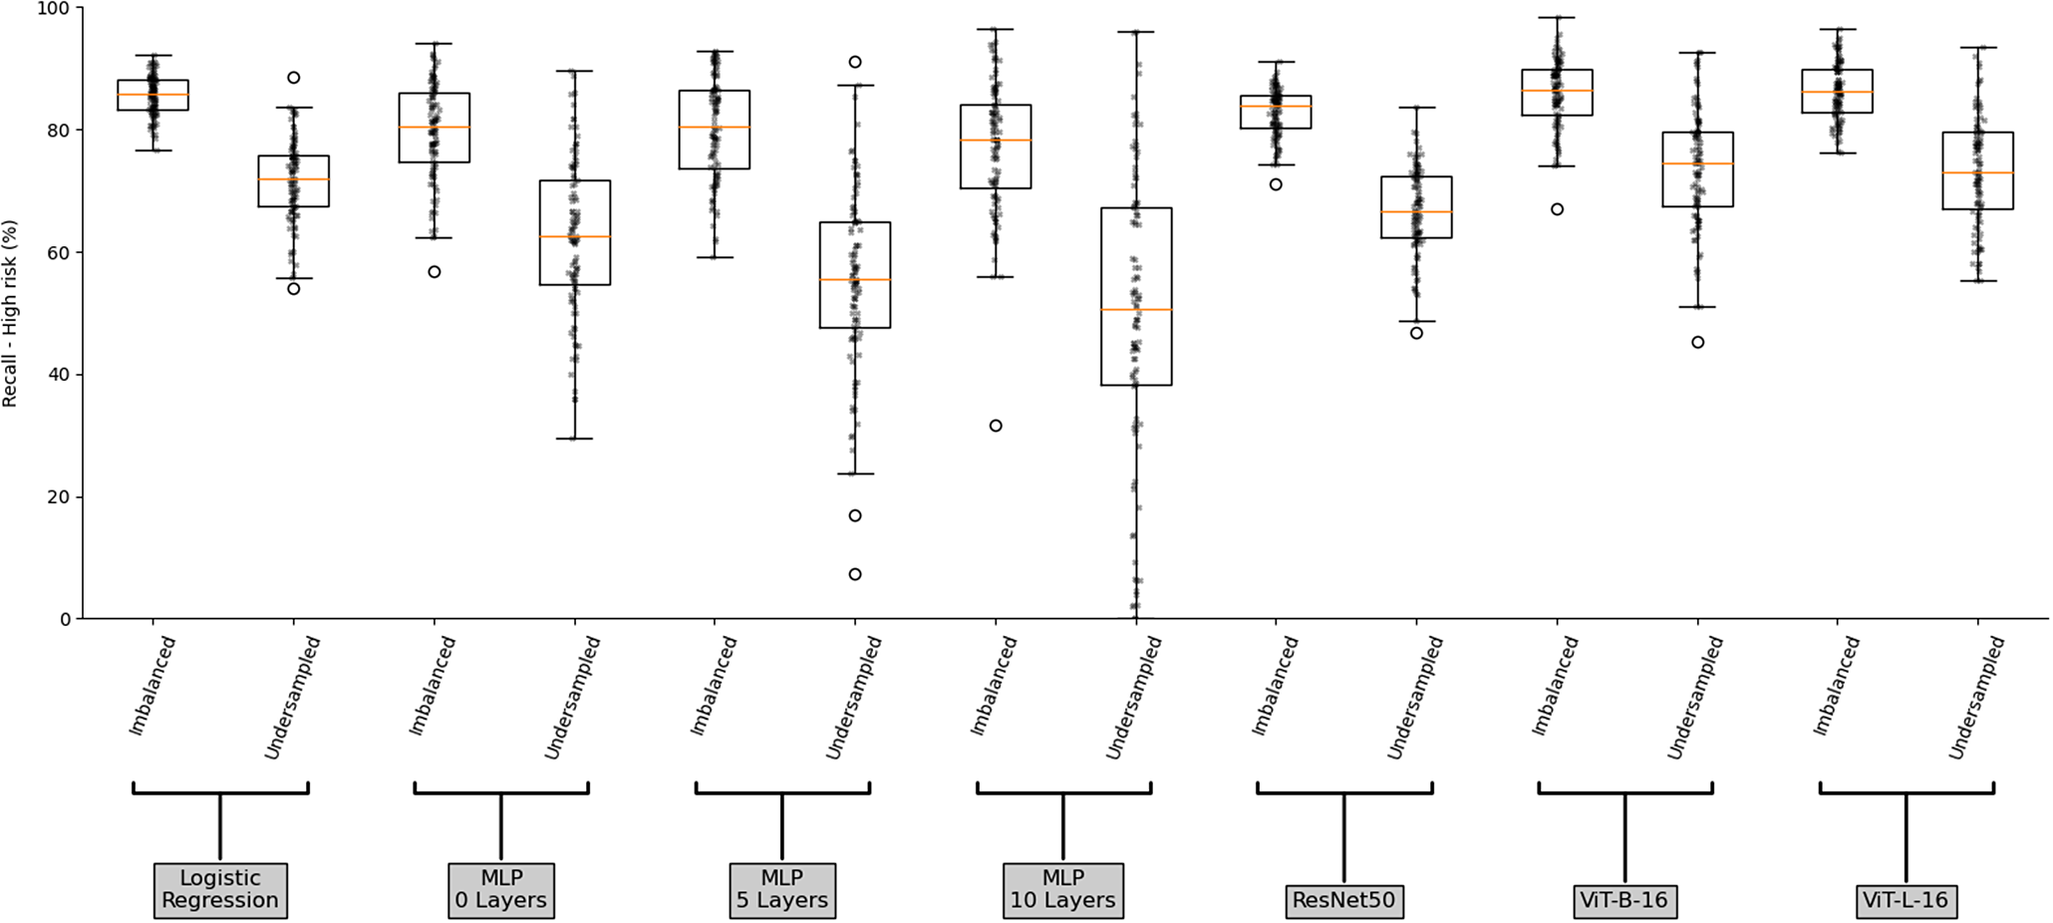
Figures 4 and 5 illustrate the precision and recall scores of the high-risk category for the imbalanced and under-sampled datasets, for each model used in this article. Comparing with Figure 3, it is immediately clear that Figures 4 and 5 demonstrate larger variability among the 100 simulations for each model used, where, for both precision and recall scores on the imbalanced dataset, the LogReg and ResNet50 models perform the best with IQRs of 4.79 and 4.9 and 4.36 and 5.35, respectively, and MLP 10 layer performing the worst with IQRs of 9.75 and 13.75 respectively. In all cases, the models have higher precision and recall scores for the imbalanced dataset than the under-sampled, with the minimum difference of the median precision and recall scores between the imbalanced and under-sampled datasets being 6% and 13% respectively. This is as expected as the imbalanced dataset contains a higher proportion of high-risk images (55%) than low (24%) and unknown (21%), when compared with the under-sampled dataset. Once again, the vision transformer models (ViT-B-16 and ViT-L-16) outperform the ResNet50 model with respect to their median precision and recall scores on the imbalanced dataset, obtaining 82% and 87% and 83% and 86%, respectively, compared to 78% and 84%. The LogReg model performs comparably obtaining 84% and 86% precision and recall scores, respectively, on the imbalanced dataset.
Boxplot of precision score of the high-risk category for the imbalanced and under-sampled datasets for each model.

Boxplot of recall score of the high-risk category for the imbalanced and under-sampled datasets for each model.

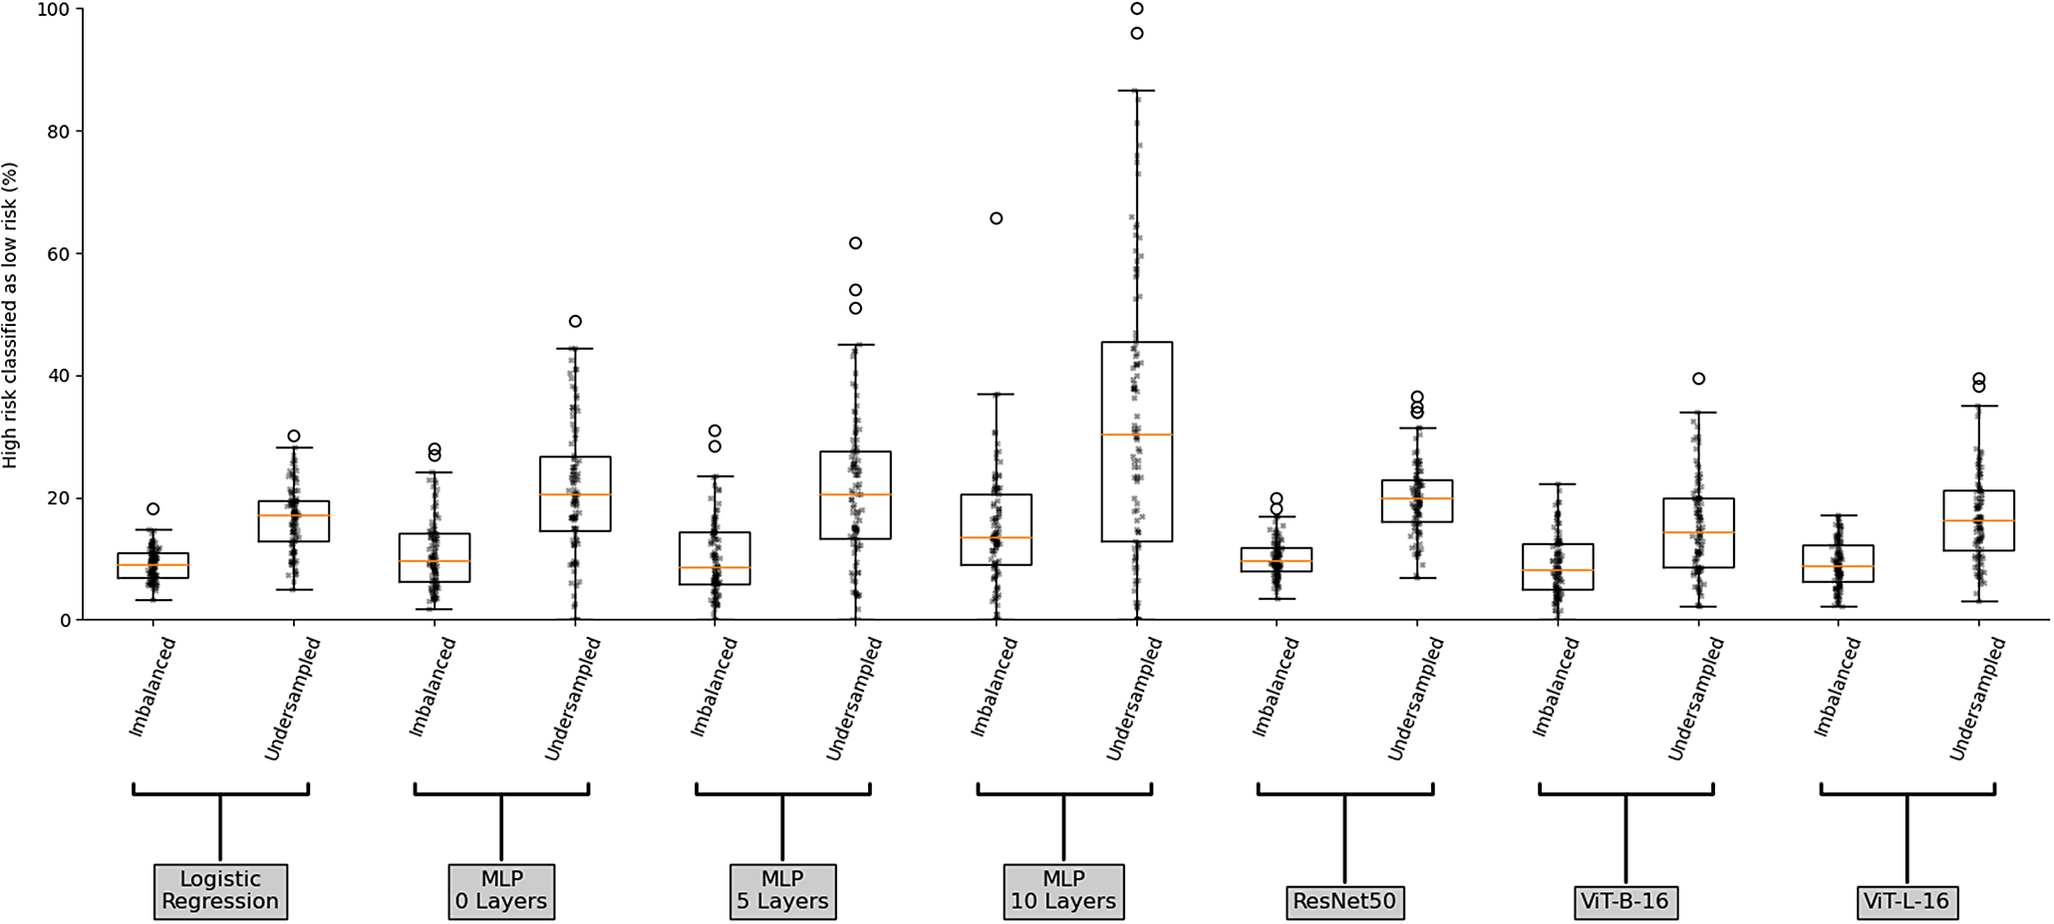
Through the lens of risk aversion, we take a more focused look at the worst-case scenario, where high-risk images are misclassified as low risk. Figure 6 illustrates the percentage of images labelled as high risk which have been misclassified as low risk, for each model over the 100 simulations on both datasets. Once again, the MLP models have the largest ranges. The LogReg and ResNet50 models show smaller IQRs for both the imbalanced (3.96 and 3.73 respectively) and under-sampled (6.80 and 6.98 respectively) datasets, while also producing similar medians (9.09 and 9.66 for the imbalanced dataset, respectively, and 17.07 and 19.80 for the under-sampled dataset respectively). The ViT-B-16 and ViT-L-16 models also show similarities, likely due to the similarity in their underlying structure and architecture, with larger IQRs for both the imbalanced (7.38 and 5.94 respectively) and under-sampled (11.30 and 9.91 respectively) datasets compared to LogReg and ResNet50 models. However, the ViT-B-16 and ViT-L-16 models show better median scores (8.27 and 8.91 for the imbalanced dataset, respectively, and 14.43 and 16.25 for the under-sampled dataset respectively) compared to the LogReg and ResNet50 models. Comparing the differences between the use of an imbalanced and under-sampled dataset reveals significant increases in variability when moving to the under-sampled dataset (with the largest increase being for the MLP with 10 layers, which increases by 21.02, and the smallest increase being in the LogReg model, which reveals a 2.84 increase), this indicates that the use of an imbalanced dataset provides a more stable result for high-risk classification.
Boxplot of the percentage of images labelled as high risk of future blockage that are classified as low risk for the imbalanced and under-sampled datasets for each model.

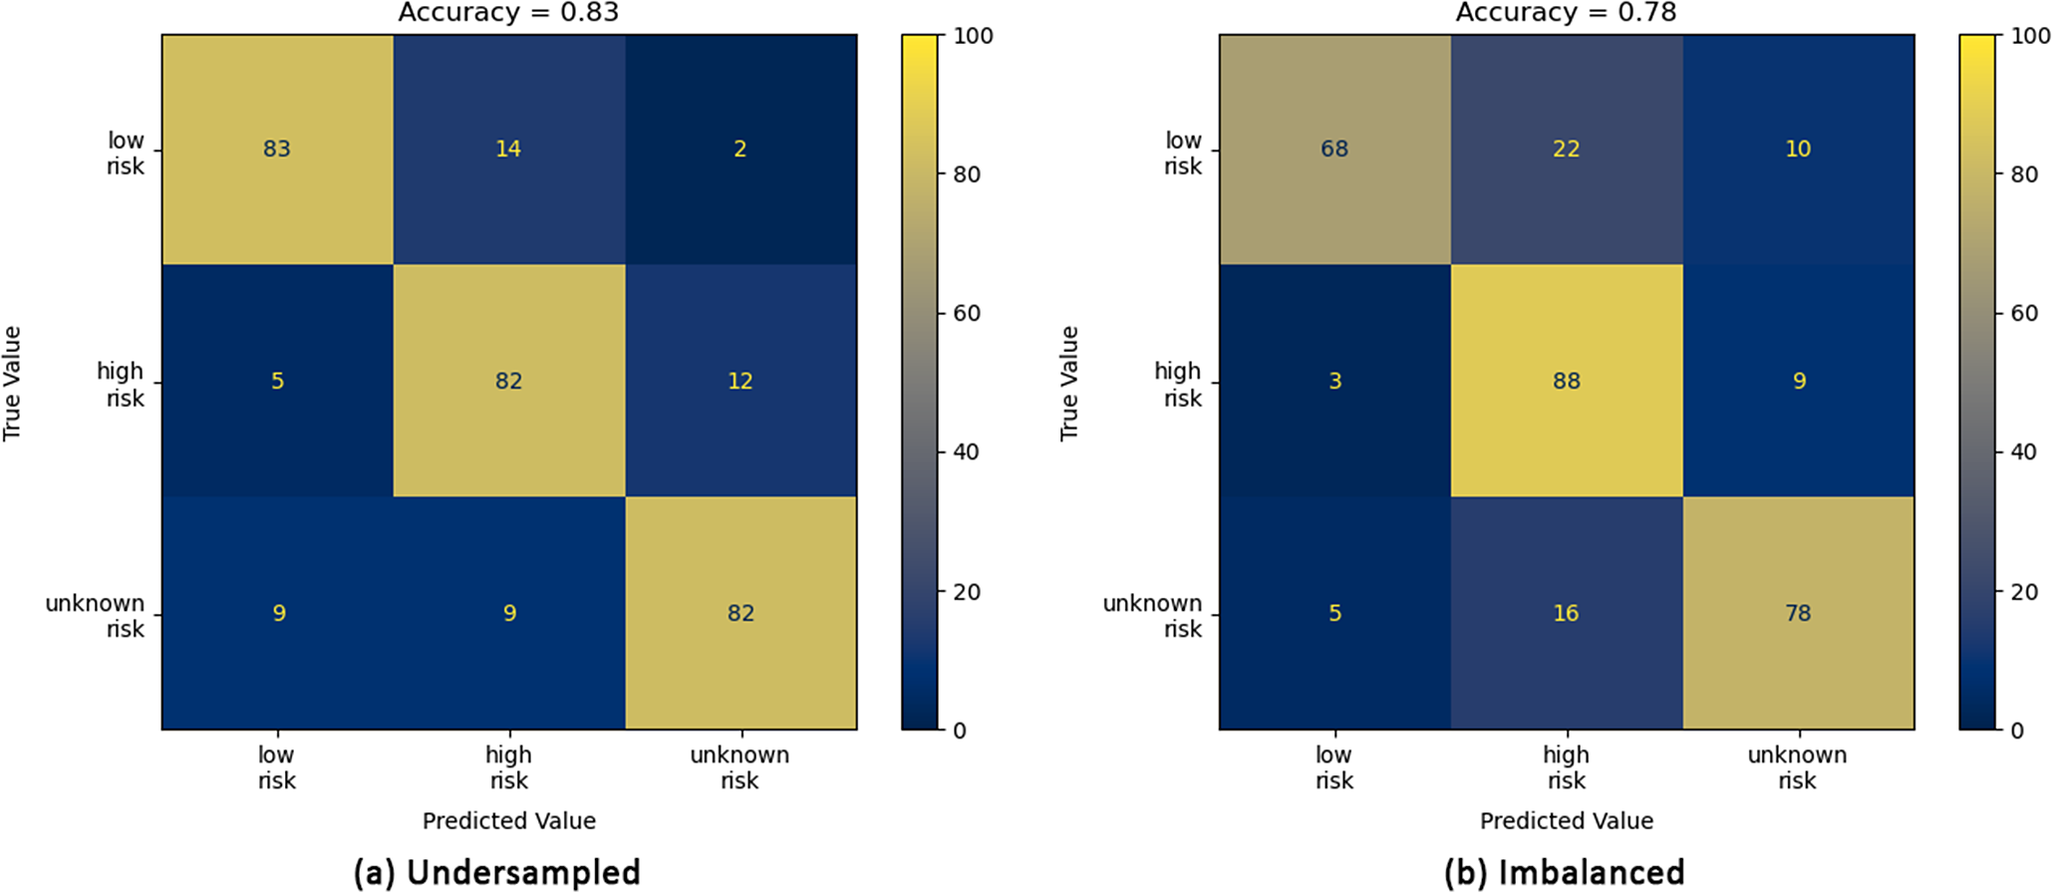
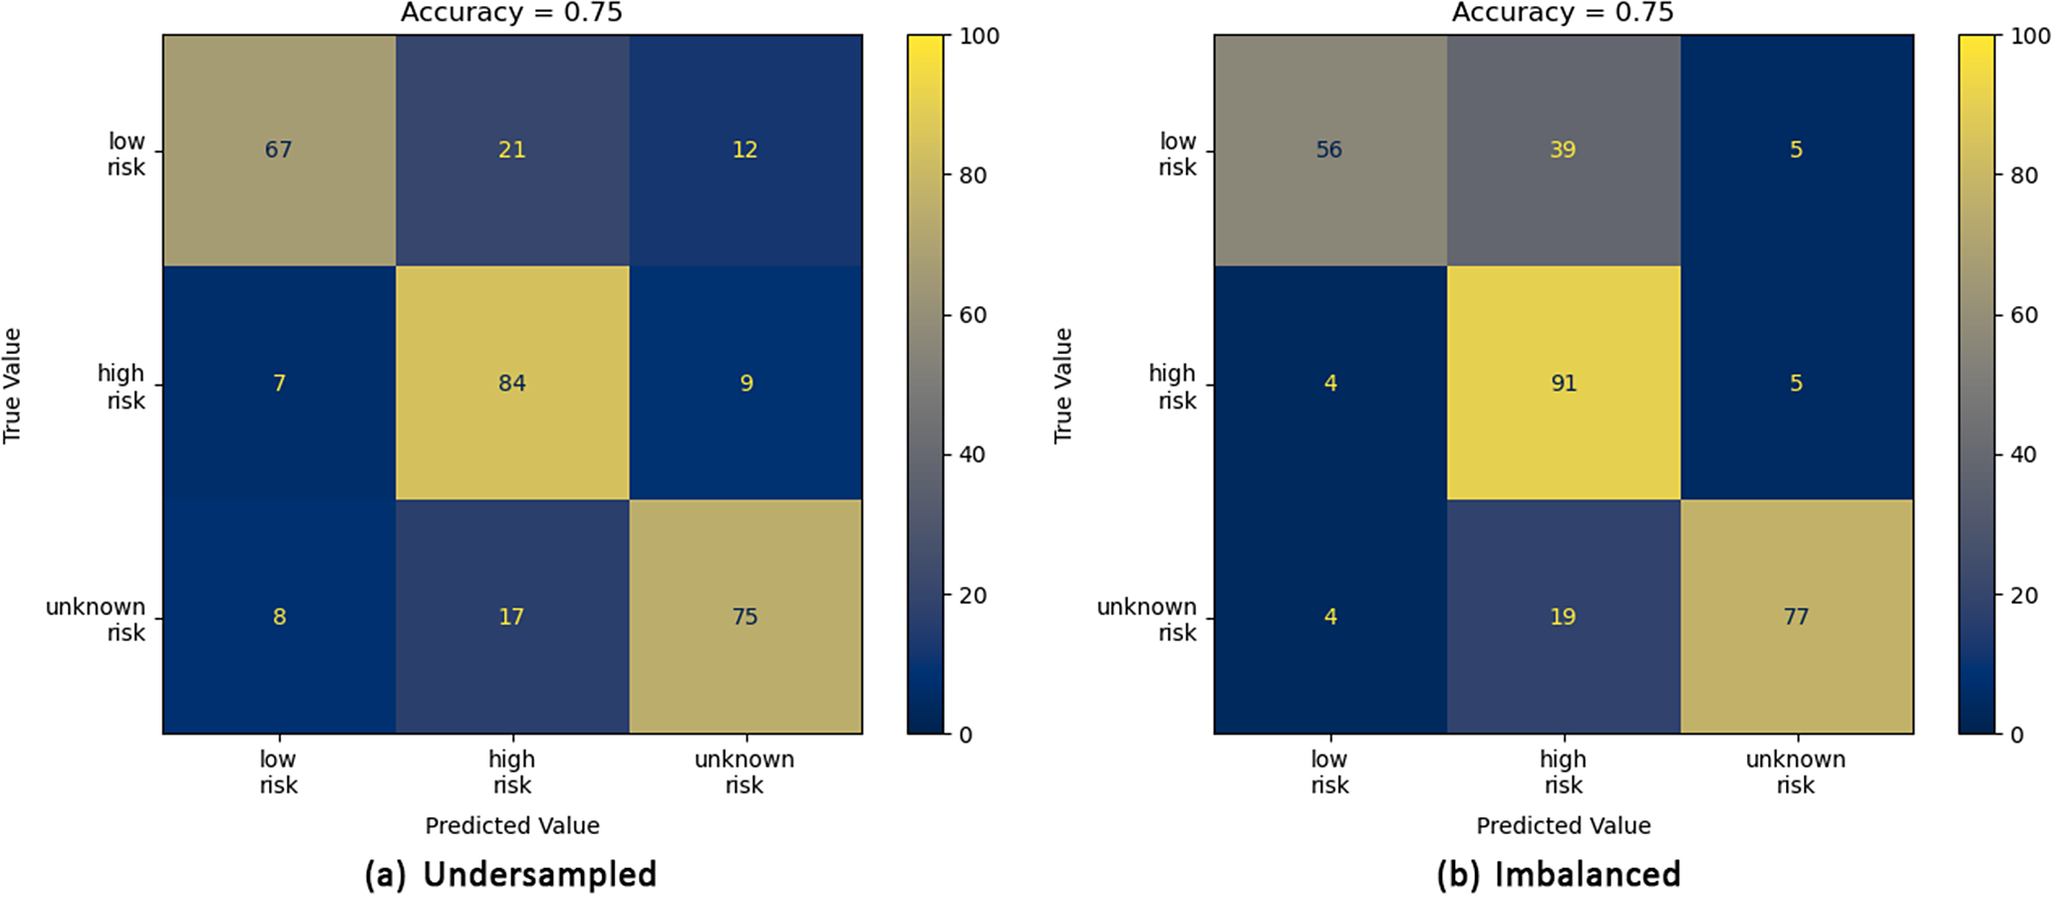
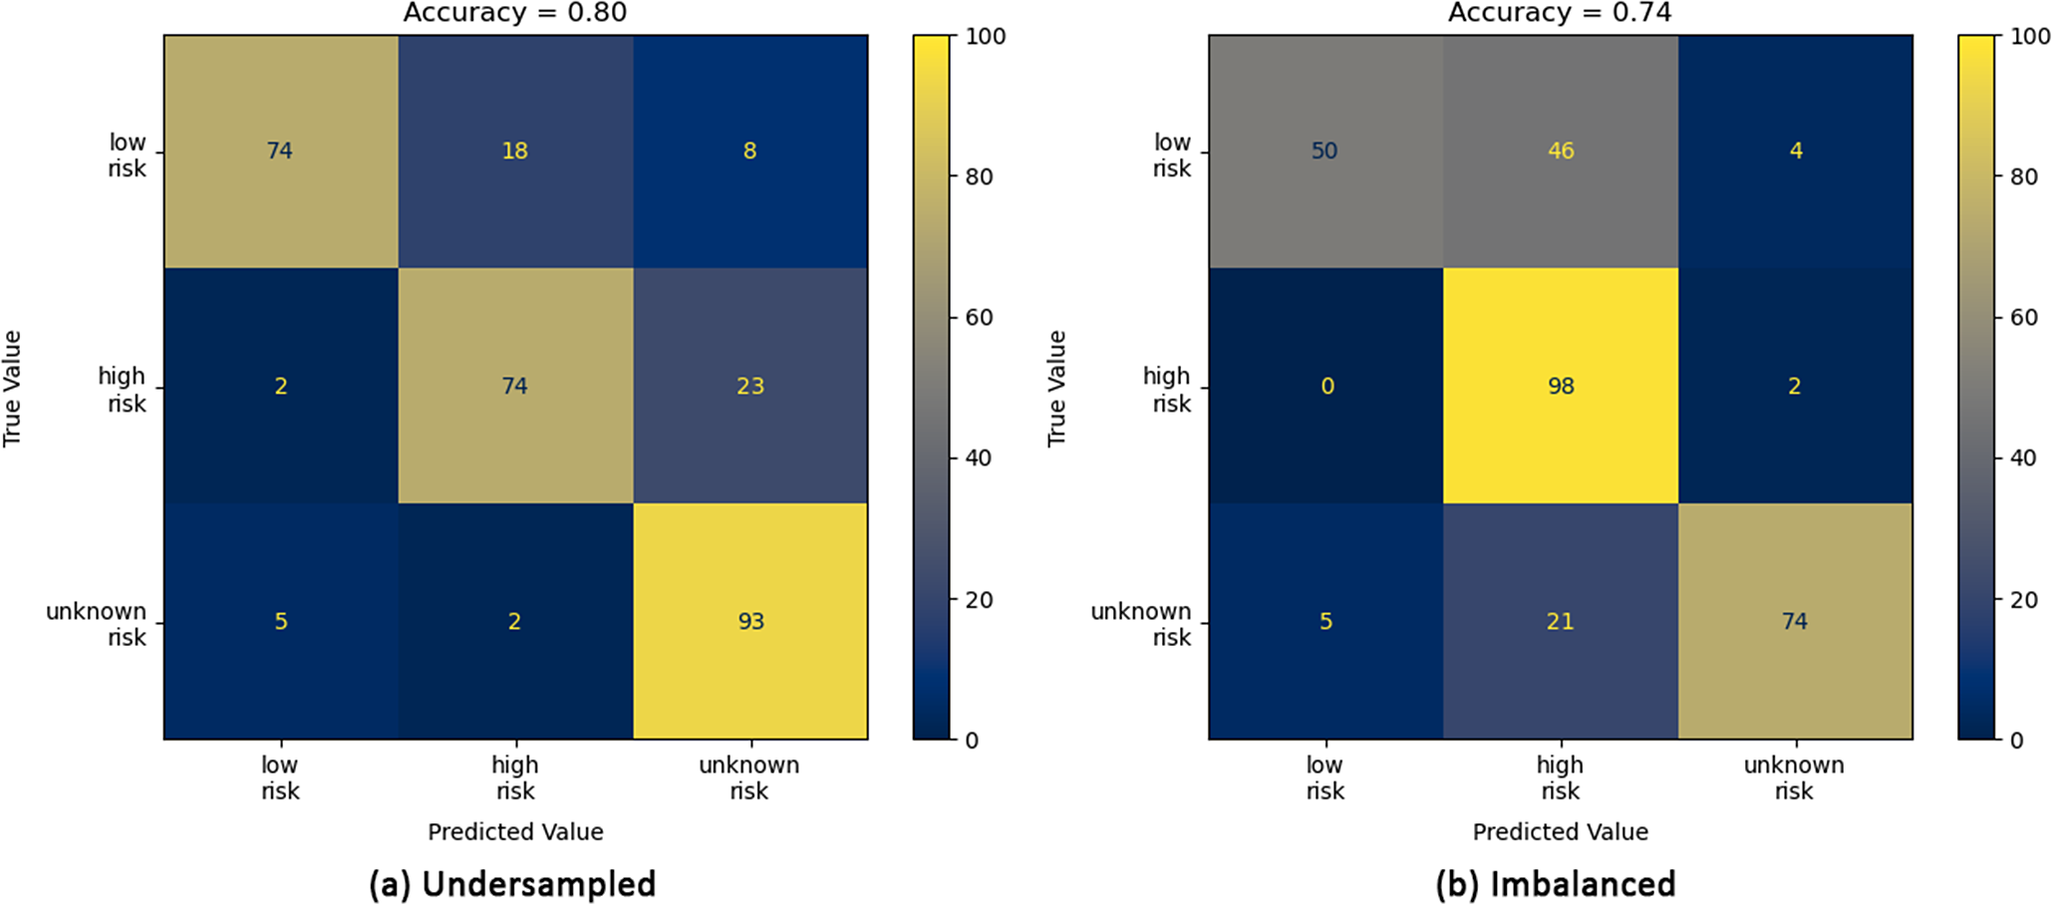
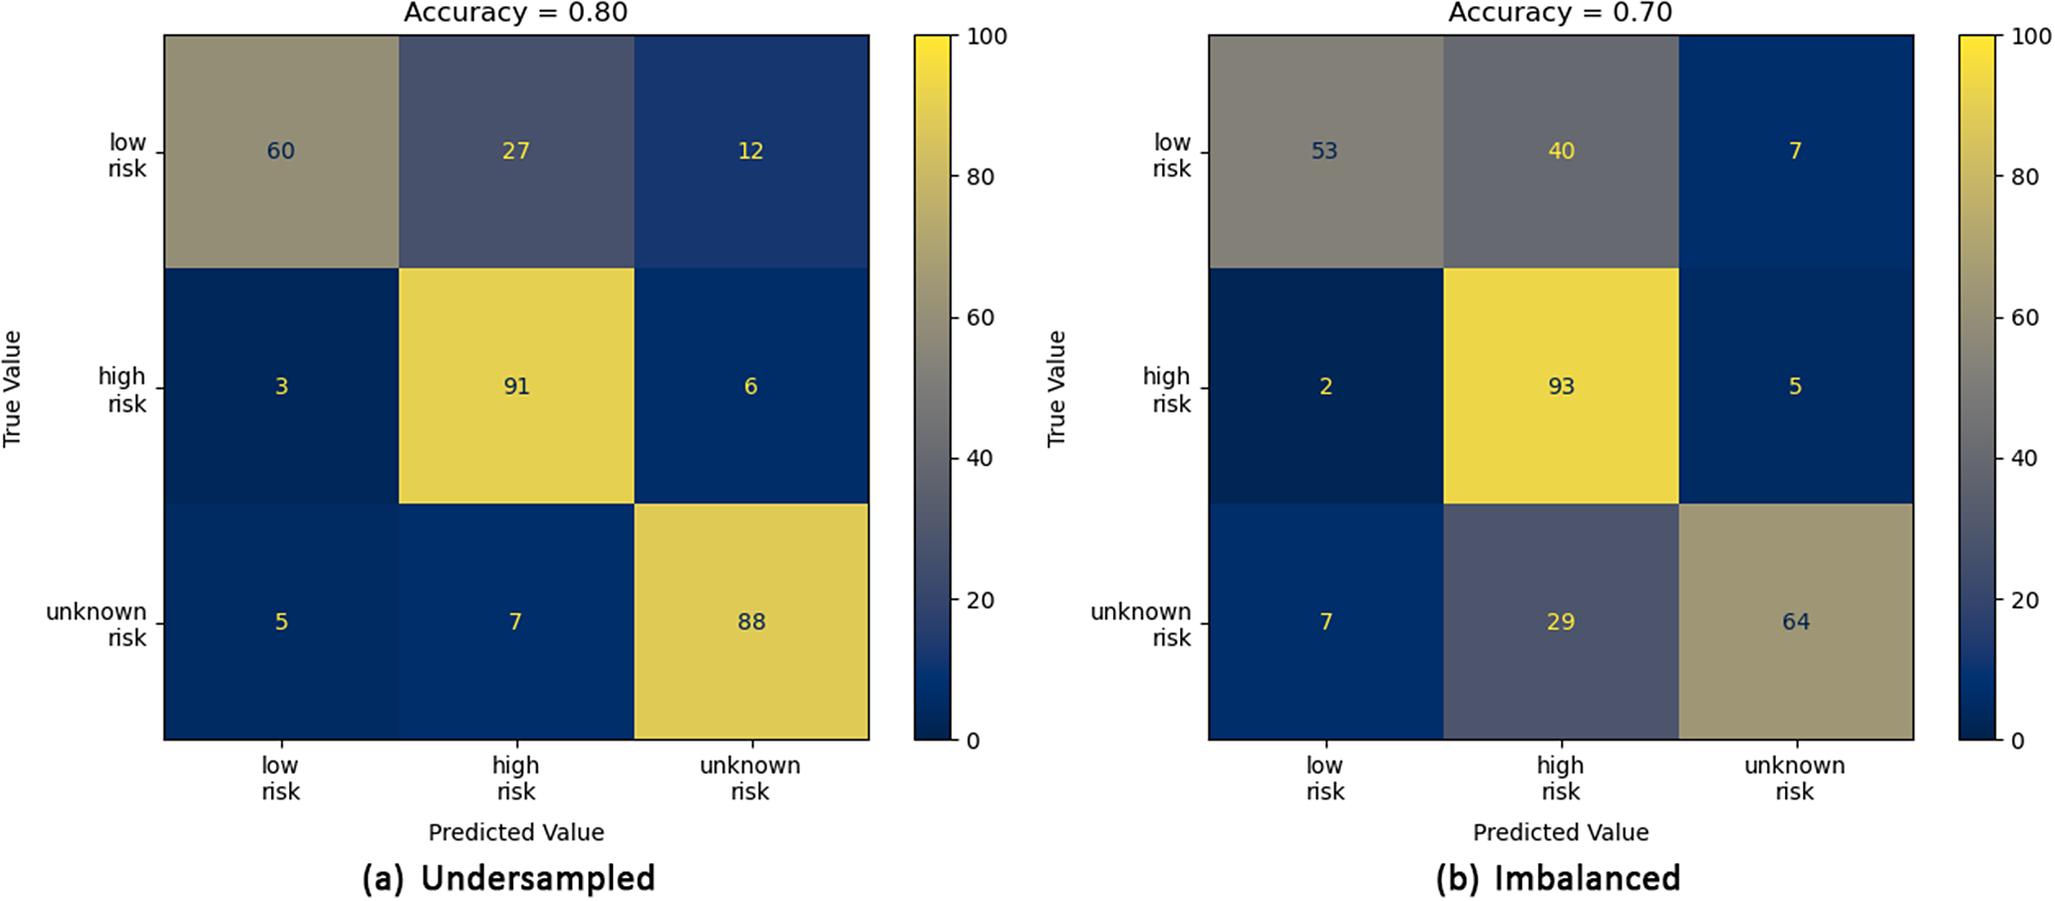
While obtaining a low percentage of high-risk images being misclassified as low risk is a clear desirable, we look at whether this affects the overall prediction. Figures 7–10 show the confusion matrices for the prediction which returned the lowest percentage of images labelled as high risk that are misclassified as low risk, over the 100 simulations, for the LogReg, ResNet50 and vision transformer models respectively. For the purposes of this investigation, we focus on the LogReg, ResNet50 and both vision transformer models as overall they have outperformed the MLP models.
Confusion matrices for the imbalanced (b, right) and under-sampled (a, left) datasets for the LogReg model. The numerical values given are the percentage of the total number of images in each category. The accuracy score is given at the top of each plot.

Confusion matrices for the imbalanced (b, right) and under-sampled (a, left) datasets for the ResNet50 model. The numerical values given are the percentage of the total number of images in each category. The accuracy score is given at the top of each plot.

Confusion matrices for the imbalanced (b, right) and under-sampled (a, left) datasets for the ViT-B-16 model. The numerical values given are the percentage of the total number of images in each category. The accuracy score is given at the top of each plot.

Confusion matrices for the imbalanced (b, right) and under-sampled (a, left) datasets for the ViT-L-16 model. The numerical values given are the percentage of the total number of images in each category. The accuracy score is given at the top of each plot.

For the imbalanced dataset, all four models demonstrate a high accuracy in predicting an image to be high risk, with the ViT-B-16 model obtaining the highest accuracy of 98% (Figure 9b). However, across the four models, an increase in prediction accuracy of high-risk images results in an increase in low-risk to high-risk misclassifications with the ViT-B-16 model predicting 46% of low-risk images as high risk. While this does not carry an associated flood risk, it may increase operating costs as high-risk predictions would be expected to require a manual inspection of the trash screen. For the under-sampled dataset, the ResNet50 (Figure 8a), ViT-B-16 (Figure 9a) and ViT-L-16 (Figure 10a) models demonstrate a clear bias towards high-risk and/or unknown-risk predictions, similar to that observed in the imbalanced dataset, suggesting that their training in this case is imbalanced. However, the predictions for images in each category are more evenly balanced for the LogReg model (Figure 7a), correctly predicting 83%, 82% and 82% of low-, high- and unknown-risk images, respectively, suggesting more balanced training. Furthermore, for the LogReg model, it suggests that optimisation of a loss function which describes application specific misclassifications may be more appropriate than the standard categorical loss function. For the categories considered in this article, the important misclassifications to minimise are high to low, unknown to low, low to high and low to unknown. High to unknown and unknown to high misclassifications are not important here, as from a practical perspective, predictions from either category would be expected to require a manual inspection of the trash screen.
Discussion
Automated classification of CCTV images of trash screen has the potential to provide real-time information on the debris blocking status at key locations. As demonstrated in this study, machine learning algorithms provide a promising route towards an operational real-time warning system, but, as discussed in the introduction, their application to this field of study is in its infancy. In particular, the robustness of methods under real-world constraints such as sample size and data quality needs to be assessed to secure operational reliability. In response to this challenge, we have studied the performance of several commonly used deep neural network models for classifying debris blockage of a trash screen. Due to the relatively small dataset considered in this study, the ResNet50 and ViT models were pre-trained and utilised full transfer learning. From a practical perspective, an automated pipeline for trash screen blockage detection should be robust to image variations, which may arise due to updates in technology or design, as well as possible quality issues. Consequently, a sample of 100 simulations, where the training and testing datasets are re-calculated for each simulation, were performed on each model for two datasets (an imbalanced dataset and an under-sampled dataset), to assess performance robustness.
The pre-trained models with full transfer learning (ResNet50, ViT-B-16 and ViT-L-16) demonstrated significantly less variation across the 100 simulations when compared to the MLP models, for all performance metrics considered, as there are fewer model parameters to optimise compared to the MLP. The observed variability increased for the under-sampled dataset, across all performance metrics, suggesting that the variation may be enhanced by the use of a relatively small dataset. However, as discussed in Iqbal et al. (Reference Iqbal, Bin Riaz, Barthelemy and Perez2023), there can be significant challenges in obtaining a large dataset, particularly for supervised learning algorithms, motivating the use of pre-trained models with full transfer learning. Therefore, it is surprising that the observed variation of the pre-trained models (ResNet50, ViT-B-16 and ViT-L-16) is comparable with a logistic regression model. Approximately 80%, or higher, peak accuracy of the pre-trained models is generally observed and is comparable with other studies. For example, a 78% and 84% accuracy for ResNet50 and NASNet models was observed in Iqbal et al. (Reference Iqbal, Barthelemy, Li and Perez2021), while an 81% accuracy for ResNet50 and NASNet models (when coupled to an initial segmentation algorithm) were observed in Iqbal et al. (Reference Iqbal, Bin Riaz, Barthelemy and Perez2023). Peak and median scores of all performance metrics for the ViT models are generally higher than the ResNet50 model, demonstrating their potential in this application area. However, the median scores of the pre-trained ViT models are comparable with the LogReg model, suggesting that the pre-training is having minimal effect on the classification. We believe this is in contrast with other results in the literature. For example, Iqbal et al. (Reference Iqbal, Bin Riaz, Barthelemy and Perez2022) concluded that an artificial neural network model had outperformed support vector regression, though different performance metrics were used.
Finally, we considered the percentage of images labelled as high risk being classified as low risk. From a practical perspective, we would like this percentage to be as low as possible. We found that over the 100 simulations there is significant variability, with the LogReg and ResNet50 models displaying the smallest score IQRs of 3.96 and 3.73 on the imbalanced datasets and 6.80 and 6.98 on the under-sampled dataset respectively. Identifying the simulations from the sample of 100 which produced the lowest percentage of high-risk misclassifications, for the ResNet50 (4% and 7% for the imbalanced and under-sampled datasets), ViT-B-16 (0% and 2% for the imbalanced and under-sampled datasets), ViT-L-16 (2% and 3% for the imbalanced and under-sampled datasets) and LogReg (3% and 5% for the imbalanced and under-sampled datasets) models, we found that generally a lower overall accuracy was observed, with the models performing better (with respect to overall accuracy) on the under-sampled dataset than the imbalanced. The percentage of high-risk misclassifications is comparable with other studies in the literature. For example, Iqbal et al. (Reference Iqbal, Barthelemy, Li and Perez2021) observed 21% and 10% misclassifications for ResNet50 and NASNet respectively. However, in all cases, producing a lower percentage of high-risk misclassifications resulted in a higher percentage of low-risk misclassifications. This has important implications from a practical point of view. If an automated pipeline returned low-risk misclassification, a manual inspection of the trash screen would need to be carried out, potentially increasing the cost for local authorities. Furthermore, it suggests a high precision in every category may be difficult to achieve without more bespoke methods. For example, it may be possible to raise the categorical precision by utilising more bespoke treatment of the images. In this regard, Iqbal et al. (Reference Iqbal, Bin Riaz, Barthelemy and Perez2023) utilised a CNN for image analysis and a separate CNN for image classification. While this pipeline produced a higher accuracy overall (81% for the ResNet50 and NASNet models), it has the drawback of requiring multiple CNNs to be optimised.
Conclusions
In this article, we have compared several deep neural network approaches, as well as a logistic regression model, for the classification of trash screen debris blockage. We observed the following:
-
• Overall vision transformer models (ViT-B-16 and ViT-L-16) matched or outperformed convolutional neural network model (ResNet50) on the datasets considered. For example, the ViT-B-16 model obtained median scores of 77% and 78% accuracy, as well as 13% and 26% high-risk misclassifications (recall), on the imbalanced and under-sampled datasets, while the ResNet50 model obtained median scores of 70% and 72% accuracy, as well as 16% and 33% high-risk misclassifications (recall), on the imbalanced and under-sampled datasets. This demonstrates the potential of vision transformer models in this field of study.
-
• Overall, pre-trained models utilising full transfer learning did not significantly outperform logistic regression model on the datasets considered. For example, on the imbalanced and under-sampled datasets, the logistic regression model obtained 78% and 79% accuracy, as well as 14% and 28% high-risk misclassifications (recall), compared with 77% and 78% accuracy, as well as 13% and 26% high-risk misclassifications (recall), for ViT-B-16 model; 78% accuracy, as well as 14% and 27% high-risk misclassifications (recall), for ViT-L-16 model and 70% and 72% accuracy, as well as 16% and 33% high-risk misclassifications, for ResNet50 model. While this might suggest a difficulty associated with our datasets, these results could also be influenced by the low number of epochs considered or too large a learning rate. Throughout all simulations the logistic regression model (LogReg) consistently showed the least IQR variability in all cases, the ResNet-50 model was the second least variable model. However, the MLP models were found to be the most sensitive to the input datasets due to the larger number of model parameters being optimised from an initial random state.
The observed trade-off between low- and high-risk misclassifications is significant for a practical implementation. Ideally, any practical implementation, such as an operational early warning system, will aim for high accuracy in all categories. However, improving the accuracy for one category may decrease the accuracy for another. The results presented here show that there is a high potential for implementing machine learning models into an operational system providing automated early warnings to flood managers rather than relying on manual ad hoc inspections. Thus, successful implementation would allowing more proactive management of debris blocking risks than is currently possible using dataset that are already being collected.
Open peer review
To view the open peer review materials for this article, please visit http://doi.org/10.1017/wat.2026.10018.
Data availability statement
Some or all data, models or code that support the findings of this study are available from the corresponding author upon reasonable request (code and performance metrics data).
Acknowledgements
The authors thank the two anonymous reviewers for their constructive comments. This work was supported by the Engineering and Physical Sciences Research Council (EPSRC) funded project ‘Reclaiming Forgotten Cities- – Turning cities from vulnerable spaces to healthy places for people [RECLAIM]’ [grant numbers EP/W034034/1]. The authors gratefully acknowledge the University of Bath’s Research Computing Group (DOI: 10.15125/b6cd-s854) for their support in this work.
Author contribution
Conceptualisation: T.K, A.B.; Data acquisition: S.D., T.K.; Investigation: C.R., T.K. and A.B.; Visualisation: C.R., Writing and Reviewing: C.R, A.B, S.D. and T.K.
Financial support
This study was financially supported by the UK Research and Innovation (UKRI) Engineering and Physical Sciences Research Council (EPSRC) under grant EP/W034034/1.
Competing interests
The authors declare that they have no known competing financial interests or personal relationships that could have appeared to influence the work reported in this article.
Appendix A
Default hyperparameters for the logistic regression model of SK-learn (Pedregosa et al. Reference Pedregosa, Varoquaux, Gramfort, Michel, Thirion, Grisel, Blondel, Prettenhofer, Weiss, Dubourg, Vanderplas, Passos, Cournapeau, Brucher, Perrot and Duchesnay2011)

Default hyperparameter values for the MLP, ResNet50 and ViT models of PyTorch (Paszke et al. Reference Paszke, Gross, Massa, Lerer, Bradbury, Chanan, Killeen, Lin, Gimelshein, Antiga and Desmaison2019)


 Open access
Comments
We are pleased to submit our manuscript on the use of machine learning models for detecting debris blocking of urban rivers from CCTV images. The use of AI/ML models for real-time management of flood risk and vital – yet unassuming and often overlooked - infrastructure components such as culverts is a mostly unexplored area. However, mitigating flood risk as well as securing the health and safety of maintenance crews tasked with cleaning these rivers are important challenges to cash-strapped city authorities across the world; and challenges that will be exacerbated by the twin challenges of climate change and increasing urbanisation. Thus, by demonstrating the successful and robust performance of AI/ML model applied to CCTV images not necessarily collected for the purpose of modelling has the potential for unlocking wider interest in the application of ML/AI to address flood risk management problems.