

Introduction
The US research enterprise has been called upon by the Institute of Medicine to improve its efficiency and efficacy [1, 2]. Clinical and Translational Science Award Programs (CTSAs) have risen to this challenge by developing metrics to identify areas for improvement in the initiation and conduct of research. One area that has been a target for those looking to improve research efficiency is the Institutional Review Board (IRB) review process.
Since the 1975 National Research Act, but more especially since the adoption of the Common Rule in 1991, IRBs have played a key role in the institutions’ responsibilities to protect the rights and welfare of research participants and especially ensuring compliance with the federal regulations governing human subjects research [3]. Some researchers have illuminated a lack of transparency about many aspects of IRB processes [Reference Silberman and Kahn4, Reference Abbott and Grady5]. In an effort to better understand and improve IRB processes, and to facilitate the timely approval and initiation of human subjects research protocols at our institution, we have undertaken a quantitative evaluation of the IRB review process using 2 biomedical IRBs’ data. The main objective of this project is to determine protocol and IRB characteristics that are predictors of delays or accelerations in the IRB approval process of health-related research.
Background and Significance
Institutions conducting federally funded research or research regulated by the Food and Drug Administration are required to protect the rights and welfare of human subjects, and must ensure IRB review and approval occurs before nonexempt human subjects research can begin [Reference Grady6, Reference Grady7]. Federal regulations outline the specific criteria for IRB approval (21 CFR 56.111, 45 CFR 46.111). The criteria include: protection for vulnerable subjects, data monitoring for patient safety, equitable subject selection, obtaining and documenting informed consent, privacy protection and confidentiality, risk/benefit analysis, and risk minimization. The lack of specificity in the federal regulations has led to significant variability in the processes, procedures, and decisions made by IRBs [Reference Abbott and Grady5, Reference Larson8, Reference Dziak9]. This variability, coupled with a lack of understanding of IRB processes, can result in frustration and confusion for researchers [Reference Carline10–Reference Whitney12]. Delays and obstructions in the initiation of research projects, related to the IRB process and its lack of consistency and efficiency, have also been described [Reference Silberman and Kahn4, Reference Hyman11, Reference Lidz13–Reference Klitzman16].
A review of the literature in this area shows that efforts to improve efficiencies and guideline compliance have been undertaken at several institutions. One such effort is a “compliance tool” of guidelines used during a convened IRB to remind members of their goals for review [Reference Vulcano17]. Another effort involves benchmarking targeted areas of interest in IRB workflows [Reference Vulcano18]. However, fundamental variations in IRB processing times have, thus far, been incompletely analyzed and characterized [Reference Vulcano17, Reference Vulcano18]. Related studies have evaluated the overall research process to develop metrics to improve research process timelines [Reference Rubio19–Reference Kagan, Rosas and Trochim21]. A more targeted evaluation of one institution’s Human Research Protection Program has been reported [Reference Lantero, Schmelz and Longfield22]. And, an evaluation of IRB processing times to inform development of an electronic IRB database has been developed [Reference Bian23]. To our knowledge, our analysis is the first to use both statistical and machine learning methods to evaluate protocol and IRB factors affecting protocol review processing times.
In this study, we investigated the hypothesis that specific features of protocols and IRBs are correlated with different processing times, and that these features can be identified through the use of machine learning methods. The immediate goal of this study was to provide new insight and understanding of protocol and IRB features that were correlated with delays or accelerations in the IRB approval process in order to inform IRB process improvement efforts at our institution. Once patterns were discovered, this information guided IRB process improvement efforts. After staff and process changes were in place for 15 months, we repeated this computational analysis of IRB processing time. The goals of these iterative efforts were improvement of: efficiency, consistency, transparency, communication, and, as a result, timely initiation of research protocols.
Methods
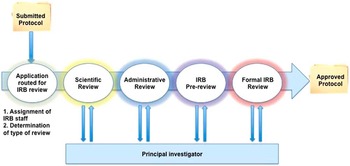
We adapted principles from the business intelligence literature to improve understanding and efficiency of the IRB review process [Reference Chaudhuri, Dayal and Narasayya24]. Business intelligence methods have been successfully applied to improve radiology workflows, patient safety, and cost efficiency in healthcare systems [Reference Chaudhuri, Dayal and Narasayya24–Reference Cook and Nagy28]. Business process modeling has previously been used for clinical research improvement evaluating the overarching research workflow from protocol development to implementation, but did not focus closely on the IRB process [Reference Kagan, Rosas and Trochim21]. Using data from an electronic system supporting 2 IRBs, single variable analysis and machine learning methods were evaluated to determine if specific protocol or IRB features were associated with different processing times within the IRB system (Fig. 1). The Waikato Environment for Knowledge Analysis suite of machine learning algorithms was used in this analysis [Reference Hall29, Reference Witten and Frank30]. A simplified diagram of the IRB review process is included in Fig. 2.
Overview of data analysis.

Flow diagram of Institutional Review Board (IRB) processes (Convened IRB Review). Scientific review is not included in IRB processing time because this is not under the purview of the IRB.

From the IRBs, we initially obtained information on 2834 IRB-approved submissions, January 1, 2011 through December 31, 2012. These approved submissions included initial reviews by a convened IRB, initial reviews conducted under expedited procedures, initial reviews of exemptions (including determinations that a project did not meet the definition of human subjects research), change protocol reviews that underwent either convened or expedited review, and continuing reviews. The information collected by the electronic IRB data system includes features such as whether a protocol involved multiple sites, if the protocol included enrollment of vulnerable populations (eg, prisoners or minors), and specific IRB subprocess completion times along with total IRB processing time to obtain approval. Data preprocessing included systematic review of the data with IRB staff to confirm term meanings and stages within the IRB process.
Features contained in the databases were divided as “early predictors” or “late predictors.” “Early predictors” included mostly protocol features (eg, whether a protocol was to be implemented at a Veterans Administration Hospital). However, some IRB-related features are also known immediately at the time of protocol submission (eg, IRB staff in charge of a protocol’s review). One hundred seventy-six features were evaluated and consisted of 149 early predictors and 27 late predictors [online Supplementary Material (Appendix A) describes early predictors]. The “feature to be predicted” is the class variable used in building the predictive models. The class variable used to address the primary study question was the IRB processing time. IRB processing time in this study does not include the time the IRB is waiting for more information, clarification or documentation from the protocol’s principal investigator or study team. For example, for the purposes of this study, when a question or clarification request was communicated to the study team during a review process, the IRB processing time clock stopped and resumed once a response was returned to the IRB. Our preliminary evaluations performed on a smaller IRB data set used processing time as a numeric (continuous) variable. After consultation with IRB staff, it was determined that using a nominal (categorical) variable for specific processing “time-frames-of-interest,” based on IRB workflows, may prove most informative for the IRB’s process improvement efforts. Therefore, analyses were performed separately using: (1) total processing time as a numeric variable for regression analyses and (2) total processing time discretized into “time-frames-of-interest.” The discretized total processing time could take on 1 of 6 values for protocols undergoing Initial Review-Convened (IR-Full) or Change Protocol Review-Convened (CP-Full): A=0–30 days, B=31–45 days, C=46–60 days, D=61–75 days, E=76–90 days, and F>90 days. For Expedited and Exempt reviews the discretized total processing time could take on 1 of 5 values: A=0–7 days, B=8–14 days, C=15–21 days, D=22–28 days, and E>28 days. In addition, data were analyzed in 2 ways in relation to type of IRB review performed (IRB-Determined Review Type): (1) all protocols were pooled, regardless of type of IRB review performed, and the variable IRB-Determined Review Type was used as a feature that could be significant/predictive of the time for IRB approval and (2) each type of IRB review was analyzed separately with only protocols undergoing the same type of review analyzed together.
Feature selection was based on: (1) input from domain experts, (2) expected potential for information gain, and (3) information from the Waikato Environment for Knowledge Analysis feature selection tool. Features with numerous potential values (eg, ID number) were eliminated because of “overfitting”: producing a model that could accurately predict the class variable for data in the training set, but would have too many specific values to generalize to new data. The feature Department of Study Origin exhibited this problem because it was initially represented as a nominal variable that could take on 121 possible values. Due to the large number of possible values that would be specific to a particular training set, this feature was expected to cause overfitting issues. Therefore, the single nominal feature was broken into 121 binary features (ie, Department of Study Origin X—negative, positive) and each binary feature was independently evaluated in the model. Despite this approach, Departments of Study Origin were still not informative in our single variable analysis or models. The Department of Study Origin feature is listed in the Feature Table as a single entry due to space considerations in the online Supplementary Material (Appendix A).
Single variable analysis was completed for each early predictor. Single variable analysis was performed using t-tests with individual variable values compared with all possible values for that variable. p Values (significance levels) were adjusted using the Bonferroni correction to take into account the large number of multiple comparisons [Reference Rosner31]. In cases where a variable was represented as more than 2 groups (ie, having more than 2 means, such as in the Month Received variable’s time to protocol approval), we used 1-way analysis of variance (ANOVA) testing to compare multiple means. Of those showing significance, a post hoc Tukey range analysis was used to determine all significant pairs.
This study used machine learning methods to determine if there were combinations or functions of protocol and IRB characteristics that were more predictive of our class variables than the individual characteristics alone. Machine learning methods have been applied to a variety of medical problems to find new patterns or correlations within existing data [Reference Roque32–Reference Kawaler35]. Supervised machine learning methods were used in our analysis. Given a training set consisting of protocol and IRB characteristics, along with a known class variable for each protocol, a supervised machine learning algorithm induces a model that represents the class variable as a function of the protocol and IRB characteristics. Such models can provide insight into the factors that explain the class variable, and they can be applied to previously unseen instances (ie, protocols) to predict their class variables.
In this study, the input data consisted of protocol and IRB representations, and the machine learning methods were used to identify functions of the given features that were strongly predictive of a specific time to IRB approval of that protocol. We started our analysis using decision tree algorithms. Decision tree learners are methods that recursively split the training set, based on identified characteristics in the data, into subsets with purer collections of data on the basis of the targeted class variable. This produces a model that can be represented as an upside down tree with the “root” (at the top) containing all the data with a mixture of class variable values down to the “leaves” which contain data with only one or a few class variable values. The goal is to identify functions of the variables (eg, Month Received and IRB-Determined Review Type) that explain the class variable. Then, by looking at the tree, an observer can determine which characteristics (or combination of characteristics) is/are predictive (found in the branch path) leading out to the particular class variable value at the end of the branching [Reference Kingsford and Salzberg36, Reference Lewis37]. We also learned bagged trees: ensembles of trees that have demonstrated state-of-the-art predictive accuracy in a wide array of problem domains [Reference Dietterich38, Reference Dietterich39]. Other supervised machine learning algorithms used included linear regression, least median squared regression, decision tables, support vector machines, neural networks, and lazy kstar.
We validated models created from each of these algorithms using a 10-fold cross validation method. The data were separated into 10 separate partitions (using the entire data set each time) with 90% of each version of the data set used for training and 10% used for testing. Thus, at the end of this validation, all of the study data were sequentially used as a training and a test set. Our goal in developing and testing these models was to understand the relationship of protocol and IRB features and total IRB processing time. In addition to allowing prediction of total processing times for newly submitted protocols, these models offer knowledge about reasons for delays or accelerations in the IRB approval process (ie, which features are most positively or negatively correlated with long or short processing times). We are continuing to apply this knowledge to our process improvement efforts in the IRB. Starting in the Fall of 2013, improvements were instituted that included: changes in staffing; changes in assignment allocation; increased and improved staff training; improved communication of expected review timelines; and increased monitoring of review timeframes. After these changes were in place for 15 months, we repeated our analysis (using methods described above) and compared post-improvement results with our initial results.
Results
Statistical Analysis Results
Fig. 3 shows variability in time to approval of Initial Review-Convened (IR-Full) protocols submitted to the IRB during the 2013-2014 time period. Only approved studies are included in this graph. Less than 5% of submitted studies did not obtain IRB approval within 1 year of submission.
Initial analysis distribution of time to protocol approval (IRB Time) for Initial Review-Convened (IR-Full) protocols submitted 2013-2014.

Features that did not raise concerns for overfitting but contained many possible values were converted to binary variables. For example, the feature “issue” initially had several possible values corresponding to different types of issues (eg, missing documentation, clarification needed). On review with IRB staff, it was decided to bin all issues together and determine how the presence of any “issue” would affect processing. Another example is described above in the feature selection section regarding Departments of Study Origin. Features that are known early in the review process are called early predictors and consist mostly of protocol features. Binomial early predictors that were statistically significant are listed in Table 1.
Statistically significant binomial “early predictors” 2013–2014 in pooled analysis

IRB, Institutional Review Board; VA, Veterans Administration; UW, University of Wisconsin-Madison.
* Predictors are variables that may influence how long a protocol spends in IRB Review before approval is obtained. An example is whether or not the protocol has vulnerable populations included in its study. If vulnerable populations are included, the IRB may take longer to review the protocol to ensure appropriate measures are outlined to protect these subjects.
ANOVA evaluations were also undertaken for variables with multiple values to see pairings of values with significance. Variables with pairs showing significant differences in ANOVA evaluations were Principal Investigator-Requested Application, Conducting Organization, IRB-Determined Review Type, IRB Staff, Month Received, Review Type [for detailed description of the variable, see online Supplementary Material (Appendix C)].
Processing time improvements and changes are shown in the 4 box plot figures. Fig. 4 shows processing time improvements on the basis of Month Received. Fig. 5 shows processing time improvements and changes on the basis of IRB-Determined Review Type. Box plot data components: the lower line of the box is the first quartile of the data, the upper line of the box is the third quartile, the line within the box is the median, the number within the box is the mean number of processing days, the “whiskers” extending from the upper and lower box represent the data that are within 1.5 times the upper and lower quartile values, respectively, the open circles represent data values that are outliers. The width of the box represents how many protocols were received that month.
Institutional Review Board (IRB) processing time (days) for all submissions by month received. (a) 2011–2012 and (b) 2013–2014.

Institutional Review Board (IRB) processing time (days) for protocol approval by IRB type. (a) 2011–2012 and (b) 2013–2014.

Machine Learning Analysis Results
Features used in machine learning analysis included early predictors (features that are known early in the review process—mostly protocol features) and late predictors (features known late in the review process—mostly IRB process features). Early predictors were of greatest interest in prediction as discussed in Discussion section. Those early predictors proving most informative in our machine learning models were:
-
1. Cancer related (is this protocol cancer related (yes/no))
-
2. IRB Staff (IRB member in charge of this protocol’s review)
-
3. IRB-Determined Review Type (the type of review that will be conducted (eg, convened review, expedited review))
-
4. Month Received (the month the IRB received the protocol to begin review)
-
5. Replacement (is this protocol a replacement application review of a previously approved protocol (yes/no))
-
6. Veterans Administration (VA) (is this a VA study (yes/no))
The variable to predict or classifier was All IRB Time (time for IRB processing).
Machine learning algorithms’ predictive performances were measured using correlation coefficients, with high values showing good correspondence between the measured and predicted total IRB processing time in these models. Mean absolute error was measured using the number of days the prediction deviated from actual processing time of a known protocol. Algorithms using time for IRB approval as a numerical target variable (instead of the discretized time variable) had higher correlation coefficients. Pooled machine learning results with time as a numeric variable are shown in Table 2. Analysis of each IRB-Determined Review Type separately did not show higher correlation coefficients than the pooled analysis, thus results are not included.
Machine learning results (using the 6 early predictors)
Discussion
This study was performed to determine whether specific features of protocols and/or the IRB protocol approval process could be predictive of the total IRB processing time for previously unseen protocols. Challenges in this analysis included the laborious, iterative task of understanding and transforming the raw data into a useable form for analysis. This study was undertaken as a quality improvement study. Therefore, its primary limitation is the use of only 2 IRBs’ electronic data, which may decrease generalizability. It is being shared with the scientific community as an example of how an IRB process analysis and improvement project can be undertaken. The results of this analysis are already being used at our institution to inform process change for improved IRB efficiency, transparency, and communication with investigators. Benefits of the knowledge gained from this analysis are shown in improved IRB protocol processing times as shown in Figs. 4 and 5.
Ensembles of decision trees (ie, bagging) produced the best predictive models with the highest correlation coefficients. Using late predictors (ie, information known downstream in the IRB process flow) produced higher correlation coefficients, but we are most interested in early prediction of how long a protocol will take to complete the IRB approval evaluation. So, by using information known early (ie, right after protocol submission), we could provide near immediate feedback to the investigator on how long he or she should expect the review to take. This improves communication, transparency, and encourages realistic expectations on both sides. Accordingly, we are continuing to work on improving our models and increasing understanding of early predictors that contribute to delays or accelerations in the process.
Some of our most interesting findings included the following:
-
1. The type of IRB review that was performed was significant in predicting the time to IRB approval with convened reviews taking the most time, followed by exempt reviews then expedited reviews in the 2011–2012 data set. Initially, we were surprised that exempt reviews took more time than expedited reviews. However, in the 2013–2014 data set expedited reviews were longer than exempt and increased rather than decreased after improvement changes. This finding is reflective of 4 facts. First, the expedited reviews conducted during the initial evaluation period were limited primarily to a very specific type of application (retrospective medical records review), which is rather uniform in presentation and generally poses the same review issues. Second, the longer review time in the later evaluation period for expedited reviews reflected the IRB’s procedure change that expanded the types of studies meeting criteria to undergo expedited review. Third, only a small number of expedited reviews were contained in the 2013–2014 data set. Fourth, staff changes resulted in staff who had less experience performing the expedited reviews in 2013–2014 than staff in the 2011–2012 data set.
-
2. We evaluated the data using a pooled analysis of all submitted protocols that underwent any type of IRB review and individual analysis of each IRB-Determined Review Type with only protocols undergoing one type of IRB review (eg, evaluation of only protocols undergoing Initial Review—Convened, separate from protocols undergoing Change Protocol Review—Convened). Our results from the individual type analyses did not show improved predictive performance. The IRB-Determined Review Type used as a feature was very significant and predictive of the time to complete the review in the pooled analysis. Without this as a feature in the individual type analyses, the predictive performance markedly decreased.
-
3. If a protocol was to be implemented through the VA, its review took longer. Again, the IRB staff confirmed this to be true due to further reviews having to be performed separately at the VA before the protocol could be approved.
-
4. The 2011–2012 data set’s Month Received was significant, as shown in Fig. 4a . Upon review with IRB staff it was hypothesized that there could be effects due to staff member availability (eg, vacation times in the summer or at the end of the year and vacant positions). After improvements were instituted, this difference in Month Received did not persist.
-
5. Our analyses demonstrated that the “human factor” is a strong predictor of IRB processing time. Specifically the IRB staff member in charge of a protocol’s review is statistically significant and a strong predictor in our machine learning models. We hypothesized that the amount of staff training may be explanatory of differences in processing time, but that did not prove true on analysis. Another possible impact was the complexity of the studies that some staff handled compared with others. For example, more experienced staff tend to be assigned studies with complicated designs or have complex regulatory requirements. We further hypothesized that staff workload played an important role in determining IRB approval time, but thus far we have not been successful in creating a metric that can accurately reflect differences in protocol processing time based on staff workload.
Ongoing and future work on this project will include continued evaluation and development of staff workload metrics reflecting both the number and complexity of protocols each individual IRB staff member is processing in a given time period. In the related area of oncology clinical trials, a complexity rating scale has been developed to facilitate workload planning. However, to our knowledge, a complexity model that accurately reflects IRB processing time has not been presented [Reference Smuck40]. Information gained from our study has already been applied to improve current IRB practices at this institution. Repeat analyses similar to those performed in this study will be initiated to compare performance after more changes are implemented. Finally, we will develop optimization models using knowledge from our studies to further improve resource allocation in the IRB.
-
6. Some authors have proposed that any evaluation of IRB efficiency must address variability in IRB operating costs [Reference Hyman11]. It has been proposed that some of the variability in IRB efficiency can be attributed to economies of scale (a larger volume of protocols can be reviewed at a lower per-protocol cost) [Reference Wagner, Cruz and Chadwick41–Reference Wagner44]. However, other authors assert that efficiency of scale alone cannot explain cost variability and that inefficiencies in processes should be evaluated [Reference Byrne, Speckman and Getz45]. Through our current and future analyses, we will address both IRB process and cost factors in our attempt to increase IRB efficiency.
Our study and its results are timely in light of national efforts to improve research efficiency and efficacy. The federal government is currently seeking comments on proposed changes to the Federal Policy for the Protection of Human Subjects (the Common Rule) [Reference Menikoff46–Reference Emanuel and Menikoff48]. Our efforts are directly aligned with this proposal’s stated purpose to “better protect human subjects involved in research, while facilitating valuable research and reducing burden, delay, and ambiguity for investigators” [Reference Menikoff46].
In the future, our research methods can be applied at other institutions and easily adapted to address potential changes to research protocol classifications that may be instituted by the Common Rule changes under review.
Declaration of Interest
The authors have no conflicts of interest to declare.
Acknowledgments
This work was supported by the Clinical and Translational Science Award (CTSA) program, through the NIH National Center for Advancing Translational Sciences (NCATS), grant no. UL1TR000427, and NLM grant no. 5T15LM007359 to the Computation & Informatics in Biology and Medicine Training Program. We appreciate the assistance of Dr Mark Craven for input and critique of analytical methods used, and Dr Umberto Tachinardi for input and manuscript review. The content is solely the responsibility of the authors and does not necessarily represent the official views of the NIH.
Supplementary Material
To view supplementary material for this article, please visit https://doi.org/10.1017/cts.2016.25


 Open access