





The accuracy of people’s confidence in their knowledge is one of the most studied areas within judgment and decision-making (JDM) research. With rare exceptions (e.g., Murphy and Winkler, Reference Murphy and Winkler1977), the conclusions have been sobering. People’s confidence is often not justified by their actual knowledge—both in the sense that overall levels of confidence tend to be too high and also in the sense that individual differences in confidence vary largely independently of actual knowledge (Brenner et al., Reference Brenner, Koehler, Liberman and Tversky1996; Fischhoff et al., Reference Fischhoff, Slovic and Lichtenstein1977; Klayman et al., Reference Klayman, Soll, González-Vallejo and Barlas1999; Oskamp, Reference Oskamp1965; Wu et al., Reference Wu, Johnson and Sung2008). This conclusion matters because, presumably, many actions are based on a feeling of confidence in knowledge (Griffin and Tversky, Reference Griffin and Tversky1992; Russo and Schoemaker, Reference Russo and Schoemaker1992). To the extent that this confidence is unjustified, the quality of the resulting decisions is assumed to be reduced (Griffin and Tversky, Reference Griffin and Tversky1992; Razmdoost et al., Reference Razmdoost, Dimitriu and Macdonald2015; Yates et al., Reference Yates, Lee and Shinotsuka1996), potentially resulting in poor medical, financial, or legal decisions (Griffin and Tversky, Reference Griffin and Tversky1992).
Despite these concerns, we are far from a comprehensive understanding of what the consequences of confidence in knowledge actually are. Much of the existing work is outcome-focused, starting with an outcome of interest and treating confidence as one of many potential determinants. In contrast, our work starts with confidence, examining how confidence relates simultaneously to a range of outcomes or pathways to an outcome. A key advantage of this approach is that confidence may influence multiple (and potentially contradictory) psychological and behavioral pathways, which would not be identified with the outcome-focused approach. Note the focus of this paper is specifically on confidence in knowledge, which we define as a subjective assessment of the extent of one’s actual knowledge in a particular context (Parker et al., Reference Parker, Somerville, Stone and Kemmerly2025), sometimes referred to as subjective or perceived knowledge.
Accordingly, we investigate the associations between confidence in one’s knowledge and a set of psychological and behavioral variables drawn from both the JDM literature (Moorthy et al., Reference Moorthy, Ratchford and Talukdar1997; Payne et al., Reference Payne, Bettman and Johnson1993; Price et al., Reference Price, Ottati, Wilson and Kim2015; Thomas and Velthouse, Reference Thomas and Velthouse1990; Yates, Reference Yates1992) and a recent exploratory study of the perceived consequences of confidence (Parker et al., Reference Parker, Somerville, Stone and Kemmerly2025). In so doing, we separate the effects of confidence from those of actual knowledge, which we label ‘unjustified confidence’ (Parker and Stone, Reference Parker and Stone2014). Unjustified confidence is importantly different from overconfidence in that it keeps the focus on confidence instead of the difference between confidence and knowledge. The primary aim of this work is thus to determine, within a particular domain (sports betting), whether unjustified confidence in one’s knowledge is associated with a set of psychological (empowerment, decisiveness, openness to information) and behavioral (risk taking, information search, information use) potential consequences of confidence. This correlational approach provides an essential foundation for our goal of developing a theory of the consequences of confidence—identifying which relationships exist and warrant experimental investigation.
1. Toward a theory of consequences of confidence
As we use it in this line of work, confidence refers to a subjective assessment of actual knowledge. As such, it is related but not identical to concepts such as self-confidence in sports psychology (Feltz, Reference Feltz1988) or self-efficacy (Strecher et al., Reference Strecher, McEvoy DeVellis, Becker and Rosenstock1986). Here, we focus on factual knowledge and by extension predictive ability. As noted above, knowledge and confidence are often imperfectly correlated, typically between .2 and .6 (Alba and Hutchinson, Reference Alba and Hutchinson2000), and thus there are multiple determinants of confidence beyond knowledge. To adjust for any knowledge effects, our theoretical and analytical framework emphasizes unjustified confidence (Jaccard et al., Reference Jaccard, Dodge and Guilamo-Ramos2005; Parker et al., Reference Parker, de Bruin, Yoong and Willis2012; Parker and Stone, Reference Parker and Stone2014; Radecki and Jaccard, Reference Radecki and Jaccard1995)—the effect of confidence after adjusting for knowledge.
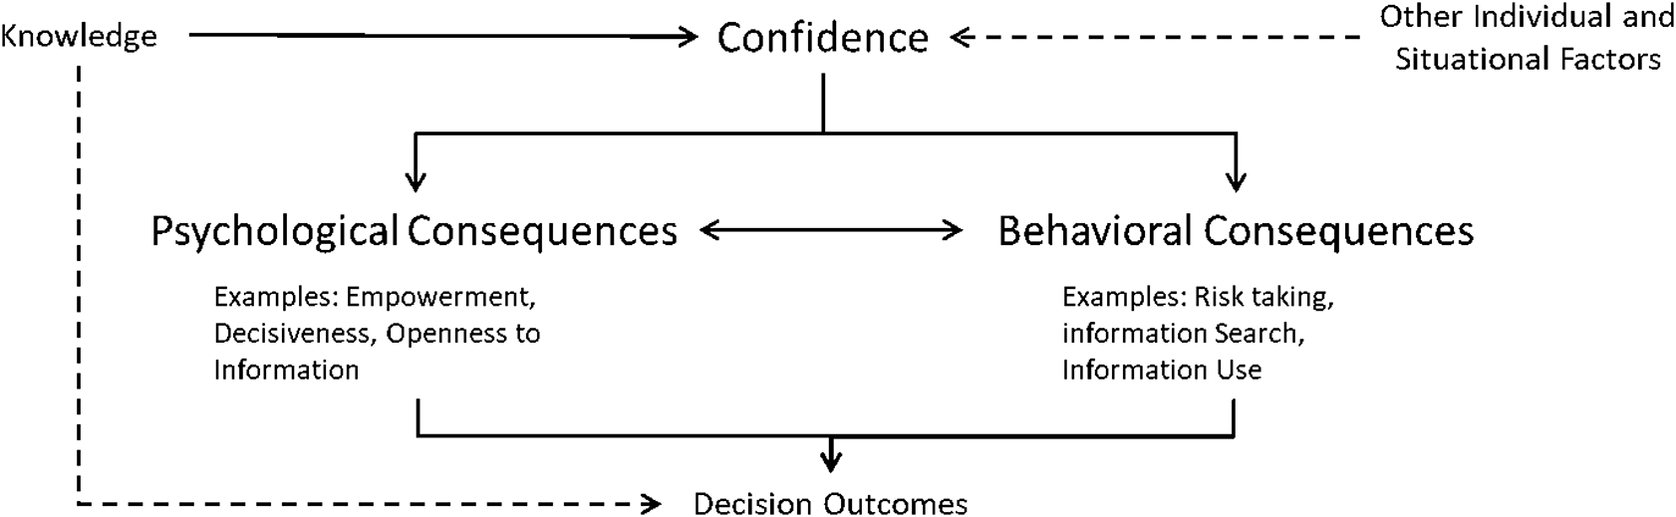
Figure 1 presents our theoretical framework for understanding the potential consequences of confidence, depicting our hypotheses about how confidence might influence psychological and behavioral processes. While this framework suggests potential causal relationships between confidence and various outcomes, we emphasize that the current study is correlational and cannot establish causal direction.
Hypothetical framework of the consequences of confidence.
Note: Unjustified confidence is represented as the effect of confidence after adjusting for knowledge. Dashed lines represent theoretical links not investigated in the current study.

Figure 1 Long description
The flowchart begins at the top with three primary inputs. On the far left, Knowledge has a solid arrow pointing right to Confidence. On the far right, Other Individual and Situational Factors has a dashed arrow pointing left to Confidence.
From the central Confidence node, a solid line branches downward into two parallel categories:
1. Psychological Consequences on the left, with examples listed as Empowerment, Decisiveness, and Openness to Information.
2. Behavioral Consequences on the right, with examples listed as Risk taking, information Search, and Information Use.
A double-headed solid arrow connects Psychological Consequences and Behavioral Consequences, indicating a reciprocal relationship.
At the bottom of the diagram is the final node, Decision Outcomes. This node receives three inputs:
- A solid arrow pointing down from the combined Psychological and Behavioral Consequences.
- A long dashed arrow originating from Knowledge on the far left, curving down and right to point directly at Decision Outcomes.
In our framework, knowledge is presumed to influence behavior in part through its effects on confidence, which can be seen as a subjective reflection of that knowledge. Unjustified confidence is represented in the framework by the separation of knowledge and confidence as distinct constructs. Unjustified confidence shapes both psychological and behavioral processes. For example, it is plausible that more confident individuals (even if not actually more knowledgeable) feel more empowered, more decisive, and more or less open to additional perspectives. Similarly, they may be more willing to take risks, seek out additional information, and make use of that information (Parker et al., Reference Parker, Somerville, Stone and Kemmerly2025). We envision these psychological and behavioral processes as influenced by confidence within a given context, and hence they may vary to the extent that confidence varies across contexts. That is not to say that there isn’t an underlying long-term stability to both confidence and consequences, in addition to situational fluctuations (Fleeson, Reference Fleeson2001).
While the current study focuses specifically on potential psychological and behavioral consequences, these processes are presumed to ultimately influence real-world decision outcomes (e.g., academic performance, financial returns). Importantly, these pathways may differ in their valence—for example, confidence could simultaneously empower investors to consider a broader range of options, while at the same time increasing risk taking that could be maladaptive in certain markets—underscoring the value of examining multiple possible consequences within the same study (Parker et al., Reference Parker, de Bruin, Yoong and Willis2012; Parker and Stone, Reference Parker and Stone2014). Although we do not directly assess downstream outcomes here, this broader extension of the framework is depicted in prior work (Parker et al., Reference Parker, Somerville, Stone and Kemmerly2025; Stone et al., Reference Stone, Parker, Hanks and Swiston2023) and remains a central target for future research. Similarly, there may be other individual or situational factors that influence confidence, but since this study is focused on the consequences of confidence, those are not examined here. The current work examines whether the associations depicted in our theoretical framework are present in correlational data in a sports betting context, providing the foundation for future experimental tests of causation.
1.1. Theorized behavioral consequences
Most of the work on the effects of confidence within JDM research has had a decidedly behavioral focus, and hence we start there. In particular, we focus on confidence in one’s knowledge of college football teams’ past performance and correlate with risk taking in a sports betting context, as well as a desire for more information on teams’ past performance (information search) and use of that additional information (information use).
Risk taking. Risk taking involves engaging in behaviors that entail the possibility of loss, where the risk is accepted with the aim of achieving some benefit (Yates and Stone, Reference Yates and Stone1992). There is substantial evidence that confidence in one’s domain-specific knowledge is positively correlated with risk-taking behavior. For example, Hadar et al. (Reference Hadar, Sood and Fox2013) manipulated subjective financial knowledge and found that consumers who felt more knowledgeable about financial products were more willing to pursue risky investments, independent of their actual financial knowledge. Similar positive associations between subjective knowledge and risk taking have been documented in other domains (Larson et al., Reference Larson, Eastman and Bock2016; Sheffer and Loewen, Reference Sheffer and Loewen2019; Stone et al., Reference Stone, Luu, Costello and Somerville2023). However, there is also some evidence that subjective knowledge can increase perceived risk and thus risk reduction behavior (Manika et al., Reference Manika, Dickert and Golden2021).
Information search and use. Information search refers to actively seeking out additional information to aid a decision, such as consulting past data or looking up relevant statistics (Chin and Williams, Reference Chin and Williams2020). We distinguish information search from information use (Du, Reference Du2014; Stålnacke, Reference Stålnacke2019), whereas search refers to seeking out information, and use refers to the degree to which additional information influences one’s decision. Interestingly, separate research streams suggest that confidence is both positively and negatively related to information search and use (see Chin and Williams, Reference Chin and Williams2020).
One research stream suggests that confidence reduces both information search and use (Alba and Hutchinson, Reference Alba and Hutchinson2000; Dunning et al., Reference Dunning, Griffin, Milojkovic and Ross1990; Razmdoost et al., Reference Razmdoost, Dimitriu and Macdonald2015; Utkarsh et al., Reference Utkarsh, Sangwan and Agarwal2019). This work aligns with ‘feeling of knowing’ research, which posits that more confident individuals feel no need for additional information (Chin and Williams, Reference Chin and Williams2020; Schmidt and Spreng, Reference Schmidt and Spreng1996). Indeed, many studies have documented a negative relationship between confidence and information search or use (e.g., Radecki and Jaccard, Reference Radecki and Jaccard1995; Sieck and Arkes, Reference Sieck and Arkes2005; Stone et al., Reference Stone, Parker, Hanks and Swiston2023).
In contrast, some research has shown that confidence in knowledge increases intentions to search for information (Jamil et al., Reference Jamil, Hussain, Gul, Shahzad and Zubair2021; Zubair et al., Reference Zubair, Shabbir, Abro and Mahmood2019). This finding is in keeping with ‘Enrichment Theory’, which suggests that more objectively or subjectively knowledgeable individuals will be better able to process additional information and thus be more likely to seek it out (Chin and Williams, Reference Chin and Williams2020; Johnson and Russo, Reference Johnson and Russo1984).
1.2. Theorized psychological consequences
Here, we augment the above behavior-focused literature by examining a set of potential psychological consequences. These are motivated, in part, by a recent set of exploratory studies that explored the perceived consequences of high or low confidence, gathering qualitative insights from both JDM researchers and the general public (Parker et al., Reference Parker, Somerville, Stone and Kemmerly2025). The results of that work included three consequences that were commonly mentioned and thus are used in the current research: empowerment, decisiveness, and openness to new information.
Empowerment. As considered here, empowerment includes an internal sense of assuredness and motivation to move forward, as well as a tendency toward outgoing or outspoken behavior (Parker et al., Reference Parker, Somerville, Stone and Kemmerly2025). Although empowerment has received little attention within JDM research, both JDM researchers and the general public named it as a potential consequence of confidence (Parker et al., Reference Parker, Somerville, Stone and Kemmerly2025). From a psychological perspective, empowerment is commonly defined as ‘increased intrinsic task motivation’ (Thomas and Velthouse, Reference Thomas and Velthouse1990), related to self-efficacy or perceived competence (Bandura, Reference Bandura1982; Gist, Reference Gist1987; Spreitzer, Reference Spreitzer1995).
Decisiveness. We define decisiveness as the tendency to move quickly from evaluation to commitment when facing a decision (Parker et al., Reference Parker, Somerville, Stone and Kemmerly2025). Prior work has primarily studied decisiveness through the lens of indecisiveness (Patalano and Wengrovitz, Reference Patalano and Wengrovitz2007; Yates et al., Reference Yates, Ji, Oka, Lee, Shinotsuka and Sieck2010), often conceptualized behaviorally as difficulty making a choice (Frost and Shows, Reference Frost and Shows1993). In contrast, our focus is on the psychological experience of decisiveness—the subjective feeling of clarity and readiness to act. Indecisiveness has been negatively correlated with confidence (Ferrari and Dovidio, Reference Ferrari and Dovidio2001; Patalano and LeClair, Reference Patalano and LeClair2011), and Jackson et al. (Reference Jackson, Kleitman, Stankov and Howie2017) found that higher confidence, adjusting for knowledge, predicted higher decisiveness. Notably, decisiveness is not inherently beneficial or harmful; excessive decisiveness could presumably lead to premature commitment and avoidable errors, while insufficient decisiveness could lead to paralysis.
Openness to information. We define openness to information as a decision-specific, state-level willingness to consider new perspectives and information, including listening to others (Parker et al., Reference Parker, Somerville, Stone and Kemmerly2025). Our conceptualization is related to, but distinct from, broader trait-level constructs, such as actively open-minded thinking (AOT, Baron, Reference Baron1985, Reference Baron2008) in the JDM literature and the Big Five dimension of Openness to Experience (McCrae and Costa, Reference McCrae and Costa2003) in the personality literature. The limited research connecting these broader constructs to confidence has produced mixed findings: one study found that Openness to Experience provided little incremental validity in predicting self-confidence beyond cognitive ability (Kleitman and Stankov, Reference Kleitman and Stankov2007), while another found that openness predicted confidence but not overconfidence after adjusting for other Big Five traits (Schaefer et al., Reference Schaefer, Williams, Goodie and Campbell2004). However, because these studies examined trait-level openness rather than the context-specific willingness to consider new information that we focus on here, the relationship between confidence and openness in a particular decision context remains largely unexplored.
2. Confidence in knowledge versus forecasting
Our discussion so far has focused on confidence in knowledge, but an important comparison lies with a closely related construct: confidence in forecasting. Confidence in factual knowledge and forecasting may reflect different sources of uncertainty—internal uncertainty about one’s own memory versus external uncertainty about future events (Wright and Ayton, Reference Wright and Ayton1986)—and may therefore have different consequences.
Although a small body of work has examined calibration patterns of forecasting versus general knowledge tasks (e.g., Carlson, Reference Carlson1993; Fischhoff and MacGregor, Reference Fischhoff and MacGregor1982; Stone et al., Reference Stone, Luu, Costello and Somerville2023), to our knowledge no work has directly compared the consequences of confidence in knowledge versus forecasting tasks. For example, does the inherent randomness associated with forecasting (but not factual knowledge) weaken the link between confidence and downstream behavior? Accordingly, we examine whether the relationships between confidence and its psychological and behavioral correlates vary depending on whether confidence is assessed through factual knowledge or forecasting, but we have no specific predictions regarding this issue.
3. The current study
This study examines whether unjustified confidence is associated with the behavioral variables of risk taking, information search, and information use, and the psychological variables of empowerment, decisiveness, and openness to new information. Although some of these relationships have been studied previously, others remain relatively unexplored, and little work has examined them together in a single study. Testing them together allows for a more comprehensive assessment of how unjustified confidence relates to multiple processes within the same context.
We chose college football betting as the domain for this investigation for several reasons. First, the relevance of specific consequences of confidence may vary across contexts (e.g., risk taking may be less relevant when making nutritional choices than when playing blackjack), and college football provides a context wherein all the variables identified here are meaningful. Second, we expected college football to be of considerable interest to much of our participant pool and to produce substantial variability in participants’ knowledge of, and confidence about, the domain. Third, it enabled direct comparison between knowledge and forecasting tasks: the tasks were structurally identical but differed in whether participants judged past (knowledge) or future (forecast) events.
4. Method
The study comprised three main parts: (1) an assessment of knowledge (or alternately, forecasting) and associated confidence, (2) self-reports on a set of potential psychological consequences (empowerment, decisiveness, and openness to information), and (3) a behavioral performance task (sports betting), from which we measured risk taking, information search, and information use. These were all couched within a college football betting context. We preregistered our measures, data exclusion criteria, and variable calculation methods on OSF at https://osf.io/69hsk/.
4.1. Participants
One thousand nine hundred and seventy-six members of Qualtrics’ research panels responded to an initial recruitment email in September 2021. All participants took the survey between September 20 and 21, 2021, to ensure that everyone had access to the same information about college football teams’ current standings. As preregistered, these individuals were screened based on their interest in college football on a four-point scale from ‘none’ to ‘a great deal’, which was presented as a single item within a broader set of initial questions. We eliminated those individuals (n = 517) who responded ‘none’. Of the remaining 1459 individuals, 1118 consented to participate and finished the study. Participants were not aware that their response to the football interest question would determine eligibility for the full study.
We then applied our remaining preregistered exclusion criteria. First, we eliminated 72 participants whose survey completion time was less than half of the median completion time (see Maniaci and Rogge, Reference Maniaci and Rogge2014, for a justification of this methodology). Second, we eliminated 38 participants who provided implausible response patterns: (a) choosing either just the first or just the second team for all 40 items on the initial knowledge/forecasting section, (b) choosing the same response (with the exception of ‘moderately’) for all 18 self-report items, (c) choosing either just the first or just the second team on all 16 items of the behavioral performance task, or (d) not answering at least two questions on any of the three main sections (KCA/FCA, the self-report measures, and the performance task). To ensure complete data for all calculated outcome variables, we excluded an additional 11 participants beyond the preregistered criteria: nine who each did not answer yes or no to one of eight information search prompts (i.e., whether to pay to see past ranking information), and two due to data irregularities that prevented variable calculation. Our final analytic sample included 997 participants (for an overall 68.3% completion rate, among the 1459 eligible responders), giving us the ability to detect effects of r = 0.05 at 90% power.
4.2. Knowledge-confidence assessment and forecasting-confidence assessment
Respondents received either a knowledge-confidence assessment (KCA) or forecasting-confidence assessment (FCA), from which we measured participants’ confidence and their percent correct regarding which of two teams won/would win a college football game. The two instruments, designed to be parallel in structure and content, were each 40 questions long. All games were between NCAA Division I teams who had played against each other in the 2020–2021 season and were also playing against each other in upcoming games during the 2021–2022 season, which allowed use of the same pairings for both the KCA and FCA. We used a systematic sampling strategy to select 40 team pairings of varying difficulty. Teams were drawn from the Sagarin Top 100 rankings for the 2019–2020 and 2020–2021 seasons, and games were selected between teams within the same conference.
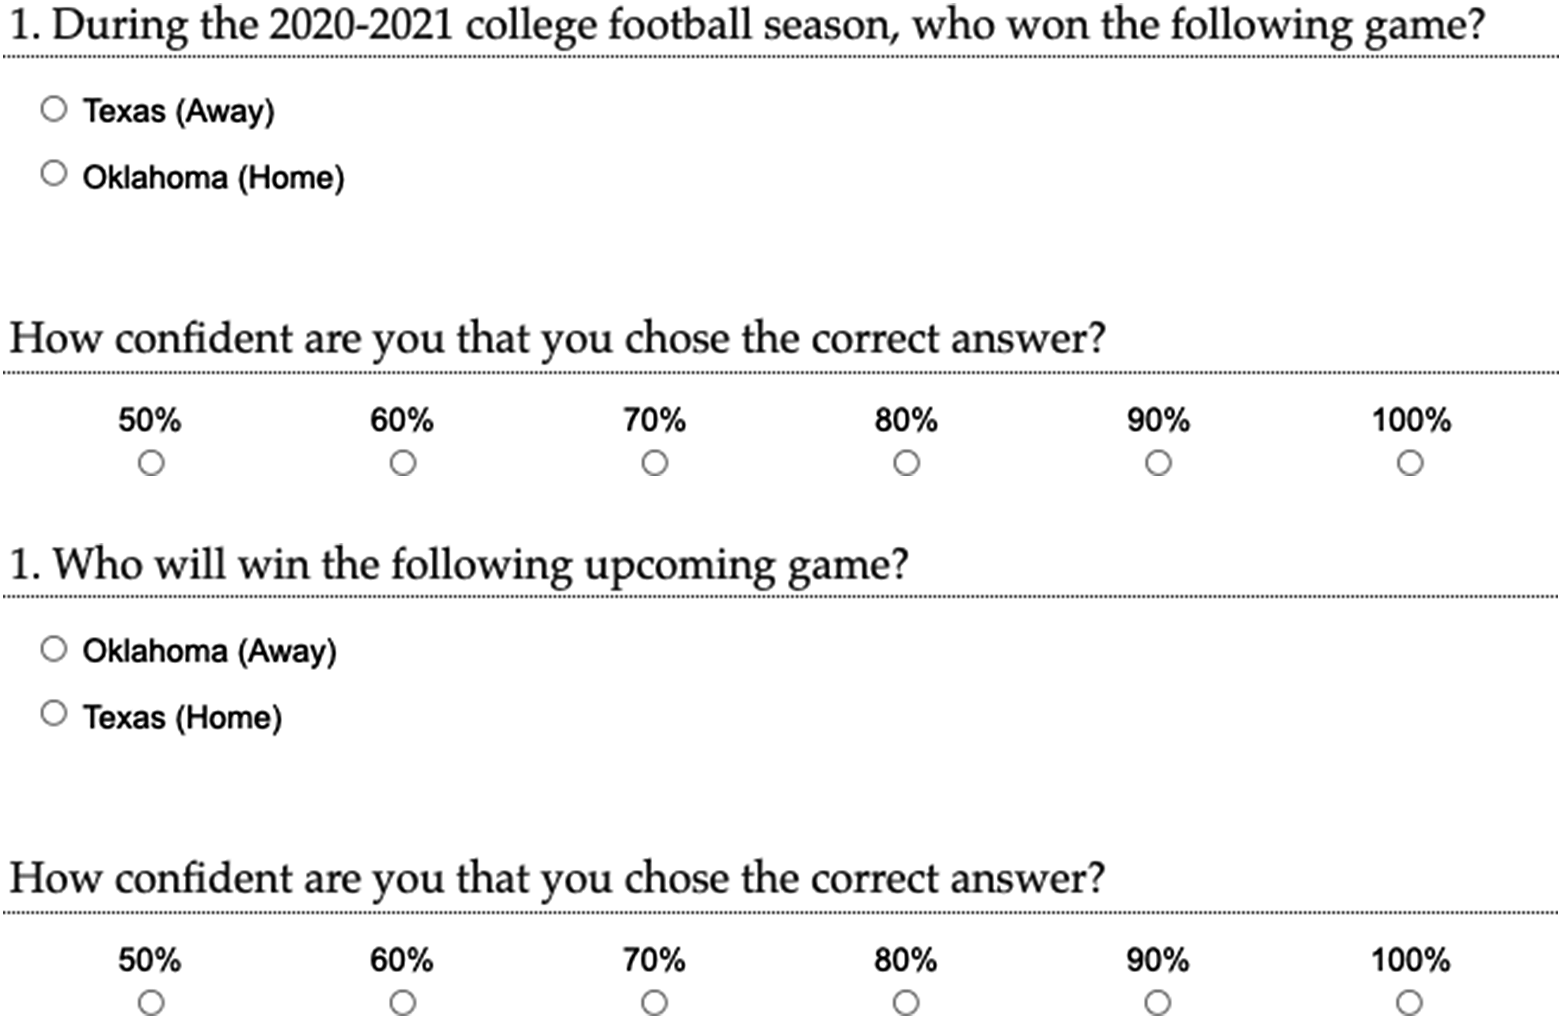
For the KCA, which focused on knowledge of past performance, each question asked which of two teams had won a game from the 2020–2021 college football season. After making this judgment, participants were asked to select, on a scale of 50% to 100% (in 10% increments), how confident they were that they chose the correct answer (see Figure 2a for an example). Detailed instructions walked participants through how to interpret the scale, including multiple specific examples (see online materials at https://osf.io/uvgh7/ for the full survey, including instructions). The FCA focused on predicting future games. Hence, it used the same team pairings, but for games upcoming during the 2021–2022 season. All upcoming games used in the FCA took place between September 25, 2021, and October 16, 2021. This relatively tight window ensured that participants’ knowledge would be relatively current for the games they were predicting. Participants predicted which of the two teams would win each upcoming game and then stated how confident they were in their prediction, using the same scale as for the KCA (see Figure 2b for an example). For each participant, we computed average confidence and percent correct across the 40 questions. Percent correct was the percentage of time the respondent chose the winning team, and average confidence was the average of their confidence judgments. As preregistered, if either the choice of who would win or their confidence judgment was missing for any of the responses, we counted both as missing and then calculated average confidence and percent correct across all non-missing items. In practice, missing data on the KCA/FCA were rare: 94%–95% of participants completed all 40 question-judgment pairs, and no participant missed more than 5 items.
(a) Sample KCA item. (b) Sample FCA item.

Figure 2 Long description
The image consists of two vertically stacked survey sections separated by white space.
Top Section (Panel a):
1. Question: During the 2020-2021 college football season, who won the following game?
Options:
- Radio button for Texas (Away)
- Radio button for Oklahoma (Home)
2. Confidence Question: How confident are you that you chose the correct answer?
Scale: A horizontal row of radio buttons labeled 50%, 60%, 70%, 80%, 90%, and 100%.
Bottom Section (Panel b):
1. Question: Who will win the following upcoming game?
Options:
- Radio button for Oklahoma (Away)
- Radio button for Texas (Home)
2. Confidence Question: How confident are you that you chose the correct answer?
Scale: A horizontal row of radio buttons labeled 50%, 60%, 70%, 80%, 90%, and 100%.
4.3. Psychological self-report measures
As noted earlier, a previous study collected qualitative data from a large and diverse sample of the general public and a sample of JDM researchers about their beliefs about the consequences of having high or low confidence in their knowledge. We used these data to construct three six-item scales measuring empowerment versus unempowerment, decisiveness versus indecisiveness, and openness versus closedness to information. This approach allowed us to choose phrases that people used frequently and to privilege their own words in doing so. Although there are previous scales on related constructs, they tap into constructs that are somewhat different from what we are interested in for this research.
All participants in the current study responded to the three scales. Scale questions asked, ‘Going into the prediction game, how much do you anticipate feeling…’ with an adjective or descriptive phrase that belonged to one of the three psychological constructs. This framing was designed to capture participants’ psychological states as they anticipated a specific decision context. Although responses will naturally be influenced by underlying dispositions, the context-specific framing allows us to examine whether these psychological states are associated with confidence within the same decision context. Within each measure, half of the descriptors were positively valanced, and half of the descriptors were negatively valanced. Response options ranged from 1 (not at all) to 5 (extremely).
4.3.1. Empowerment
The empowerment scale comprised the items ‘empowered’, ‘unmotivated’, ‘apprehensive’, ‘overwhelmed’, ‘motivated’, and ‘energized’, with ‘unmotivated’, ‘apprehensive’, and ‘overwhelmed’ reverse scored. The scale had a Cronbach’s alpha of .53.
4.3.2. Decisiveness
The decisiveness scale comprised the items ‘hesitant’, ‘comfortable making decisions’, ‘decisive’, ‘unsure about what choice to make’, ‘able to think quickly’, and ‘indecisive’, with ‘hesitant’, ‘unsure about what choice to make’, and ‘indecisive’ reverse scored. The scale had a Cronbach’s alpha of .66.
4.3.3. Openness to information
The openness to information scale comprised the items ‘open to new information’, ‘open to all options’, ‘uninterested in new information’, ‘stubborn’, ‘wanting to learn more’, and ‘resistant to new information’, with ‘uninterested in new information’, ‘stubborn’, and ‘resistant to new information’ reverse scored. The scale had a Cronbach’s alpha of .66.
4.4. Behavioral measures
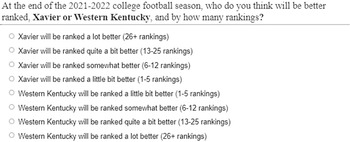
We measured risk taking, information use, and information search through a performance task.Footnote 1 The performance task had 16 rounds in which participants chose which of two football teams they thought would rank better at the end of the current season and then bet on those choices. Participants began with a bank of $20 of play money. To incentivize them to take the game seriously, one percent of participants received their total amount of play money in real money. For each of the 16 rounds, participants selected which of two NCAA Division I football teams would be ranked higher according to Sagarin ratings (Sagarin, Reference Sagarin2022) at the end of the 2021–2022 college football season and by how much (see Figure 3 for an example). Items for the performance task were chosen by randomly selecting 16 pairs of the 85 teams that had ranked in the top 100 in the Sagarin ratings for both the 2019–2020 and 2020–2021 years.
Sample performance task question.

Figure 3 Long description
The text at the top asks: At the end of the 2021-2022 college football season, who do you think will be better ranked, Xavier or Western Kentucky, and by how many rankings?
Below the question is a list of eight radio button options:
* Xavier will be ranked a lot better (26+ rankings)
* Xavier will be ranked quite a bit better (13-25 rankings)
* Xavier will be ranked somewhat better (6-12 rankings)
* Xavier will be ranked a little bit better (1-5 rankings)
* Western Kentucky will be ranked a little bit better (1-5 rankings)
* Western Kentucky will be ranked somewhat better (6-12 rankings)
* Western Kentucky will be ranked quite a bit better (13-25 rankings)
* Western Kentucky will be ranked a lot better (26+ rankings)
4.4.1. Risk taking
For each of the 16 questions, after making their final predictions, participants placed a bet between $0.10 and $1.00 (in ten-cent increments) on their prediction. If their prediction was correct (i.e., they chose the better-ranked team and the correct category of ranking advantage), they would win double their bet. If they answered one option away from correct (see Figure 3), they would neither win nor lose. If more than one option away, they would lose their bet. For each participant, we averaged the amount bet across all 16 questions as our measure of risk taking.
4.4.2. Information use
We assessed information use in the first eight rounds. To do this, after participants made their initial prediction, we provided them with the Sagarin ratings for the two teams in the previous (2020–2021) college football season. In these rounds, all participants were given this information and were asked if they would like to change their guess based on this information. Information use was measured as how much a participant shifted their rankings based on the information provided. More specifically, we used the equation

to calculate information use for each question. We conceptualized information use of 0 as ‘no use’ and 1 as ‘complete use’ of the information, and thus winsorized each item so it could not be less than 0 or greater than 1. The winsorization affected 30% of the observations for the KCA condition and 29% of the observations for the FCA condition (14% of KCA observations and 15% of FCA observations were undefined, as their initial ranking guess was equivalent to the previous year’s). We then averaged these eight to get an overall indicator of information use.Footnote 2
4.4.3. Information search
We assessed information search in the final eight rounds. Here, participants were given the option to see the past ranking information (i.e., the information we provided them for free for the first eight rounds) only if they paid 10 cents of their play money. Information search was calculated as the percentage of times a participant chose to see this information.
4.5. Procedure
The survey was programmed and administered in Qualtrics, optimized for both mobile and desktop viewing. Upon consenting to participate, participants were assigned via a randomized-block design into either the KCA or FCA conditions. After completing the KCA or the FCA, participants responded to the self-report measures of psychological variables and then completed the performance task. This ordering was designed to mirror the theoretical sequence depicted in Figure 1, proceeding from foundational assessments of knowledge and confidence, to psychological states, to behavior.
4.6. Analyses
To the extent that confidence and percent correct are correlated, any observed correlation between confidence and a hypothesized consequence could reflect knowledge and/or forecasting ability rather than confidence per se. Therefore, we used partial correlations adjusting for percent correct to assess the relationships between confidence and each of our outcome variables (i.e., unjustified confidence; Parker and Stone, Reference Parker and Stone2014). We analyzed the KCA and FCA groups separately and combined. To compare whether correlations were significantly different between the KCA and FCA, we used the equation provided by Levy and Narula (Reference Levy and Narula1978), which is specifically designed to compare partial correlations. Additionally, we conducted multiple regression analyses to examine the unique associations of confidence and the psychological variables with our behavioral outcomes.
5. Results
5.1. Percent correct and confidence
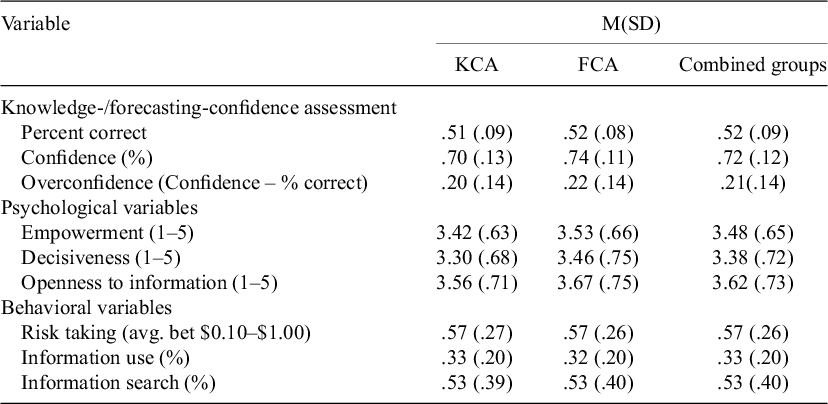
Across the KCA and FCA, participants selected the winning team on average 52% of the time,Footnote 3 compared to an average confidence of 72%, indicating substantial overconfidence. This overconfidence occurred in both the KCA and FCA, though there were some small differences between the conditions. As seen in Table 1, participants in the FCA condition were more confident (M = .74) than were participants in the KCA condition (M = .70), t (995) = 5.23, p < .001, with a moderate effect size, d = .33, 95% CI [.21, .46]. Percent correct was also slightly greater in the FCA condition (M = .52) than in the KCA condition (M = .51), t (995) = 3.53, p < .001, but with a smaller effect size, d = .22, 95% CI [.10, .35]. Because participants were moderately more confident but only slightly more correct in the FCA condition, there was more overconfidence in the FCA condition (M = .22, SD = .14) than in the KCA condition (M = .20, SD = .14), t (995) = 2.28, p = .01, though with a small effect size, d = .15, 95% CI [.02, .27].
Descriptive statistics

Table 1 Long description
The table is organized into four columns: Variable, K C A, F C A, and Combined groups. Data is presented as M S D.
Knowledge- or forecasting-confidence assessment category:
* Percent correct: K C A .51 .09, F C A .52 .08, Combined .52 .09.
* Confidence percent: K C A .70 .13, F C A .74 .11, Combined .72 .12.
* Overconfidence (Confidence minus percent correct): K C A .20 .14, F C A .22 .14, Combined .21 .14.
Psychological variables category (measured on a scale of 1 to 5):
* Empowerment: K C A 3.42 .63, F C A 3.53 .66, Combined 3.48 .65.
* Decisiveness: K C A 3.30 .68, F C A 3.46 .75, Combined 3.38 .72.
* Openness to information: K C A 3.56 .71, F C A 3.67 .75, Combined 3.62 .73.
Behavioral variables category:
* Risk taking (average bet 0.10 to 1.00 dollars): K C A .57 .27, F C A .57 .26, Combined .57 .26.
* Information use percent: K C A .33 .20, F C A .32 .20, Combined .33 .20.
* Information search percent: K C A .53 .39, F C A .53 .40, Combined .53 .40.
For the KCA condition, there was a small but significant positive correlation between confidence and percentage correct, r (498) = .15, p = .001. However, there was no significant correlation between confidence and percent correct for the FCA condition, r (495) = −.02, p = .60. These correlations were significantly different, z = 2.53, p = .01. Despite these differences, however, it is worth emphasizing that the same basic pattern emerged with both the KCA and FCA: participants were substantially overconfident, and there was at most a small positive correlation between confidence and percent correct.
5.2. Correlations between confidence and the psychological and behavioral variables
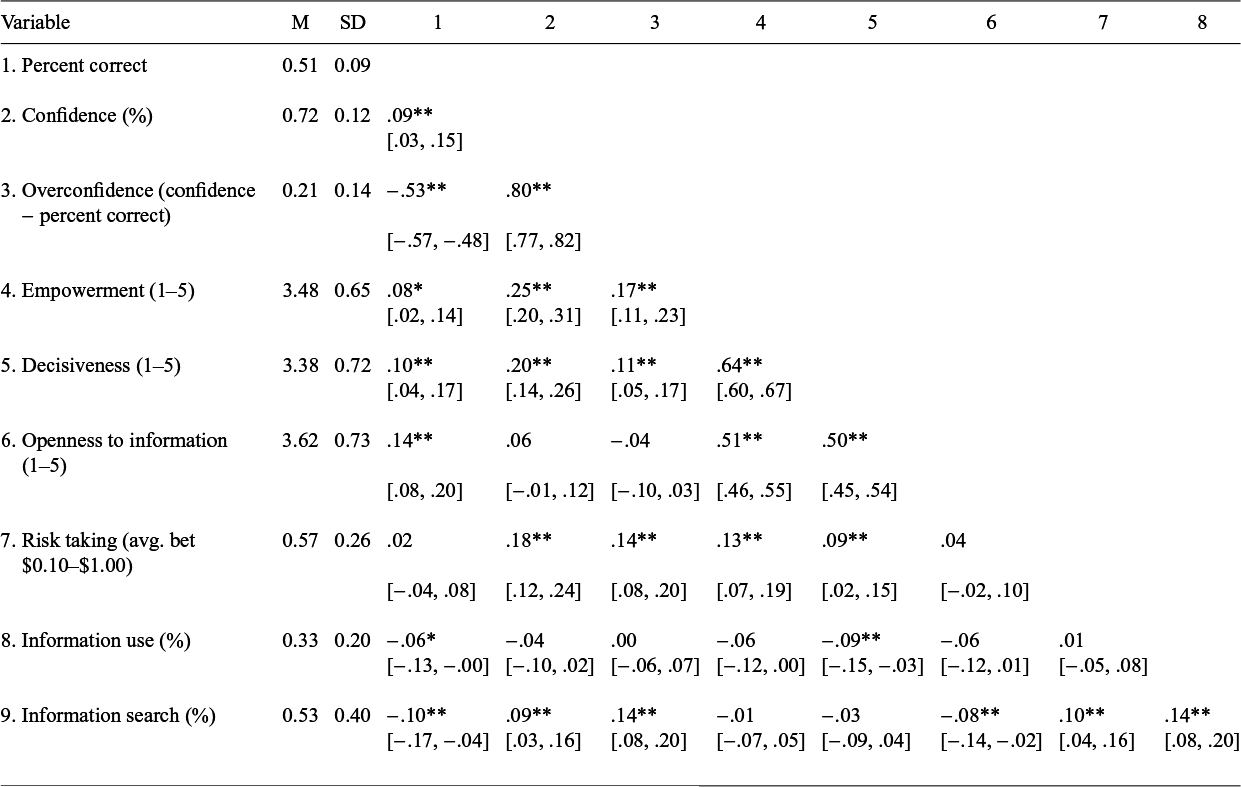
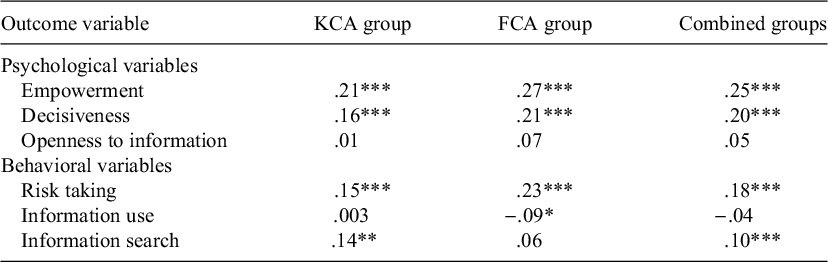
Table 2 presents the zero-order correlations between confidence and each of our psychological and behavioral variables with the KCA and FCA conditions combined, and Table 3 provides partial correlations between confidence and each of our psychological and behavioral variables adjusting for percent correct. Given the near-chance accuracy (M = 52%) and extremely low reliability of our accuracy measure (α = .17), our adjustment for percent correct has minimal practical effect. We retain this adjustment for consistency with our preregistered approach, while acknowledging this limitation (see Binnendyk and Pennycook, Reference Binnendyk and Pennycook2024, for discussion of similar issues).
Zero-order correlations between confidence and psychological and behavioral variables (for combined groups)

Table 2 Long description
A statistical table with 11 columns and 9 primary data rows. The columns are labeled Variable, M (Mean), S D (Standard Deviation), and numbered 1 through 8 corresponding to the variables.
Variables and their descriptive statistics (M, S D):
1. Percent correct: 0.51, 0.09.
2. Confidence (percent): 0.72, 0.12.
3. Overconfidence (confidence minus percent correct): 0.21, 0.14.
4. Empowerment (1 to 5): 3.48, 0.65.
5. Decisiveness (1 to 5): 3.38, 0.72.
6. Openness to information (1 to 5): 3.62, 0.73.
7. Risk taking (average bet $0.10 to $1.00): 0.57, 0.26.
8. Information use (percent): 0.33, 0.20.
9. Information search (percent): 0.53, 0.40.
Key Correlations (r values with 95 percent confidence intervals in brackets):
- Variable 2 and 1: .09** [.03, .15].
- Variable 3 and 1: -.53** [-.57, -.48]; Variable 3 and 2: .80** [.77, .82].
- Variable 4 and 2: .25** [.20, .31]; Variable 4 and 3: .17** [.11, .23].
- Variable 5 and 4: .64** [.60, .67].
- Variable 6 and 4: .51** [.46, .55]; Variable 6 and 5: .50** [.45, .54].
- Variable 7 and 2: .18** [.12, .24].
- Variable 9 and 8: .14** [.08, .20].
Note: *p < .05; **p < .01.
Note: Values in square brackets show the 95% confidence interval for each correlation. *p < .05; **p < .01.
Correlations between confidence and the psychological and behavioral variables, adjusting for percent correct

Table 3 Long description
The table consists of four columns: Outcome variable, K C A group, F C A group, and Combined groups.
Under the Psychological variables section:
- Empowerment: .21 for K C A, .27 for F C A, and .25 for Combined groups (all significant at p < .001).
- Decisiveness: .16 for K C A, .21 for F C A, and .20 for Combined groups (all significant at p < .001).
- Openness to information: .01 for K C A, .07 for F C A, and .05 for Combined groups (none significant).
Under the Behavioral variables section:
- Risk taking: .15 for K C A, .23 for F C A, and .18 for Combined groups (all significant at p < .001).
- Information use: .003 for K C A, minus .09 for F C A (significant at p < .05), and minus .04 for Combined groups.
- Information search: .14 for K C A (significant at p < .01), .06 for F C A, and .10 for Combined groups (significant at p < .001).
Note: N equals 997 for all variables.
Note: * p < .05; ** p < .01, *** p < .001. KCA/FCA combined group N was 997 for all variables.
5.2.1. Psychological variables
As seen in Table 3, there were significant correlations between unjustified confidence (i.e., average confidence adjusting for percent correct) and both empowerment and decisiveness, such that greater confidence in football-related knowledge corresponded to greater feelings of empowerment and greater feelings of decisiveness regarding the upcoming behavioral task, after adjusting for their actual percent correct. This was true for both the KCA and FCA, all partial r’s > .16, p’s < .001. In contrast, there was no relationship with openness to information in either the KCA or FCA, both partial r’s < .08, p’s > .11. There were no significant differences between the partial correlations for the KCA and FCA groups for any of the psychological variables, all z’s < 1, p’s > .17.
5.2.2. Behavioral variables
There were significant correlations between unjustified confidence and risk taking, information use, and information search, although the nature of these relationships varied somewhat across the KCA and FCA groups. For both groups, greater unjustified confidence was related to greater risk taking on the behavioral task: for the KCA, partial r = .15, p < .001, and for the FCA, partial r = .23, p < .001, with no statistically significant difference between the KCA and FCA correlations. Unjustified confidence was not significantly correlated with information use for the KCA group, partial r = .003, p = .95 but it was slightly negatively correlated with information use for the FCA group, r = −.09, p = .04, with the difference between these correlations approaching statistical significance, z = 1.46, p = .06. Finally, unjustified confidence was significantly positively correlated with information search for the KCA group, partial r = .14, p = .002, but not for the FCA group, partial r = .06, p = .17, with the difference between these correlations also approaching statistical significance, z = 1.25, p = .09.
5.3. Multiple regression analyses
To examine the unique associations of each predictor with our behavioral outcomes while controlling for the others, we conducted two separate multiple regression analyses. We focused on risk taking and information search as our primary behavioral outcomes. Information use was excluded from these analyses because many of the items comprising the information use index were either undefined or winsorized, as discussed above. Tables 4 and 5 present the results of the regression analyses.
Multiple regression analysis predicting risk taking from confidence and psychological variables

Table 4 Long description
The table contains six columns: Predictor, B, S E, beta, t, and p.
* Confidence: B = 0.35, S E = 0.07, beta = 0.16, t = 4.97, p < .001.
* Empowerment: B = 0.04, S E = 0.02, beta = 0.10, t = 2.26, p = .024.
* Decisiveness: B = 0.00, S E = 0.02, beta = 0.00, t = minus 0.01, p = .995.
* Openness to information: B = minus 0.01, S E = 0.01, beta = minus 0.02, t = minus 0.47, p = .637.
Model statistics provided in the footer: R super 2 = .042; Adjusted R super 2 = .038; F (4, 992) = 10.74, p < .001.
Note: R 2 = .042; Adjusted R 2 = .038; F (4, 992) = 10.74, p < .001.
Multiple regression analysis predicting information search from confidence and psychological variables

Table 5 Long description
The table consists of six columns: Predictor, B, S E, beta, t, and p.
* Confidence: B = 0.32, S E = 0.11, beta = 0.10, t = 2.95, p = .003.
* Empowerment: B = 0.01, S E = 0.03, beta = 0.02, t = 0.49, p = .627.
* Decisiveness: B = minus 0.01, S E = 0.02, beta = minus 0.01, t = minus 0.31, p = .759.
* Openness to information: B = minus 0.05, S E = 0.02, beta = minus 0.09, t = minus 2.42, p = .016.
Model statistics provided in the footer: R super 2 = .017; Adjusted R super 2 = .013; F (4, 992) = 4.26, p = .002.
Note: R2 = .017; Adjusted R 2 = .013; F (4, 992) = 4.26, p = .002.
The regression model predicting risk taking (Table 4) was statistically significant, F (4, 992) = 10.74, p < .001, R 2 = .042, adjusted R 2 = .038. Confidence showed the strongest unique association with risk taking (β = .16, p < .001), followed by empowerment (β = .10, p = .024). Neither decisiveness (β = .000, p = .995) nor openness (β = −.02, p = .637) showed significant unique associations with risk taking when controlling for the other predictors.
The regression model predicting information search (Table 5) was also statistically significant, F (4, 992) = 4.26, p = .002, R 2 = .017, adjusted R 2 = .013. Two predictors showed significant unique associations: confidence (β = .10, p = .003) and openness (β = −.09, p = .016). The association between openness and information search was negative, indicating that participants reporting greater openness to information actually searched for less information in the behavioral task. Neither empowerment (β = .02, p = .627) nor decisiveness (β = −.01, p = .759) showed significant unique associations with information search.
These analyses reveal distinct patterns of association for our two behavioral outcomes. While confidence was significantly associated with both behaviors, its relationship was stronger with risk taking (β = .16) than with information search (β = .10). Moreover, each behavior showed a unique secondary association: empowerment for risk taking and openness (negative) for information search. A canonical correlation analysis confirmed that these behavioral outcomes are predicted by distinct combinations of variables (see Appendix A).
6. Discussion
The ultimate aim of this program of research is to develop a comprehensive framework for the consequences of confidence. Confidence often only weakly reflects actual knowledge (Alba and Hutchinson, Reference Alba and Hutchinson2000; Light et al., Reference Light, Fernbach, Rabb, Geana and Sloman2022; Wells and Murray, Reference Wells, Murray, Wells and Loftus1984; Yates, Reference Yates1990), yet people frequently act on feelings of knowing (Griffin and Tversky, Reference Griffin and Tversky1992; Russo and Schoemaker, Reference Russo and Schoemaker1992). A central assertion of our framework is that confidence will be associated with both psychological and behavioral variables independent of how much one actually knows.
This study provides an important first step for developing this framework. Within a sports betting context, we found substantial positive associations between unjustified confidence and two psychological consequences—empowerment and feelings of decisiveness—both novel findings in this literature. Behaviorally, greater unjustified confidence was associated with greater risk taking, in line with prior research (e.g., Hadar et al., Reference Hadar, Sood and Fox2013; Larson et al., Reference Larson, Eastman and Bock2016). Greater unjustified confidence was also associated with greater information search, though this varied between the knowledge and forecasting conditions.
6.1. Psychological correlates of confidence
The positive associations between confidence and both empowerment and decisiveness extend our understanding of confidence beyond behavioral outcomes. These relationships suggest that confidence co-occurs with broader patterns of psychological states. Individuals with higher confidence anticipated feeling more empowered and motivated and also expected to feel more decisive and comfortable making decisions. These novel findings align with theoretical perspectives suggesting confidence reflects a general sense of competence and self-efficacy (Bandura, Reference Bandura1982).
In contrast, we found no association between confidence and openness to information, which was somewhat surprising given that all three psychological variables were moderately intercorrelated. This null finding suggests that while confidence relates to how empowered and decisive people feel, it may not relate to their receptiveness to new information, or that the relationship is more complex than a cross-sectional correlation can reveal.
Our measures of these psychological correlates were intentionally task-specific, asking respondents how they anticipated feeling in the subsequent behavioral task. That said, these task-specific variables likely correlate with long-term individual tendencies, in line with distributional theories of personality (Fleeson, Reference Fleeson2001).
6.2. Behavioral correlates of confidence
The positive association between confidence and risk taking replicates extensive prior work across domains (Fischhoff et al., Reference Fischhoff, Slovic and Lichtenstein1977; Montibeller and von Winterfeldt, Reference Montibeller and von Winterfeldt2015). Our multiple regression analyses revealed that both confidence and empowerment uniquely predicted risk taking, suggesting these constructs may represent distinct pathways to risk-taking behavior. The relatively modest effect sizes (R 2 = .042) indicate that many factors beyond confidence and psychological states influence risk-taking decisions, however.
The relationship between confidence and information search adds to a growing literature on this relationship. While some work suggests confident individuals search less for information (Radecki and Jaccard, Reference Radecki and Jaccard1995; Stone et al., Reference Stone, Parker, Hanks and Swiston2023), we found a positive association, particularly in the knowledge condition. This aligns with enrichment theory, which proposes that confident individuals may find it easier to process new information and thus seek it more readily (Chin and Williams, Reference Chin and Williams2020; Johnson and Russo, Reference Johnson and Russo1984). The inconsistency across studies may reflect domain-specific differences, variations in how information search is operationalized, or some yet undetermined difference.
In past work, information search and information use have often been treated as a single construct (e.g., Chin and Williams, Reference Chin and Williams2020). However, we found that unjustified confidence was related to increased information search but showed no consistent relationship with information use, suggesting that the mechanisms driving information seeking may differ from those governing how acquired information is used. Future research should continue to treat these as separate constructs.
6.3. Distinct predictors for risk taking and information search
A key finding from our multiple regression analyses was that risk taking and information search showed different patterns of predictors. While confidence predicted both outcomes, risk taking was uniquely associated with empowerment, whereas information search was uniquely (and negatively) associated with openness. This pattern, confirmed by canonical correlation analysis, suggests that future theories of the consequences of confidence will need to incorporate behavior-specific pathways rather than assuming uniform mechanisms. By examining multiple outcomes simultaneously, we uncovered patterns that might have been missed in narrower investigations, providing essential empirical constraints for future theory development.
The unexpected negative association between anticipated openness and information search deserves particular attention. One interpretation is that individuals who anticipated feeling open to information before the task felt less need to actively seek additional information during the task—perhaps viewing themselves as already sufficiently receptive. Another possibility is a disconnect between anticipated psychological states and actual behavior; participants may have misjudged how they would act when faced with a costly search opportunity. The moderate intercorrelations among psychological predictors (ranging from .496 to .639) also suggest potential suppression effects.
6.4. Knowledge versus forecasting confidence
We found remarkably similar patterns across knowledge and forecasting conditions, suggesting that confidence operates similarly whether uncertainty stems from memory limitations or future unpredictability (Wright and Ayton, Reference Wright and Ayton1986). However, there were subtle differences across conditions, particularly in information search patterns, warranting further investigation of how different sources of uncertainty influence confidence–behavior relationships.
6.5. Limitations
Several limitations qualify our conclusions. First and most critically, our correlational design cannot establish causal relationships. While theoretical considerations suggest confidence might influence psychological states and behaviors, our data are also consistent with reverse causation or common third variables. For example, a motivation to appear knowledgeable about football might lead one both to express confidence in one’s knowledge and to search out relevant information. Although the current studies are suggestive, experimental studies manipulating confidence would be useful to more definitively show causal relationships.
Second, the extremely low reliability of our accuracy measure (α = .172) undermines our ability to separate confidence from knowledge. Given that participants performed near chance (52% accuracy), our ‘unjustified confidence’ measure is virtually indistinguishable from raw confidence. This limitation highlights the need for tasks that produce greater performance variability and more reliable accuracy assessment (see Binnendyk and Pennycook, Reference Binnendyk and Pennycook2024).
Third, we relied on newly designed psychological measures based on findings from our prior study (Parker et al., Reference Parker, Somerville, Stone and Kemmerly2025), rather than previously validated scales such as those related to Actively Open-minded Thinking (Haran et al., Reference Haran, Ritov and Mellers2013; Janssen et al., Reference Janssen, Verkoeijen, Heijltjes, Mainhard, van Peppen and van Gog2020; Stanovich and West, Reference Stanovich and West2007). Our primary rationale for constructing new items was to maintain a parallel format across all three psychological measures while focusing respondents on the upcoming behavioral task, but this came at the cost of not leveraging existing validated instruments. Additionally, our self-report measures—particularly openness to information—may be susceptible to socially desirable responding, as participants may feel normative pressure to endorse willingness to consider new perspectives. The measures also showed only modest reliability, particularly for empowerment (α = .53). However, our associations remained significant despite these concerns, and we expect that more reliable measures would likely reveal even stronger relationships.
Finally, the benefits of investigating each of these relationships within one particular domain come at the cost of limiting generalizability of any particular finding. Our ultimate aim is to produce a domain-general theoretical framework for investigating the effects of confidence; however, it is important to emphasize that different relationships will hold in different contexts. This limitation does not hold just for the direct effects of confidence but also for the psychological–behavioral variable links. For example, we expect that feeling empowered will often lead people to take more risks, but in certain situations will lead them to be able to resist taking risks. Ultimately, we think the primary contribution of this work is to orient the researcher on what relationships will be fruitful to examine within the particular context of interest.
6.6. Future directions
Here, we discuss in more detail two directions that we think will be particularly fruitful.
First, and most critically, experimental studies that manipulate confidence are needed to test the causal relationships suggested by our correlational findings. Recent work from our group has developed and validated several approaches for manipulating confidence in knowledge without altering actual knowledge, including calibration training and false feedback techniques (Stone et al., Reference Stone, Parker, Somerville, Nixon, Kemmerly and Bongard2025). These methods could be applied to test whether experimentally induced changes in confidence produce corresponding changes in downstream psychological states and behaviors. Several of our findings would be particularly informative targets for such work—for example, the unexpected positive association between confidence and information search, which runs counter to the dominant ‘feeling of knowing’ prediction, and the novel associations between confidence and both empowerment and decisiveness, which have not previously been documented.
Second, the psychological variables examined here—empowerment, decisiveness, and openness to information—represent a relatively unexplored dimension of the consequences of confidence. Future work should develop more refined and validated measures of these constructs as they relate to confidence in specific decision contexts, addressing the modest reliabilities observed here. Additionally, examining whether these psychological states function as mediators between confidence and behavioral outcomes would help clarify the pathways through which confidence influences decision making. Investigating these relationships across different domains would test the generalizability of the patterns we observed and help identify which associations are robust features of confidence and which are specific to the sports betting context.
7. Conclusion
Building on prior work examining consequences of confidence in a single domain (e.g., Razmdoost et al., Reference Razmdoost, Dimitriu and Macdonald2015; Stone et al., Reference Stone, Parker, Hanks and Swiston2023), this study documented associations between unjustified confidence and both psychological states (empowerment and decisiveness) and behavioral outcomes (risk taking and information search). The distinct predictor patterns for different outcomes suggest that developing a comprehensive theory of the consequences of confidence will require behavior-specific pathways rather than assuming uniform effects across all outcomes. While our correlational design cannot establish causation, this foundational work serves at least essential functions: identifying which theorized relationships actually exist, revealing complex patterns across multiple variables, and providing effect size estimates for future experimental research. Ultimately, we hope that this work and that of other researchers can be used to develop a comprehensive theory of the consequences of confidence.
Data availability statement
Raw (but deidentified) data supporting the conclusions of this article are available in the paper’s repository on the Open Science Framework at https://osf.io/uvgh7/. The dataset includes all participant responses before any exclusions, along with calculated variables used in analyses. A data dictionary explaining all variable names is also available in the repository.
Acknowledgements
We would like to thank Brooke Nixon and Olivia Zhang for their helpful comments on this manuscript.
Funding statement
This paper is based on work supported by the National Science Foundation under Grant No. SES 1921489. Any opinions, findings, and conclusions or recommendations expressed in this material are those of the authors and do not necessarily reflect the views of the National Science Foundation.
Competing interest
The authors have no competing interests to declare.



 Open access

