A key insight from the literature on the intersectionality of gender, class and ethnicity is that each marginalized group contains within it hierarchies and power struggles, and that different forms of discrimination interact with each other (see Crenshaw Reference Crenshaw1989; McCall Reference McCall2005; Young Reference Young1997). Quotas for women and ethnic minorities are implemented to increase the diversity in political institutions, but as they usually target only one group at a time they may end up reinforcing within-group inequalities by increasing the numerical presence of one under-represented group at the cost of another.
Work on quotas for both gender and minorities has found that subgroups that face ‘double barriers’, such as minority-group women, in some cases fall between the cracks and fail to gain representation either as women or as minorities (Darcy et al. Reference Darcy, Hadley and Kirksey1993; Hancock Reference Hancock2007; Huang Reference Huang2012). However, under other circumstances minority-group women have been found to be included in higher numbers than minority-group men, as parties can cash in the ‘complementarity bonus’ of being able to count someone as both a woman and a minority (Celis et al. Reference Celis, Erzeel, Mügge and Damstra2014). Looking at different combinations of quotas, Hughes (Reference Hughes2011) found that minority-group women tend to be disadvantaged by single-dimension quotas for women or minorities, but that they are over-represented compared with other women when there are ‘tandem’ quotas for both women and minorities at the national level.
In this article I build on these insights by showing how the intersectional effects of quotas may also vary within the same institutional context, as changes in the pressure to include excluded groups interact with the informal opportunity structures within political parties. I demonstrate this with data from India, by looking at how the minority quotas for Scheduled Castes (SCs, the former ‘untouchables’) and Scheduled Tribes (STs) have interacted with the efforts to bring more female candidates into the elections of India’s state assemblies and federal parliament. Using a complete data set of the more than 450,0000 candidates running in India’s state assembly elections and more than 77,000 candidates running for federal parliamentary elections during the period 1961–2015, I show that women were nominated at somewhat lower rates to seats reserved for SCs and STs than to other seats in the early 1960s, at similar rates in the 1970s and 1980s, and at considerably higher rates in the 1990s and 2000s. In fact, much of the increase in the nomination of female candidates in India in recent years has occurred in reserved constituencies.
These nomination patterns may in part be understood to be a result of parties resisting changes to existing power hierarchies: as the pressure on parties to nominate more women has intensified, they have (whether strategically or not) responded by nominating female candidates at the cost of their least powerful male politicians – SC and ST men. However, as reserved constituencies tend to be less competitive and less dominated by ‘money and muscle’ politics, the increase in women in these constituencies can also be seen as evidence that quotas for ethnic minorities have created a political space that is more accessible to women. The findings in this article therefore point to important questions about how the informal practices within parties impede the political empowerment of both women and minority groups in India.
THE POLITICAL INCLUSION OF WOMEN AND ETHNIC MINORITIES
Over the last few decades there has been a dramatic increase in the interest in the ‘descriptive’ representativeness of democratic institutions (the extent to which elected politicians reflect the demographic characteristics of the population electing them) (Krook Reference Krook2006; Pitkin Reference Pitkin1972). Although the claims for inclusion of women and minority groups have clear similarities, they have often been discussed separately, in both academic circles and the policy world (Bird Reference Bird2014). The failure to coordinate these struggles for a political presence has meant that scholars and activists alike to a limited extent have focused on the intersectional consequences of the efforts to empower one group or another.
An important insight of the intersectional literature is that various dimensions of inequality may interact and reinforce each other (Crenshaw Reference Crenshaw1989; Hancock Reference Hancock2007; McCall Reference McCall2005; Young Reference Young1997). ‘Groups’ such as women and minorities are never homogeneous, but rather have several internal conflicts and within-group inequalities. Policies meant to benefit a single group may therefore end up benefiting only the most powerful segment of the group. This has been observed across the world, for example, in the case of the US, where efforts to redistrict to improve the political presence of black politicians improved the election of black men more than black women (Darcy et al. Reference Darcy, Hadley and Kirksey1993). In work on Taiwan, Huang (Reference Huang2012) similarly found that indigenous women have fallen between the cracks of the separate quota systems for women and indigenous groups, as feminists have seen their representation as an indigenous issue and indigenous activists have seen it as a feminist issue.
But the predictions of differently designed quota systems are not so straightforward. Recent work on the effects of gender quotas on the inclusion of minority-group women has shown that under some circumstances they may end up being elected in higher numbers than minority-group men, because they can boost the diversity statistics of political parties by being counted both as women and as minorities (Celis et al. Reference Celis, Erzeel, Mügge and Damstra2014). Similarly, in this article I try to explain why minority-group women have been nominated in higher numbers than majority-group women in India in recent years.
In a study of the political presence of women and minorities across 81 countries, Hughes (Reference Hughes2011) was able to explain many of the seemingly contradictory findings from across the world by theorizing about how different combinations of quotas tend to have different intersectional effects. She found that as stand-alone policies, both gender quotas and minority quotas increase the presence of minority women, but to a lesser extent than for majority-group women and minority-group men. ‘Tandem quotas’ (national-level quotas for women and minorities), on the other hand, were found to benefit minority-group women the most, as these women could get to power at the cost of majority-group women or minority-group men, while unseating few majority-group men. The key mechanism in this story is how different institutional configurations of quotas create different incentives for parties in their candidate selection process.
In this article I build on Hughes’s insights about the intersectional effects of different institutional arrangements of quotas by demonstrating how such intersectional effects may take place without altering formal institutions, as changes in the political mobilization around a group identity interact with the existing opportunity structures within political parties.
In most countries, the party leadership plays a key role in selecting candidates (Bille Reference Bille2001), thereby acting as the main gatekeeper to elected office (Lovenduski and Norris Reference Lovenduski and Norris1993). Faced with mandatory electoral quotas, political parties have to field candidates with certain characteristics. In addition, however, parties are faced with a range of other expectations of who to field, and these decisions are the subject of constant scrutiny by party members, activists, the media and voters.
Worried about losing political support, parties will be sensitive to changes in the social expectations of who they should field as candidates. The responsiveness of political parties to such pressures is evident in the gradual introduction of voluntary party quotas in the northern European countries in the 1970s and 1980s (Bergqvist Reference Bergqvist1999; Lovenduski and Norris Reference Lovenduski and Norris1993; Skjeie Reference Skjeie1991). Facing additional pressures to include candidates with characteristics that mirror the population at large, parties now make efforts to present lists of candidates, and also cabinets, that include not only men and women, but also different age categories, regions and minority groups. Reporting from interviews with party officials in Belgium and the Netherlands, Celis et al. (Reference Celis, Erzeel, Mügge and Damstra2014) explained how young ethnic-minority women end up being recruited in higher numbers than ethnic-minority men exactly because parties are trying to solve this ‘intersectional puzzle’ of fielding candidates with ‘diverse’ characteristics.
What these findings show is that as the pressure on political parties to include candidates with more ‘diverse’ characteristics increases, they are incentivized to field candidates with multiple such characteristics in order to be able to double-count them. In addition, however, the inclusion of one traditionally marginalized group is likely to affect the inclusion of other groups by altering the opportunity structures within parties. As suggested in the introduction to this special issue, neither formal institutions nor informal practices within parties are neutral, but rather reflect and reinforce power inequalities in society (Kenny and Verge Reference Kenny and Verge2016, in this issue). The dynamics surrounding the inclusion of one traditionally marginalized group in political parties will therefore inevitably affect the inclusion of other marginalized groups. In India, the country of focus in this article, I will suggest that we need to look both at the changing incentives for parties created by the mobilization of women, and at the political environment in areas reserved for minorities, in order to understand the intersectional patterns of how women and minorities are nominated. Before elaborating further on these arguments, the next section will provide a brief history of the quota debate in India.
THE QUOTA DEBATE IN INDIA
The low numbers of women in elected office has been a major topic of discussion in India during the last couple of decades. In 1993, a constitutional amendment was passed that reserved one-third of all elected positions in local-level politics for women, and in 1996 another bill was proposed to also reserve positions for women in India’s state assemblies and the federal parliament.Footnote 1 Many hoped this ‘Women’s Reservation Bill’ would pave the way for more women in Indian politics. But, although all the main political parties have proclaimed their support for the bill, various obstacles have prevented it from being passed in the lower house of parliament. According to Margaret Alva, a senior female politician in India’s erstwhile dominant party, the Indian National Congress (henceforth the Congress Party), this is simply a result of male MPs worrying about losing their positions: ‘They keep saying, “Do you want to leave your seat? If you vote for this bill your seat will go”’ (quoted in Nath Reference Nath1996: 9).
Electoral quotas have played an important role in the political history of India. The discussions about quotas go back to at least 1905, when the British viceroy of India promised a delegation of Indian Muslims to safeguard their political rights through communal representation (Minto Reference Minto1934: 47). Since then, a debate has raged about which groups should be entitled to quotas, how many seats can reasonably be parcelled out to quotas, and for how long such policies should be kept in place (Galanter Reference Galanter1984).
The first official demands for the inclusion of women in Indian politics were made by women’s groups in 1917 (Guha 1974: 284). This was in reaction to the ongoing reforms to gradually develop self-governing institutions in India. The first round of reforms in 1909 had made it possible for Indians to be elected to various legislative councils in British India, and discussions were ongoing about who should represent whom and how they were to be elected. Not only Muslims, but also other religious groups, the ‘depressed classes’ (the SCs), and several economic interest groups (such as merchants) were demanding the right to elect group-wise representatives (Jensenius Reference Jensenius2015a). The women’s groups did not demand quotas at that point, but demanded that women should be granted the same political rights as men.
The claim for equal political rights for women found support in the Indian political elite, and already in 1918 the Congress Party, the India Home Rule League and the Muslim League approved resolutions supporting women’s franchise (Roy Reference Roy2005: ch. 4). However, the British rejected the demands on the grounds that the social conditions in India made it ‘premature’ to give the vote to women (Simon Reference Simon1930: 49). In the end, the Government of India Act of 1919 made the vote for women a ‘domestic’ matter, thereby leaving the choice of the female vote to the new elected assemblies (Simon Reference Simon1930: 49). During the 1920s, a small group of women were subsequently given the right to vote, and also to be nominated for political office, across much of India, based on criteria of wifehood, education and property (Guha 1974: 284).
The discussions about how to ensure the inclusion of various groups in the new elected assemblies and groups ran for decades. The Congress Party and Gandhi were strongly opposed to quotas of any kind, particularly for the SCs, while the British tried to accommodate various demands in order to maintain control of their increasingly rebellious colony. In the Government of India Act of 1935, the first ‘draft constitution’ of India, reserved seats were granted to SCs, various other minority groups, and also to women, in both the upper and lower house of the Federal Legislature of British India (GOI 1942: 218–20). Seats were also reserved for women in the provincial Legislative Assemblies, with sub-quotas for Sikhs, Muslims, Anglo-Indians and Indian Christians (GOI 1942: 240).
The reserved seats for women were supported by British feminists like Eleanor Rathbone, but were opposed by the main Indian women’s associations and by the Congress Party, on the grounds that women should be able to be elected on an equal footing as men (Htun Reference Htun2004: 447). After many rounds of discussions of quotas for minorities, religious groups and women, the Indian Constituent Assembly ended up granting electoral quotas only to the former untouchables (SCs) and tribal groups (STs). These two groups were given reserved seats in India’s parliament and state assemblies in proportion to their share of the population in each state (approximately 16 per cent and 7 per cent on average, respectively).
The quotas for SCs and STs were designed as reserved seats that were to be rotated. India has single-member electoral constituencies, and only people who can document that they are SC or ST can run for election in constituencies reserved for SCs or STs, respectively, while people from all groups can vote. This design of the quota system has meant that SC and ST politicians for the most part have become integrated into mainstream political parties and tend to follow the party line rather than work for group-specific interests (Jensenius Reference Jensenius2015b). But there are also some differences between reserved areas and other areas: SC and ST reserved constituencies are less competitive than other constituencies, SC and ST politicians are often talked of as ‘weaker’ than other politicians, and despite holding important positions of power they continue to face subtle forms of discrimination (Jensenius Reference Jensenius2013).
Whereas the SCs and STs were granted quotas in the Indian Constitution, women were not given any institutional safeguard to guarantee their political presence. In the 1950s and 1960s, the Congress Party – which was the dominant party during those years – operated with an informal 15 per cent party quota for nominating women candidates in elections (Katzenstein Reference Katzenstein1978). Studying the nomination process of Congress in the national election of 1966, Kochanek (Reference Kochanek1967: 293) reported that the Central Election Committee ‘urged the provincial election committees’ to ensure ‘adequate representation’ of women and minorities. Nevertheless, as the data later in this article will show, this intra-party quota was never effectively implemented.
Other political parties nominated very few female candidates during the first decades after independence, and the women who were nominated were often wives, widows, daughters or protégés of powerful male politicians (Stern Reference Stern2003). This dynastic trend may not be as strong as before, but it is still prevalent: between 2004 and 2014 two-thirds of all the female MPs had family members who had preceded them in politics (in comparison to 25 per cent of the male politicians) (Basu Reference Basu2016).
Until the 1970s, the main women’s organizations in India remained opposed to the idea of reserved seats for women (John Reference John2000: 3822). However, the discussion about quotas for women re-emerged in 1974, when the government of India formed the Committee on the Status of Women, with the mandate of proposing recommendations for improving the rights and opportunities of women in India (Htun Reference Htun2004: 447). The report was meant to be launched for the International Women’s Decade 1974–85 proclaimed by the United Nations. Among other topics, the committee considered the issue of quotas for women in India’s legislative assemblies but rejected the idea on the basis that women are a category, not a community. The committee did, however, propose to establish all-women elected councils at the village level, which would manage and administer welfare and development programmes for women and children. They also recommended that all political parties should adopt internal party quotas for elections to the state assemblies and federal parliament (Guha 1974: 305).
The party quotas never saw the light of day, but several states initiated reforms that included reserving positions for women in local-level politics. Ramakrishna Hegde’s government in the southern state of Karnataka started drafting a reform bill with 25 per cent of the elected positions reserved for women already in 1983. A similar provision was recommended for the whole country in the National Perspective Plan 1988–2000, and was followed up in 1993, with the 73rd and 74th Constitutional amendments providing for one-third reserved seats for women in all local-level elected bodies. The policy was hardly discussed in parliament before it was passed (Lama-Rewal Reference Lama-Rewal2005: 192) and met with almost no political opposition (Kishwar Reference Kishwar1997: 9). This is typically explained by the fact that local-level quotas would not affect the power of national-level politicians. During the 1990s, local-level quotas were gradually implemented across Indian states and have brought hundreds of thousands of women to power in their villages, blocks and districts. In national and state-level politics, women have remained under-represented.
The relatively easy passage of the quotas for women at the local level inspired women’s groups to press for reservations for women to India’s state assemblies and federal parliament (Krook Reference Krook2009: 91). In response, all the major political parties made statements supporting reservations for women in their electoral manifestos, and it was included in the Common Minimum Programme of the Congress-led government coalition United Front, which came to power in 1996.
The Women’s Reservation Bill was introduced as the 81st Constitutional Amendment Bill in 1996. Despite widespread public support for it, the parliamentary debates over it were ferocious, with ‘some MPs almost coming to blows and others rushing to the podium to tear up copies of the text’ (Htun Reference Htun2004: 448). One of the main arguments against the bill was that it would mainly result in the election of women from the most privileged strata of society and that it needed to be changed to include sub-quotas for non-elite groups – the so-called ‘Other Backward Classes’ (OBCs) – an argument about intersectionality. The bill has also been criticized for suggesting a rotation of reserved seats, as this would undermine the ability of women to build a strong support base (Menon Reference Menon2000). However, many have interpreted the ongoing discussions as an attempt by male politicians to stop the bill from being passed (Samujh Reference Samujh2005: 265).
THE NOMINATION OF WOMEN IN INDIAN ELECTIONS
Indian politics is both a male-dominated and competitive environment. At the time of every election a large number of candidates try to gain ‘a ticket’ from the main political parties, and there are intra-party struggles about which factions are given which seats. The fight for tickets are often related to ‘money and muscle’ (Vaishnav Reference Vaishnav2012) and whether candidates are able to show a strong political following.
In recent years, parties have faced increasing pressure to field more female candidates. Around the time of any election there is a slew of news articles pointing out the low percentages of women being nominated for election. For example, in a Times of India article called ‘What Empowerment?’, examples were given of female politicians who had worked hard but still been denied the right to run for election for their party (Mathur Reference Mathur2014). Similarly, in the article ‘Women Get a Raw Deal from Parties in Ticket Distribution’, published shortly before the 2014 parliamentary elections in India, the newspaper Mint listed and discussed the percentage of female candidates fielded by all the main parties fighting the election (Bhandare and Katarki Reference Bhandare and Katarki2014).
India has a fairly centralized form of candidate nomination, with the party leaderships playing an important role in the selection of candidates (Farooqui and Sridharan Reference Farooqui and Sridharan2014), and there seem to be systematic differences in how male and female potential candidates are treated. In an interview, the female Congress politician Margaret Alva lamented that the party leadership always ask about the ‘winnability’ when a woman is suggested as a candidate, while they do not ask the same questions of potential male candidates (cited in Nath Reference Nath1996: 8). A study of the nomination patterns in the 2009 parliamentary election in India concluded that parties are risk averse when they field women and that they tend to field mainly experienced female politicians and preferably in party strongholds (Spary Reference Spary2014). These findings align well with qualitative accounts of how women tend to be nominated in constituencies that are deemed ‘suitable for ladies’ (Singer Reference Singer2007).
To look more systematically at the nomination patterns for female candidates in India, I use a new data set that covers all of the candidates running in 303 state assembly elections held between 1961 and spring 2015, as well as 13 federal parliamentary elections held between 1962 and 2014.Footnote 2 The state assembly-level data set includes information about the approximately 450,000 candidates running for election in the more than 4,300 state assembly constituencies (electoral districts) across the country during this period, including 21,207 (or about 4.7 per cent) female candidates. The parliamentary election data include information about the approximately 77,450 candidates running for election in India’s 543 parliamentary constituencies between 1962 and 2014, including 3,592 (or 4.6 per cent) female candidates.
For each constituency, the data include information about the number of electors, the number of candidates running for election and the vote share of each of those candidates. The data also include information about the name and sex of the candidate, as well as the party the candidate ran for in that election. Both data sets cover elections for all of India’s 28 states and two union territories.Footnote 3
Looking at these election data from 1961 to 2015, we can see that there has been a very gradual increase in the percentage of both female candidates and female winners in Indian elections over time. Figure 1 shows the percentage of female members of legislative assemblies (MLAs) and female candidates in India’s state assembly elections. Here the data are divided into groups of years: Indian states hold elections approximately every five years, and since 1971 these elections have been stacked so that different states hold elections at different times.Footnote 4 Plotting the data by year would pick up differences in states rather than a time trend; the data have therefore been divided into groups of years that roughly correspond to when states held elections.
Percentage of Female Members of Legislative Assemblies and Female Candidates in India’s State Assembly Elections, 1961–2015

As we can see in Figure 1, less than 2 per cent of the candidates in Indian state assembly elections in the 1960s were women. Those women who ran for election were, however, more successful than male candidates; in the elections held between 1961 and 1967 women constituted 3.7 per cent of the MLAs. This figure fell to an all-time low of 1.6 per cent women among the candidates and 2.7 per cent women among the members of legislative assemblies between 1968 and 1973, and since then the numbers have been increasing at a low rate. We see a boost in the percentage of elected women in the 1980–5 period, mostly due to the sympathy wave of voting for female Congress candidates in the elections directly following the assassination of the female prime minister Indira Gandhi in 1984. The main increase in the percentage of female candidates, however, occurred from the mid-1990s, when the discussion about including more women in politics intensified. Still, the percentage of female candidates has never been particularly high and even in the last reported period (2011–15), women constituted only 7.3 per cent of the candidates and 8.4 per cent of elected members of legislative assemblies. It should be noted, however, that the absolute numbers of both male and female candidates have increased considerably over this period.
Figure 2 shows the percentage of female MPs and female candidates in India’s parliamentary elections over time. Whereas the percentage of elected female MPs in India’s first parliaments in the 1950s was about 4.5 per cent (not included in Figure 2) and then increased to 6.3 per cent in the 1962 elections, the numbers then dropped to 5.8 per cent in 1967 and to 3.5 per cent in 1977 (data on the 1971 election could not be included, see endnote 2). Subsequently, there has been a very gradual increase in the proportion of female MPs. An exception to the overall trend was again the 1984 election, when an unprecedented number of female candidates from the Congress Party were elected (38 out of their 42 female candidates) following the assassination of Indira Gandhi in 1984. Subsequently, there has been a very gradual increase in the proportion of female MPs. In the 2009 election the percentage of women in India’s parliament passed the 10 per cent mark for the first time, and in the 2014 elections 11.4 per cent of the elected representatives were women.
Percentage of Female Members of Parliament and Female Candidates in India’s Federal Parliamentary Elections, 1962–2014
Looking at the female candidates, however, we see a complete stagnation in the nomination of female candidates at just over 3 per cent from 1962 all the way until the 1998 election. It was soon after the 1996 election that the Women’s Reservation Bill was proposed in parliament, and it was in the 1990s that all the major parties publicly committed to increasing the percentage of elected women in politics. The increase in female candidates in the 1998 elections is therefore probably a result of these discussions. Since the focus of this article is on where and when parties have chosen to field women, I will focus on candidate nomination patterns (not whether or not the candidates won the election) in the rest of the article.
MINORITY QUOTAS AND WOMEN
So are there differences in the nomination patterns for women in non-reserved and reserved constituencies? For each round of elections covered by the data set, the more than 4,300 state assembly constituencies include about 650 constituencies reserved for SCs and about 300 reserved for STs. The 543 parliamentary constituencies include 84 constituencies reserved for SCs and 47 reserved for STs.
Figures 3 and 4 show the percentages of female candidates in India’s non-reserved, SC reserved and ST reserved constituencies between 1961 and 2015. The two vertical lines in the figures mark the time of the formation of the Committee on the Status of Women in the 1970s and the introduction of the Women’s Reservation Bill in the 1990s that called for reserved seats for women in the state assemblies and in parliament.
Percentage of Female Candidates in Non-Reserved, Scheduled Caste (SC) Reserved and Scheduled Tribe (ST) Reserved State Assembly Constituencies, 1961–2015
Percentage of Female Candidates in Non-Reserved, Scheduled Caste (SC) Reserved and Scheduled Tribe (ST) Reserved Parliamentary Constituencies, 1962–2014
What the figures show is that the percentage of nominated women was slightly lower in reserved constituencies than in non-reserved ones in the early 1960s, about the same in the 1970s and 1980s, but that more women have been nominated in reserved constituencies than in non-reserved ones in the 1990s and 2000s. By the last round of elections included in the data set, the percentage of female candidates was 6.6 in non-reserved state assembly constituencies, 10.3 in constituencies reserved for SCs and 9.1 in constituencies reserved for STs. In the last parliamentary election, in 2014, the percentages of female candidates were 7.0, 8.7 and 10.4 in non-reserved, SC reserved and ST reserved parliamentary constituencies, respectively.
The figures reveal that minority-group women have not been disadvantaged compared with other women when it comes to being nominated for office. Rather the opposite: in recent years much of the increase in the nomination of women has occurred in electoral districts reserved for minority groups.
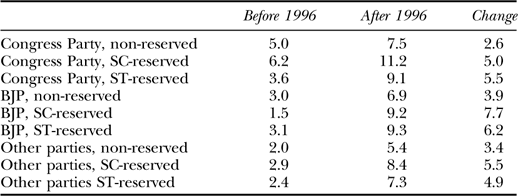
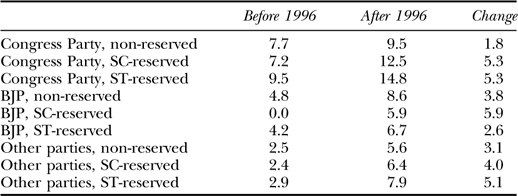
Are these patterns driven by changes in any particular party? Tables 1 and 2 show the average percentages of female candidates fielded by the Congress Party, India’s dominant right-wing party the Indian People’s Party (Bharatiya Janata Party – BJP), and other political parties before and after 1996, the year the Women’s Reservation Bill became a key part of the political debate.
Percentage of Female Candidates in Non-Reserved, Scheduled Caste (SC) Reserved and Scheduled Tribe (ST) Reserved State Assembly Constituencies before and after 1996
Note: SC = Scheduled Caste; ST = Scheduled Tribe; BJP = Indian People’s Party.
Percentage of Female Candidates in Non-Reserved, Scheduled Caste (SC) Reserved and Scheduled Tribe (ST) Reserved Parliamentary Constituencies before and after 1996
Note: SC = Scheduled Caste; ST = Scheduled Tribe; BJP = Indian People’s Party.
A first important pattern to note in Tables 1 and 2 is that in both the state assembly and parliamentary elections, the Congress Party had a higher share of female candidates than other parties before 1996. In non-reserved constituencies, the percentage of women fielded by the Congress Party did not increase much over time. Rather, Congress started fielding more women in both SC and ST reserved constituencies in the mid-1980s. Given that the initiatives to increase the representation of women to a large extent have come from the Congress Party, and it was the Congress Prime Minister Rajiv Gandhi who included the recommendation for local-level quotas for women in the National Perspective Plan in the 1980s, this pattern is consistent with the argument that increased awareness about, and pressure for, women’s political inclusion incentivizes parties to field women in reserved constituencies.
The values for the Indian People’s Party look very different. The Indian People’s Party (founded in 1980) started out fielding very few women but has gradually caught up with the Congress Party. The clear change in the case of the Indian People’s Party came in the late 1990s, when the party started fielding more women in reserved constituencies. Much of the aggregate change in the percentage of women fielded in India in recent years is actually the result of the Indian People’s Party going from fielding very few women to somewhat more women, and particularly increasing its numbers of women fielded in reserved constituencies. A similar pattern is visible for the rest of the parties, including the ethnic party, Bahujan Samaj Party (BSP), which has run on a platform of working for the interests of the SCs. Here too, few women were fielded before the mid-1990s, and the increase over time in nominations in reserved constituencies was greater than the increase in non-reserved constituencies.
The result of these changes in the fielding practices of the political parties is that the percentages of female candidates and elected female politicians have been considerably higher in reserved constituencies than in the rest of the country in recent years. Because of the quotas, SCs and STs are guaranteed a proportional presence in politics. In addition, individuals from these communities are entitled to run for election in non-reserved constituencies. Although not common, some SC and ST candidates have run for election in non-reserved constituencies, particularly after the locations of reserved seats were moved in 2008 (Jensenius Reference Jenseniusforthcoming).
For most election years, we do not have information about the caste group of the politicians who run for election in non-reserved constituencies. However, from 2004, the Election Commission of India started reporting on whether candidates were SC, ST or general category. For the three parliamentary elections and 95 state assembly elections held between 2004 and spring 2015 we can therefore observe how many SC and ST women have run for election in non-reserved constituencies.
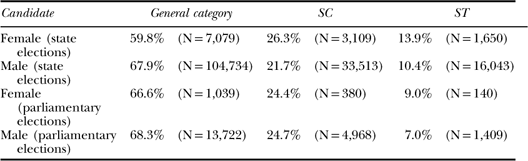
Table 3 shows the percentages of general category, SC and ST women and men among all the candidates in the elections held in India between 2004 and 2015 (including both reserved and non-reserved constituencies). Bearing in mind that SCs constitute about 16 per cent of the population in India and STs about 7 per cent of the population, we can see that these groups have been over-represented among the candidates. However, it is also clear that minority-group women have done better than other women. In the state assembly elections held between 2004 and 2014, SC men constituted 21.7 per cent of all male candidates while SC women constituted 26.3 per cent of all female candidates. This was also reflected in the winning rates, as 23.7 per cent of all elected female members of legislative assemblies were SC. Similarly, 10.4 of the male and 13.9 per cent of the female candidates were ST. In the parliamentary elections, SC women made up 24.4 per cent of all female candidates, while ST women constituted 9 per cent of the female candidates.
The Percentage of Candidates in Indian Elections who Were from a Scheduled Caste(SC), Scheduled Tribe (ST) or General Category, 2004–15
The most under-represented group has, in fact, been majority-group (general category) women. Although they form 77 per cent of the female population, they made up only 59.8 per cent and 66.6 per cent of the female candidates in state assembly and parliamentary elections, respectively. And given that there were few female candidates overall, only 7,079 out 166,128 candidates (4.3 per cent) in the state assembly elections held between 2004 and 2015 and 1,039 of the 22,206 candidates (4.7 per cent) in the parliamentary elections held in 2004, 2009 and 2014 were majority-group women. This means that the nomination of general-category women in India has hardly increased over time at all.
THE POLITICAL OPPORTUNITY STRUCTURE FOR WOMEN IN RESERVED CONSTITUENCIES
In the previous section I showed that there has been an increase in the nomination of female candidates in reserved constituencies in India over time. It may be tempting to jump to the conclusion that the observed pattern has been the result of an intentional strategy by the political parties trying to solve their women ‘problem’ by nominating female candidates in reserved constituencies, allowing them to retain as many majority-group men in power as possible. This may have happened and I believe it to be part of the story. However, the patterns may also be an unintentional result of the informal practices surrounding the struggle for party nominations within parties, where candidates displaying stereotypically masculine and majority-group traits – such as wealth, confidence, a large network or a show of force – tend to do well. The fact that both minority-group men and women are less likely to have these characteristics means that reserved seats have a political environment that is more accessible to female candidates than other seats.
Getting nominated by a political party in India is a struggle, and male SC and ST politicians are often talked of as having a weaker position within parties than other male politicians (Jensenius Reference Jensenius2013). Facing pressures to replace some male politicians with female candidates, these minority-group male politicians may therefore have been less able to defend their positions than their majority-group counterparts. This perception of them being ‘weak’ comes at least in part from the fact that they tend to have less political influence within parties. Politicians in reserved constituencies are, for example, less likely to hold cabinet portfolios (Jensenius Reference Jensenius2013) or important positions in the party leadership (Shrinivasan Reference Shrinivasan2015). Facing the pressure of denying some male incumbent politician the chance to run for re-election to make space for female candidates, the party leadership may therefore feel that it is easier to replace the male politicians in reserved constituencies.
Personal wealth may also play a role in explaining these patterns, as it can be costly to run for election in India. This is to a large extent because of campaigning costs, but also the cost of being nominated by a party at all: according to politicians interviewed in India’s largest state Uttar Pradesh, in 2010 the cost of a party nomination in that election had been Rs 2–3 million ($30,000–45,000).Footnote 5 However, this cost is allegedly lower in reserved constituencies than in non-reserved constituencies, because those constituencies are less competitive (Jensenius Reference Jensenius2013) and because the potential candidates are poorer (Vaishnav Reference Vaishnav2012). If male candidates in reserved constituencies are known to pay less to the party for their candidate nomination, it may seem easier to replace such candidates with new female candidates. Conversely, as women are less likely to be independently wealthy than men, it may be easier for them to run as candidates where the cost of running for election is lower.
Criminality also plays an important role in the political opportunity structure in India, and many politicians are tied to criminal networks and rule their areas through intimidation and violence. Such criminal networks tend to be male-dominated and based on homosocial capital (Michelutti Reference Michelutti2010, see Bjarnegård and Kenny Reference Bjarnegård and Kenny2016, in this issue; Johnson Reference Johnson2016, in this issue). Vaishnav (Reference Vaishnav2012) reported that although many politicians in India face criminal charges, this is much less common in reserved constituencies. Politicians in these areas are therefore less associated with the kind of ‘money and muscle’ power than other politicians. In areas where violence plays an important part in politics there may also be direct threats to people who stand as candidates against the incumbent politician. The hostility of the political environment is often mentioned as deterring women from running for office (Nath Reference Nath1996). If criminality is less important in reserved constituencies than in non-reserved ones it may therefore seem more attractive to women to run for election there.
Seen together, this suggests that reserved constituencies may have male incumbents who are less able to defend their claims for renomination by parties than other politicians and also more attractive for women to run for election. Interestingly, this means that the same characteristics that make male SC politicians seem ‘weak’ within the masculine and upper-caste dominated environment of Indian politics may have created a political space that is easier for women to enter into.
CONCLUSIONS
This article has looked at the nomination patterns of women, and particularly minority-group women, in India between 1961 and 2015. Using candidate data from India’s federal parliamentary elections and state assembly elections over time, I show that as the efforts to include women in positions of power has grown stronger, there has been a gradual overall increase in the nomination of women. And, importantly, there seems to have been an interaction between these efforts and the existing quota system, to the benefit of minority-group women. The result in India is that minority-group women have been nominated at a considerably higher rate than other women in recent years. This increase in nomination of minority-group women means that there has actually been little increase in the nomination of majority-group women, and that the inclusion of more women has mainly happened at the cost of minority-group men, not majority-group men.
Indian politics is without doubt a male-dominated environment, with power inequalities based on both gender and caste shaping most political interactions. It is therefore not hard to imagine that political parties in some instances have actively resisted the inclusion of women in politics by fielding them in areas they perceive as less important. However, it is also important to consider how the entrenched practices within political parties themselves – such as a tendency to field candidates who display excessive wealth and muscle power – create strong informal barriers for women and minorities vying for political power. The findings in this article point to the need for further study of how the internal workings of political parties re-enforce existing power hierarchies in politics.
ACKNOWLEDGEMENTS
I am very grateful for all comments received on previous versions of this paper. Particular thanks go to Shinhye Choi, Adnan Farooqui, Mala Htun, Meryl Kenny, Poulami Roychowdhury, Tània Verge, Rahul Verma, the anonymous reviewer and the participants in the workshop on Gender and Political Recruitment at ECPR in Salamanca 2014 and the Indian Politics workshop in Washington DC in December 2015. I also owe thanks to the research assistants who helped with the tedious work of putting together the data sets used in the analysis. The research was conducted with support from the Norwegian Research Council. Replication code and data will be made available at www.francesca.no.