


1. Introduction
Text-to-Image Generative AI (GenAI) has rapidly emerged as a tool of interest within the design community for its ability to support both inspiration-seeking (divergence) and iterative refinement (convergence) with reduced time investment by the designer. By generating sophisticated visualisations from text prompts, GenAI introduces an alternative mode of design visualisation to support ideation and development. Notably, it offers opportunities for rapid exploration, variation, and refinement of concepts via entirely different user interaction compared with traditional design tools/practices. This potential alternative in visualisation practices raises important questions about how designers engage with these tools and how their processes adapt as a result.
It follows that a growing body of research has begun to explore user experiences with GenAI in creative workflows. They explore its influence on creativity (Reference Ranscombe, Tan, Goudswaard and SniderRanscombe et al., 2024; Reference Torricelli, Martino, Baronchelli and AielloTorricelli et al., 2024; Reference Xie, Pan, Ma, Jie and MeiXie et al., 2023), design practices (Reference Chiou, Hung, Liang and WangChiou et al., 2023), and co-creative processes (Reference Moruzzi and MargaridoMoruzzi & Margarido, 2024). At the same time, research is emerging outlining how Image GenAI can limit the breadth of ideation supported (Author 2024) and lead to design fixation (Reference Wadinambiarachchi, Kelly, Pareek, Zhou and VellosoWadinambiarachchi et al., 2024). This suggests that there is no clear consensus on the specific behaviours text-to-image generative AI best supports, nor the corresponding phases of the design process in which it is most effective.
In parallel there is interest in how interaction data—capturing users’ prompts, modifications, and iterations—can be leveraged to provide insights into designer behaviours (author blind for review) (Reference Xie, Pan, Ma, Jie and MeiXie et al., 2023). These studies demonstrate the potential of interaction data as an analytical tool, both for studying design cognition and for informing the development of adaptive, AI-assisted design environments.
This paper extends current research on GenAI-supported design workflows by analysing user interaction data in conjunction with designers’ experiences when using text-to-image GenAI. Specifically, we explore how patterns in user experience correspond to patterns in interactions when using GenAI to design. In doing so we seek to lay foundations for data-driven feedback and support within GenAI systems that can guide best practices and improve experiences of designing with GenAI.
2. Background
This section provides a background describing research to date on applications of text-to-image GenAI in design. This outlines extant research on how designers interact with GenAI platforms which later form the basis of our approach to data collection and analysis.
2.1. Designer interactions with midjourney
Text-to-image Generative AI (GenAI) platforms allow users to create and refine images through a combination of text prompts, image inputs, and variation commands. At its core, the software generates images based on text prompts, where users input descriptive phrases specifying subject matter, style, and visual attributes. The more detailed the prompt, the greater the control over the resulting image, though overly long prompts may lead to diminishing specificity.
Beyond text, users can refine outputs through image inputs, providing Midjourney with a reference image that guides the AI’s interpretation, blending the reference with the textual description. Once an image is generated, variation commands allow iterative refinements. These include simple variations, more controlled subtle and strong variations (named Vary (Subtle) and Vary (Strong) respectively), as well as Vary (Region), which enables users to modify specific areas while retaining the overall composition. Together, these commands enable the creation of images also giving designers flexibility in guiding, iterating, and fine-tuning AI-generated visuals to align with their creative intent. Figure 1 presents screenshots of the Midjourney interfaces highlighting an example of the text prompt interface along with the variation commands described above.
Screenshots of the Midjourney interface illustrating (a) text prompting, (b) simple variation commands denoted by V1-V4, (c) controlled variation commands Vary (subtle), Vary (strong), and Vary (region)

Midjourney was chosen as the text-to-image GenAI platform for this study due to its balance of functionality, flexibility, and output image quality. Like other text-to-image GenAI tools, it processes text-based prompts and provides various refinement and iteration commands, allowing users to modify and evolve their generated images. It was preferred for our study over alternatives because it represents a middle ground between highly specialised platforms, such as Vizcom, designed for concept art and design with direct painting and editing features, and more constrained tools like DALL-E, which offer fewer interactive controls. This combination of high-resolution outputs and extensive variation options makes it an ideal platform for researching the experiences of designers using text-to-image GenAI.
2.2. Research on users’ experience of GenAI as a design tool
Research into the use of text-to-image GenAI in design has examined a range of use cases, task characteristics, and design-related qualities. A significant area is in supporting the creative experience of users. For example research in inspiration-seeking by generating inspirational content (Reference Berni, Borgianni, Rotini, Gonçalves and ThoringBerni et al., 2024; Author, 2024) and as a support for more diverse ideas (Reference Wan and LuWan & Lu, 2023) and (Reference Barbieri and MuzzupappaBarbieri & Muzzupappa, 2024) “unexpected” ideas, and more novel ideas (Reference Xie, Pan, Ma, Jie and MeiXie et al., 2023). We can categorise these studies as exploring GenAI for divergent behaviours, or “broadening” behaviours. Research also exists exploring GenAI to create faster or more efficient design development activities, for example, more quickly and precisely communicating design intent (Reference Chiou, Hung, Liang and WangChiou et al., 2023), and as a means to quickly translate low fidelity sketches to more resolved concepts (Reference Edwards, Man and AhmedEdwards et al., 2024).
At the same time, research indicates that GenAI, despite its creative capacity, can inadvertently encourage negative design behaviours such as fixation (Reference Wadinambiarachchi, Kelly, Pareek, Zhou and VellosoWadinambiarachchi et al., 2024) and sunk cost effects (Reference Chong, Lo, Rayan, Dow, Ahmed and LykourentzouChong et al., 2025). For example, Reference Wadinambiarachchi, Kelly, Pareek, Zhou and VellosoWadinambiarachchi et al. (2024) show that exposure to AI-generated images can lead to higher design fixation on initial examples and AI outputs, potentially curbing the potential for inspiration support and creativity cited above. Similarly, Reference Karahan, Aktaş and BingölKarahan et al. (2023) show how text-to-image GenAI tools can limit the externalisation of the thinking process through the need to use language to prompt outputs. Investing the effort in refining prompts and interacting with GenAI, Reference Chong, Lo, Rayan, Dow, Ahmed and LykourentzouChong et al. (2025) find that greater levels of effort in prompt refining diminish willingness to explore different design options.
2.3. Qualities of GenAI user interaction to develop
A central theme in recent research on GenAI concerns the level of agency in human-AI interaction. Agency may be understood as the extent of control exerted by the user, or conversely, the autonomy of the AI to operate with limited human direction (Reference Koch, Taffin, Beaudouin-Lafon, Laine, Lucero and MackayKoch et al., 2020; Reference Moruzzi and MargaridoMoruzzi & Margarido, 2024). For those developing GenAI interfaces, the modulation of agency presents an important design consideration, particularly concerning its impact on creativity and the design process. As randomness is an inherent property of generative models, it can yield unexpected outcomes that may stimulate creativity (Reference Wan and LuWan & Lu, 2023). Consequently, managing the balance between control and randomness has become a key focus of research into creativity support (Reference Wadinambiarachchi, Kelly, Pareek, Zhou and VellosoWadinambiarachchi et al., 2024). Researchers alike have already begun to stress the need to maintain a balance between human creativity and AI automation capabilities (Reference del Campodel Campo, 2024).
Studies investigating prompting strategies and conventions (Reference Torricelli, Martino, Baronchelli and AielloTorricelli et al., 2024), semantic qualities (Reference Cai, Rick, Heyman, Zhang, Filipowicz, Hong, Klenk and MaloneCai et al., 2023) and input modalities (Reference Moruzzi and MargaridoMoruzzi & Margarido, 2024) have begun to explore how different modes of interaction shape the user’s sense of control and thus their experience of the GenAI’s agency. While the field is rapidly evolving, there is broad agreement that richer prompts and more explicit prompt modalities typically reduce the AI’s generative autonomy, affording greater control to the user. However, there remains no clear consensus on best practices for balancing control and creative spontaneity, likewise how this balance translates to user interface and user experience. Thus, we highlight two key generalised aspects of GenAI that drive the use of GenAI and potentially correspond to positive or negative experiences with GenAI.
3. Methods
We now present methods adopted for the study. Section 3.1 outlines the design hackathon studied and study participants, 3.2 survey questionnaire and 3.3 the analysis of designers’ interactions with the GenAI.
3.1. Design hackathon and participants
A design hackathon was conducted to explore how interaction data from text-to-image GenAI platforms can reveal patterns in designer behaviour. During the hackathon participants utilised Midjourney to explore and develop ideas for product(s). For the hackathon participants were given the design brief: “Design an innovative emergency product that can significantly improve the safety and survival chances of individuals at risk of forest fires.”
This brief was selected as it aligns with the expertise of the participants—industrial designers—while also targeting the early phases of the design process, specifically inspiration-seeking and concept development. The open-ended nature of the brief was designed to encourage participants to engage in initial exploratory behaviours, preventing premature fixation on specific design details. Prior to starting, participants underwent a brief introduction and hands-on practice session to familiarise themselves with Midjourney’s key commands.
A total of 20 participants were recruited from a cohort of third- and fourth-year industrial design undergraduates, ensuring they had sufficient design experience to navigate the design hackathon with autonomy. From 20 participants, 20 valid questionnaire responses and 217 hours of Midjourney prompting interactions were recorded.
3.2. Questionnaire
At the conclusion of the hackathon participants completed a questionnaire survey to capture their experience using Midjourney. 7 rating questions were posed to capture reflections on learning the GenAI tool, their user experience of the tool during the hackathon, integration of the tool within design phases, and predictions on the future use of the tool in design practice. All rating questions were posed on a 5-point Likert scale. The full wording of questions and gradations of the Likert scale are included in Figure 2. Questionnaire data is analysed by descriptive statistics to understand overall trends in user experiences with Midjourney. This data is also used to identify a maximum variation sample, i.e. participants with the most contrasting experiences, whose interaction patterns are further examined.
3.3. Interaction pattern analysis
Interaction data was captured via the Midjourney prompts used by participants along with the resulting images generated. In Midjourney, each interaction (prompt) comprises a timestamp, prompt text, image aspect ratio, Midjourney version no., “parameters” describing any variation commands, and user ID. For example:
**A product shot of a normal person using an emergency portable satellite to create a distress signal from a forest fire and receive help from a rescue helicopter --ar 16:9 --v 6.0** – Variations (Region) by <@1264553447651278911> (fast)
The above prompt includes text describing the desired aspect ratio (shown as “-- ar 16:9”), the version of Midjourney used (version 6, shown as “--v 6.0”), and that this prompt was a part of Vary Region command shown as “Variations (Region)”.
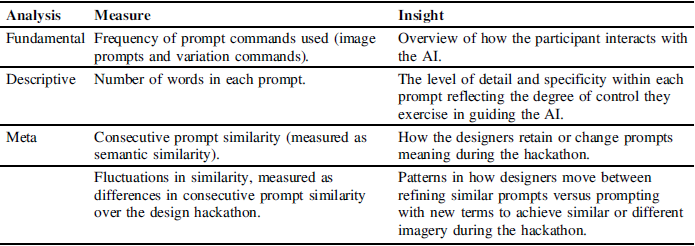
All prompts by each participant were downloaded, collated and stored as a CSV. A summary of analyses conducted on interaction data is included in Table 1. This study does not examine all of Midjourney’s features. It focuses only on those that influence content or ideas. Commands that are procedural (such as Zoom, Pan and aspect ratio) or artistic (such as style references) are excluded as they were deemed not being closely related to ideation and idea development.
Summary of interaction pattern analyses and insights drawn

4. Results
We begin by analysing the results from the survey questionnaire. These are followed by an analysis of corresponding interaction data.
4.1. Survey findings
Figure 2 presents a summary plot of the Likert-scale questions evaluating their experience using a text-to-image Generative AI (GenAI) tool. The responses indicate a clear trend that participants strongly agreed that the tool was effective in supporting idea generation, with more varied responses related to downstream design activities and support or confinement/fixation.
Participants reported the highest levels of agreement for questions “useful in creating large volume of ideas” and “useful in creating wide range of ideas”. These items share a median response of 5 (strongly agree), with low variability, indicating consistent positive experiences across the sample. This suggests a shared view that GenAI effectively supports divergent thinking, enabling the rapid production of varied outputs.
Questionnaire summary data

Responses to “useful in exploring different design ideas” also reflected broadly positive experiences, though the median was slightly lower (approximately 4 – “Agree”), and the distribution more varied. By contrast, questions relating to the tool’s usefulness for overcoming creative blocks and supporting design refinement elicited greater variability and lower median scores (∼3–3.5 – Neutral – Agree), indicating that these aspects of the tool’s support were perceived inconsistently among participants.
Notably, the question “the tool confined me to certain ideas/concepts”, received a median of 3.5 with a broad range of responses. This suggests that while some participants experienced the tool as confining their ideas and creativity, others disagree.
4.2. Maximum variation data
To further explore differences in the participants’ experiences we further investigate participants with the greatest difference in response (and experience) – maximum variation sample.
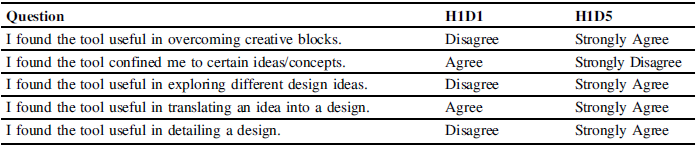
Maximum variation sample questionnaire responses

The maximum variation sample (data in Table 2) is characterised by H1D5 consistently reported positive experiences with the GenAI tool, particularly across ideation, development, and refinement phases. In contrast, H1D1 expressed more limited or negative views, with the exception of design development (Q3.3), where agreement was observed. A clear inversion is seen in responses to creativity and fixation: H1D1 felt the tool hindered creativity, while H1D5 felt it supported it.
4.3. Interaction pattern findings
Prompting analytics for the maximum variation sample is now presented. Table 3 provides a summary of prompting which is expanded through Figure 3 – Figure 4 charting prompt similarity and the sequence of commands used and over the design hackathon.
Contrasting summary interaction patterns data for H1D1 and H1D5

From the summary data shown in Table 3, we can see the overall difference in the way H1D1 and H1D5 interact with the AI. H1D1 produced a slightly higher number of prompts (179) compared to H1D5 (161). H1D1 also has a higher average prompt length of 15.46 words versus 12.5. A two-tailed T-test reveals this difference is significant, p= 0.0014 < R=0.05. In terms of variation commands H1D1 relied more heavily on Vary Region (54) and Remix (Strong) commands (32), while making no use of Image Prompt or Remix (Subtle) commands. In contrast, H1D5 adopted a more multimodal approach, integrating 19 Image Prompt commands and making broader use of Remix (Subtle)(21) and Vary Region (23) commands.
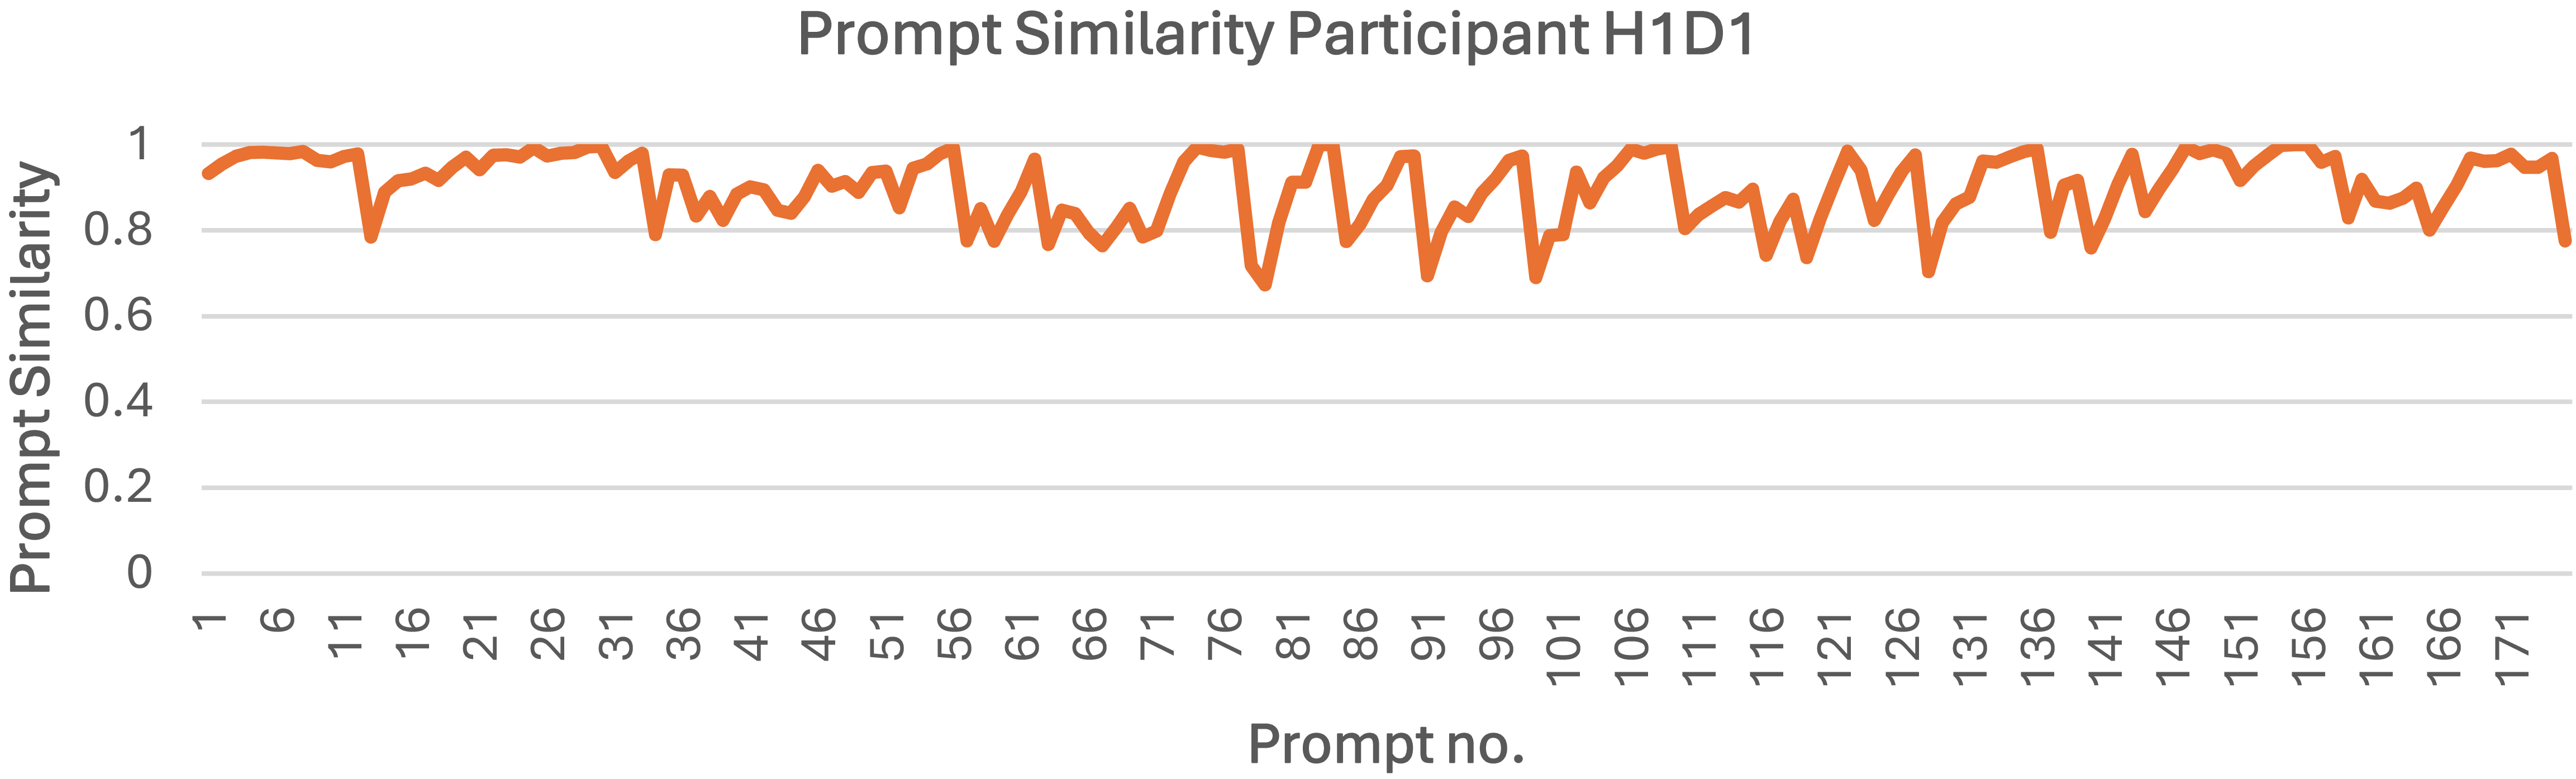
Prompt similarity by participant H1D1 over the design hackathon – similarity is measured as the similarity averaged over the 3 preceding prompts. 1= identical and 0 is dissimilar

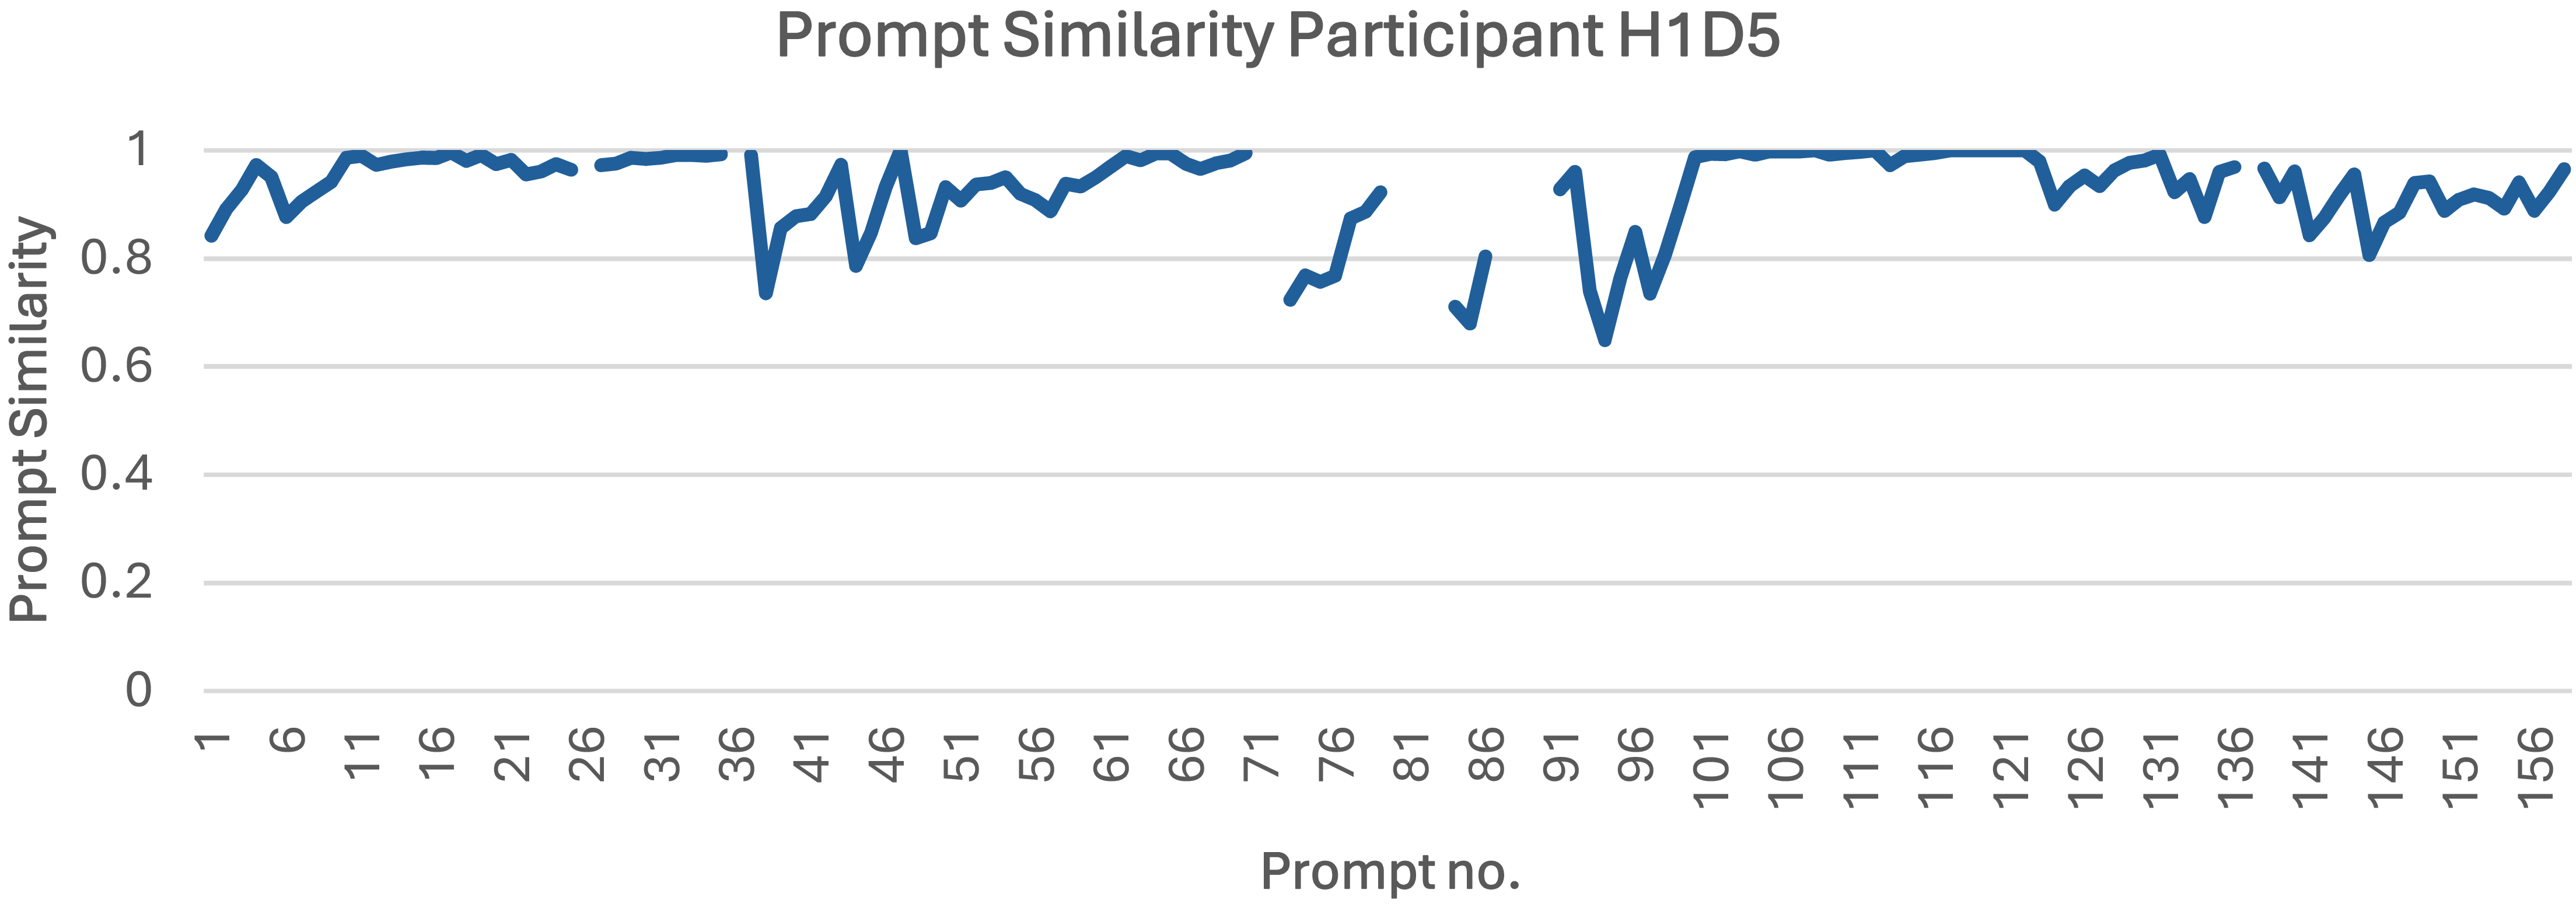
Prompt similarity by participant H1D5 over the design hackathon – similarity is measured as the similarity averaged over the 3 preceding prompts. 1 = identical and 0 is dissimilar. Note gaps in data correspond to the use of successive image prompts with no text prompt to measure similarity

A comparison of prompt similarity patterns and use of commands between participants H1D1 (Figure 3) and H1D5 (Figure 4) reveals distinct approaches to working with the GenAI. The prompt similarity graph for H1D1 exhibits consistently high prompt similarity (values between 1 and 0.7) oscillating throughout the design hackathon. In contrast, H1D5’s prompt similarity curve shows greater fluctuation, with several noticeable dips in similarity.
Timeline charting the use of different commands by participant H1D1 during the hackathon. Coloured squares represent occasions when given commands are used

Timeline charting the use of different commands by participant H1D5 during the hackathon. Coloured squares represent occasions when given commands are used

The command sequence data provides deeper insight into these patterns. H1D1 initially used the “Remix (Strong)” command and then switched to using the Vary region command for the remainder of the hackathon (see Figure 5). This implies that, in the initial stages, the participant sought to alter the entire image, but over time, their focus shifted towards changing specific portions of the generated output. In contrast, H1D5 uses a wider range of varying commands. They also begin the hackathon using the “Vary Region” but then move to commands with changing degrees of variation. This indicates that while the participants largely focused on refining parts of the generated outputs, they periodically reverted to recreating entire images, highlighting a dynamic interplay between iterative refinement and broader conceptual shift. Observing the charts (Figure 6) we can see how H1D5 moves from high variation commands to low variation commands which correspond with the similarity dips. These are characterised by transitions from Remix strong – remix subtle – image prompt/vary region which aligns with transitions from low similarity to high similarity.
Reviewing the sample of images produced in Figure 7, we can see how images generated also reflect the patterns seen in interaction data. Images generated by H1D1 retain a high degree of similarity (handheld and key ring devices) representing relatively subtle differences in form and user interfaces depicted in resulting images. The high similarity reflects overall the high similarity in prompt text. The nature of differences (depiction of different interfaces) also reflects the use of vary region commands applied to areas of the image with the interface. These images and subtle changes within align with the participant’s view that they found the tool most useful for design development. In contrast, images generated by H1D5 embody a greater variety of subject matter, types of bags, types of jackets, hoods, bags and jackets integrated, and the contents of a bag. The shifting content reflects the series of dips in prompt similarity which reflect the points where prompt subject changes (e.g. shifting from bags to jackets).
Contrasting images generated by H1D1 and H1D5 at prompts 10, 25, 50, 75, 100 and 125 during the design hackathon

Figure 7 Long description
The image contains two sets of generated images labeled H1D1 and H1D5. Each set includes six images generated at prompts 10, 25, 50, 75, 100, and 125. The images in the H1D1 set depict various remote controls and keychains, while the images in the H1D5 set show different types of backpacks and jackets. The purpose of the comparison is to illustrate the diversity and creativity of the generated images at different prompts during the design hackathon.
5. Discussion
A discussion of the findings is now presented. It begins with a discussion of how interaction patterns reflect users’ experiences. This is followed by recommendations for better supporting designers’ experiences when working with GenAI.
5.1. Alignment of positive experiences and prompting patterns – how interaction patterns reflect users’ experiences
Survey data broadly reflects the literature, highlighting mostly positive experiences when generating ideas (Reference Wan and LuWan & Lu, 2023) and supporting inspiration (Author, 2024), but with notable variance reflecting the lack of consensus on the best application especially with support for creativity (Reference Xie, Pan, Ma, Jie and MeiXie et al., 2023) versus fixation (Reference Wadinambiarachchi, Kelly, Pareek, Zhou and VellosoWadinambiarachchi et al., 2024). The view on refinement and detailing is mixed, with both positive and negative responses reflecting a generally neutral yet varied perspective. Views on supporting creative thinking or causing fixation highlight contrasting views among the participants.
Exploring the maximum variation in survey responses, we see two contrasting views on use and experience with text-to-image GenAI. This is summarised as H1D1, finding it does not support creativity, confines ideas, and is only useful in design detailing. In contrast, H1D5 finds it does support creativity, doesn’t confine, and is widely useful throughout the design hackathon/project. The prompt similarity and command sequence data for participants H1D1 and H1D5 reveal marked differences in their interaction patterns with the GenAI tool. Comparing these patterns with analytics we see how H1D5 follows a strategy of changing prompts and commands in phases. These phases are characterised by a transition from greater AI agency and reduced user control to diminished AI agency and increased user control. We can infer from the images created that these strategies generally follow the process of ideation proceeding to the development and refinement of details. H1D1 seems to spend less time in ideation focusing on development and refinement of details. This is reflected in the sample of images generated by H1D1 embodying minor refinements to the product interface of a single product concept. In contrast, the varied content of images generated by H1D5 highlights the different phases and aspects of design being developed. This alongside survey data evidence of how text-to-image GenAI is potentially useful across all phases of the industrial design process.
Aligning the analytics of prompt similarity and commands used with participant experiences suggests that ideation and creativity are better supported when higher AI agency is paired with more explorative prompting via greater dissimilarity. Their experience of more effective refinement and detailing is supported by a shift in control from low to high, as design ideas become more developed and precise. In our case, this shift is supported by transitioning from image prompts and strong remixes to subtle remixes and vary region commands. At the same time increasing prompt similarity while doing so provides further control and thus satisfaction in detailing and refining.
5.2. Recommendations for supporting designers’ experiences with GenAI
A key implication of our findings is that the perceived effectiveness of GenAI varies with the different phases of the design process. It follows that user interactions, in terms of prompt structure and variation commands, should be understood as phase-dependent. That is, strategies effective during inspiration-seeking or ideation may be less suitable during development or refinement. This suggests that prompting behaviour and interaction strategies should not be treated as uniform and be tailored to the designer’s intention and the stage of the design process. While such adaptation may occur through individual learning, our findings highlight opportunities for the GenAI platform to be designed to actively support this process.
Our recommendation is that future GenAI design tools could incorporate interaction modes that are contextualised to the design phases. For example, allowing users to specify whether they are engaging in inspiration, ideation, or refinement would enable the system to modulate its generative behaviour, accordingly, offering higher variability and autonomy in earlier stages, and greater control and specificity in later ones. In addition, our results indicate that platform analytics—such as prompt similarity and command use—could be monitored to infer the user’s design phase and intention. These insights could be implemented algorithmically on the back end to guide image generation or surfaced through a “co-pilot” or “personal assistant” interface that offers context-aware suggestions. For example, the system might recommend more exploratory prompt strategies if it detects high prompt similarity during an inspiration-seeking phase or suggests refining specific details when image variation commands dominate. Such integration of interaction data and phase-aware logic offers a pathway to more responsive, collaborative GenAI systems that adapt to designer behaviours and support creativity with greater nuance.
5.3. Limitations and further work
We acknowledge two key limitations to our findings. Although we initially surveyed 20 participants, our mapping of interaction patterns to user experiences focuses on two participants selected through a maximum variation sampling strategy, representing opposing experiences. This approach was chosen to capture the broadest observable divergence in user interaction and experience within the cohort. In doing so we identified distinct interaction patterns associated with contrasting usage strategies and experiences. However, this necessarily limits the scope of the findings to the extremes. Further research is needed to investigate patterns of interaction and experience among participants with more neutral or moderate responses, including the thresholds or inflection points at which experiences shift from positive to negative and vice versa. In the first instance, this would entail a more comprehensive analysis of interaction data across the full sample. The second limitation concerns our focus on a single GenAI platform, Midjourney. As argued in Section 2.1, Midjourney shares many core characteristics with other text-to-image GenAI platforms—particularly in relation to prompt-based image generation and variation commands. Although the general principles related to control, agency, and interaction patterns are likely to apply across other text-to-image GenAI, further comparative studies are warranted to examine how different platform functionalities and interface designs may influence designer behaviour. The intention of this article was to explore the extent to which user experience is reflected in interaction data and, in turn, how such data might inform improved support for designers. While broader studies would strengthen this contribution, we contend that the patterns identified in this study offer meaningful insights for designers reflecting on how they interact with GenAI, and GenAI tool developers seeking to better support design activities.
6. Conclusion
This article investigates how interaction data—such as prompt similarity and command use correspond with designers’ experiences in terms of their views of the GenAI’s effectiveness. To address this, we conducted a mixed-methods study involving survey data from 20 participants and an in-depth analysis of the interaction patterns of two participants selected through maximum variation sampling. This approach enabled us to identify contrasting usage patterns and experiences, thereby highlighting design behaviours and preferences when working with GenAI.
Our findings show how more positive experiences across phases of the design hackathon are reflected in shifting prompting strategies and commands in ways that reflect a progression from exploratory ideation to controlled refinement. In contrast, less favourable experiences were associated with higher levels of similarity in prompting strategies and limited use of certain variation commands. By aligning patterns in prompt similarity and command use with designers’ self-reported experiences, we identify interaction strategies that appear suited to different design phases.
The contribution of this study lies in demonstrating how GenAI interaction data can function as a diagnostic tool to interpret user experience and design behaviour. This opens new opportunities for GenAI systems that can align with distinct phases of the design process by detecting changes in user engagement and tailoring their generative behaviour or offering phase-appropriate feedback through a co-pilot interface. While our analysis focuses on two contrasting cases, the identification of contrasting patterns has implications for both designers seeking to use GenAI more effectively and developers aiming to build more responsive tools. In doing so, this work contributes to the ongoing discourse on best practices for integrating GenAI into the creative design process.
Acknowledgement
This research was conducted by the ARC Centre for Next-Gen Architectural Manufacturing and funded by the Australian government (ARC IC220100030).







 Open access

