

1. Introduction
In natural populations, the spatial genetic structure, i.e. the non-random spatial distribution of genotypes, can result from a number of evolutionary and ecological processes, including the mating system (Kalisz et al., Reference Kalisz, Nason, Hanzawa and Tonsor2001) and the capacity of the species for gene dispersal (i.e. seed and pollen dispersal mechanisms) (Epperson, Reference Epperson2000; Kalisz et al., Reference Kalisz, Nason, Hanzawa and Tonsor2001; Hardy et al., Reference Hardy, González-Martínez, Fréville, Boquien, Mignot, Colas and Olivieri2004). The patchy spatial distribution of genotypes can occur at different scales, e.g. at the level of populations, subpopulations, or even among neighbouring individuals (Escudero et al., Reference Escudero, Iriondo and Torres2003). At a fine spatial scale, the most prevalent cause for spatial structure is probably limited gene dispersal, which results in the formation of local pedigree structure (Epperson, Reference Epperson2000; Vekemans & Hardy, Reference Vekemans and Hardy2004). In sexually reproducing plants, the dispersal function is mediated by the male gametophyte (pollen) and the young sporophyte (seed), and other propagules may also be involved in vegetatively reproducing plants (Ward, Reference Ward2006). Frequently, pollen and seeds show moderate to strong spatial restriction in their dispersal (Vekemans & Hardy, Reference Vekemans and Hardy2004), therefore generating processes of fine-scale population genetic structure (Gehring & Delph, Reference Gehring and Delph1999; Hardy et al., Reference Hardy, González-Martínez, Fréville, Boquien, Mignot, Colas and Olivieri2004; Tero et al., Reference Tero, Aspi, Siikamäki and Jäkäläniemi2005). These processes are mainly a result of isolation by distance, namely, the significantly positive correlation between genetic relatedness among individuals and their spatial proximity (Wright, Reference Wright1946; Hardy et al., Reference Hardy, Magia, Bandou, Breyne, Caron, Chevallier, Doligez, Dutech, Kremer, Latouche-Hallé, Troispoux, Veron and Degen2005).
Currently, spatial autocorrelation analyses are used to detect and interpret spatial patterns of genetic variation within plant populations (He et al., Reference He, Rao, You, Ge and Hong2000; Zhang et al., Reference Zhang, Zheng and Ge2007). Spatial autocorrelation methods make no assumptions about the scale of the structure, which is especially convenient when there is no previous knowledge of the spatial distribution of genotypes in the species under study, and also because processes that generate spatial structure may operate at different scales and there is thus no single ‘correct’ scale at which to describe populations (Levin, Reference Levin1992).
The species under study, Lippia origanoides, Kunth, Verbenaceae, is a shrub that can reach up to 3·5 m in height, and whose leaves, flowers and stems present a characteristic Artemisia or marjoram odour (Lopez, Reference Lopez1977). This is a promising species with essential oils of high quality that are used mostly in cosmetics and perfumery, and that have significant antioxidant activity and antimicrobial activity against Escherichia coli, Staphylococcus aureus, Candida albicans and Candida tropicalis (Santos et al., Reference Santos, Lopes, Cito, Oliveira, Lima and Reis2004; Oliveira et al., Reference Oliveira, Leitão, Bizzo, Lopes, Alviano, Alviano and Leitão2007; Stashenko et al., Reference Stashenko, Ruiz, Muñoz, Castañeda and Martínez2008). The leaves of L. origanoides are used as a substitute for common marjoram (Maisch, Reference Maisch1885; Oliveira et al., Reference Oliveira, Leitão, Bizzo, Lopes, Alviano, Alviano and Leitão2007).
According to herbarium records (Missouri Botanical Garden Herbarium, St. Louis, MO, USA), L. origanoides occurs mainly in the Neotropical region, specifically in northern South America (Colombia, Venezuela and Guyana), with one record occurring in central Chile. It is generally found in dry environments, where the soils are shallow, stony and poor in organic matter (Albesiano et al., Reference Albesiano, Rangel and Cadena2003). In Colombia, northern South America, herbarium records of L. origanoides suggest that the species occurs in the Andean region of Santander in northeastern Colombia (specifically in the Chicamocha Canyon) (Albesiano et al., Reference Albesiano, Rangel and Cadena2003), the Atlantic Coast in northern Colombia (Herbarium Federico Medem Bogotá, Instituto Alexander von Humboldt (FMB)) and in the inter-Andean valleys in southern Colombia (Universidad del Cauca (CAUP) Herbario, Popayán, Cauca, Colombia). According to Albesiano et al. (Reference Albesiano, Rangel and Cadena2003), in Santander, L. origanoides is associated with the vegetation type known as thorny scrub, which is distributed in the semi-arid area of the central basin of the Chicamocha River in the localities of Pescadero and Cepitá, especially in small hillsides with smooth or steep slopes, soils with poor content of organic matter where lixiviation processes are frequent and with relatively high erosion rate. In these localities, the excessive shepherding of goats has played an important role in the vegetation distribution and has favoured the proliferation of L. origanoides and other species that are not directly grazed by these herbivores due to toxic tannins and defensive structures like spines and thorns (Albesiano et al., Reference Albesiano, Rangel and Cadena2003). Although there is no evidence that L. origanoides is an endangered species in Colombia (Betancur et al., Reference Betancur, García, Fernández-Alonso, Rivera-Díaz and Hernández2006), it has been suggested that human disturbance, including deforestation, wildfires and transitory cultivation, has played an important role in reducing the distribution of this species in the Chicamocha Canyon (Malagon et al., Reference Malagon, Llinas and Chamorro1995; Albesiano et al., Reference Albesiano, Rangel and Cadena2003; Serrato, Reference Serrato2007). Also, in the Atlantic Coast in northern Colombia, recent urbanization activities in areas around the city of Santa Marta in the department of Magdalena have reduced and fragmented the distribution extent of L. origanoides (A. Suárez, unpublished observations).
Despite being a promising aromatic plant, very little is known about basic biological aspects of L. origanoides, e.g. its breeding system and dispersal capabilities, which have a direct influence on genetic diversity levels and the spatial distribution of genotypes inside natural populations (Wright, Reference Wright1946). It is expected that the odoriferous compounds present in these plants attract pollinators, thus favouring high levels of gene flow within populations (Levin et al., Reference Levin, Ragusob and McDade2001; Albre et al., Reference Albre, Quilichini and Gibernau2003).
In this sense, highly polymorphic genetic markers are a useful tool to infer genetic structure and dispersal patterns (Hardy et al., Reference Hardy, Magia, Bandou, Breyne, Caron, Chevallier, Doligez, Dutech, Kremer, Latouche-Hallé, Troispoux, Veron and Degen2005). Intersimple sequence repeats (ISSRs) are arbitrary multilocus markers produced by PCR amplification using anchored-microsatellite primers (Zietkiewicz et al., Reference Zietkiewicz, Rafalski and Labuda1994). This method has the advantage of generating relatively stable PCR products that show high levels of polymorphisms without requiring prior genomic information (Bornet & Branchard, Reference Bornet and Branchard2004). As a result, ISSRs have been widely applied in studies of genetic diversity and population structure (Camacho & Liston, Reference Camacho and Liston2001; Culley & Wolfe, Reference Culley and Wolfe2001; Sica et al., Reference Sica, Gamba, Montieri, Gaudio and Aceto2005). Additionally, this technique constitutes an alternative for taxa for which little or no research has been done at the molecular level (Liu & Wendel, Reference Liu and Wendel2001). Nevertheless, ISSRs are dominant markers and their principal limitation for population genetic studies is the biased estimation of allele frequencies, which is usually done by assuming Hardy–Weinberg equilibrium (HWE) inside populations (Zhivotovsky, Reference Zhivotovsky1999; Culley & Wolfe, Reference Culley and Wolfe2001). The estimation bias of this method is particularly serious in presumably outcrossing species where the frequency of the null allele may not be confidently estimated from the proportion of individuals that lack the marker since a relatively high proportion of the null allele will be present in the non-identifiable heterozygotes (Lynch & Milligan, Reference Lynch and Milligan1994). Thus, to counteract this limitation, different types of alternative methods have been proposed, such as a Bayesian approach, which takes full advantage of data provided by dominant markers without assuming HWE (Zhivotovsky, Reference Zhivotovsky1999; Holsinger et al., Reference Holsinger, Lewis and Dey2002).
In this context, the aim of the present study was to measure genetic diversity levels of L. origanoides from the central basin of the Chicamocha River, in northeastern Colombia, and to document fine population structure at different spatial scales using spatial autocorrelation analyses.
2. Materials and methods
(i) Sample collection
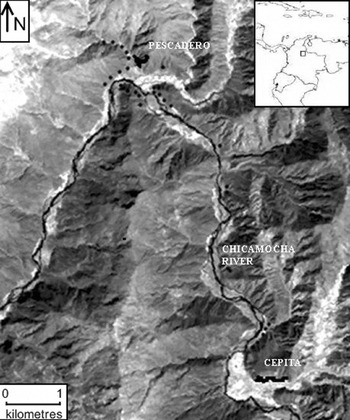
Samples from 111 individuals of L. origanoides were collected in the central basin of the Chicamocha River in the localities of Pescadero (6°49′N, 73°00′W) and Cepitá (6°45′N, 72°58′W) (Fig. 1). Sampling was performed in these two localities because they provide relatively homogeneous areas dominated by the species thus minimizing the possible effects of selection on genetic structure due to microhabitat heterogeneity. The sampling strategy reflected the current distribution and abundance of the species within each locality. In Pescadero, L. origanoides is abundant and continuously distributed on both sides of the Chicamocha River, whereas in Cepitá, L. origanoides is found on the east side of the Chicamocha River, and at this locality, sampling was performed along two small transects separated by farms and cultivated land. Samples from 62 and 39 individuals were collected in Pescadero and Cepitá, respectively, at elevations ranging from 550 to 830 m.a.s.l. For the purpose of examining larger distance classes, samples were also taken from ten individuals along a transect connecting these two localities on the east side of the Chicamocha River where L. origanoides is relatively less abundant (Fig. 1). For each sample collected, latitudinal, longitudinal and elevation data were recorded using a GPS (geographical positional system) from Garmin (USA).
Map of the distribution of the Lippia origanoides individuals sampled from the Chicamocha Canyon. The sampling strategy reflected the current distribution and abundance of the species within each locality (Pescadero and Cepitá). Samples from 62 and 39 individuals were collected in Pescadero and Cepitá, respectively, at elevations ranging from 550 to 830 m.a.s.l. Samples were also taken from ten individuals along a transect connecting these two localities on the east side of the Chicamocha River, where L. origanoides is relatively less abundant (see the text for details). The dark dots indicate collection points.
Samples from each individual, consisting of 20–30 young leaves, were collected and preserved in zip-lock plastic bags containing silica gel and stored at −20°C until DNA extraction. Herbarium samples were sent to the Colombian National Herbarium (COL) for taxonomic determination under the accession number 522 847.
(ii) DNA extraction and PCR amplification
Genomic DNA was isolated from young leaves. Leaf samples were finely ground in liquid nitrogen (−80°C) and DNA extraction was made using a modification of the CTAB method reported by Pirttilä et al. (Reference Pirttilä, Hirsikorpi, Kämäräinen, Jaakola and Hohtola2001). The resulting DNA solution was stored at −20°C in TE buffer for later use.
A set of 50 ISSR primers (obtained from the University of British Columbia, Vancouver, ON, Canada) was screened for amplification success and polymorphisms in a representative sample of L. origanoides. PCR reactions were carried out in a total volume of 15 μl containing 1 unit of Taq polymerase (Promega), 1×PCR buffer (Promega), 0·2 mM dNTPs, 0·5 μM of the ISSR primer and 10–20 ng of extracted DNA. Amplifications were performed on a PTC-100TM thermocycler (MJ Research) following Wolfe (Reference Wolfe2005) cycling conditions. PCR products were loaded onto 2% agarose gels in 0·5×TBE buffer, run at constant voltage (50 V) for 3 h and detected by staining with ethidium bromide. Each ISSR band was considered an independent character or locus, and polymorphic bands were scored visually as either absent (0) or present (1). Qualitative differences in band intensity were not considered (Assefa et al., Reference Assefa, Merker and Tefera2003). Two independent scorings were made on each gel, and only those bands consistently scored were considered for analysis. Also, replicate samples were analysed for each locus and only reproducible bands were considered for analysis.
(iii) Data analysis
Genetic diversity was described as the percentage of polymorphic loci (P), and quantified as Shannon's diversity index (I) (Shannon & Weaver, Reference Shannon and Weaver1949) using POPGENE v.1.31 (Yeh et al., Reference Yeh, Yang and Boyle1995), which assumes that populations are in HWE. Also, a Bayesian approach, which does not assume HWE (Zhivotovsky, Reference Zhivotovsky1999; Holsinger et al., Reference Holsinger, Lewis and Dey2002), was used to estimate the average panmictic heterozygosity (H B) using the HICKORY software (Holsinger & Lewis, Reference Holsinger and Lewis2003). This software uses Markov chain Monte Carlo simulations to produce posterior distributions based on the data (Holsinger et al., Reference Holsinger, Lewis and Dey2002).
The genetic structure of L. origanoides from the two localities of the central basin of the Chicamocha River was first explored by means of a principal coordinate analysis (PCO) using a squared Euclidean distance matrix from which principal coordinates were extracted. Also, a matrix of pairwise similarities among individuals was obtained using the Nei & Li (Reference Nei and Li1979) coefficient and this matrix was employed to build a dendrogram by using the unweighted pair group method using arithmetic averages (UPGMA) algorithm. The PCO and UPGMA analyses were carried out using MVSP 3.1 (Kovach, Reference Kovach1998). Population structure was further examined by means of analysis of molecular variance (AMOVA) with the program GENALEX version 6.1 (Peakall & Smouse, Reference Peakall and Smouse2006), and by applying the Bayesian hierarchical model implemented in HICKORY (Holsinger & Lewis, Reference Holsinger and Lewis2003).
The correlation between a genetic Euclidean distance matrix and a geographical distance matrix was assessed by means of Mantel tests using GENALEX version 6.1 (Peakall & Smouse, Reference Peakall and Smouse2006). Since Mantel tests are not so powerful to detect fine-scale structure because they are only sensitive to linear relationships of spatial autocorrelation (Heywood, Reference Heywood1991), additional spatial autocorrelation analyses were done under the Moran's I and the normalized Mantel r m approaches. The purpose of the Moran's I coefficient is to quantify the correlation of the values of a single variable (in this case the first extracted axis of a PCO) between pairs of individuals located at a given physical distance (Fortin et al., Reference Fortin, Dale, ver Hoef, El-Shaarawi and Piegorsch2002). On the other hand, the normalized Mantel r m, which is based on a Mantel statistic, estimates the linear relationship between two sets of variables taken at the same sampling locations (Escudero et al., Reference Escudero, Iriondo and Torres2003). Normalized Mantel r m coefficients were calculated using the pairwise Euclidean genetic distances extracted from GENALEX version 6.1 (Peakall & Smouse, Reference Peakall and Smouse2006).
It has been suggested that the sampling design can affect the estimation of the spatial genetic structure (Vekemans & Hardy, Reference Vekemans and Hardy2004). Vekemans & Hardy (Reference Vekemans and Hardy2004) proposed that sampling nearby individuals at different locations, and then organizing them into subgroups could be an alternative for characterizing fine genetic structure when there is not a homogeneous sampling. For this reason, the autocorrelation analyses were performed not only for the entire region (all 111 individuals) but also separately for each of the two localities (Pescadero and Cepitá). Every possible pair of individuals was considered as a join and assigned to 1 of 10 distance classes (according to the Euclidean distance separating the pair) in Pescadero and Cepitá, and 20 distance classes in the entire region. Distance classes were based on either equally sized or arbitrarily chosen intervals, each one containing at least 30 pairs of data. For the entire region and Pescadero, several intervals were tested ranging from 20 to 200 m, at regular increments of 10 m, and maximum distance classes of 4·8 and 1·4 km, respectively. For Cepitá, tested intervals ranged from 40 to 80 m, at regular increments of 10 m, with a maximum distance class of 590 m. These distance classes accounted for the smallest and largest spatial resolution possible for our dataset. The analyses were done following the classical rule of only considering pairs of points separated by less than half the maximum distance observed among all pairs (Wagner et al., Reference Wagner, Holderegger, Werth, Gugerli, Hoebee and Scheidegger2005). Moran's I and normalized Mantel r m coefficients were calculated using the PASSAGE software (Rosenberg, Reference Rosenberg2001). For these two approaches, the significance of individual coefficients was determined from their moments (Sokal & Oden, Reference Sokal and Oden1978), and significance for the entire correlograms was calculated using a Bonferroni criterion (Oden, Reference Oden1984).
3. Results
(i) Genetic diversity
A total of 58 scorable bands, ranging from 300 bp to more than 1000 bp, were generated using five ISSR primers containing CT or TC repeat units in 111 individuals. The five primers used are the following: no. 813 (CTC TCT CTC TCT CTC TT), no. 814 (CTC TCT CTC TCT CTC TA), no. 824 (TCT CTC TCT CTC TCT CG), no. 843 (CTC TCT CTC TCT CTC TRA) and no. 845 (CTC TCT CTC TCT CTC TRG). Of these bands, 50 were polymorphic (P=86·21%). Genetic diversity indexes, calculated either assuming HWE (I) or with the Bayesian approach (H B), did not differ significantly (0·453±0·009 and 0·484±0·227, respectively). Additionally, there was not a significant difference between the genetic diversity values between the localities of Pescadero and Cepitá (I=0·435±0·006 and H B=0·495±0·229 for Pescadero; I=0·441±0·005 and H B=0·493±0·231 for Cepitá).
(ii) Population structure
Results of the PCO analysis are shown in Fig. 2. The high overlap of individuals shows a pattern of very low differentiation between the two localities. In addition, the dendrogram constructed with UPGMA using the similarity matrix based on the Nei and Li coefficient did not suggest the presence of discrete geographical groups among individuals (data not shown). The average genetic similarity as measured by the Nei and Li coefficient (Nei & Li, Reference Nei and Li1979) was 0·84 and ranged from 0·987 to 0·672. Pairs of genetically distant individuals (Nei and Li coefficient close to 0·672) were found within the two localities (inside Pescadero and inside Cepitá) and also between the two localities. The AMOVA results indicate that most of the molecular variation in L. origanoides from the Chicamocha Canyon is found within localities (97%), with much less amount of variation among localities (3%) (ΦPT=0·034, P<0·001). Similarly, the Bayesian analysis shows a low level of genetic differentiation among localities (θII=0·032±0·021). All these results suggest the existence of a single population of L. origanoides in the central basin of the Chicamocha River.
The first two coordinates from the PCO, using squared Euclidean genetic distance, explained 28·8% of the total variability. The high overlap of individuals shows a pattern of very low differentiation between the two localities.

(iii) Spatial genetic structure
The presence of spatial genetic structure in the population of L. origanoides from the Chicamocha Canyon was evaluated by means of a Mantel test and fine-scale autocorrelation analyses. The Mantel test was carried out for the entire region (all 111 individuals) and showed a weak but significant correlation among genetic and geographical distance (r=0·074, P<0·05), suggesting that genetic variation within this population may be spatially structured. To further explore this, three separate fine-scale autocorrelation analyses (for the entire region, for Pescadero and for Cepitá) were conducted using both Moran's I and normalized Mantel r m. For the entire region and for Pescadero, autocorrelograms were conducted at distance class intervals ranging from 20 to 200 m. In both cases, significant autocorrelations were observed in all distance class intervals analysed and for intervals smaller than 150 m only positive spatial autocorrelations were observed (data not shown). Negative correlations were only observed when larger intervals were considered (i.e. 150–200 m). The correlograms for 150 m intervals are shown in Figs 3 and 4. For the entire region, the Moran's I autocorrelogram (Fig. 3 a) shows significant positive values at the first interval (0–150 m) and at the intervals 750–900 m, 900–1050 m and 1050–1200 m, indicating high genetic similarity shared by individuals within these distances. Figure 3 a also shows significant negative values at the intervals 1200–1350 m and 3500–4000 m, indicating that individuals separated for more than ~1·2 km are likely to be genetically more differentiated than expected from a spatial random distribution of genotypes. Similar results were obtained for the correlogram based on the normalized Mantel r m coefficient (Fig. 3 b) with significant positive values for the intervals 0–150 m and 300–450 m, and significant negative values for the intervals 1200–1350 m and 3500–4000 m. For Pescadero, the Moran's I autocorrelogram showed significant positive autocorrelation at the first interval (0–150 m) and significant negative autocorrelation at the last interval of 1200–1350 m (Fig. 4 a). This result was similar for the normalized Mantel r m autocorrelogram with an additional significant positive value at the interval 300–450 m (Fig. 4 b). In Cepitá, autocorrelograms for distance class intervals ranging from 40 to 80 m were obtained and a similar correlation pattern to that observed for the entire region and for Pescadero was found, but at a smaller scale (Fig. 5). The Moran's I autocorrelogram exhibited significant positive correlations at the first two distance intervals ranging from 0 to 120 m, whereas at the distance interval of 420–490 m, significant negative correlations were observed (Fig. 5 a). Similar results were obtained for the normalized Mantel r m autocorrelogram with an additional significant negative value for the last interval of 490–590 m (Fig. 5 b).
Spatial genetic structure in the entire region. Distance classes were defined at 150 m intervals. Black dots represent significant (P<0·05) Moran's I and normalized Mantel r m values. (a) Moran's I correlogram shows significant positive values at the intervals 0–150 m, 750–900 m, 900–1050 m and 1050–1200 m. At the intervals 1200–1350 m and 3500–4000 m, values were significantly negative. (b) Mantel correlogram shows significant positive values at the intervals 0–150 m and 300–450 m, and significant negative values at the intervals 1200–1350 m and 3500–4000 m.

Spatial genetic structure in Pescadero. Distance classes were defined at 150 m intervals. Black dots represent significant (P<0·05) Moran's I and normalized Mantel r m values. (a) Moran's I correlogram shows significant positive autocorrelation at the first interval (0–150 m) and significant negative autocorrelation at the last interval of 1200–1350 m. (b) Mantel correlogram shows similar results with an additional significant positive value at the interval 300–450 m.

Spatial genetic structure in Cepitá. Distance classes were defined at 60 m intervals. Black dots represent significant (P<0·05) Moran's I and normalized Mantel r m values. (a) Moran's I correlogram shows significant positive correlations at intervals ranging from 0 to 120 m and significant negative correlations at the interval 420–490 m. (b) Mantel correlogram showed similar results with an additional significant negative value for the last interval of 490–590 m.

4. Discussion
(i) Genetic diversity
L. origanoides from the Chicamocha Canyon exhibited relatively high levels of genetic variation indicated by a high P (86·21%) and relatively high I and H B (0·453 and 0·484, respectively). This level of genetic variation is higher than those reported previously for widely distributed species (Loveless & Hamrick, Reference Loveless and Hamrick1984; Gitzendanner & Soltis, Reference Gitzendanner and Soltis2000; Nybom, Reference Nybom2004). However, for a more meaningful comparison of genetic diversity, data from close relatives (e.g. congeners) should be analysed (Gitzendanner & Soltis, Reference Gitzendanner and Soltis2000). As far as we know, there have been no reports of genetic diversity in Lippia species, except for an unpublished study of Lippa alba and Aloysia triphylla (a species related to the genus Lippia) using ISSR markers (F. Martínez, G. Castillo & M. I. Chacón, 2008, personal communication). In that study, L. alba showed relatively high diversity values as measured by P (85·23%), I (0·418) and H B (0·436), and A. triphylla also showed a similar pattern for the same indexes: P (95·45%), I (0·436) and H B (0·461). Genetic diversity levels of these two widely distributed Verbenaceae species are similar or slightly higher than those obtained for L. origanoides. Other reports from widely distributed Verbenaceae species, which are not so closely related to L. origanoides, show comparatively similar or lower levels of genetic diversity. For example, reports from Vitex negundo L. in China have shown P ranging from 81 to 85% in some populations (Su et al., Reference Su, Qu, He, Zhang, Wang, Chen and Gu2003; Zhang et al., Reference Zhang, Zheng and Ge2007). Vitex rotundifolia L., an aromatic and medicinal plant from China, has shown moderate P (22·6%) and I (0·275) (Hu et al., Reference Hu, Zhu, Zhang, Xin, Qin, Lu, Rahman and Zheng2008).
In contrast with these results, a parallel analysis of DNA polymorphisms in four non-coding chloroplast DNA regions showed no genetic diversity among a set of L. origanoides individuals from the Chicamocha Canyon (Suárez et al., Reference Suárez, Martínez, Castillo and Chacón2007). ISSR polymorphisms used in the present study are presumably mostly from nuclear DNA. In this way, these apparently contrasting results may be explained by a higher mutation rate of microsatellite regions from the nuclear genome compared with the chloroplast genome (Morgante & Olivieri, Reference Morgante and Olivieri1993), and by the different modes of transmission of the complete chloroplast DNA (cpDNA) (usually maternally) and ISSRs (usually biparentally) (Birky, Reference Birky1995). The levels of genetic variation within populations may not only be influenced by the mating system of the species but also by its effective population size (Wright, Reference Wright1946; Culley & Wolfe, Reference Culley and Wolfe2001; Muir et al., Reference Muir, Lowe, Fleming and Vogl2004; Mable & Adam, Reference Mable and Adam2007), which is expected to be smaller for uniparentally than for biparentally inherited markers. However, it is important to note that the sampling scheme analysed in Suárez et al. (Reference Suárez, Martínez, Castillo and Chacón2007) was rather small; thus more samples are needed to assess intraspecific variation in the chloroplast genome.
There are several reports where outcrossing may yield high levels of genetic variation in a population (Culley & Wolfe, Reference Culley and Wolfe2001; Muir et al., Reference Muir, Lowe, Fleming and Vogl2004; Mable & Adam, Reference Mable and Adam2007). Given the relatively high levels of genetic diversity found in L. origanoides and the lack of a significant difference between the genetic diversity indexes calculated either assuming HWE or with the Bayesian approach, an important influence of outcrossing on the reproduction of this species could be inferred. However, this is a subject that deserves further investigation.
(ii) Population genetic structure
In this study, different approaches were used to estimate the level of genetic differentiation between individuals within and among localities in the central basin of the Chicamocha Canyon (Pescadero and Cepitá). Results from the PCO, UPGMA, AMOVA and the Bayesian approach (based on partitioned heterozygosity) showed a very low genetic differentiation among localities, which may suggest that in this region there is a single population where neither the river nor human disturbance is acting as a barrier to gene flow.
However, the spatial autocorrelation analyses using the Moran's I and normalized Mantel r m coefficients indicate that the distribution of genetic diversity within this population is not random among and within localities. The shape of the correlograms revealed significant fine-scale genetic structure within the Chicamocha Canyon. The Moran's I correlogram corresponding to the entire region (Fig. 3) showed what seems to be a sinusoidal variation in the first nine distance classes. This pattern may indicate a patchy distribution of the variation (Radeloff et al., Reference Radeloff, Miller, He and Mladenoff2000). However, at greater distances, only significant negative values or no significant values were displayed.
In general, there was a strong positive spatial association between individuals distributed within 0–1200 m from each other (0–120 m for Cepitá), whereas individuals distributed at a distance greater than ~1200 m from each other (490 m for Cepitá) showed significant negative autocorrelation (Figs 3–5). These spatial patterns of genetic relatedness are consistent with the classical model of isolation by distance, where there is a decline of genetic similarity with increasing geographical distance (Wright, Reference Wright1946). Among the different evolutionary and ecological processes that may lead to the establishment of this spatial genetic structuring, the most widely studied is limited gene dispersal (Epperson, Reference Epperson2000; Vekemans & Hardy, Reference Vekemans and Hardy2004). A variety of empirical data indicate that in several cases seeds show a localized dispersal rate resulting in patches of plants, whereas pollen may show a long-distance dispersal occurring at a higher frequency, which is enough to counteract the effects of genetic drift in small populations (Wright, Reference Wright1946; Ouborg et al., Reference Ouborg, Piquot and van Groenendael1999; Kalisz et al., Reference Kalisz, Nason, Hanzawa and Tonsor2001). ISSR polymorphisms are mostly located in the nuclear genome, which in most angiosperms shows a biparental inheritance, thus reflecting the combined effect of the relative movement of seeds and pollen. The moderate but significant levels of local spatial structure in L. origanoides, revealed by the spatial autocorrelation analyses, could be due in part to relatively restricted seed dispersal capabilities as it has been reported for different plant populations (e.g. Kalisz et al., Reference Kalisz, Nason, Hanzawa and Tonsor2001; Hardy et al., Reference Hardy, González-Martínez, Fréville, Boquien, Mignot, Colas and Olivieri2004; Hardesty et al., Reference Hardesty, Dick, Kremer, Hubbell and Bermingham2005). Also, it could be the result of short-distance pollen movement, as it has been reported for some shrubs and herbs (Marr et al., Reference Marr, Leebens-Mack, Elms and Pellmyr2000; Barthelmess et al., Reference Barthelmess, Richards and McCauley2006; Byrne et al., Reference Byrne, Elliott, Yates and Coates2007). Additional studies, including those that make use of different types of genetic markers (e.g. markers from cpDNA), will permit to evaluate the relative movement of seeds and pollen (McCauley, Reference McCauley1994; Trapnell & Hamrick, Reference Trapnell and Hamrick2004; Petit et al., Reference Petit, Duminil, Fineschi, Hampe, Salvini and Vendramin2005) and their influence on fine-scale population structure in this species.
The results from the present study are comparable with those obtained for tree species where distance classes of hundreds of metres were analysed (Doligez & Joly, Reference Doligez and Joly1997; Degen et al., Reference Degen, Caron, Bandou, Maggia, Chevallier, Leveau and Kremer2001) and where fine genetic structure at distance classes of hundreds of metres was found (Latouche-Hallé et al., Reference Latouche-Hallé, Ramboer, Bandou, Caron and Kremer2003; Hardesty et al., Reference Hardesty, Dick, Kremer, Hubbell and Bermingham2005). Numerous analyses in shrubs have found spatial genetic structure at finer scales, from 1 to 10 m (Loiselle et al., Reference Loiselle, Sork, Nason and Graham1995; England et al., Reference England, Whelan and Ayre2003; Tang et al., Reference Tang, Li, Geng, Zhang, Wang and Zhong2007). Future analyses may include a sampling strategy where shorter distances are considered.
Autocorrelation analyses are greatly affected by the sampling strategies used (Vekemans & Hardy, Reference Vekemans and Hardy2004). However, in the three autocorrelation analyses performed (Figs 3–5), a relatively large number of pairs of data were assigned to each distance class analysed; therefore, it is unlikely that the significant genetic structures detected in our analyses within proximate distances are artefacts of the sampling scheme.
(iii) Implications for conservation and breeding
The wide distribution and the relatively high genetic diversity estimated in the present study lead us to conclude that L. origanoides is not yet an endangered species. However, appropriate conservation and breeding strategies should be implemented if a massive oil production is planned. Previous studies on promising species from Africa and China have reported how species with wide distributions have become vulnerable because of the overharvesting of natural stands (Muchugi et al., Reference Muchugi, Lengkeek, Kadu, Muluvi, Njagi and Dawson2006; Tang et al., Reference Tang, Li, Geng, Zhang, Wang and Zhong2007). Currently, human disturbance is taking place in regions where L. origanoides exhibits a natural wide distribution (Malagon et al., Reference Malagon, Llinas and Chamorro1995; Albesiano et al., Reference Albesiano, Rangel and Cadena2003; Serrato, Reference Serrato2007). Habitat fragmentation caused by deforestation and transitory cultivation could lead to significant concerns regarding the conservation of this species. The estimation of the average size of genetic patches can be helpful in designing collection strategies for proper propagation and breeding purposes. Usually, the first x-intercept in the correlogram has been used as an estimate of the diameter of the patch (Peakall et al., Reference Peakall, Ruibal and Lindenmayer2003). However, this interpretation might be problematic since this distance is not a characteristic of the populations studied and depends strongly on the sampling scheme (Vekemans & Hardy, Reference Vekemans and Hardy2004). For these reasons, the present study does not allow us to predict the patch size appropriate for an accurate collection, but it does allow us to suggest that sampling individuals at distances greater than ~1·2 km along the transects where the samplings were conducted could result in the collection of different genotypes, which could help preserve the levels of genetic diversity in a propagation programme. Since different chemotypes have been identified within L. origanoides in the Chicamocha Canyon (Stashenko et al., Reference Stashenko, Ruiz, Muñoz, Castañeda and Martínez2008), additional research is needed to establish the relationship between essential oil composition and genetic variation, which will undoubtedly contribute to future breeding initiatives.
We are grateful to COLCIENCIAS, Colombia, for financial support through grant number RC 432-2004 and to the CENIVAM, Bucaramanga, Colombia, for providing support to carry out this research. We are also grateful to the Dirección de Investigaciones, Universidad Nacional de Colombia, Bogotá, Colombia, for their financial support of this research. We thank the Fundación Alejandro Angel Escobar, Colombia, for providing a scholarship to Adriana Suárez to perform this study. We are especially grateful to Professor Jorge Hernández Torres for his technical and logistic assistance and Lucio Navarro E. for his technical support. We are also especially grateful to Félix Martínez for his assistance in the development of this research and Stefanie Hartmann for revising the manuscript and providing valuable comments.


