

Increased attention has been focused on identifying patients who are at high risk of developing acute medical needs in the midst of a disaster.Reference Kelman, Finne and Bogdanov 1 Disasters not only wreak havoc on access to essentials such as food, shelter, and electricity but also cause significant disruptions in medical services and the usual care of patients with chronic disease.Reference Lee, Smith and McStay 2 , Reference Lee, Smith and Carr 3 Medically vulnerable populations present special challenges in disaster management, because they often lack the ability to fully prepare for emergencies.Reference Levin, Berliner and Merdjanoff 4
Thus, these populations merit special attention in disaster planning. They are often disproportionately challenged by disasters owing to complex chronic disease and lack of transportation, social support, or financial means.Reference Rudowitz, Rowland and Shartzer 5 , Reference Greenough, Lappi and Hsu 6 Following Hurricane Sandy, New York City acknowledged the need to address medically vulnerable populations in its post-Sandy assessment report. Specific recommendations included the creation of a “vulnerable populations and homebound door-to-door service and action plan” to improve outreach to these populations and ensure critical access to health care services, medicines, and medical supplies. 7
Previous work has identified that patients with end-stage renal disease who lose access to their dialysis centers suffer severe consequences during a disaster.Reference Lempert and Kopp 8 Ventilator-dependent patients may develop respiratory failure without electricity to run their devices.Reference Prezant, Clair and Belyaev 9 , Reference Freese, Richmand and Silverman 10 Anticipating these medical needs can prevent the medical complications that can develop in the early days after a disaster. Dialysis-dependent patients can be dialyzed in advance of an approaching hurricane.Reference Lurie, Finne and Worrall 11 Generators can be delivered to shelters in areas where residents are known to require ventilators.Reference Lien, Raimo and Abramowitz 12
With the development of new geographic methods to identify the location of patients with chronic disease, administrative data sets can be used to identify the geographic distribution of vulnerable populations at risk for developing acute medical needs during a disaster.Reference Runkle, Zhang and Karmaus 13 , Reference Hope, Merritt and Durrheim 14 Identifying the types of post-disaster medical needs that arise is a critical first step in preparing to address these needs in the wake of a disaster.Reference Hope, Merritt and Eastwood 15 But first we need a more complete understanding of the other types of patients who are likely to require acute medical care after a disaster.Reference Wilson, Little and Novick 16
The goal of this study was to understand the geographic distribution of emergency department (ED) use after a disaster.Reference Newman 17 We used data before and after Hurricane Sandy’s landfall to contrast ED utilization in the different administrative evacuation zones in New York City.Reference Sheppa, Stevens and Philbrick 18 , Reference Smith and Graffeo 19 We also performed a time-series analysis to identify the post-disaster acute medical needs that developed in different geographic regions. To do this, we identified which primary and secondary diagnoses increased significantly among patients accessing emergency care in the first few days after the storm.
Methods
Study Design
Using an all-payer claims database of ED visits from 2012 in New York City, we identified statistically significant deviations in ED use after Hurricane Sandy. We compared these post-disaster trends to baseline ED use in 2012 prior to October 29, the day that Hurricane Sandy made landfall.Reference Redlener and Reilly 20 We geographically matched the residence of ED patients to evacuation zones revised by the New York City Office of Emergency Management based on the damage inflicted by Hurricane Sandy (Figure 1). 21 Using a univariate time-series analysis, we contrasted the changes in ED use as stratified by the different levels of the evacuation zones. We then analyzed the frequency of ED visits for specific conditions and comorbidities to identify particular types of patients at high risk of developing post-disaster emergency medical needs.
New York City Flood Evacuation Zones. Revised administrative New York City flood evacuation zones established by the New York City Office of Emergency Management.

Data Source
The Statewide Planning and Research Cooperative System (SPARCS), housed within the New York State Department of Health, collects all-payer claims data from hospitals on ED visits and inpatient hospitalizations.Reference Quan 22 It is the most comprehensive resource for statewide ED utilization in New York State and includes privately insured, Medicare, Medicaid, and uninsured patients. In addition to patient demographics and insurance class, it includes data on diagnosis codes and patient addresses that can be used to identify the exact location of a patient’s residence.
Study Population
Our study included all adult patients aged 18 years and older who visited a New York City ED in 2012 and had a home address located in New York City. We excluded patients from correctional facilities and nursing homes and patients who visited an ED associated with a specialty hospital (ie, surgical subspecialty, oncological, or Veterans Administration facilities). These exclusions were performed so that the study population included noninstitutionalized New York City adults who visited a 911-receiving ED based at a general, acute care hospital in New York City.
Evacuation Zones
To stratify ED patients by the impact of Hurricane Sandy, we matched patient addresses to newly established evacuation zones in New York City. These evacuation zones were revised in response to Hurricane Sandy’s impact and are areas of the city that may be inundated by storm surge or isolated by storm surge waters (Figure 1). There are 6 zones, ranked by the risk of storm surge impact, with zone 1 being the most likely to flood and zone 6 being the least likely to flood. We designated zone X as regions deemed not at risk for flooding.
These zones were developed by the Office of Emergency Management and can be found in the city’s open-source geographic shapefile called Atomic Polygons (Release 15B, April 2015). This file is available from the BYTES of the BIG APPLE family of software, data, and geographic files maintained by the New York City Department of City Planning. 21
The geographic granularity of this shapefile offered high resolution, with the average geographic unit having an area of only 0.005 square miles. To match ED patients to a specific evacuation zone, we geocoded the patients’ home addresses to pinpoint their residence to a precise geographic location. Then, patients were analyzed by evacuation zone to compare the different patterns of medical conditions and comorbidities that developed in areas that were generally more affected versus less affected by the hurricane.
ICD-9 Diagnosis Code Categories
To identify specific types of medical conditions for which ED utilization increased, we analyzed primary International Classification of Diseases, 9th Revision (ICD-9), diagnosis codes to differentiate the causes of ED use after Hurricane Sandy. We used the first 3-digit and letter prefix to group closely related ICD-9 codes.Reference Lee, Long and Wall 23 We also separately analyzed secondary diagnosis codes to assess for patients’ comorbidities and chronic conditions that may have contributed to or influenced their patterns of ED utilization after Hurricane Sandy. These secondary ICD-9 codes were similarly analyzed by their prefix containing the first 3 digits or letters.
Statistical Analysis
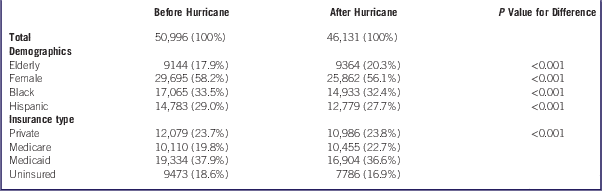
We first examined the demographic characteristics and insurance status of patients stratified by the different evacuation zones for the 1-week period before and after Hurricane Sandy’s landfall.Reference Smith and Graffeo 19 , Reference Platz, Cooper and Silvestri 24 We compared the distribution of elderly (aged 65 years and older), female, black, and Hispanic patients and also analyzed the distribution of insurance status as categorized by privately insured, Medicare, Medicaid, and uninsured patients. To compare these patient characteristics for the 1 week before and after Hurricane Sandy, we used chi-square tests to identify significant changes in the distribution of these demographic characteristics and insurance status.
To perform our time-series analysis, we used the daily ED volume in 2012 prior to the storm to compute a baseline average utilization and standard deviation for the pre-hurricane period. We used these data to compute daily z-scores after the hurricane to assess for statistically significant deviations in ED utilization in the first few days after the storm. This analysis was segmented by evacuation zone for overall ED utilization and for each primary and secondary diagnosis code category.
In our evaluation of statistically significant deviations of ED utilization, we used a Bonferroni correction to obtain an adjusted P value of 0.000048 to account for the multiple comparisons among the 1042 unique 3-digit and letter ICD-9 code prefixes for primary and secondary diagnosis code categories. This value correlated to a z-score of 3.9, meaning that any statistical deviation in ED utilization more than 3.9 standard deviations above the prehurricane mean was considered a statistically significant change in ED utilization within ICD-9 diagnosis code categories.
Since we also analyzed utilization patterns over time, we further restricted significant results to those categories that were statistically significant for at least 2 consecutive days, because we wanted to identify those diagnoses that resulted in a sustained increase in utilization. In addition, some ICD-9 categories usually had zero daily observations, meaning that the standard deviation was small. In these cases, 2 consecutive days of a single ED visit per day might achieve statistical significance by these criteria. We discounted these categories that were significant only due to counts of one observation for consecutive days, because there was a higher probability that these events occurred by chance alone.
Statistical analyses were performed by using Stata 12.1 (StataCorp, College Station, TX). Geographic analysis was performed by using ArcGIS Desktop 10.2 (ESRI, Redlands, CA).
Ethics
This conduct of this study was approved by the Institutional Review Board of the NYU School of Medicine and the SPARCS Data Protection Review Board at the New York State Department of Health.
Results
Study Population
In the 1 week before Hurricane Sandy, New York City residents made a total of 50,995 ED visits. During the 1 week after the storm, citywide ED visits decreased by 9.5% to 46,131. We found a statistically significant increase after Hurricane Sandy in the proportion of ED patients who were elderly and insured by Medicare. ED utilization immediately after Hurricane Sandy decreased among patients who were female, black, Hispanic, insured by Medicaid, or uninsured (Table 1).
Emergency Department Patient Characteristics 1 Week Before and After Hurricane Sandy in New York City
Overall ED Utilization
In the time series analysis of overall ED utilization, we found that in the days after Hurricane Sandy, ED use in the least vulnerable region (zone X) decreased by 4.0 standard deviations on the day of the storm (day 0) and remained decreased by 2.2 standard deviations on the day after the hurricane. By day 2, overall ED utilization in zone X had returned to baseline (Figure 2). We found a similar pattern of overall ED utilization for zones 3 through 6.
Deviations in Daily ED Utilization in 2012 Stratified by Evacuation Zones.
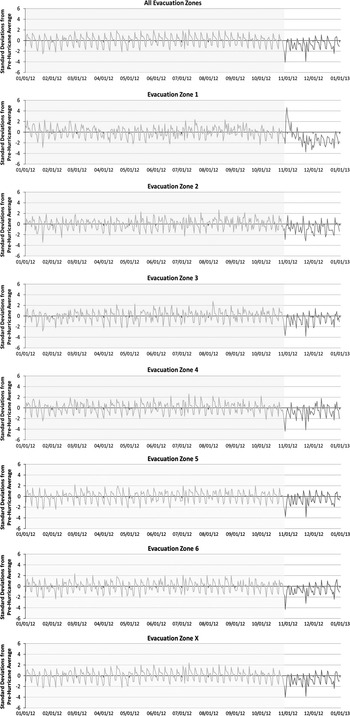
In more vulnerable regions, a different pattern emerged. For zone 2, ED utilization decreased on the day of the hurricane, but only by 2.9 standard deviations. The day after the storm was not substantially different from prior patterns of ED utilization. In zone 1, overall ED utilization decreased on the day of the storm by 2.2 standard deviations, but increased by 3.2, 4.6, 2.8, and 2.0 standard deviations on days 1 through 4 after the hurricane. By day 5, overall ED utilization was similar to prior patterns of ED utilization (Figure 2).
Primary Diagnoses
In our analysis of primary diagnoses, we found 13 distinct ICD-9 diagnosis code categories in zone 1, which had consecutive days of statistically significant increased ED utilization after Hurricane Sandy. Many of these categories included renal-associated conditions (ie, dialysis dependence, chronic kidney disease, hypertensive kidney disease, and electrolyte abnormalities) and respiratory-associated conditions (ie, ventilator dependence, chronic obstructive pulmonary disease, and pulmonary fibrosis). Other diagnosis code categories that had statistically significant increases in ED utilization included diabetes, drug dependence, external exposure, hypothermia, homelessness, and administrative encounters (Figure 3).
Primary ICD-9 Diagnosis Code Categories With Increased Frequency Among ED Patients as Stratified by Evacuation Zone. Abbreviations: ED, emergency department; ICD-9, International Classification of Diseases, 9th Revision.
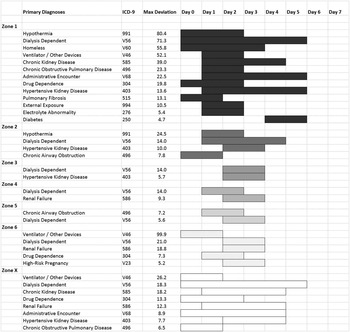
The timing and duration of these increases in ED utilization differed by diagnosis code category. Some increases for categories such as dialysis dependence, drug dependence, hypothermia, homelessness, and pulmonary fibrosis were seen as early as the day of the hurricane (day 0), whereas ED visits for diabetes as the primary diagnosis were delayed until days 4 and 5 after the storm. The category with the longest duration of statistical significance was for dialysis dependence, which was statistically significant from day 0 through day 5. No categories achieved statistical significance beyond day 5 after the storm based on our conservatively adjusted P value and requirement of at least 2 consecutive days of statistical significance.
As for other less vulnerable evacuation zones, zone 2 had fewer diagnosis code categories achieving statistically significant increases in ED use after Hurricane Sandy. These categories achieving statistical significance included dialysis dependence, hypothermia, hypertensive kidney disease, and chronic airway obstruction. Zones 3 through 5 had only 2 categories achieving statistical significance, which were renal or respiratory conditions. Zones 6 and X had more diagnosis code categories reaching statistical significance, most of which overlapped with categories from zone 1. Notable exceptions included hypothermia, which only occurred in zones 1 and 2, and diabetes, which only occurred in zone 1.
Secondary Diagnoses
In our analysis of secondary diagnoses, we identified increased frequency of ED utilization among patients with ICD-9 diagnosis code categories that were generally similar to those identified as primary diagnoses (Figure 4). In zone 1, overlap between primary and secondary diagnosis code categories included renal conditions (ie, chronic kidney disease, dialysis dependence, and hypertensive kidney disease), respiratory conditions (ie, ventilator dependence), and other categories (ie, diabetes and homelessness). However, additional categories were identified in secondary diagnoses, notably amputation status, ostomy status, dementia, and cardiac conditions (ie, coronary artery disease, cardiac dysrhythmia, hypertension, and heart failure). Several special categories of secondary diagnoses such as isolation requirement and drug-resistant infections also had statistically significant increases in ED utilization.
Secondary ICD-9 Diagnosis Code Categories With Increased Frequency Among ED Patients as Stratified by Evacuation Zone. Abbreviations: ED, emergency department; ICD-9, International Classification of Diseases, 9th Revision.
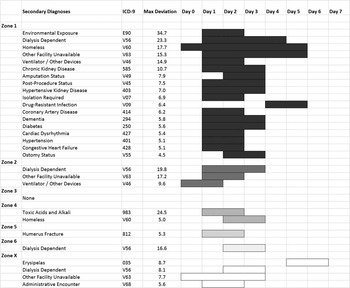
As for less vulnerable evacuation zones, zone 2 had fewer secondary diagnosis code categories meeting criteria for statistical significance; these included dialysis and ventilator dependence. Other evacuation zones had even fewer secondary diagnosis code categories meeting statistical significance, except for zone X, which covered the largest geographic area and accounted for the highest proportion of ED patients. Notably, in zones 1, 2, and X, the ICD-9 diagnosis code category matching “other facility unavailable” also achieved statistical significance as a secondary diagnosis.
Discussion
The first step to building resiliency among medically vulnerable populations requires identification of patients at high risk for developing acute medical or social needs after a disaster. 25 Through the experience of previous disasters, patients requiring renal dialysis and those who are ventilator-dependent have received special attention, because they have been previously identified as high-risk populations.Reference Lin, Pierce and Roblin 26 Our study systematically identified the other types of patients at marked risk for developing disaster-related acute medical needs.
Using our methods, we confirmed that dialysis- and ventilator-dependent patients could be identified as being at higher risk for developing acute medical needs in the first days after a disaster.Reference Lurie, Finne and Worrall 11 , Reference Platz, Cooper and Silvestri 24 In addition, we identified that elderly patients are more likely to use ED care, especially in disaster-prone areas.Reference Behr and Diaz 27 , Reference Cherniack 28 Primary diagnoses that contributed to higher ED utilization in higher-level evacuation zones also included diabetes and social determinants of health, such as homelessness. In addition, patients more frequently presented with hypothermia and external exposures in regions identified as being more vulnerable to the effects of the disaster. In terms of secondary diagnosis code categories, we found additional categories that were related to increased ED utilization in disaster-prone areas. Patients with dementia, cardiac comorbidities, amputations, or ostomies were more likely to develop acute medical needs after Hurricane Sandy. Interestingly, a statistically higher number of patients required isolation status or had drug-resistant infections.
In addition, we found that although most of these primary and secondary diagnosis code categories started in the first few days after the disaster, certain conditions seemed to have a delayed presentation. For instance, among the primary diagnoses, patients with diabetes-related conditions did not start showing up in statistically significant numbers 4 and 5 days after Hurricane Sandy. This finding may relate to the fact that patients with diabetes may be able to last longer without medical care than patients with dialysis or ventilator dependence, but eventually end up having to visit an ED a few days after the storm. In analyzing secondary diagnosis code categories, patients with ostomies or amputation delayed presentation until day 2, perhaps reflecting the lack of secondary home caregivers to assist patients with these conditions (eg, visiting nurses). Drug-resistant infections and skin and soft tissue infection (ie, erysipelas) were both categories that were delayed in presentation until days 4 and 5.
Overall, in addition to the well-studied dialysis- and ventilator-dependent patients, we found that patients who are elderly; have diabetes, dementia, or cardiac comorbidities; experience physical limitations such as amputation; or have other complex medical needs such as ostomies are more likely to have increased use of EDs after a disaster such as Hurricane Sandy. This increased use could represent development of new acute medical needs, but many of these diagnosis code categories seem to relate to difficulties in managing chronic conditions. In addition, our study demonstrates that hospitals may need to be prepared for more patients with environmental exposures such as hypothermia, those requiring isolation, and those who develop drug-resistant infections.
Notably, some diagnosis code categories cross evacuation zones. Dialysis dependence especially was a diagnosis code category that was statistically significant outside the most vulnerable evacuation zones and was increased even in nonevacuation zones. These findings may be due to our use of administrative flood evacuation zones, which did not map exactly to other phenomenon caused by the storm such as power outages, which may have a more direct effect on the availability of other health care facilities such as dialysis centers.
In addition, we found evidence of other systemic health care disruptions in our ED utilization data. The secondary diagnosis code category for “other facility unavailable” demonstrated statistically significant increases after Hurricane Sandy. Drug dependence encounters also increased, which may be related to known loss of methadone treatment centers.Reference McClure, Mendoza and Duncan 29 In addition, administrative encounters were also frequent, which we found almost universally to be visits for prescription refills, evidence of disruption of access to primary care. In each of these cases, the resulting effect was an increase in ED use, which reflects the need to anticipate and prepare for these disruptions. In addition, EDs may be an initial place to engage those individuals who have experienced loss in their usual access to health care.
We were surprised to find that several nonmedical and social diagnosis code categories were identified in our analyses. In zone 1, one of the ICD-9 diagnosis code categories showing the strongest uptick in ED visits after Hurricane Sandy was the code for homelessness. We were unable to determine if these patients represented newly homeless individuals as a result of hurricane damage or existing homeless patients unable to access their regular shelters or safely live outdoors during and after the hurricane. New York City’s Department of Homeless Services already initiates additional homeless outreach during periods of increased environmental risk (eg, freezing temperatures or heat advisories). Our study suggests the critical role of targeted efforts to assist people who are homeless during and after disasters like Hurricane Sandy. Our findings also underscore the ED’s role not just as a “medical safety net” but also as a “social safety net,” a phenomenon not limited to post-disaster periods.Reference O’Toole, Conde-Martel and Gibbon 30 , Reference Doran, Vashi and Platis 31 However, this role of EDs may be magnified during disasters.
We were also surprised that some diagnoses were markedly absent in our analyses. Many studies have identified individuals with psychiatric diagnoses to be a critically important vulnerable population during disasters.Reference Boscarino, Hoffman and Adams 32 However, we did not see any increases in specific psychiatric ICD-9 diagnosis code categories among primary or secondary diagnosis code categories. The reasons for this absence may be a detection issue, as we had stringent requirements for which categories reached statistical significance. However, the absence may also indicate a critical gap in care that develops after a disaster. It may be that the presentation of psychiatric conditions is delayed and occurs weeks to months after disasters. Vulnerable populations may be unable to access care for various reasons. If patients with psychiatric conditions are compromised in their ability to access care when disasters strike, their lack of engagement with the medical system may place them at subsequent risk for poor outcomes after a disaster.Reference Neria and Shultz 33
Limitations
Our study was a geographic analysis of ED administrative claims data, which means that it was subject to coding errors that can occur in collection of data. In addition, we used municipal administrative evacuation zones developed post hoc based on the damage incurred by Hurricane Sandy. These areas may not precisely match the true underlying geographic impact of Hurricane Sandy, particularly for electrical failures. Given the number of ICD-9 diagnosis code categories that we examined, we made adjustments to the level of statistical significance required to identify a category with increased ED utilization. Important categories of ED utilization may have been missed by using this stringent requirement for statistical significance. Finally, our study was limited to New York City, a unique and dense urban environment, and to Hurricane Sandy. The findings of our study may not be generalizable to other regions of the country or to other types of disasters in which different changes in ED utilization may occur.
Conclusions
Our study adds several concrete findings that can improve disaster preparedness and response. First, overall ED utilization generally decreased in the early days after Hurricane Sandy, consistent with prior studies of disasters. However, we found that the most disaster-prone regions actually demonstrated increases in ED utilization. Early ED utilization may predict those areas most significantly affected by a disaster. Similar to early warning systems, an uptick in ED utilization in a given geographic area may be an initial indication of those areas most severely affected by a given disaster. Close monitoring of the geographic distribution of ED utilization may provide those involved in disaster management with a means of making early decisions on resource deployment based on concrete data.
Second, we identified additional populations at risk for developing acute medical needs after a disaster. These included chronic diseases (eg, diabetes, cardiac comorbidities), complex medical needs (eg, ostomy, amputation), other contributors to vulnerability (eg, advanced age, dementia), and social determinants of health (eg, homelessness). We also noted an increased frequency of ED visits for disaster-related conditions (eg, hypothermia, environmental exposures), advanced medical needs (eg, drug-resistant infections, isolation requirement), and disruption of the availability of other health care facilities. Hospitals should be prepared to handle each of these critical issues in the event of a disaster. We also found a high number of administrative encounters for prescription refills, which may be amenable to mobile or temporary pharmacy solutions.
Third, we discovered that patients with particular medical conditions may present in different phases, demonstrating that medical needs may evolve after a disaster. We confirmed that dialysis-dependent and ventilator-dependent patients present early, as previously described. In addition, patients with hypothermia and environmental exposures may present in the early periods after a disaster. First responders must be prepared for medically vulnerable populations with complex medical needs and special cases and conditions, especially given that response may be hampered by the severity of the disaster or electrical outages. In addition, we found a somewhat delayed increase in ED use among patients with diabetes. Delivery of diabetes medications to disaster-prone areas may reduce the need for ED utilization and improve management of these important chronic conditions. Patients with certain types of chronic disease may be able to manage in the first few days after a disaster but eventually develop the acute need to access medical care.
Finally, these methods of ED surveillance to identify medically vulnerable populations can also be used to identify areas with a high density of patients with disaster-sensitive medical conditions and comorbidities in advance. Maps that show “hot spots” of these disaster-sensitive conditions can be used to prioritize disaster preparedness activities, create population-specific evacuation plans, and help deploy resources during disaster response. In this way, understanding the geography of disaster-related ED use can help to shape our management of future disasters.
Acknowledgments
A portion of this work was presented in abstract form at the 2015 Hurricane Sandy Conference: Translating Research into Practice, New York, NY, August 2015.
Funding
This work was funded by the US Department of Health and Human Services, Office of the Assistant Secretary for Preparedness and Response (ASPR), award number HITEP 150030-01-00, to the NYU School of Medicine. Additional funding was received from ASPR, award number HITEP130006-01-00, by the NYU School of Medicine. For work unrelated to the current study, SWS derives additional salary support from the Fridolin Charitable Trust to the Ronald O. Perelman Department of Emergency Medicine Safety Program and has received an intramural departmental innovation grant.
Disclaimer
The funding agency (ASPR) played no role in the design or conduct of the study; collection, management, analysis, or interpretation of the data; preparation of the manuscript; or decision to publish. The content of this article is the responsibility of the authors and does not necessarily represent the official views of the US Department of Health and Human Services, ASPR, the NYU School of Medicine, the Sidney Kimmel Medical College, or any employers, affiliations, named entities, or other funding agencies. Dr Carr spends a portion of his time as the Director of the Emergency Care Coordination Center in the US Department of Health and Human Services. The views expressed here do not necessarily represent those of the US government.


