

Auditory hallucinations are one of the most commonly experienced and distressing symptoms of schizophrenia, but can also occur in the healthy population. Reference De Leede-Smith and Barkus1 Recent evidence suggests that auditory hallucinations may result from abnormally enhanced sensitivity of the auditory regions of the brain to external auditory stimuli. In particular, this may arise when individuals are paying specific attention to auditory signals. Reference Hunter, Eickhoff, Miller, Farrow, Wilkinson and Woodruff2,Reference Lewis-Hanna, Hunter, Farrow, Wilkinson and Woodruff3 We aimed to test whether hallucination-prone individuals would show a bias towards auditory signals during audiovisual perception when directing attention to stimuli in the auditory modality. We predicted that highly hallucination-prone individuals would display enhanced sensitivity to auditory stimuli under conditions of auditory attention in comparison with individuals who are less prone to having hallucinatory experiences.
Method
Participants
Two hundred healthy volunteers participated, the majority of whom were students or staff at the University of Sheffield. The sample comprised 89 males and 111 females, with a mean age of 26.49 years (s.d. = 12.22; range = 18–68). All participants declared normal or corrected-to-normal sight and none declared any hearing impairments. Visual acuity was not formally assessed. No participants reported any past or current history of psychiatric or neurological disorders. Written informed consent was obtained from all participants prior to their participation. This study was approved by the University of Sheffield Medical School Research Ethics Committee.
Materials and apparatus
All participants performed an audiovisual temporal order judgement (TOJ) task. Data were collected using a Toshiba Satellite Pro A300 laptop, using ‘Presentation version 14.9’ software to run the task. 4 Responses were made using the left and right arrow keys on the laptop keyboard. The auditory stimuli were presented using Sennheiser HD 202 headphones. Throughout the task, participants were seated approximately 45 cm from the computer screen. All participants were assessed by the first author in a quiet room with minimal external noise and visual distractions in order to ensure the uniformity of testing conditions for all participants.
Task stimuli and experimental procedure
The audiovisual TOJ task was performed by all participants to provide a measure of their sensitivity to auditory and visual stimuli under attention-driven conditions. The auditory stimulus was a 1000 Hz tone delivered through headphones, at an approximate sound-pressure level of 65 decibels. The visual stimulus was a white circle of 60 mm in diameter, which was presented at the centre of the laptop computer screen on a black background in front of the participant. The duration of both stimuli was 20 ms.
All patients participated in two experimental conditions, an ‘attend-auditory’ condition and an ‘attend-visual’ condition. In the task, participants' attention was focused on either the auditory or the visual sensory modality by altering the task instructions. For the ‘attend-auditory’ condition, participants were instructed to ‘Click “yes” when the bleep comes first and “no” when it doesn't’. For the ‘attend-visual’ condition, participants were instructed to ‘Click “yes” when the flash comes first and “no” when it doesn't’. In this way, we aimed to implicitly manipulate participants' attention, thus reducing the possibility that responses would be biased by explicit instructions to attend to a particular sensory modality.
The audiovisual stimulus pairs were presented at 11 different stimulus onset asynchronies (SOAs): −240, −120, −90, −60, −30, 0, 30, 60, 90, 120 and 240 ms. This range of SOAs was the same as in previous studies. Reference Keetels and Vroomen5 The SOA represents the interval, in milliseconds, between the onsets of the two stimuli. Here, the negative values indicate that the attended stimulus was presented first (before the unattended stimulus), and the positive values indicate that the attended stimulus was presented second (after the unattended stimulus). Responses were made using the left and right arrows of the laptop keyboard. Participants had 3.5 s to respond before the next stimulus pair was presented and were instructed to respond as quickly and accurately as possible.
Prior to commencing the task, participants completed a practice block for each of the experimental conditions. The practice block consisted of five pairs of stimuli at SOAs of −240, −120, 120 and 240 ms. Feedback was given to participants during the practice blocks as to whether they had responded correctly or incorrectly.
In the testing phase, the task comprised six blocks (three for each attention condition), which each consisted of 110 stimulus pairs. Task block order was either AVAVAV or VAVAVA for each participant, where ‘A’ represents the ‘attend-auditory’ condition and ‘V’ represents the ‘attend-visual’ condition. Task block order was alternated for each successive participant.
In total, there were 30 trials for each attentional condition for each of the 11 SOAs (660 trials in total). Each task block lasted approximately 8 min. Participants were encouraged to take breaks between the task blocks, and were informed that they could ‘pause’ the task at any time if required to maintain their concentration. The total testing time was approximately 45 min.
Questionnaires
Participants completed the revised Launay–Slade Hallucination Scale (LSHS-R) Reference Launay and Slade6,Reference Bentall and Slade7 which provides a measure of general hallucinatory predisposition in non-clinical samples. The scale was constructed using items related to clinical symptoms such as auditory and visual hallucinations, and possible subclinical forms such as intrusive thoughts and vivid daydreams. Higher scores indicate higher hallucination proneness. The LSHS-R allowed for the subsequent division of the sample into high and low hallucination-proneness groups.
To examine whether our measure was specific to auditory hallucinations or other schizotypal personality traits, we administered the Schizotypal Personality Questionnaire (SPQ), Reference Raine8 a measure of schizotypal personality traits based on the DSM-III-R diagnostic criteria for schizotypal personality disorder. The SPQ tests for traits related to the nine features of the DSM-III-R diagnostic criteria for schizotypal personality disorder: ideas of reference, excessive social anxiety, odd beliefs, unusual perceptual experiences, eccentric behaviour, no close friends, odd speech, constricted affect and suspiciousness.
Given the potential for the underreporting of psychiatric symptoms in a university population, a 21-item Lie Scale, taken from the Eysenck Personality Questionnaire, Reference Eysenck, Eysenck and Barrett9 was randomly integrated in the SPQ. Use of the Lie Scale scores enabled us to control for underreporting of psychological difficulties when analysing the data. Illicit drug use and current medication (if applicable) were also recorded. Finally, participants were screened for potential hearing impairments using the Hearing Handicap Inventory for Adults (HHIA). Reference Newman, Weinstein, Jacobson and Hug10
Data analysis
Proportions of ‘yes’ responses at each SOA for both attentional conditions were calculated for every individual and displayed as a psychophysical function (Fig. 1). These functions showed a sigmoidal pattern that increased gradually at first, more rapidly in the middle, and slowly towards the end. The following model (the Morgan-Mercer-Flodin family function) was shown to be the best fit for the individual data, using the curve fitting software, CurveExpert 1.4. Reference Hymans11
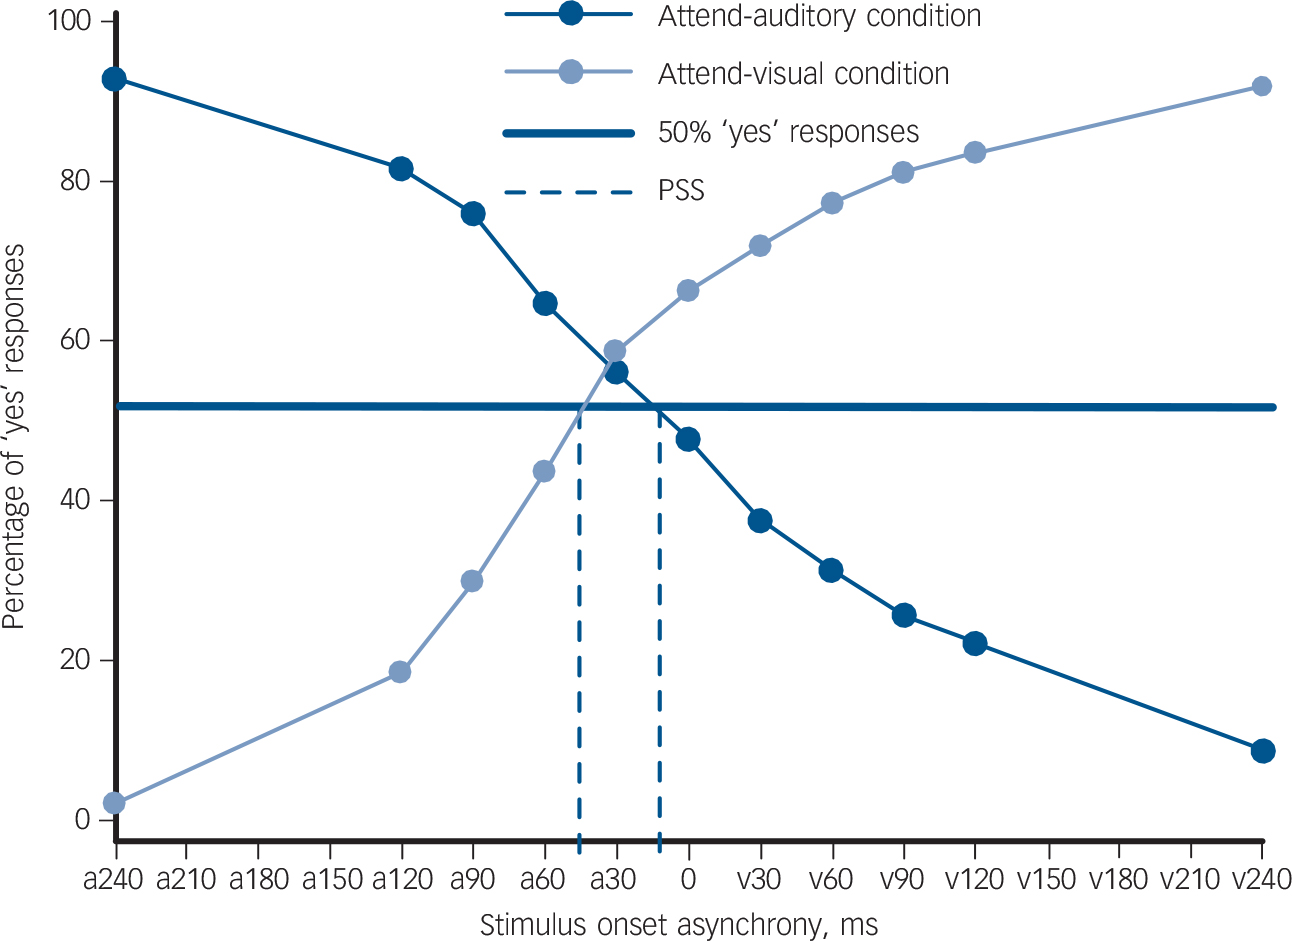
The proportion of ‘yes’ responses at each stimulus onset asynchrony (SOA) for both the attend-auditory and attend-visual conditions.
The dark blue circular markers represent the mean percentage of ‘yes’ responses at each SOA for the attend-auditory condition in which participants were asked to ‘click “yes” when the tone comes first and “no” when it doesn't’. The light blue circular markers represent the mean percentage of ‘yes’ responses for each SOA under the attend-visual condition, in which participants were asked to ‘click “yes” when the circle comes first and “no” when it doesn't’. The x-axis shows the SOA between the stimuli. On the x-axis, ‘a’ demonstrates that the auditory stimulus was presented before the visual stimulus and ‘v’ indicates that the visual stimulus was presented before the auditory. The y-axis represents the percentage of ‘yes’ responses for each condition. The intersection of the attend-auditory and attend-visual lines with the bold blue line (50% ‘yes’ responses) represents the point of subjective simultaneity (PSS) for each condition, further indicated by the blue dashed lines.
where y was proportion of ‘yes’ responses and x was SOA. The four parameters in this model (a–d) were initially not weighted in accordance with previous studies. Reference Lee, Egleston, Brown, Gregory, Barker and Woodruff12
We calculated the point of subjective simultaneity (PSS) for each attentional condition in each individual. The PSS represents the SOA at which a participant is equally likely to perceive either stimulus as first (50% ‘yes’ responses) and hence can be calculated by taking the value of the function when y = 50.
Given that positive SOAs indicate that the unattended stimulus was presented before the attended stimulus, the PSS value increases as the processing speed of the attended stimulus relative to the unattended stimulus increases. For example, in the attend-auditory condition, a PSS of +50 ms means that the participant perceived the stimuli to be simultaneous when the visual stimulus was presented 50 ms before the auditory stimulus. Thus, when attending to a particular sensory modality, the higher the PSS, the greater the attention-driven sensitivity towards stimuli presented in that sensory modality.
In accordance with previous studies, Reference Spence, Shore and Klein13–Reference Lee, Dixon, Spence and Woodruff15 participants were excluded from the analysis for one of four reasons: if the PSS value or the 25th or 75th percentiles of their psychophysical function could not be calculated, if their 25th and 75th percentile values were less than −480 ms or greater than +480 ms, if very poor concentration was observed by the examiner or reported by the participant, or if participants scored higher than 20 on the HHIA, indicating poor hearing acuity. We did not collect any information on short-term memory or other higher cognitive abilities, as working memory has been shown not to be associated with TOJ performance. Reference Busey, Craig, Clark and Humes16
Results
Sample characteristics
Of the 200 healthy volunteers who participated in the study, 46 participants were excluded (19 males, mean age 28.23 years). Forty-four participants were excluded as they were unable to perform the TOJ task with a sufficiently high level of accuracy, according to the criteria listed above. One further participant was excluded from the data analysis because of a hearing impairment and another was excluded because of an experimental error. The mean age of the remaining sample was 25.97 (s.d. = 11.95, range 18–68; 70 males, 84 females).
Overall, excluded participants had higher mean SPQ scores than those who were included, a finding which approached significance (U = 2887.0, P = 0.057). Exclusion from the analysis was not related to age (t = −1.107, P = 0.270), gender (χ2(1 d.f.) = 0.247, P = 0.619), use of illicit drugs (χ2(1 d.f.) = 1.865, P = 0.172) or medication (χ2(1 d.f.) = 0.108, P = 0.742).
The effect of attention on stimulus perception
Participants' data were analysed as a whole to determine whether or not the prior entry effect had been elicited from patients. The mean attend-auditory PSS for the sample was −1.97 ms (s.d. = 54.88) and the mean attend-visual PSS was 57.45 ms (s.d. = 61.15), and they were statistically different (Wilcoxon signed-rank test: Z = 7.698, P<0.001). This is displayed graphically in Fig. 1.
The LSHS-R groups revealed in the cluster analysis
A hierarchical agglomerative cluster analysis using Ward's method was performed on the LSHS-R data to separate participants based on their level of hallucination proneness. Analysis of the agglomeration schedule revealed an inconsistent increase in variance in the transition between the agglomeration coefficients for a two-cluster solution and a three-cluster solution. A two-cluster solution was therefore shown to be the optimal solution as succeeding clusters added much less to distinguishing between cases. Cluster number and membership were shown to be stable when the analysis was repeated on a random half of the sample.
The first cluster consisted of 63 participants with a mean LSHS-R score of 21.13 (s.d. = 5.46). This represents the high-scoring participants. The other cluster contained 91 participants, with a mean LSHS-R score of 7.64 (s.d. = 3.75), representing the low scoring individuals. There was no significant difference between clusters: in age (t = −0.478, P = 0.633), gender (χ2 (1 d.f.) = 0.044, P = 0.834), use of illicit drugs (χ2 (1 d.f.) = 0.713, P = 0.398), medication (χ2 (1 d.f.) = 1.185, P = 0.276) or hearing acuity (U = 2700.5, P = 0.371).
Differences in attention-driven auditory sensitivity between the high and low hallucination-proneness groups
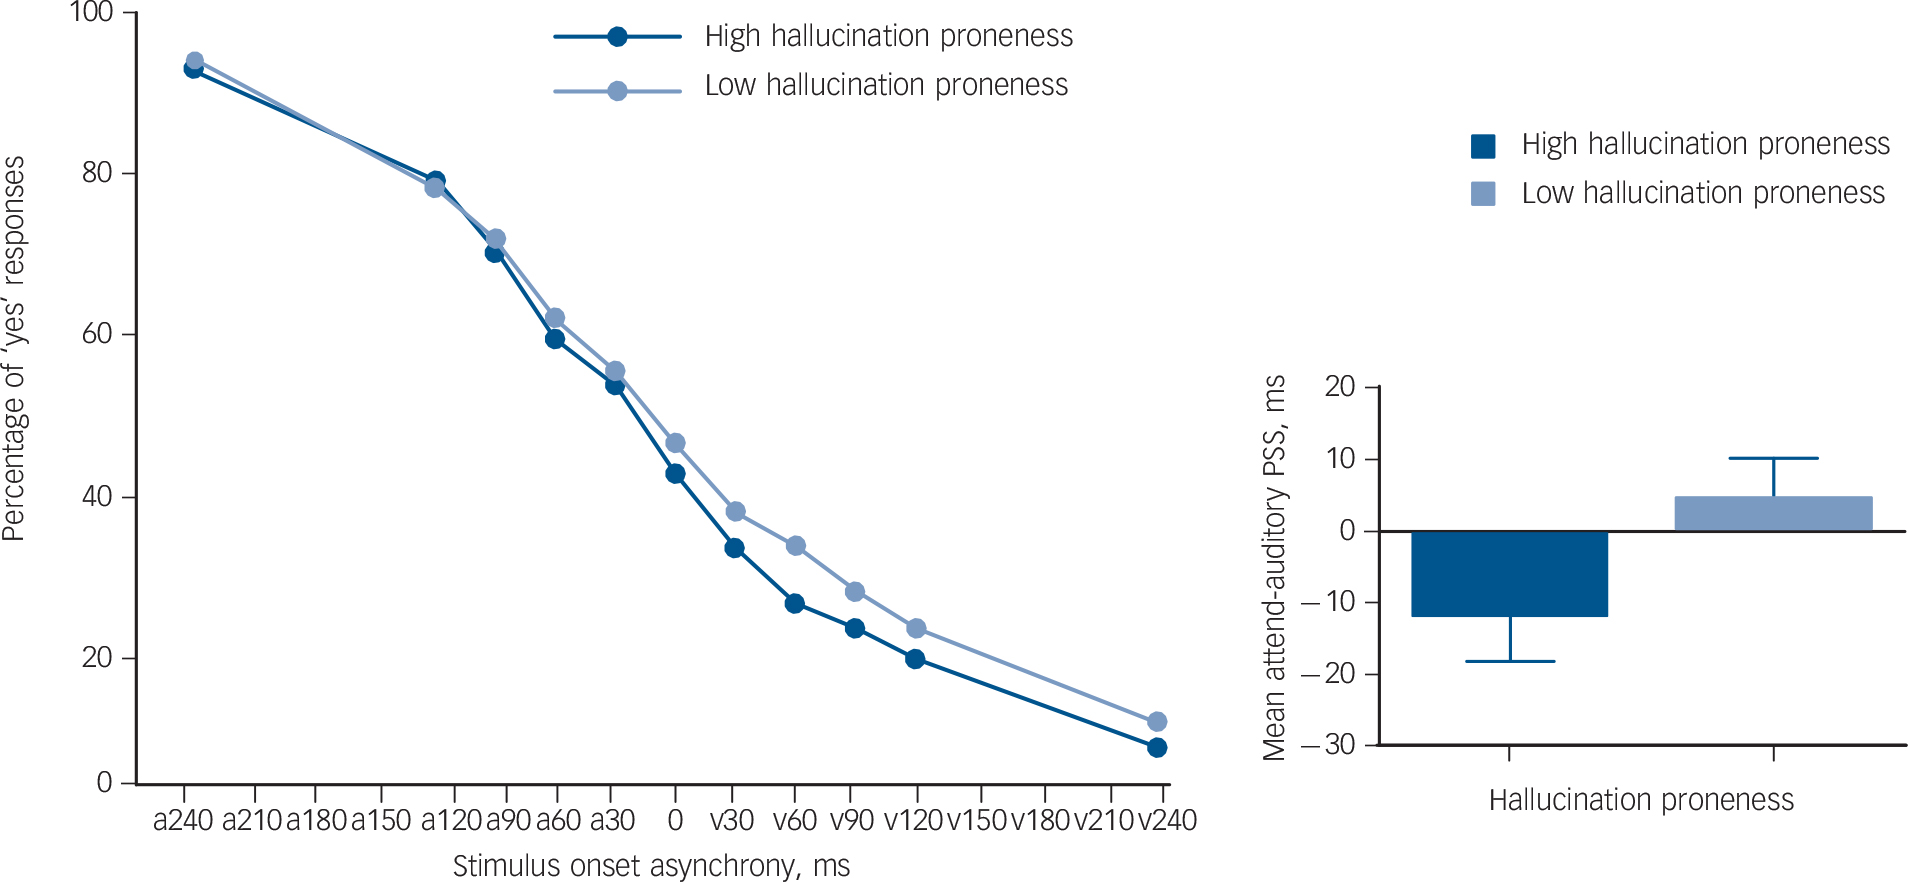
As shown in Fig. 2, the highly hallucination-prone group had lower mean attend-auditory PSS values compared with the lower hallucination-proneness group (U = 2320.0, P = 0.045), indicating reduced attention-driven auditory sensitivity in the high hallucination-proneness group. By contrast, attend-visual PSS did not differ significantly between the groups (U = 2848.0, P = 0.946). There were no significant differences in the slope of psychophysical functions between groups.
The proportion of ‘yes’ responses at each stimulus onset asynchrony (SOA) for both the attend-auditory in the high and low hallucination-proneness groups (left figure).
The dark blue circular markers represent the mean percentage of ‘yes’ responses at each SOA for the attend-auditory condition in the high hallucination-proneness group. The light blue circular markers represent the mean percentage of ‘yes’ responses for each SOA under the attend-auditory condition, in the low hallucination-proneness group. On the x-axis, ‘a’ demonstrates that the auditory stimulus was presented before the visual stimulus and ‘v’ indicates that the visual stimulus was presented before the auditory. The y-axis represents the percentage of ‘yes’ responses for each condition. The bar graph on the right shows the difference in mean attend-auditory point of subjective simultaneity (PSS) between the high and low hallucination-proneness groups. The high hallucination-proneness group had a mean attend-auditory PSS of 15.73 ms lower than that of the low hallucination-proneness group (U = 2320.0, P = 0.045). The error bars represent the standard error of the mean.
Attention-driven auditory sensitivity and schizotypal personality traits
A trend-level positive correlation was observed between attend-auditory PSS and total SPQ score (r = 0.136, P<0.1). Furthermore, attend-auditory PSS values were positively correlated with the SPQ subscales: ‘Eccentric Behaviour’ (Spearman's ρ = 0.190, P = 0.018), ‘No Close Friends’ (Spearman's ρ = 0.200, P = 0.013) and ‘Constricted Affect’ (Spearman's ρ = 0.159, P = 0.048). After controlling for Lie Scale scores, the relationship between attend-auditory PSS and the SPQ subscales remained similar: ‘Eccentric Behaviour’ (Spearman's ρ = 0.146, P = 0.073), ‘No Close Friends’ (Spearman's ρ = 0.188, P = 0.020) and ‘Constricted Affect’ (Spearman's ρ = 0.137, P = 0.092). There was no relationship between attend-visual PSS and any of the SPQ subscales. These correlation results were not corrected for multiple comparisons.
Discussion
The main aim of this study was to investigate the relationship between attention-driven auditory sensitivity and hallucination proneness. We manipulated participants' attention implicitly via the task instructions during an audiovisual TOJ task. We found that the highly hallucination-prone group exhibited a reduced sensitivity to auditory stimuli under the attend-auditory condition, whereas there was no significant between-group difference in sensitivity to visual stimuli under the attend-visual condition. Our study provides direct experimental evidence for reduced sensitivity to external auditory signals in hallucination-prone individuals, and this finding may assist in understanding the mechanism of auditory hallucinations in schizophrenia, if replicated in a patient population.
Hallucination proneness and attention-driven auditory sensitivity
We found that highly hallucination-prone individuals have a reduced sensitivity to attention-driven auditory stimuli. This result contradicts our initial predication: individuals who were prone to experiencing auditory hallucinations would display high attention-driven auditory sensitivity in comparison to those who were less prone to experiencing auditory hallucinations.
In light of this, we suggest the possibility that highly hallucination-prone individuals have an attentional bias towards internal brain-derived signals at the expense of the external environmental signals. Although this has not been empirically tested, it could account for our observation of reduced sensitivity to external auditory stimuli in hallucination-prone participants. Consequently, as we observed, hallucination-prone individuals may display a reduced sensitivity to external stimuli because of a relative inability to direct their attention away from internal signals. These internal signals may be spontaneous activations in the auditory cortex which have been shown to occur in the absence of external stimulation in healthy individuals. Reference Hunter, Eickhoff, Miller, Farrow, Wilkinson and Woodruff2 There was no difference in ‘attend-visual’ PSS between the two groups, indicating that our findings are specific to the auditory modality.
Our proposal concurs with previous studies involving patients with schizophrenia which have shown that internal and external auditory stimuli compete for processing at the level of the auditory cortex. Using functional magnetic resonance imaging, Woodruff et al Reference Woodruff, Wright, Bullmore, Brammer, Howard and Williams17 observed that patients with schizophrenia demonstrated reduced activation in the auditory cortex to external speech compared with healthy controls. Furthermore, external speech was shown to activate the speech-processing regions of the brain significantly less when patients were severely hallucinating than when their hallucinations were remitted. In a similar study by Ford et al, Reference Ford, Roach, Jorgensen, Turner, Brown and Notestine18 decreased activation to pure tones was observed in the left primary auditory cortex in hallucinating patients compared with both non-hallucinating patients and healthy controls. In both studies, the authors concluded that auditory hallucinations may compete with external speech for processing in the temporal cortex. There is evidence that some hallucinations are triggered by degraded processing of external sounds. Reference Hunter and Woodruff19 It is possible, therefore, that there might be complex interactions between internally and externally driven processes in their pathophysiology. Manipulation of acoustic features of voice stimuli in different attention conditions could be used to examine the interaction (between attention and auditory processing of specific speech elements) that might contribute to the experience of auditory hallucinations.
An alternative explanation for our results is that hallucination-prone individuals may have a tendency to focus on their thoughts instead of on the task stimuli and as such display poorer attention during the experiment overall. However, if this was the case, we would expect to see differences in the slope of the psychophysical functions between the high and low hallucination-proneness groups, representing differences in temporal sensitivity, which was not observed in this study. To our knowledge, this is the first behavioural study to examine attention-driven auditory sensitivity in healthy hallucination-prone individuals. Further research is therefore required to clarify and expand on our results.
Schizotypal personality traits and attention-driven auditory sensitivity
A trend-level relationship was observed between overall SPQ scores and attention-driven auditory sensitivity. When the SPQ subscales were assessed individually, the subscales ‘Eccentric Behaviour’, ‘No Close Friends’ and ‘Constricted Affect’ were associated with reduced attention-driven auditory sensitivity. No relationship was observed between auditory sensitivity and any of the other SPQ subscales, suggesting that these subscales were responsible for driving the trend observed in overall SPQ scores. This is an interesting finding, as these three traits may be associated with relatively more social isolation. Given that this sample comprised healthy volunteers, likely to have a reasonable social network, it would be important to test this hypothesis in patients who experienced social isolation as a result of their illness.
Hoffman et al Reference Hoffman, Varanko, Gilmore and Mishara20 questioned 46 patients regarding their first experience of hearing ‘voices’ and 73% reported that the voices had emerged during a period of relative social isolation such as moving to a new area or travelling to a different country. Furthermore, Nayani & David Reference Nayani and David21 reported that 80% of patients with borderline personality disorder reported that being alone worsened their auditory hallucinations. It is, therefore, possible that individuals who often isolate themselves from others may be more inclined to attend to spontaneous brain activity. These internal activations, which are likely to be ignored in healthy non-hallucinating brains, may be over-interpreted in highly schizotypal individuals.
Experimental issues
Across the whole sample, a statistically significant difference was observed between the attend-auditory and attend-visual PSS values. Given that the stimulus pairs used in the attend-auditory and attend-visual conditions were identical, if attention had not affected stimulus perception, the PSS for both conditions would have occurred at the same SOA. A significant difference between the attend-auditory and attend-visual PSS values thus confirms that our method of implicit attentional manipulation was successful in directing participants' attention on specific sensory modalities.
It is important to note that the attend-visual PSS was considerably higher than the attend-auditory PSS, initially suggesting that the attend-visual condition elicited a greater attentional effect. However, it should be noted that an auditory stimulus needs to be delayed by about 40–50 ms compared with a visual stimulus, if the two stimuli are perceived as simultaneous. This is because of the fact that acoustic transduction time between the outer and inner ears is considerably faster than photo transduction time in the retina. Reference Alais and Carlile22 Hence, the two psychophysical functions crossed around −30 ms (audition leading vision) in Fig. 1. We did not correct it because perceptions of simultaneity are also affected by relative stimulus intensity Reference Spence, Shore and Klein13 and because clear criteria for matching stimuli of different modalities do not exist. Reference Spence, Shore and Klein13 Consequently, PSS values should be considered relative to each other and not relative to zero.
In our study, 46 participants were excluded from the data analysis, corresponding to 23% of the sample. Although this rate of exclusion appears high, it is comparable to the rates seen in similar studies: Stone et al Reference Stone, Hunkin, Porrill, Wood, Keeler and Beanland14 excluded 26.09% of their sample because of poor task performance, and Zampini et al Reference Zampini, Shore and Spence23 excluded 22.22% of their participants for the same reason. Participants who were excluded from the analysis displayed higher levels of schizotypal personality traits than those who were included. One possibility is that the excluded group had particular difficulty with sustaining attention on the task, as has generally been observed in those with schizotypal personality traits. Reference Gooding, Matts and Rollman24 High levels of schizotypy are also associated with poorer temporal sensitivity; Reference Lee, Dixon, Spence and Woodruff15 which presents another reason why certain participants may have difficulties with the task.
Limitations of the present study
A potential limitation of this study is that it contained a large number of variables which led to multiple comparisons being performed in examining correlations with SPQ subscales. Because of the novel nature of this study, no statistical correction procedures to adjust for multiple comparisons were used as we wish for our results to inform future hypotheses.
A further limitation of the study was that the auditory and visual stimuli used in the TOJ task clearly differ from naturally occurring stimuli, such as speech, which affects the generalisability of these results. Emotional prosody is known to attract attention, and recent work has shown that patients with schizophrenia who experience auditory hallucinations have a greater attentional bias towards emotional sounds compared with non-hallucinating patients and healthy controls. Reference Alba-Ferrara, de Erausquin, Hirnstein, Weis and Hausmann25 Development of a similar task using speech could be a more ecologically valid approach to assess the influence of attention on perception.
Future work and clinical implications
In conclusion, we observed that highly hallucination-prone individuals and those with social withdrawal or negative features of schizotypal personality traits displayed lower levels of attention-driven auditory sensitivity compared with the rest of the sample. We proposed that this was because of an attentional bias towards internal (brain-derived) acoustic signals at the expense of external environmental signals. It is clear, however, that additional research is required to confirm and expand on our findings. Future research related to our proposal should focus on two key areas: confirming that hallucination-prone individuals have a reduced sensitivity to external stimuli under conditions of focused attention and the development of methods to investigate whether hallucination-prone individuals display enhanced internally directed attention.
If supporting evidence is found, our findings could be of relevance in the treatment of auditory hallucinations in schizophrenia. In particular, psychological therapies involving the redistribution of attentional resources may be of therapeutic benefit to some patients as an adjuvant treatment to pharmacotherapy. An appropriate treatment may be attention therapy, a technique which was originally developed as a treatment for panic disorder and anxiety and aims to direct patients' attention away from internal signals. Reference Hatashita-Wong and Siverstein26 There is limited evidence available concerning its efficacy in treating hallucinations in schizophrenia, although a case study of the treatment in a patient with chronic refractory auditory hallucinations provided encouraging results. Reference Valmaggia, Bouman and Schuurman27
Funding
L.R. was supported by a bursary from the University of Sheffield Neurology Alumni Foundation


eLetters
No eLetters have been published for this article.