


1 Introduction
Visuals are prominent and important elements of the political world. We are constantly exposed to images of candidates running in elections, politicians attempting to connect with their constituents, media outlets informing us about the latest political events, and more. Images are a powerful tool for communicating messages: from illustrating the vision of the sender of a given message (Gamson Reference Gamson1989; Parry Reference Parry2011) to the potential of triggering emotional reactions beyond language (Barry Reference Barry1997). Although until recently most studies concerned with political information focused solely on verbal communication (Chong and Druckman Reference Chong and Druckman2007; Druckman and Nelson Reference Druckman and Nelson2003; Gamson and Modigliani Reference Gamson and Modigliani1989; Grimmer and Stewart Reference Grimmer and Stewart2013; Lecheler and de Vreese Reference Lecheler and de Vreese2013), scholars are increasingly studying the structure and effects of audiovisual material in political contexts (Bauer and Carpinella Reference Bauer and Carpinella2018; Boussalis et al. Reference Boussalis, Coan, Holman and Müller2021; Dietrich, Enos, and Sen Reference Dietrich, Enos and Sen2019; Jürgens, Meltzer, and Scharkow Reference Jürgens, Meltzer and Scharkow2022; Knox and Lucas Reference Knox and Lucas2021; Lu and Pan Reference Lu and Pan2022; Neumann, Fowler, and Ridout Reference Neumann, Fowler and Ridout2022; Zhang and Pan Reference Zhang and Pan2019).
Several of these studies have relied on supervised computational methods that focus on binary classification (e.g., is this a negative or positive campaign ad?) or the identification of a few themes or objects (e.g., are there children in this protest?). However, just as with texts, there are instances where researchers want to pursue exploratory analyses without labeled data, are interested in measuring distributions of unknown themes in an image, or need a way of identifying and interpreting the visual features driving a particular outcome.
When it comes to text, there are well-developed methods for unsupervised dimension reduction that achieve the objectives above, but the unsupervised analysis of images poses unique challenges because images are not composed of identifiable tokens such as words. In this manuscript, I present a technique which allows for (1) the definition and extraction of visual features that emulate words in text and (2) that subsequently serve as input for the application of common text-analytic tools, like topic models, to images.
The Bag of Visual Words (BoVW) is a technique commonly used in computer science for image retrieval which helps to summarize the content of a picture with interpretable tokens that mimic but do not replicate words in texts. The framework defines and creates these tokens as collections of mini-image patches and coins them “visual words.” Thus, this technique builds on the common approach of representing texts as a “bag of words,” and represents images as a “bag of visual words” despite the absence of actual words in most images.
Although this form of representation of visual material is more coarse and simpler than the one achieved by some deep learning methods, it offers a series of advantages over the latter for certain tasks involving semi-supervised classification and feature interpretation. First, the feature extraction process of the BoVW does not require any labeled data or pre-trained models at any stage of the process; second, the BoVW construction involves a series of transparent and easily traceable steps that improve the interpretability, validation, and visualization of classification results; and third, it offers researchers the possibility of using methods that not only provide useful outcomes of interest, such as topic proportions, but also permit the inclusion of substantive knowledge to improve the discovery of patterns.
To illustrate these advantages and the functioning of the BoVW, I present a novel use of this technique in a semi-supervised setting, a structural topic model (STM), to improve the identification of topical dimensions in a corpus of images. I conduct a visual STM of images from the caravan of migrants from Central America to explore and test the effect of media ideology on the prevalence of a “crowd” topic as a frame of the threat that a large group of immigrants might pose. This example highlights some of the substantive applications of the framework: identifying visual frames that a communicator uses to talk about an issue, and learning about relevant political components of images, like the scale of the political scenes they depict.
This manuscript introduces the BoVW to political science as a technique that allows for the representation of images as interpretable tokens. This article is, to the best of my knowledge, the first to provide a framework to process images into the appropriate input that several popular techniques, like topic models or latent trait discovery, require. It also provides code to adapt the regular STM functions to images as well as a comprehensive set of diagnoses and analyses of the output from this method.
2 Quantifying Images: The Bag of (Visual) Words
How can we decompose images into identifiable “tokens?” In contrast to texts containing words, sentences, or n-grams, images have pixels that cannot act as meaningful elements. However, the combinations of pixels forming edges, shapes, colors, and so forth help us to make sense of visual content (Karpathy and Fei - Fei Reference Karpathy and Fei-Fei2015). Several tools from the computer vision and deep learning fields rely on these feature definitions to summarize images.
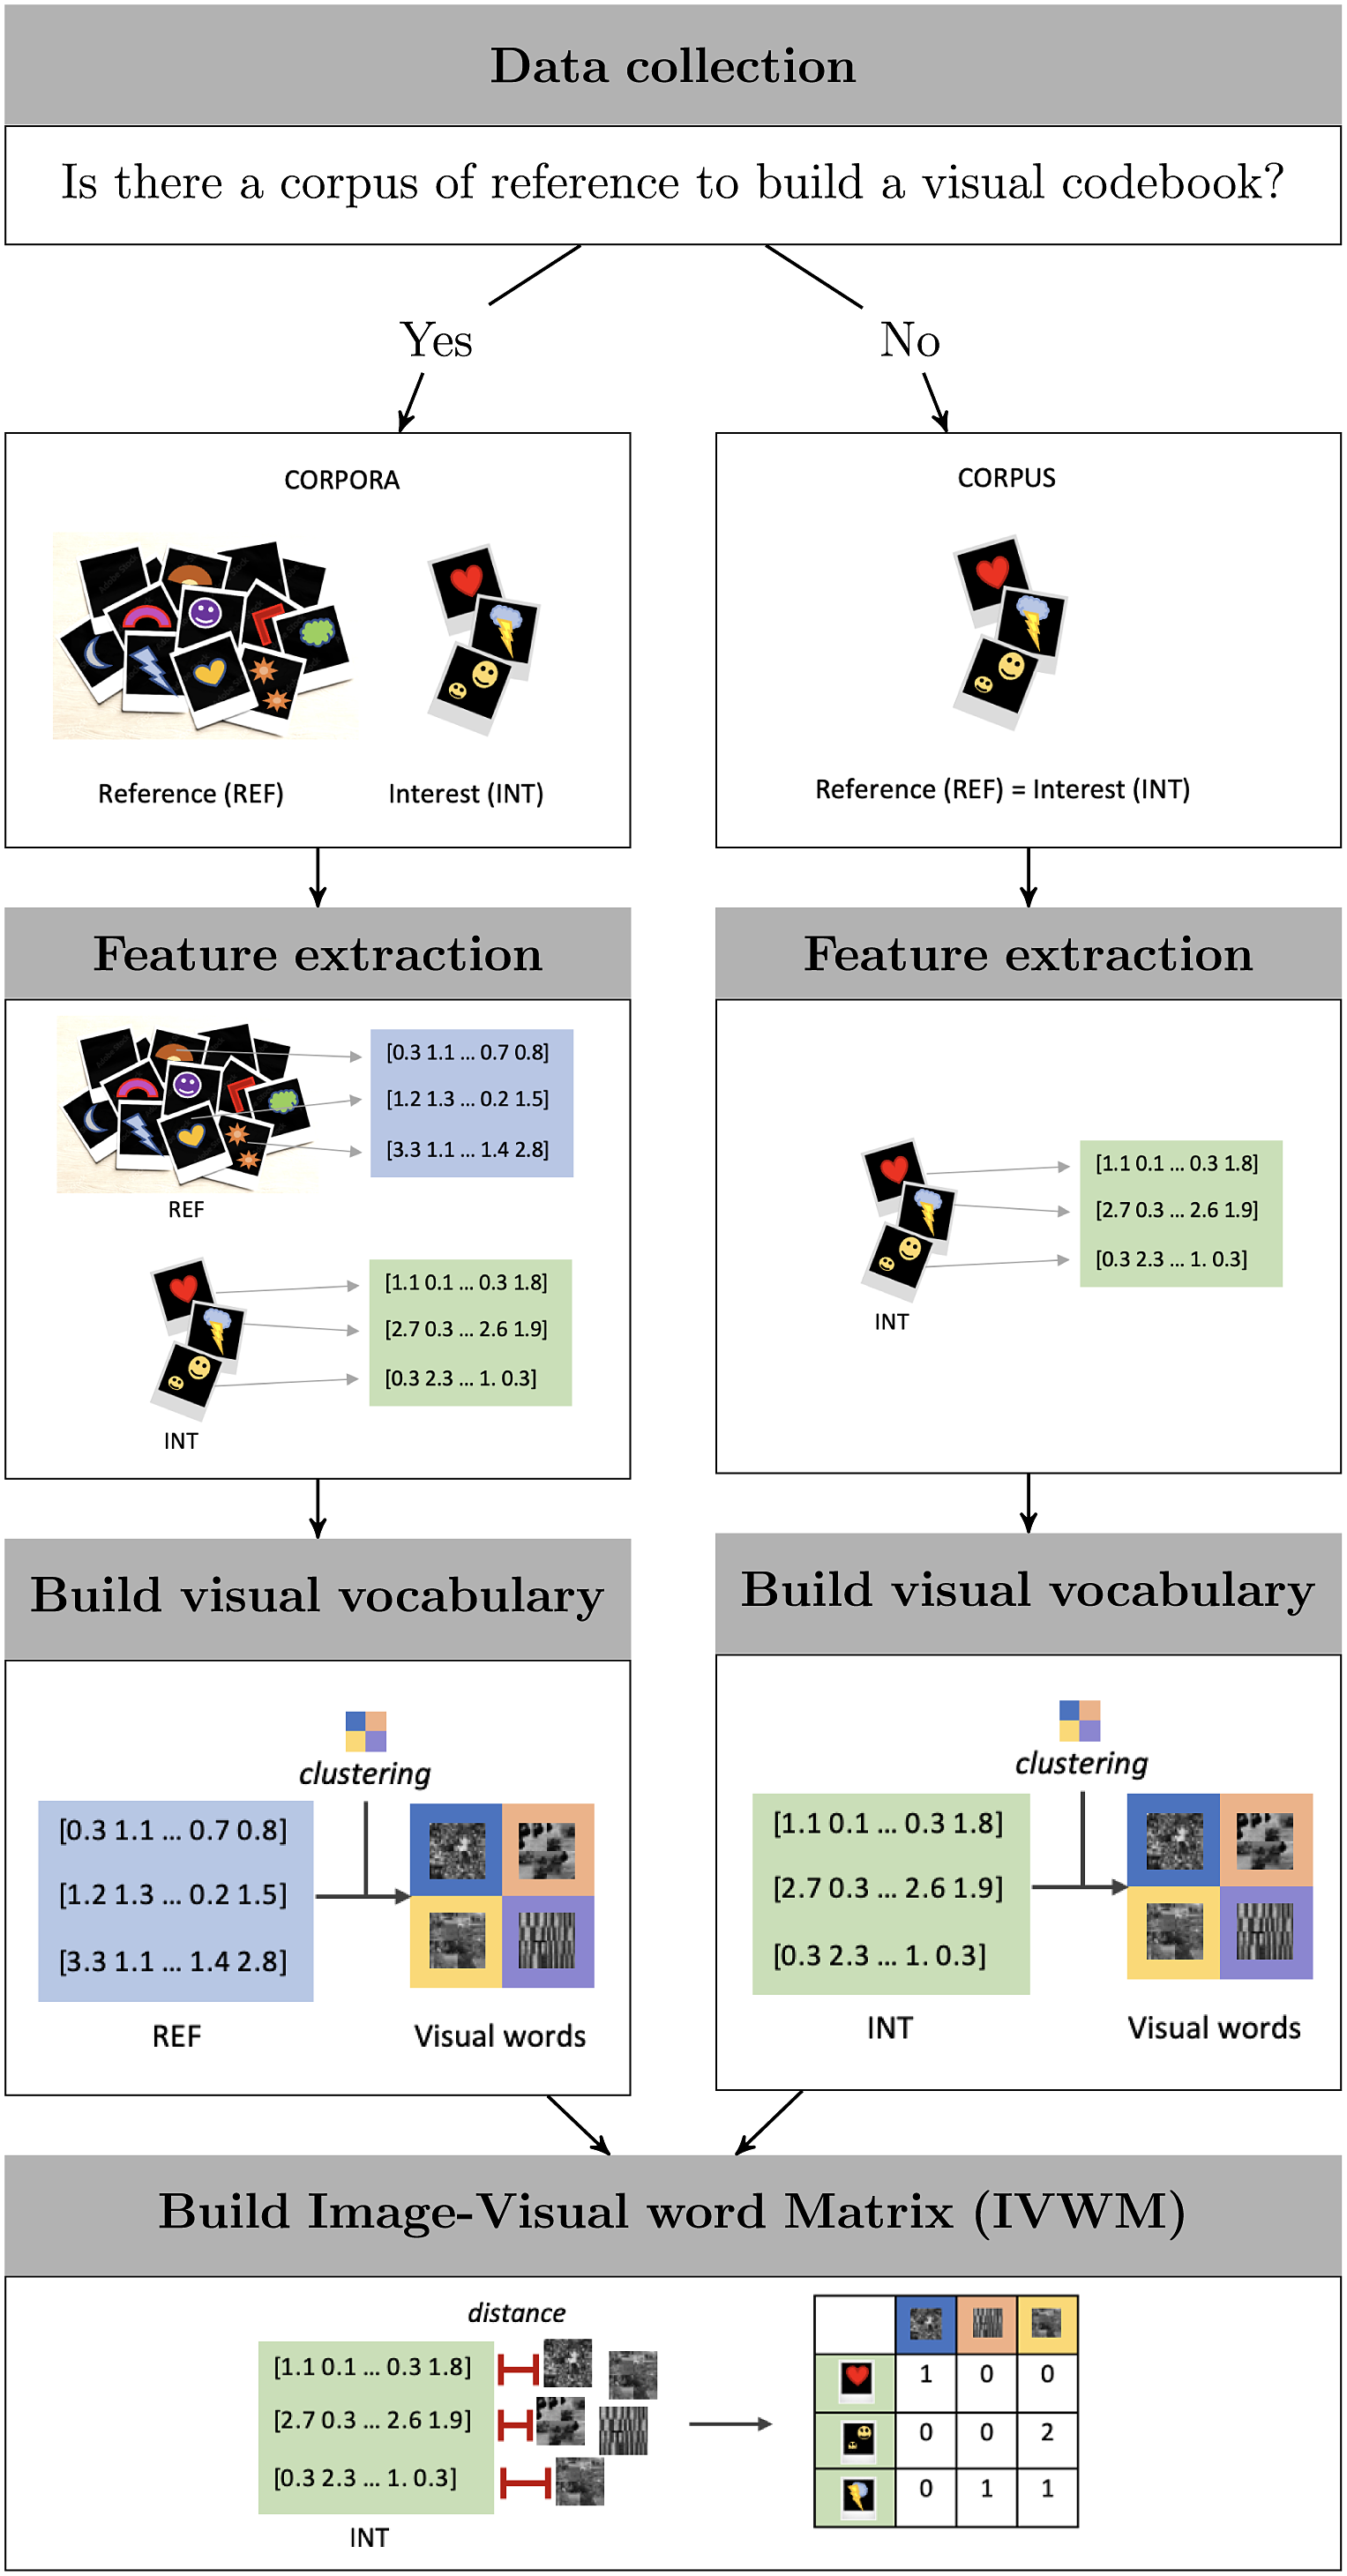
However, if we represent image features as “visual words,” then we can use an analog variant of the Bag of Words, a popular technique used for text classification, called the BoVW (Grauman and Darrell Reference Grauman and Darrell2005, Reference Grauman and Darrell2007; Grauman and Leibe Reference Grauman and Leibe2011). This tool involves a series of dimension reduction steps designed to represent visual content (Csurka et al. Reference Csurka, Dance, Fan, Willamowski and Bray2004; Grauman and Darrell Reference Grauman and Darrell2005; Sivic et al. Reference Sivic, Russell, Efros, Zisserman and Freeman2005; Sivic and Zisserman Reference Sivic and Zisserman2003). These steps are: identification and description of key points (feature extraction), assembly of a visual codebook, and construction of the Image-Visual Word Matrix (IVWM). Figure 1 provides a summary of this workflow which I detail in the following section.
Workflow for building an Image-Visual Word Matrix.
2.1 Step 1: Extracting and Describing Local Key Points
The first step consists of detecting local key points in the corpus of images under analysis and extracting their features. A “key point” is a salient region in the image generally representing edges, corners, or significant changes in pixel intensity. Identifying key points is the first step to simplify the data by discarding regions that will not offer useful information for classification purposes. Once the key regions representing the content of the image are identified, we proceed to “describe” them through the extraction of their features. For the identification part, we use a “locator,” and for the feature extraction, we use a “descriptor.”
There are multiple classes of locators and descriptors that can be categorized along several dimensions such as speed or accuracy.Footnote 1 In this article, I use the FAST Hessian detector and the RootSIFT descriptor that are detailed below. It is important to note that these algorithms work with images that are rescaled and transformed to gray scale.Footnote 2
2.1.1 Detecting Key Points
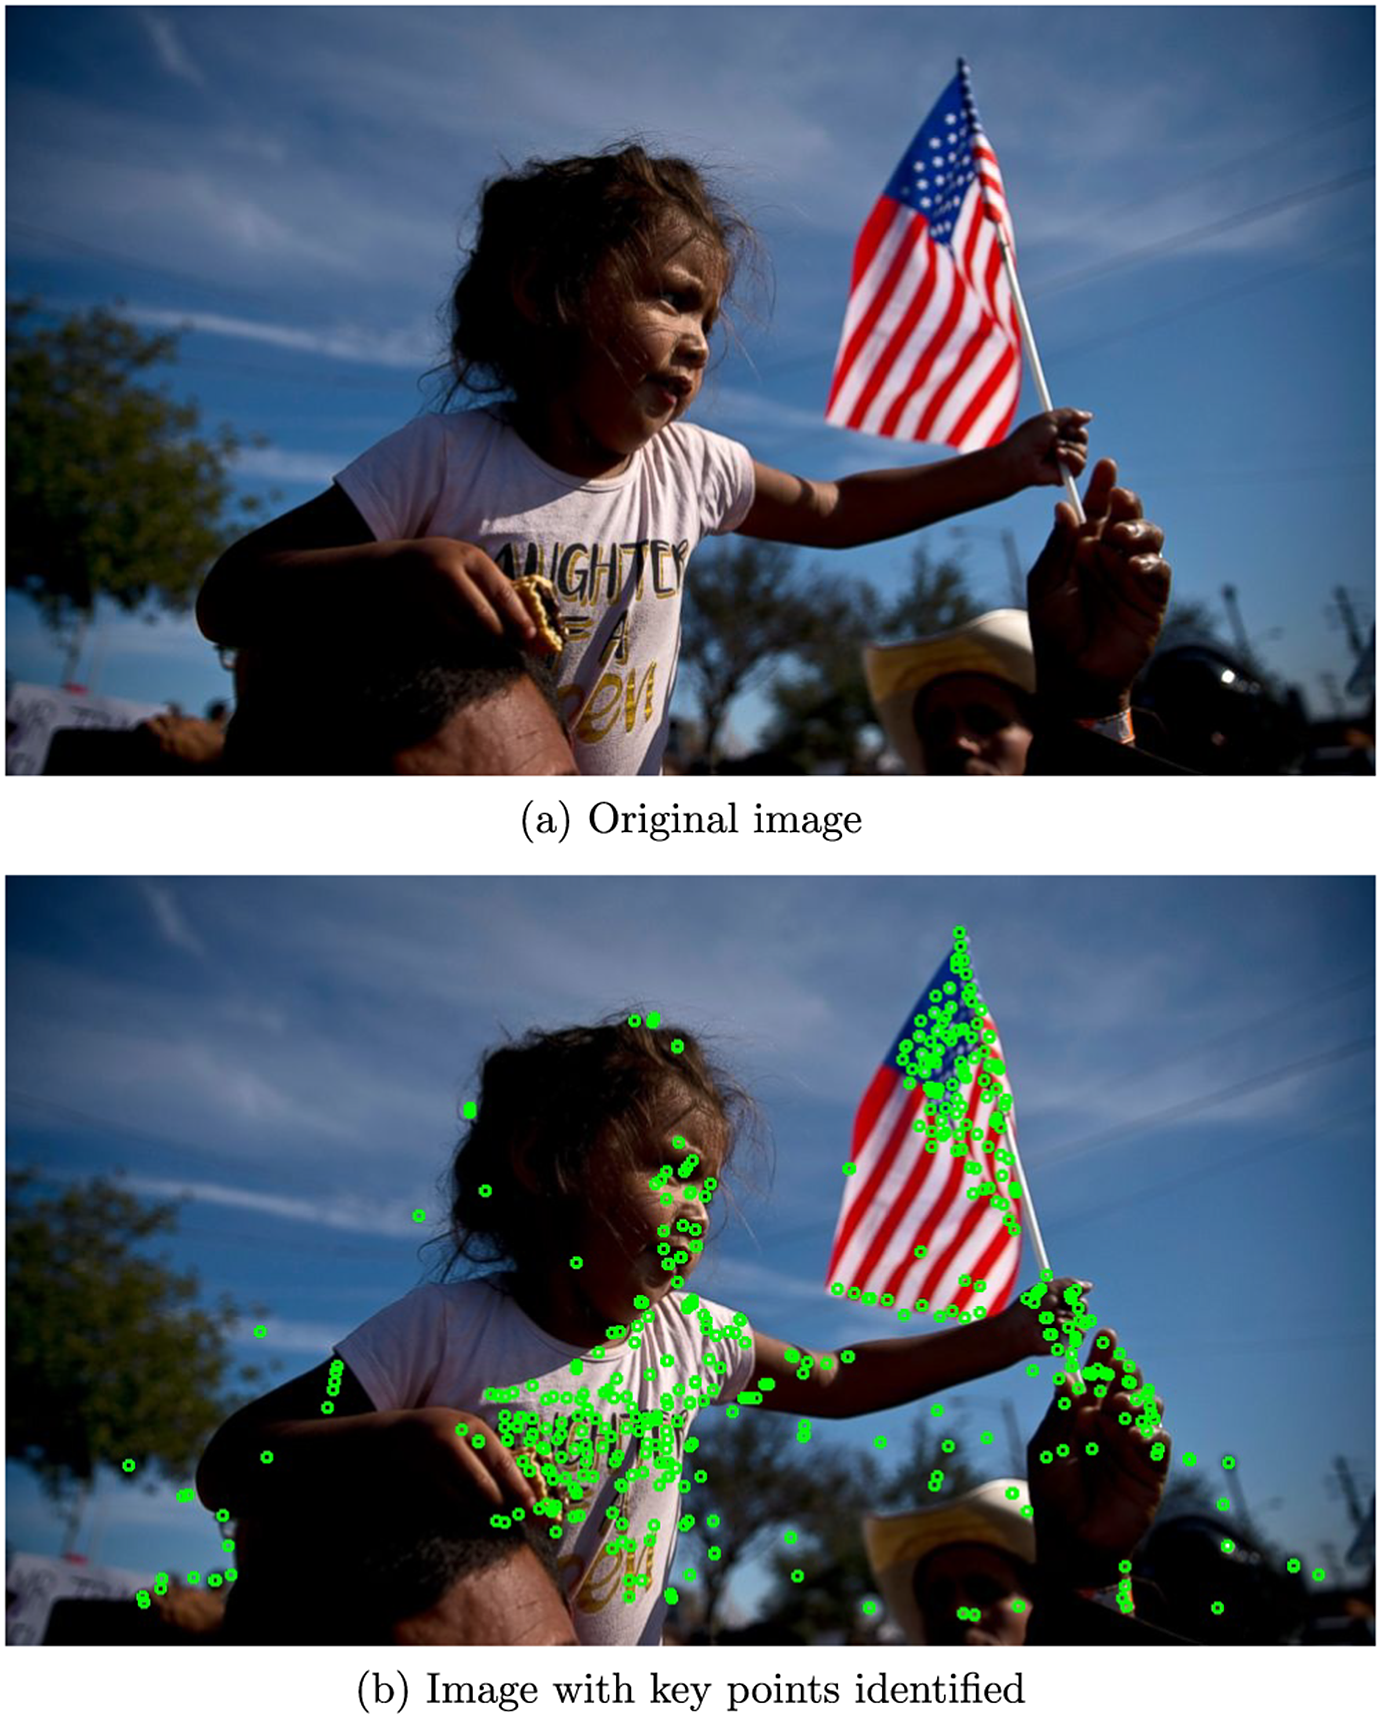
The FAST Hessian detector is used to locate edges and corners in an image (Bay, Tuytelaars, and Van Gool Reference Bay, Tuytelaars and Van Gool2006). This detector identifies the points and regions where significant changes in pixel intensity occur. These elements define the objects found in a picture, and in turn are crucial for the description of its content. A more detailed description of the procedure in which the FAST Hessian identifies key points can be found in Section A2 of the Supplementary Material. Figure 2 illustrates the key points identified in the photo with open circles. The points appear in salient regions of the image, and match lines, contours, and edges of the most prominent elements of the picture.
Location of key points.
AP Photo/Ramon Espinosa.
2.1.2 Describing the Key Points
Next, we need to extract features from these points. In texts, features are words, sentences, or n-grams describing each document. However, the identification of comparable features in images poses some challenges. Although intuitively it is easy to think of a “visual word” as a “piece” of an image (e.g., the “tire” in a car picture), in practice the actual quantification of this “patch” is problematic given the multidimensionality of a picture and the absence of semantic meaning of clusters of pixels.
However, feature descriptors help to represent the image characteristics in mathematical forms. As in the case of detectors, there are multiple alternatives that vary in computational costs, efficiency, and accuracy. Researchers interested in image classification should select from these tools based on substantive knowledge of the problem under analysis, the size and characteristics of their data, and resource constraints.Footnote 3
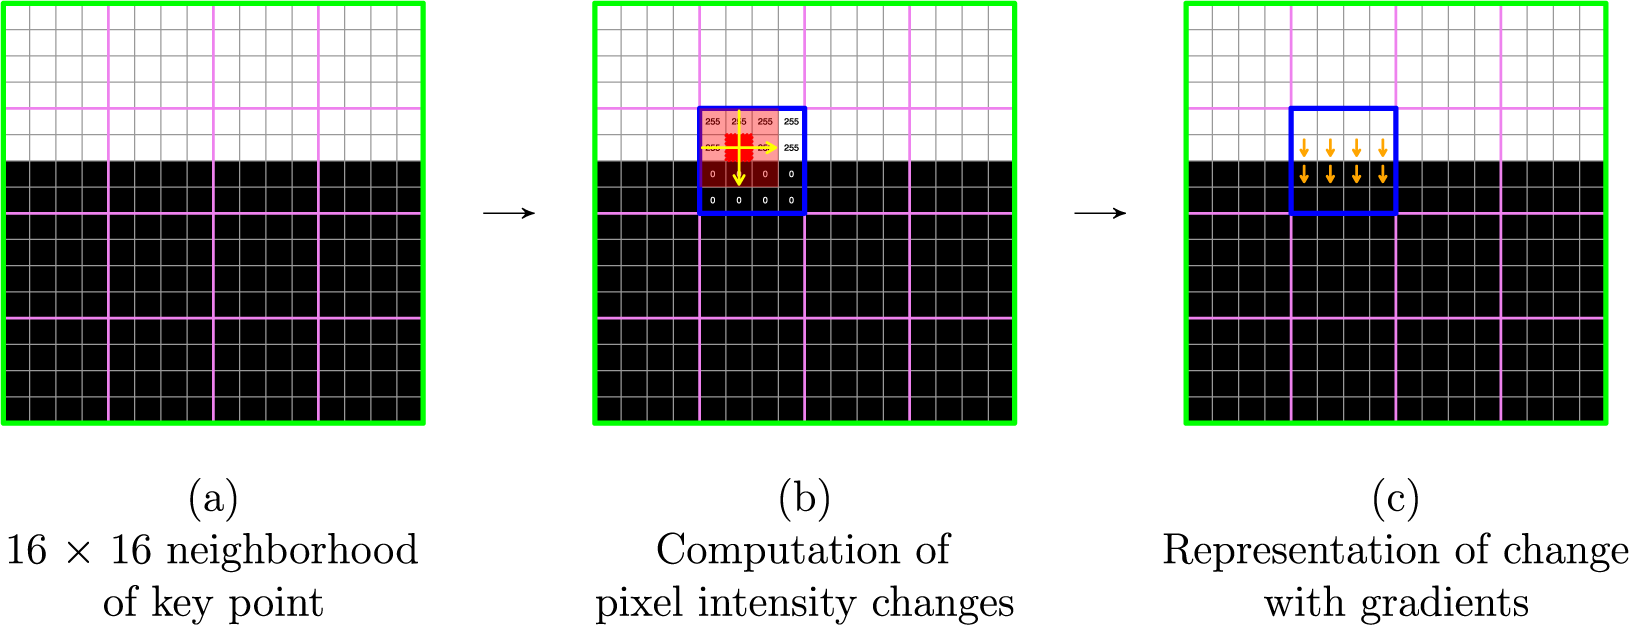
In this project, I implement a RootSIFT descriptor which quantifies the region surrounding the key points (Arandjelović and Zisserman Reference Arandjelović and Zisserman2012). This descriptor considers that the defining features of a key point are the direction and size of the changes in pixel intensity in different areas of its neighborhood. Gradients can measure these changes: vectors that capture both the direction and magnitude in which pixel intensities change from one point to another.
First, for each of the key points identified in Section 2.1.1, the descriptor takes its $16\times 16$
pixel surrounding area, and then divides it into a grid with
$16\times 16$
pixel surrounding area, and then divides it into a grid with $4\times 4$
pixel cells (Figure 3a). Then, the descriptor compares the intensity of a given pixel to its surrounding neighbors (Figure 3b), followed by a summary of this information with gradients (Figure 3c). Formally, we estimate the gradients in both the x-direction (
$4\times 4$
pixel cells (Figure 3a). Then, the descriptor compares the intensity of a given pixel to its surrounding neighbors (Figure 3b), followed by a summary of this information with gradients (Figure 3c). Formally, we estimate the gradients in both the x-direction ( $G_x$
) and the y-direction (
$G_x$
) and the y-direction ( $G_y$
) at pixel
$G_y$
) at pixel $A(x,y)$
with the formulas:
$A(x,y)$
with the formulas:
 $$ \begin{align*} G_x = A(x,y) - A(x+1,y) && G_y = A(x,y) - A(x,y+1), \end{align*} $$
where $A(x,y)$
represents the pixel located in coordinate
$A(x,y)$
represents the pixel located in coordinate $(x,y)$
of a blurred version A of image I. The blurring is performed using a Gaussian-smoothing filter that “cleans” the image by decreasing the sharpness of irrelevant elements (like irregular blobs). Then, we calculate the magnitude and the orientation of the gradients presented in the equations above as follows:
$(x,y)$
of a blurred version A of image I. The blurring is performed using a Gaussian-smoothing filter that “cleans” the image by decreasing the sharpness of irrelevant elements (like irregular blobs). Then, we calculate the magnitude and the orientation of the gradients presented in the equations above as follows:
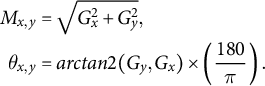 $$ \begin{align*} M_{x,y} &= \sqrt{G_x^2 + G_y^2},\\ \theta_{x,y} &= arctan2(G_y,G_x) \times \left( \frac{180}{\pi} \right). \end{align*} $$
Computing pixel intensity changes in the neighborhood of a key point.
Representation of the neighborhood of the key point with histograms.
Note: The x-axis in each of the histogram plots of (b) represents the angles of the gradients in each cell of (a). The angles are generally in the range of [0, 180]. This range is binned into eight groups: a bar in each of the histograms.
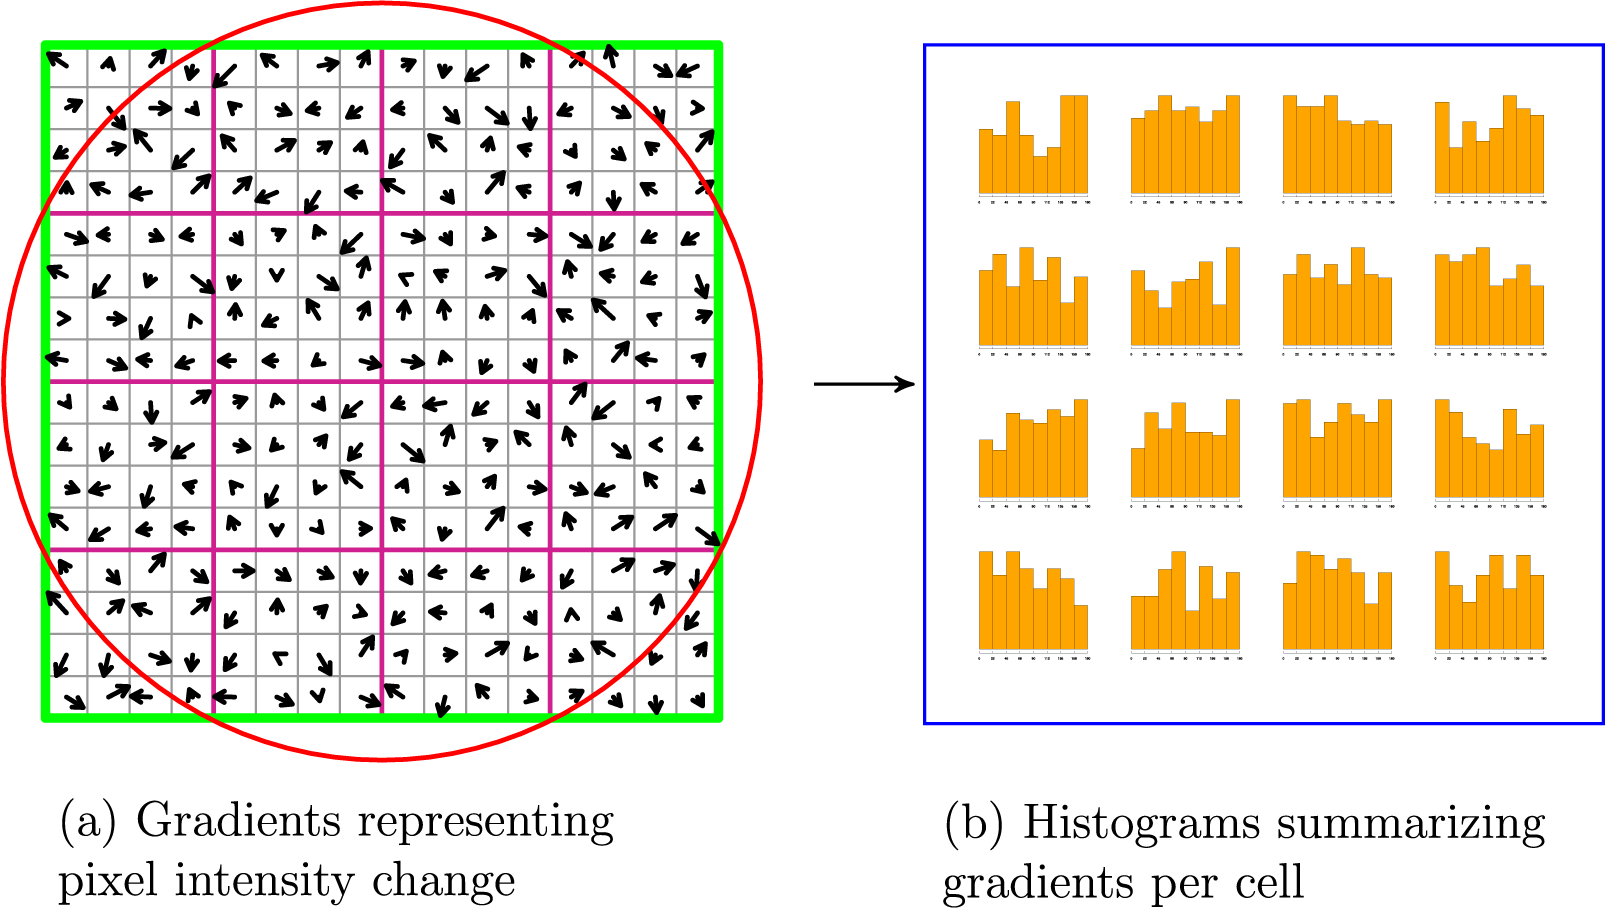
If we focus on a single cell out of the 16 that we defined in the first step, this process yields 16 gradients with their respective magnitude and orientation that we summarize using a weighted count. To do this, we first collapse all the potential gradient angles into eight bins for the histograms. These angles are in the range of [0, 180] when unsigned,Footnote 4 so we end up with bins that each include around 20 potential angles. Then, we count the number of orientation values that fall into each of the bins, and weight them by their respective magnitude and the distance to the key point. In other words, stronger pixel changes that are closer to the key point will be more relevant in the histogram construction.
After this process, each of the $4\times 4$
cells is represented with an eight-element vector (Figure 4). The last step involves concatenating the 16 histograms, and taking the root of each of the elements of this new “flattened” long vector. At the end, the surrounding area of a key point is represented by a
$4\times 4$
cells is represented with an eight-element vector (Figure 4). The last step involves concatenating the 16 histograms, and taking the root of each of the elements of this new “flattened” long vector. At the end, the surrounding area of a key point is represented by a $4\times 4 \times 8 = 128$
feature vector corresponding to the 8 gradient bins
$4\times 4 \times 8 = 128$
feature vector corresponding to the 8 gradient bins $\times $
the 16 cells of the neighborhood. Thus, a single image in our sample can now be represented with a number of vectors of length 128 equal to the number of key points that were detected in the first stage.
$\times $
the 16 cells of the neighborhood. Thus, a single image in our sample can now be represented with a number of vectors of length 128 equal to the number of key points that were detected in the first stage.
2.2 Step 2: Defining a Vocabulary
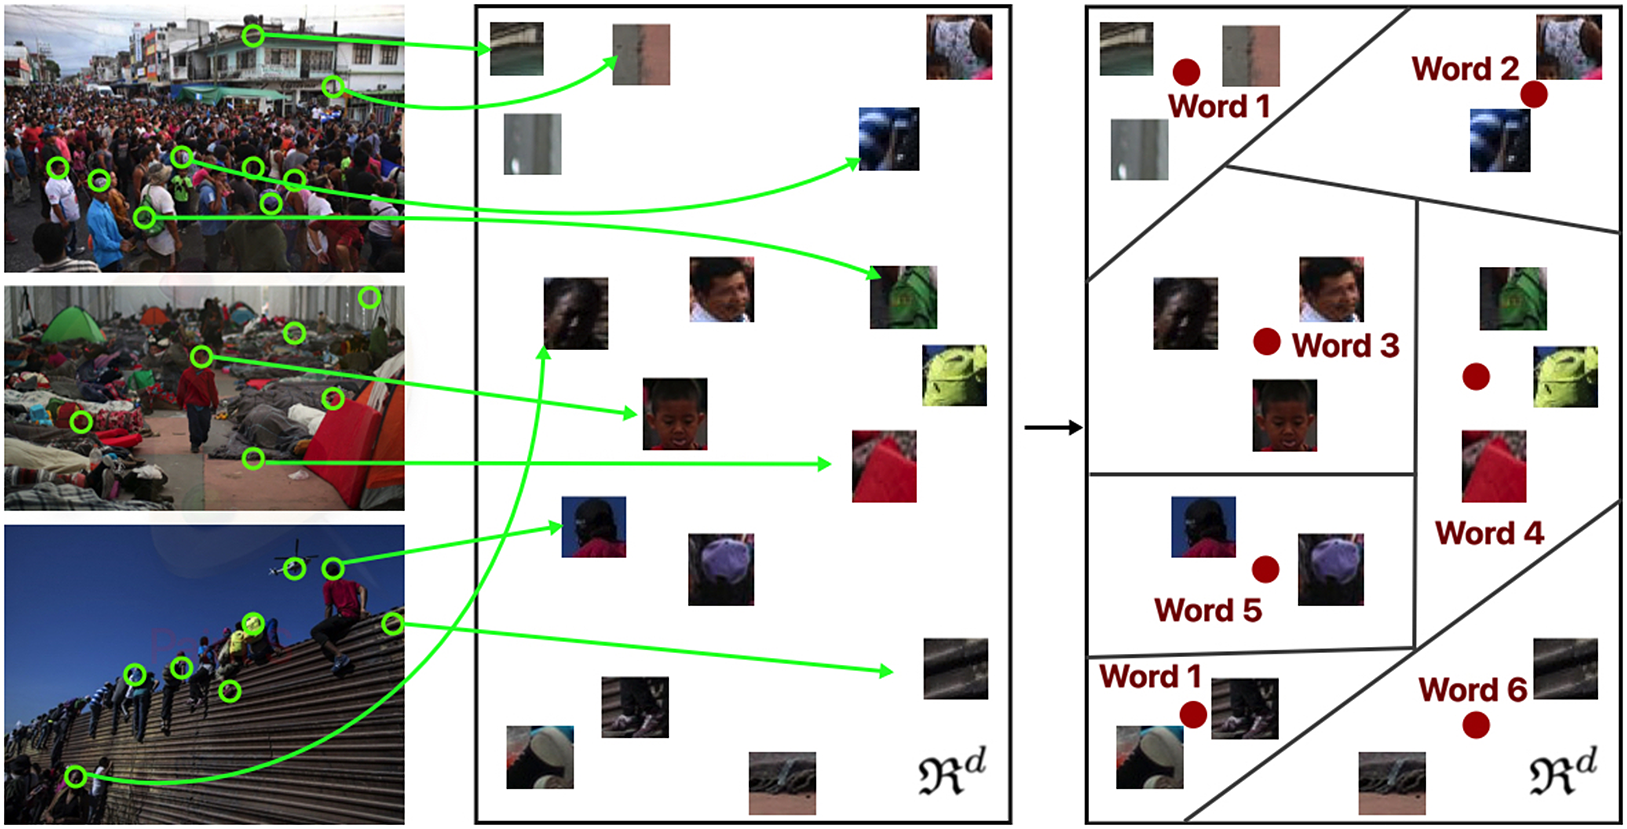
The features found in images do not have a semantic meaning like words. Therefore, we must define our own codebook or “visual vocabulary.” To do this, we will cluster a randomly selected sample of features extracted from the key points of the images in our pool.Footnote 5 Once we identify v clusters, the features associated with each cluster’s centroid serve as the representation of a word. This process is illustrated in Figure 5. Mathematically, a visual word is a vector with 128 elements, and graphically it is a collection of 16 of the mini patches contained inside the cluster. Figure 6 shows examples of visual words.
Creating the visual vocabulary: clustering and centroids.
Examples of visual words.
For the clustering process, I use a mini-batch k-means algorithm. This method requires that the user specifies the number of desired clusters: the size of the vocabulary V. The diagnosis section in the Supplementary Material provides more guidance for the selection of this V and the impact it has on the output from the STMs.
Depending on the objectives and data constraints of researchers, the visual codebook can be built from different sources of images: (i) a corpus of reference or (ii) a corpus of interest. For example, to understand whether media outlets are biased with respect to the pictures they choose to describe an event, it is important to know as much as possible about what really happened during the event. Thus, the codebook can be built using a corpus of reference from a neutral source illustrating all potential frames of an event. If in contrast the goal is to explore the themes in the images of Tweets from politicians, then the visual codebook can be exclusively based on that target corpus. Figure 1 shows the differences between these two choices.
The visual words in the codebook allow researchers to interpret the tokens composing the images via a qualitative assessment of their content, as well as the curation of the visual vocabulary that the proposed routine generates by, for example, eliminating irrelevant visual words or excluding duplicates. It is not necessary to initially label all the words in the vocabulary. The computer executes all the steps and outputs (1) the IVWM with each column named “vis_#” (from 0 to $V-1$
) and (2) the V clusters of mini patches with corresponding “vis_#” names. Thus, the “labeling” and interpretation of tokens become relevant after the desired analysis that takes the IVWM as input is performed such as when we need the most representative visual words defining a given topic.
$V-1$
) and (2) the V clusters of mini patches with corresponding “vis_#” names. Thus, the “labeling” and interpretation of tokens become relevant after the desired analysis that takes the IVWM as input is performed such as when we need the most representative visual words defining a given topic.
Once the visual codebook is defined, it can serve as a reference for other corpora of images and related analysis. For example, if we build a corpus of reference from a vast pool of images covering events related to immigration, it can be used as a benchmark for other samples of images from newspapers, political candidates’ campaigns, or party propaganda.
2.3 Step 3: Building the Image-Visual Word Matrix
Once we define a vocabulary, the last step consists of counting the number of times that each of the V “visual words” in the vocabulary appears in an image. While this emulates building a Document-Term matrix (DTM), the structure of the features and visual words demands additional steps. Let $I_n$
be one of the N images in the sample, and suppose that we identify 15 key points in it. This image is then represented by
$I_n$
be one of the N images in the sample, and suppose that we identify 15 key points in it. This image is then represented by $M=15$
feature vectors,
$M=15$
feature vectors,
![]() . Intuitively, we want to assign each feature vector to the most similar visual word in the vocabulary. Formally, for each feature vector
. Intuitively, we want to assign each feature vector to the most similar visual word in the vocabulary. Formally, for each feature vector
![]() , we compute the Euclidean distance between it and the centroids of the clusters in the vocabulary, and assign it to the one with the shortest distance.Footnote 6 In this way, each patch of an image is associated with a visual word in the vocabulary and we can identify the number of times a word appears in every photo. This constitutes our IVWM, the input for a classification task.Footnote 7
, we compute the Euclidean distance between it and the centroids of the clusters in the vocabulary, and assign it to the one with the shortest distance.Footnote 6 In this way, each patch of an image is associated with a visual word in the vocabulary and we can identify the number of times a word appears in every photo. This constitutes our IVWM, the input for a classification task.Footnote 7
3 Scope and Strengths of the BoVW
There are several methods designed to identify features for image classification. Among these are the BoVW and other deep learning methods, like convolutional neural networks (CNNs; Krizhevsky, Sutskever, and Hinton Reference Krizhevsky, Sutskever and Hinton2012; LeCun et al. Reference LeCun, Bottou, Bengio and Haffner1998; LeCun and Bengio Reference LeCun and Bengio1995). As reviewed above, the former uses changes in pixel intensities to represent features of the images. The latter interprets features as combinations of lines, textures, colors, and more. Given this intricate exploration of features and their predictive power, CNNs stand out as the most popular technique for classification.Footnote 8
However, although the BoVW involves a more narrow feature extraction process, this simplicity gives the method a series of advantages that allow it to address social scientists’ needs. First, unlike CNNs, the extraction process of the BoVW is transparent and traceable; this allows for better interpretation, validation, and visualization of results and features that generate them. Second, the way in which the BoVW extracts tokens does not depend on labeled data or pre-trained models at any point of the process which makes it suitable for fully unsupervised and exploratory analyses.Footnote 9 Third, the IVWM representing visual material allows social scientists to apply commonly used tools in text analysis to the context of images and that are generally used for other research goals that go beyond mere categorical classification.
Before detailing two of these advantages, it is important to highlight that they make the BoVW suitable for some but not all image analysis tasks. These characteristics do not imply that the BoVW is a superior method to a CNN but instead an alternative tool which addresses particular research needs.
3.1 Transparency and Traceability
Both the BoVW and CNNs represent images through features. However, the conceptualization and extraction of these features differ sharply between the two. CNNs learn combinations of features and weights (i.e., coefficients, in political science jargon) that maximize the accuracy of predicted labels in a training set of images. The features can be basic lines and corners, combinations of shapes, colors, and so forth. These are not fixed by the researcher and cannot be “observed” throughout the learning process. Further, they will depend on the particular set of images and labels used for training.
The intricacy of this process makes it hard to trace the steps behind its output. It is difficult to identify and visualize individual features and their corresponding role in predicting an outcome (i.e., think about coefficients in a regression setup). Despite recent advances in inspection tools (e.g., saliency maps and layer wise relevance propagation methods; Simonyan, Vedaldi, and Zisserman Reference Simonyan, Vedaldi and Zisserman2014; Zeiler and Fergus Reference Zeiler and Fergus2014; Zeiler, Taylor, and Fergus Reference Zeiler, Taylor and Fergus2011), the identification and understanding of the “optimal model” that the CNN learns is still a challenge (Grün et al. Reference Grün, Rupprecht, Navab and Tombari2016) and does not allow for the interpretation of the feature maps. This also extends to cases where researchers “extract” the last fully connected layer of a CNN (e.g., a flattened vector of abstract feature maps synthesizing the image) to then use it as input for unsupervised methods. When validating and interpreting the output from these approaches, researchers cannot reference tokens of the images that contribute to outcomes of interest.
In contrast, the BoVW defines a feature as change in pixel intensities and represents it with the magnitude and orientation of those changes. The computation of these features is based on fixed mathematical formulas that are not contingent on labels or the rest of the images in a corpus. Beyond the reliability, consistency, and transparency of the feature extraction process, this characteristic also allows researchers to create the visual words necessary for testing and tracking the role of features on classification, and visualizing them for further exploration and interpretation of the output of a given model.
3.2 Unique Suitability for Social Science Questions
For some studies, the identification of a few elements in a picture or a global classification of it provide enough information for its analysis. For example, Cantú (Reference Cantú2019) trained a model to classify pictures of electoral tallies according to whether they were altered or not. Other studies require the identification of a broader concept depicted in an image, such as candidates’ facial displays of emotions (Boussalis et al. Reference Boussalis, Coan, Holman and Müller2021).
However, there are other research instances that demand different conceptualizations of the content of an image (e.g., in terms of proportions of a given topic) or that require a specific representation of the image to work. For example, for the application of this article, I study the ways in which media outlets frame the magnitude of the caravan of migrants through the use of dense crowds in the images they publish.
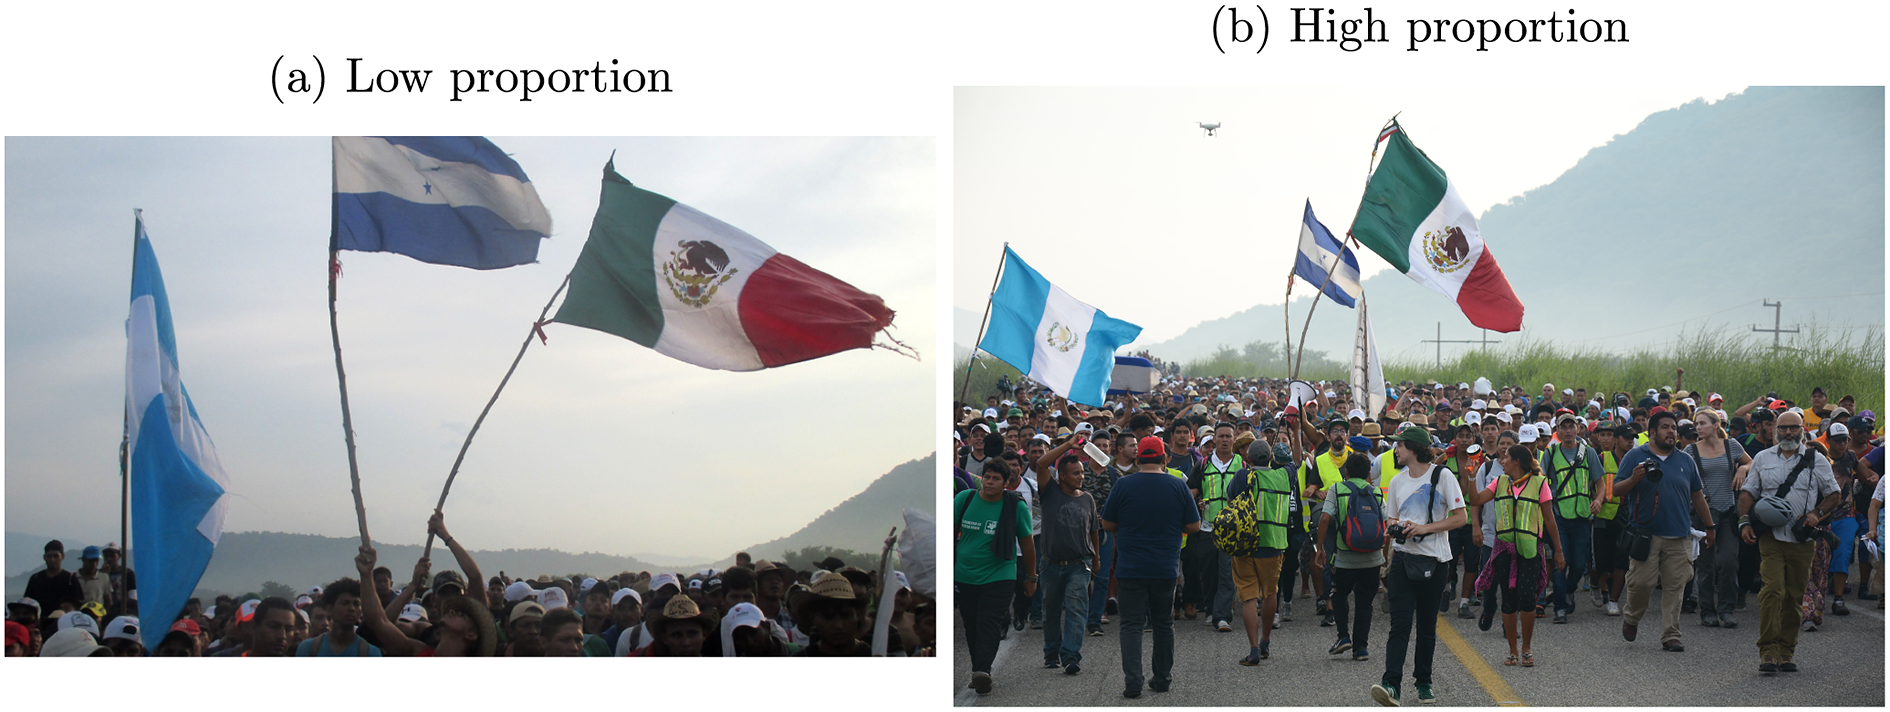
While a binary indicator of whether a picture shows a dense crowd or not might be useful for certain purposes, the proportion that such a crowd occupies in different pictures is more informative for the question of how media uses visual frames. If we compare two images each showing a crowd of the same size but from different angles, the space that the crowd occupies in those images may vary. Figure 7 illustrates this. A CNN would correctly indicate that both pictures contain a crowd, a binary indicator. However, the crowd depicted in the picture on the right occupies a much higher proportion of it than that on the left and therefore puts more emphasis on the individuals rather than other elements like the flags.Footnote 10 This distinction is relevant when studying crowds as potential drivers of fear of immigration.
Comparison of different proportions of a crowd in an image.
Note: (a) By Sandra Cuffe/Al Jazeera; (b) By Jesús Alvarado.
To identify and measure these themes, scholars use methods like topic models. In particular, social scientists have relied on STMs (Roberts et al. Reference Roberts2014) as a tool for the identification of topics in texts and the introduction of domain knowledge in the classification and analysis processes. The STM takes as input a DTM of the texts under analysis. The words in the columns of this matrix are the tokens that feed the discovery of topics. The question is how to adapt this framework to the analysis of images.
By creating visual words, the BoVW delivers tokens in images comparable to those in a DTM. This is an important advantage of the approach because the features extracted through other methods, like CNNs, cannot be coerced into the format needed to conduct models like STMs. Further, the visualization of the visual words allows researchers to take full advantage of the STM functions, such as inspecting the features for topic labeling, testing the effect that the visual words have on the topic distribution, and even exploring whether a covariate influences the content of a topic.
The application in the next section illustrates the implementation of the method and the advantages discussed above.
4 The BoVW in Action: Feeding a Visual Structural Topic Model of the Migrant Caravan
To illustrate the implementation of the BoVW, I apply it to images of the Central American migrant caravan. I use an IVWM to identify meaningful political components of the photos, such as dense crowds (which signal the scale and “threatening” nature of the movement), and compare them across media outlets to study how media visually frames an event. For this application, I equate the visual themes or topics in an image with “visual frames” and hereinafter refer to topics as such.
I compiled a dataset with 5,952 images of the caravan from Getty Images that provide a comprehensive panorama of what happened during the Caravan pilgrimage (corpus of reference), and 688 photos from articles published by 35 media outlets (corpus of interest). This dataset includes photographs and metadata covering the photographer, source, caption, and others.
4.1 Detecting Visual Frames
First, I build a visual vocabulary of 2,000 “visual words” based on the features of 5,952 photos from Getty Images collected using the tag “migrant caravan.” The search was restricted to pictures from Central America, Mexico, and the United States between March 20, 2018 and November 18, 2018. The Getty collection images come from different photographers, thus alleviating concerns of potential biases in the pictures and maximizing the number of frames of that event: this corpus provides a richer view of what happened during the migrants’ pilgrimage. This set of images forms the corpus of reference coming from a neutral source, Getty, that acts as a benchmark for comparing the images that were actually published by news outlets, News API. Importantly, this codebook can be used for future studies related to the visual analysis of immigration given that it contains a rich perspective of the journey that migrants undertake to arrive to a destination.
Second, I build the IVWM of 688 images in 424 news articles covering the caravan of Central American migrants: the corpus of interest. The columns of this matrix are the 2,000 visual words generated from the Getty dataset. The news articles were published between October 3 and November 1, 2018. I compiled them both manually and with the News API.Footnote 11 I then feed the IVWM to an STM to analyze patterns in the visual material under analysis.
What factors explain variation in media frames? There is evidence that media outlets define the coverage and content of the information they provide based on their audience’s demands, marketing, and their own ideologies and values (Earl et al. Reference Earl, Martin, McCarthy and Soule2004; Fiske and Hancock Reference Fiske and Hancock2016; Iyengar and Hahn Reference Iyengar and Hahn2009; Oliver and Myers Reference Oliver and Myers1999). More specifically, (1) media outlets are more likely to cover issues that fit their own and their customers’ ideological leanings and (2) the content is going to be filtered through ideological lenses. Thus, we expect more negative framing of an issue when the core actors or events related to it are not aligned with the news outlet’s ideological position.
To explore the composition and generation of such frames, I initialized an STM with 15 topicsFootnote 12 and three prevalence covariates that account for the particularities of a given event and other characteristics of the actors responsible for choosing a picture: date, news outlet, and its ideology as measured by All sides, an organization that provides ratings of “media bias” (right, center-right, center, center-left, and left).Footnote 13 The inclusion of these political covariates allows the identification of topics that are meaningful for social scientific research. Further, it also provides estimates of the effects that variables like news outlet’s ideology have on the generation of the visual frames.
Overall, the specified STM identifies coherent visual frames in the content of the images: border, groups walking, dense crowds, dark backgrounds, fields, indoor portrait, outdoor portrait, individuals, rally, and sky and sand. These provide information about the actors, focus, and details regarding place and time of the events depicted.
4.2 Exploring Visual Frames
To label the visual frames that the STM identified, I look at both the most frequent and exclusive visual words, and the most representative images per topic. The first part is possible due to the construction of the visual words, tokens that other techniques like CNNs do not deliver. Figure 8 shows four of the most frequent and exclusive visual words (FREX) from 6 of the 15 topics (the rest are in Section A5 of the Supplementary MaterialFootnote 14). The replication code includes all the functions necessary to use the stm package and obtain this output.
FREX visual words per topic.
Note: The numbers of the topics in the replication file are 1, 4, 6, 9, 11, and 13.
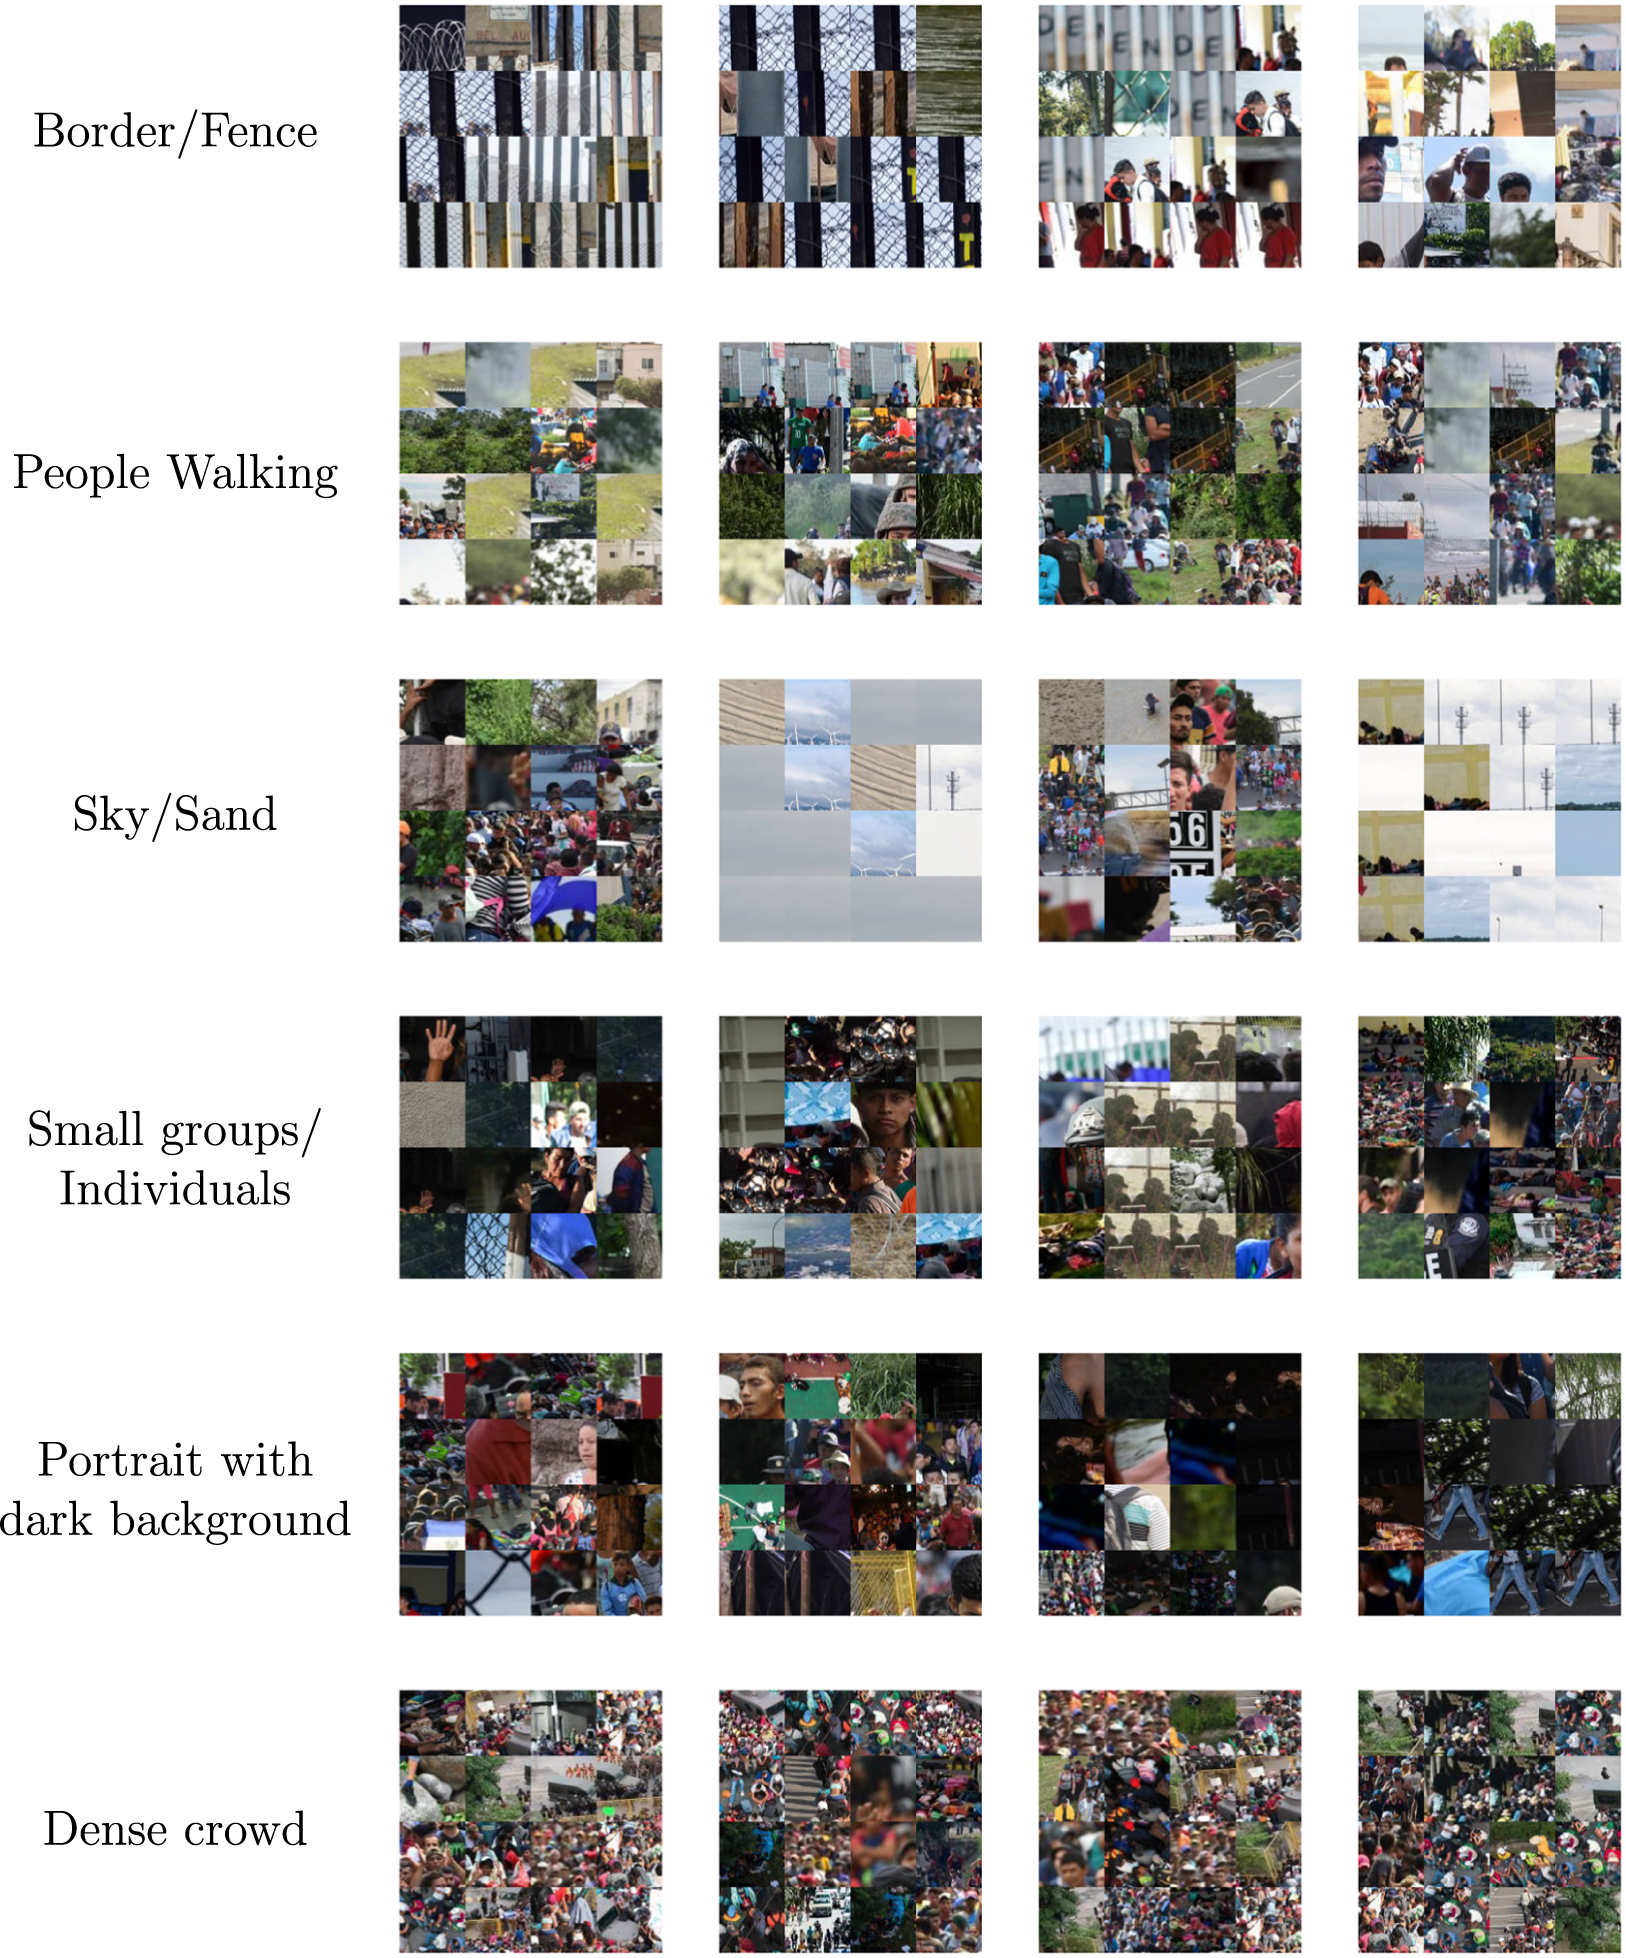
Notice that the most representative visual words of the topics contain mini patches that represent components of the frame. For example, the topic “dense crowd” has visual words with patches showing large groups, dense conglomerations of people, and granular textures, while the “border” frame has visual words with vertical lines corresponding to the bars of a fence. This evaluation occurs after the analysis stage and does not require an actual labeling of the visual words but rather a general evaluation of their content.
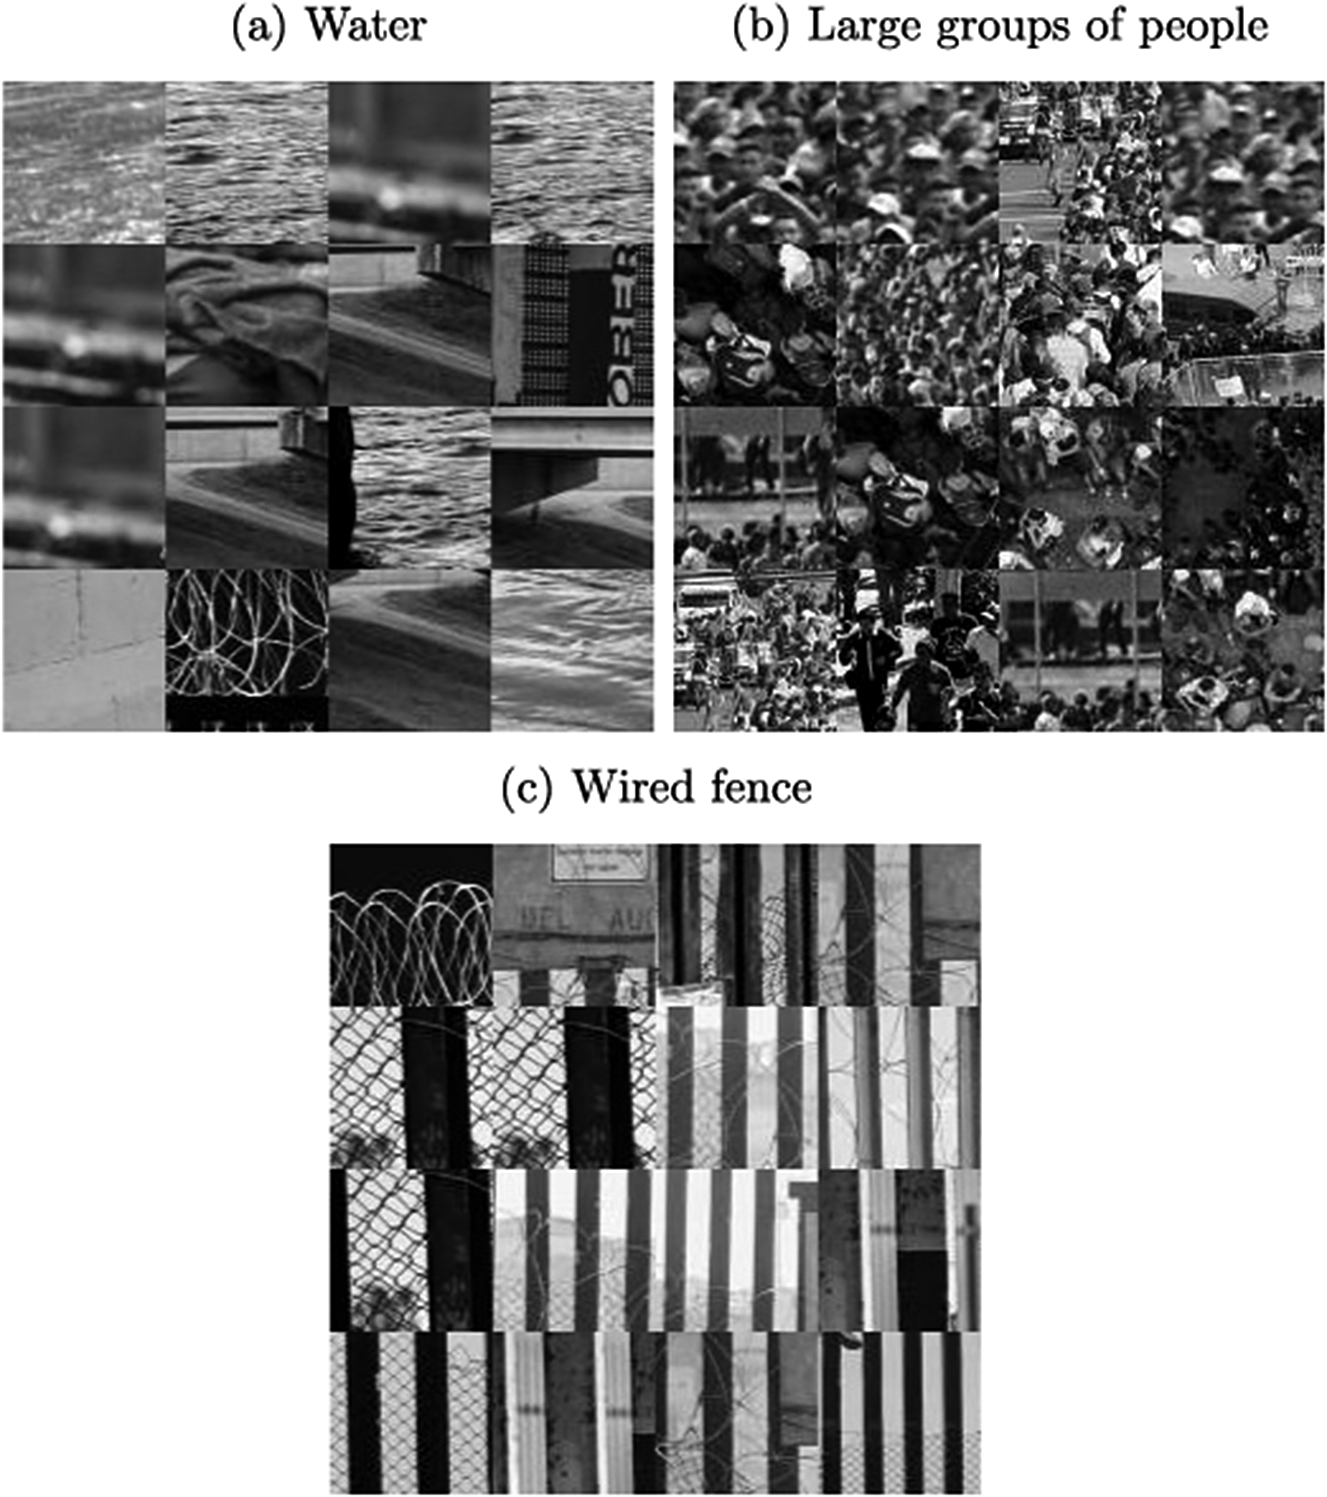
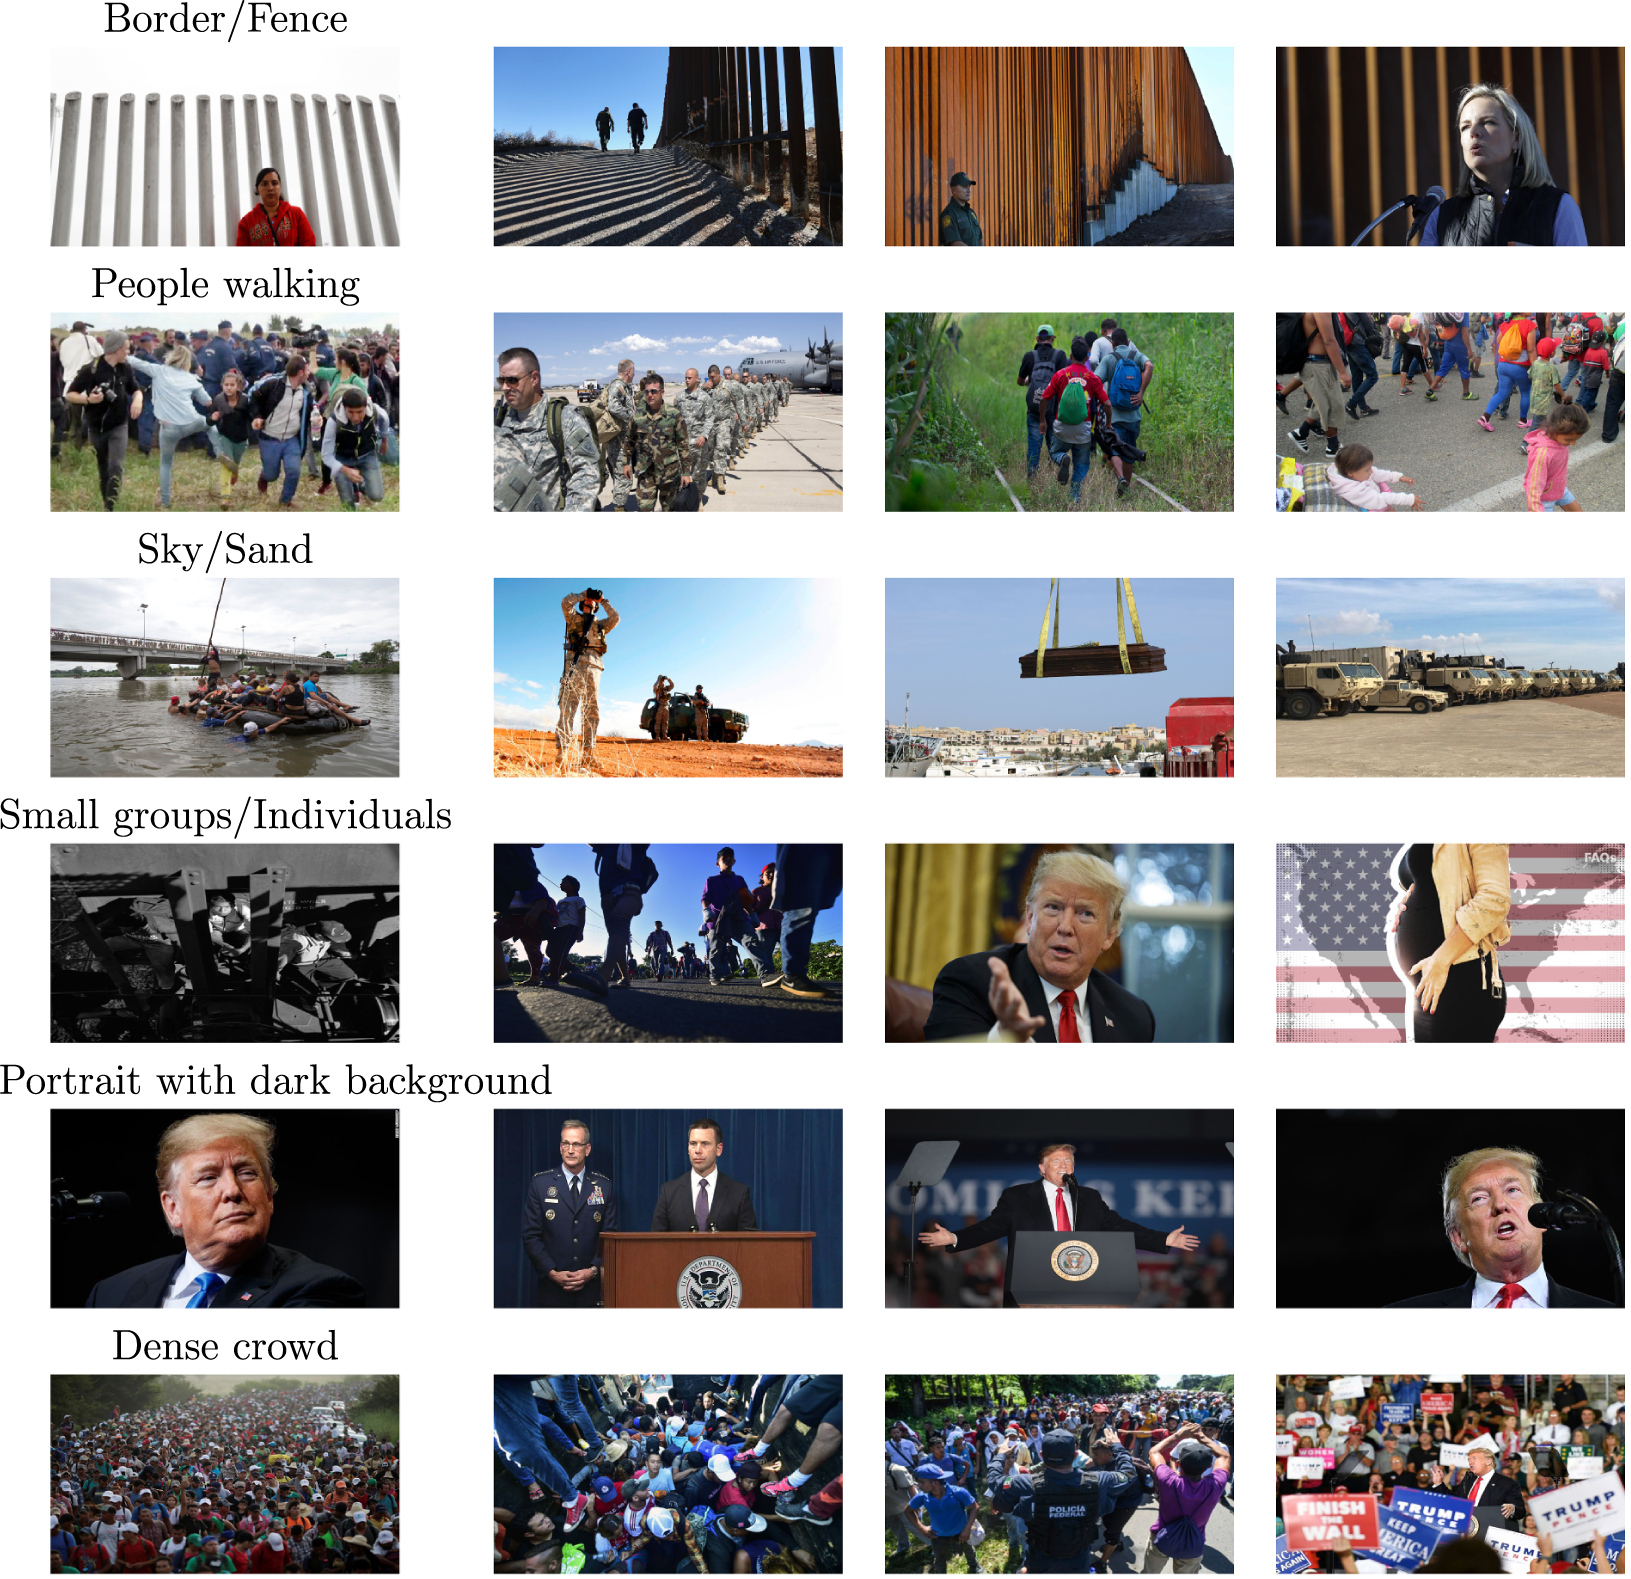
The frames’ labels become more obvious when we observe the most representative images per topic.Footnote 15 The most representative images of a topic k are those photos with high proportions of such topic. Figure 9 presents examples of these.
Most representative images per topic.
Note: Photo credits in the Supplementary Material.
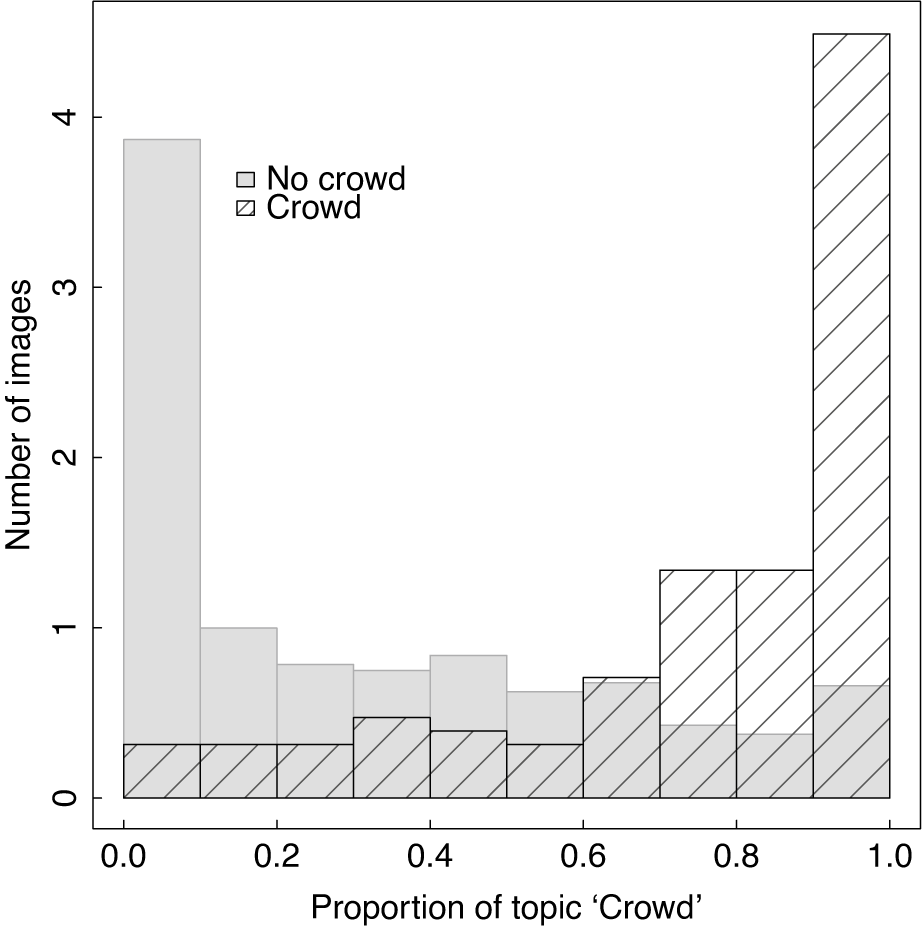
As a validation exercise of the topic proportions that the STM output, I hand-coded whether the pictures under study display a crowd and then compare this indicator with the proportions of crowd-related topics. Figure 10 shows a histogram of the sum of proportions of all topics that include crowds or large groups among those images labeled as containing a large crowd, and those without one. The first thing to note is that the modes of both distributions align with the expected “crowd” proportions: images with crowds have a high proportion of this topic, and images without a crowd show a low proportion of it. Second, the topic proportions provide more variation and flexibility regarding the depiction of the concept of interest as discussed in Section 3 and illustrated in Figure 7. Third, although there are certain cases in the tails that are incorrect classifications and that I discuss in the Supplementary Material, the results suggest that the topics can help with the estimation of coefficients that enable classification.
Identification of crowds and distribution of “crowd” proportions.
Note: The “No crowd” and “Crowd” labels are hand-coded. The density curves show the distribution of the topic “all crowd” (Dense Crowd + Outdoor crowds + People walking + Medium sized crowd) in each group.
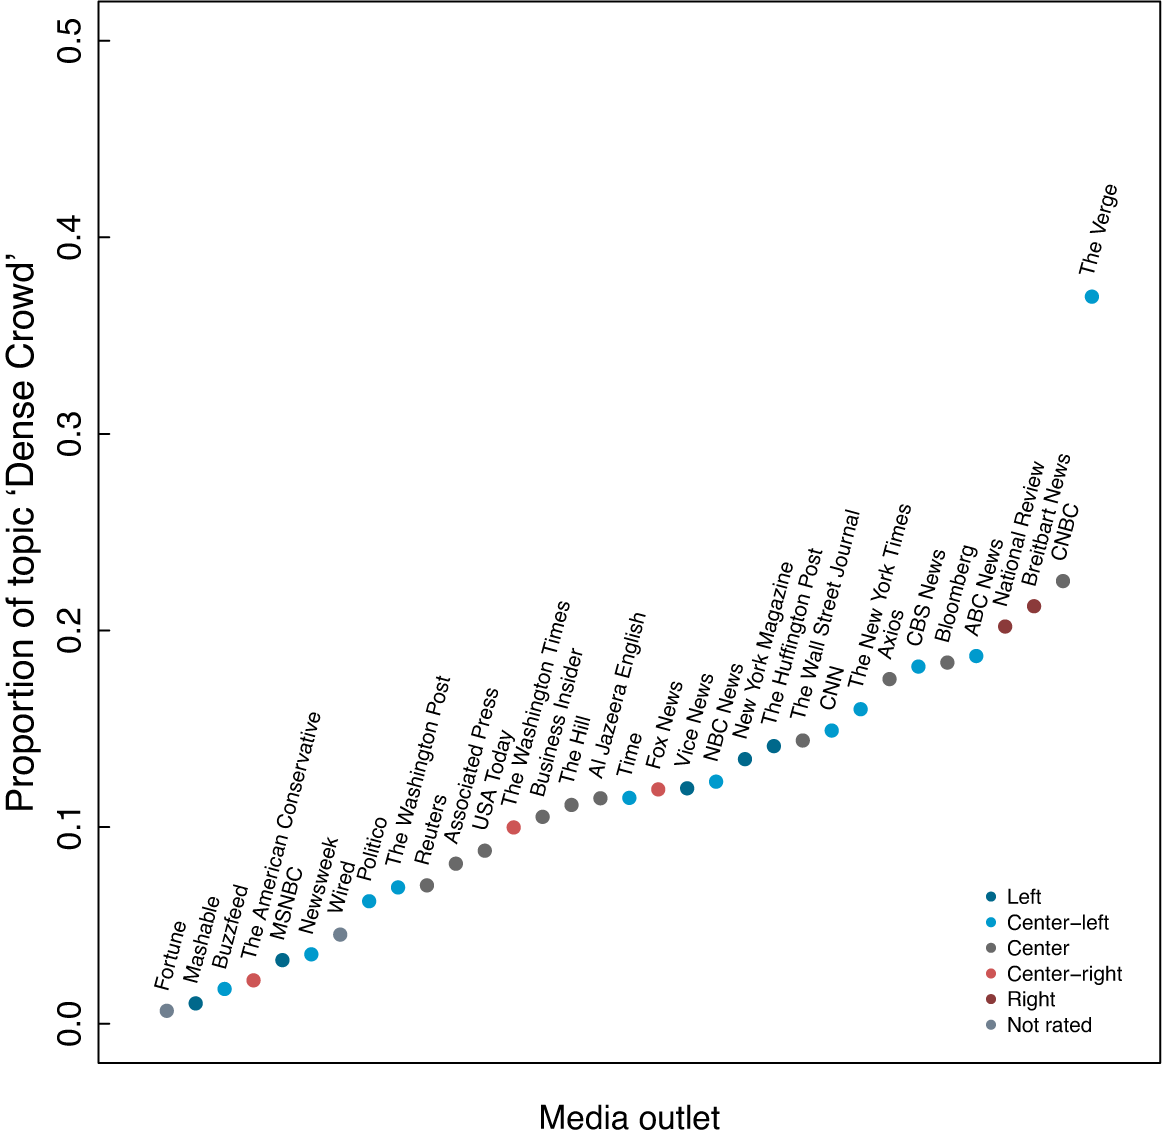
Crowd topic by media outlet.
Note: Each point represents the mean “crowd” topic proportion among the images of each of the outlets in the sample. The points are ordered from lowest to highest proportion of topic “crowd.” Colors indicate the ideological slant of the outlet.
4.3 Framing a Movement: Factors behind the Generation of Visual Frames
For ease of exposition, the current analysis of the frame generation focuses exclusively on the visual frame of the caravan’s scale through “dense crowds.”
The literature on attitudes toward immigration identifies several sources of threat: cultural, economic, and security-related (Hainmueller and Hopkins Reference Hainmueller and Hopkins2014; Homola and Tavits Reference Homola and Tavits2018; Sniderman, Hagendoorn, and Prior Reference Sniderman, Hagendoorn and Prior2004). There are two fundamental ideas underlying group threat theory: (1) the struggle over scarce resources makes people more likely to favor their own group over the out-group and (2) the potential for collective action against the majority increases disapproval of the out-group members. Thus, the relative size of an out-group has an effect on threat (Hjerm Reference Hjerm2007).
This directly illustrates the relevance of studying the information that media provides about the size and characteristics of immigrant groups like the caravan through the use of a “dense crowd” frame. The depiction of a crowd provides queues about the scale of the movement and affects the evaluations of costs and benefits of receiving immigrants. It is also related to “feature congestion” and “display clutter,” elements that have a negative effect on the attention and digestion of visual information (Rosenholtz et al. Reference Rosenholtz, Li, Mansfield and Jin2005).
The ideology of a news outlet determines its biases with respect to immigration, and therefore influences the way in which they frame information (Kriesi Reference Kriesi1995; Oliver and Myers Reference Oliver and Myers1999). This leads to the expectation that, for the case of the caravan, right leaning outlets will depict it in more threatening ways through the use of photos showing denser crowds than other outlets. This is line with the idea that conservatives and right-leaning actors are more likely to hold negative views about immigration (Abrajano and Hajnal Reference Abrajano and Hajnal2017; Homola and Tavits Reference Homola and Tavits2018).
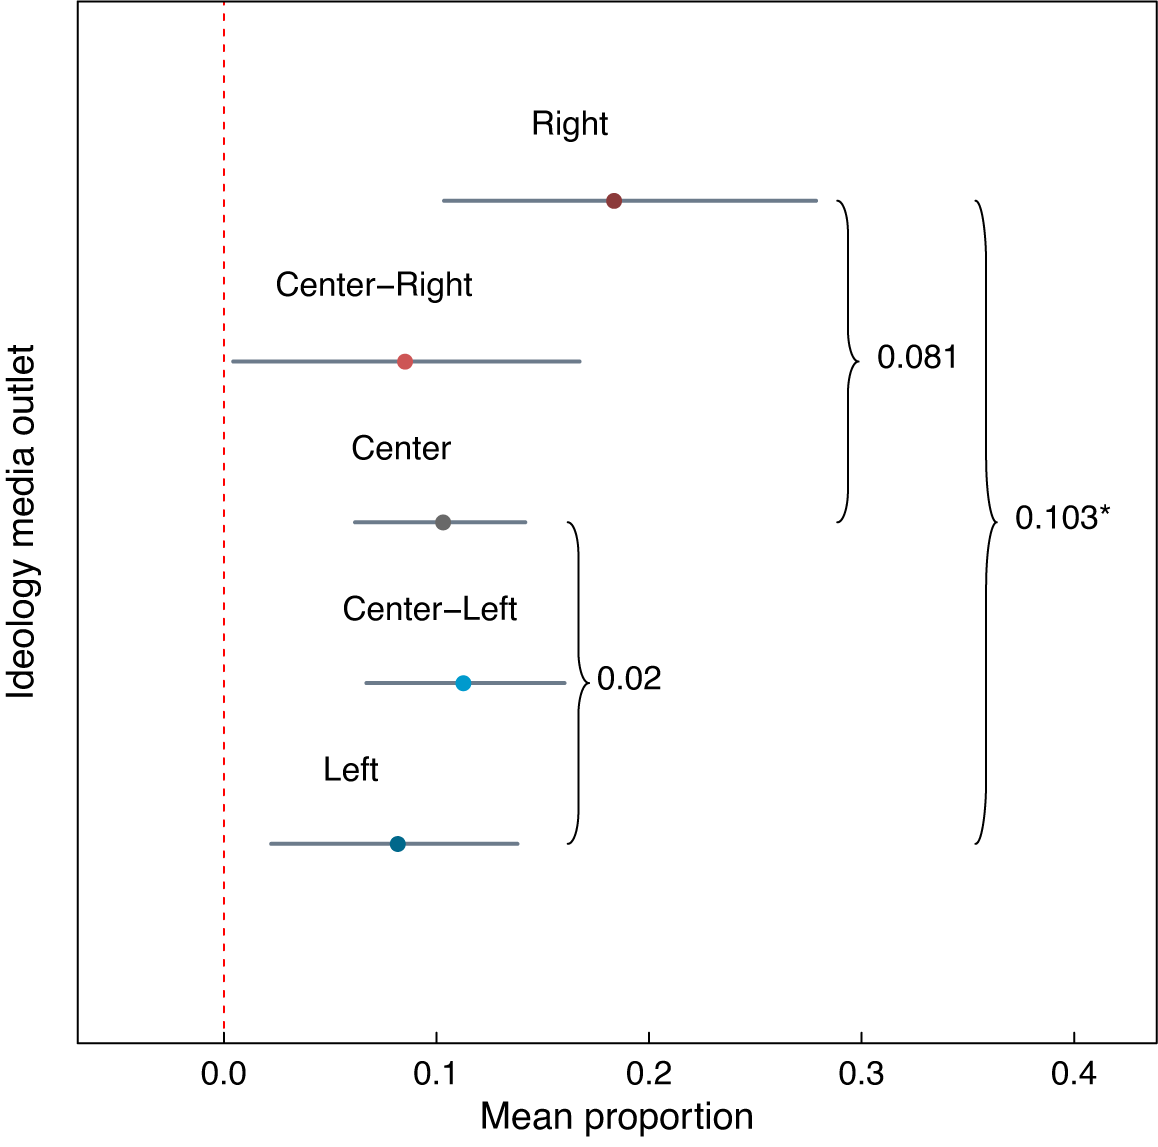
Figure 11 illustrates the variation in the use of crowds (mean proportion of “dense crowd” along the y-axis) across the different outlets (x-axis). The color of each point indicates the ideological leaning of the outlet.
Is this variance associated with ideology? The STM framework allows me to analyze the effect of the ideological leaning of the newspapers, the prevalence covariate of the STM, on the generation of the topic “dense crowd.”Footnote 16 The mean of this topic by ideological group in Figure 12 shows that the news outlets with right-leaning biases publish pictures with higher proportions of this topic than the other groups. On average, right leaning outlets tend to publish images with 8 percentage points more content of the frame “dense crowd” than outlets in the center, and 10 percentage points more than left-leaning outlets.
Ideological leanings and portrayal of crowds.
Note: Each point represents the mean “crowd” topic proportion among the images published by media outlets in each of the ideological bias categories. Brackets indicate the differences between a few groups, and the $*$
indicates that the 95% confidence interval of the difference does not cover 0.
$*$
indicates that the 95% confidence interval of the difference does not cover 0.
5 Practical Considerations
5.1 Modeling Decisions and Hyperparameters
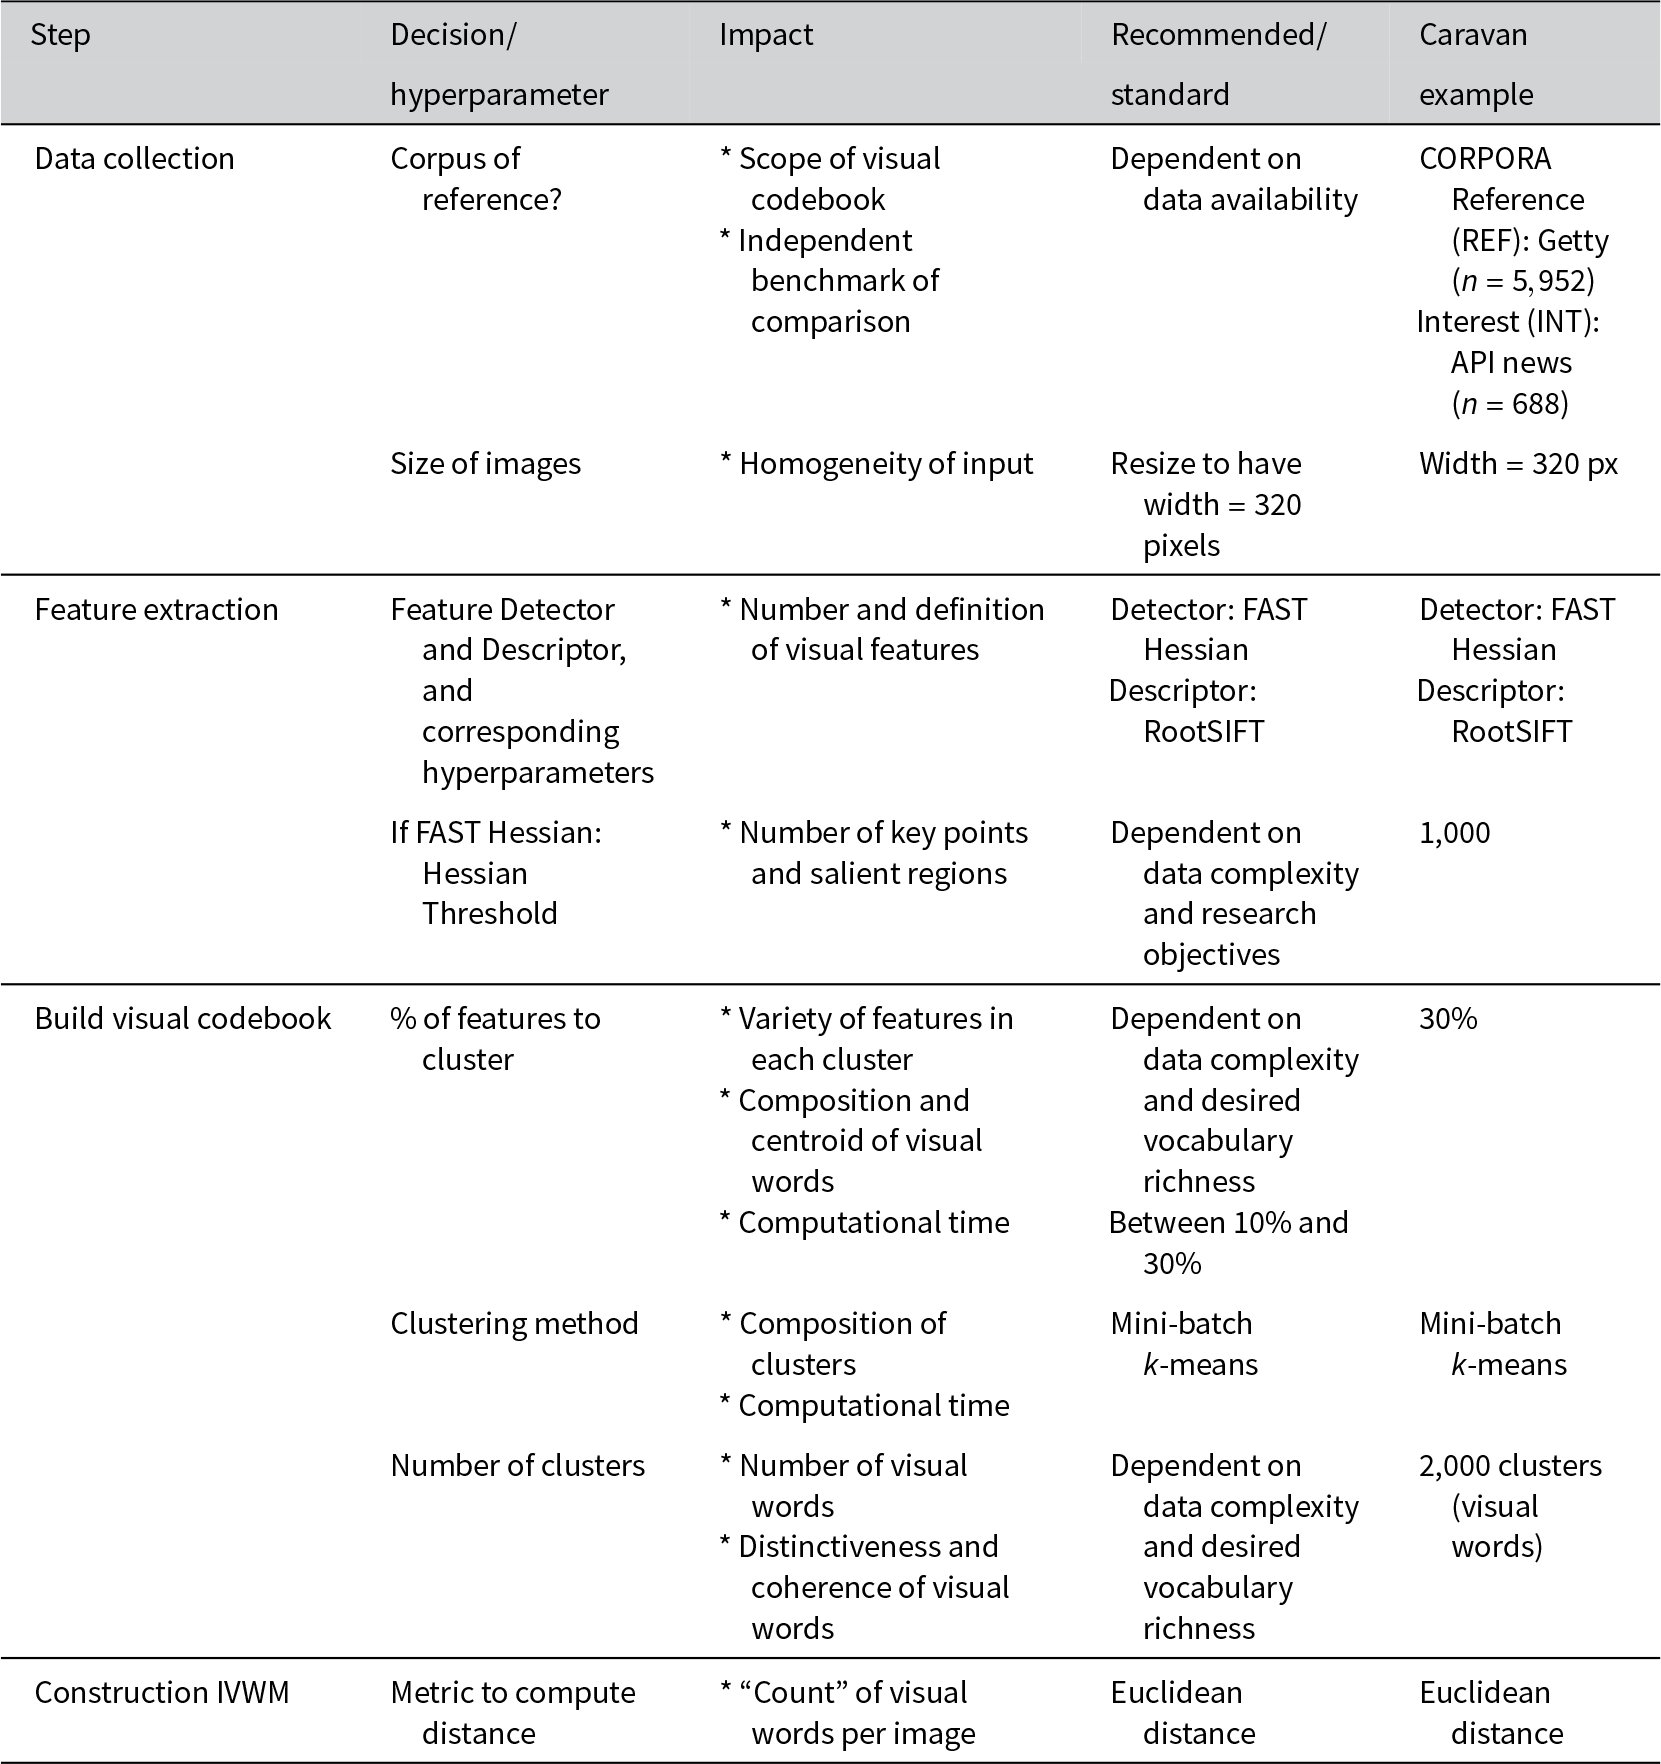
The process of building a BoVW requires certain specifications that are subject to the researcher’s criteria. Section A8 of the Supplementary Material details a set of diagnosis tools and practical guidance for detecting key points, building a vocabulary, and determining the number and labels of visual frames. Further, Table 1 provides a description of the different decisions and parameters that each stage involves, their impact on the image processing workflow, standard or recommended values for such parameters, and a practical illustration of these decisions when conducting the analysis of the migrant Caravan outlined in Section 4.
Decisions and hyperparameter tuning when building BoVW.
5.2 Technical Setup and Runtime
Another important consideration is the technical requirements to execute this framework. Overall, the computational costs, especially compared to other deep learning tools, are low. For example, although special infrastructure like graphics processing units or high-performance computing clusters are only necessary when training a CNN from scratch, this hardware reduces costs in other simpler processes such as retraining or fitting a CNN to a large pool of images. Given that the BoVW relies on simple image processing formulas that are optimized through the use of matrices, it can be run on any standard computer.
As a reference, the entire routine of building a BoVW with 5,000 images and 2,000 words takes approximately 3.8 hours on a 2018 laptop with four cores where the most demanding stage is the visualization of the visual words taking approximately 87% of that time.Footnote 17 However, once the visual codebook is defined, building IVWMs from other pools of images takes approximately 0.05 seconds per image.
With regard to software and language requirements, the construction of the BoVW relies on OpenCV. Using the detector and descriptor specified in the text requires that OpenCV is compiled from source to unlock the patented algorithms. To run the particular example of a visual structural model above, I provide all the relevant code and functions to make the stm package suitable for images.
5.3 Validation and Interpretation of Results
In this section, I discuss an approach that helps with the most crucial step of any classification process: validation. Most of the tools designed for visual inspection lack guidance on how to proceed with diagnosis or validation procedures. This, in part, is a result of the complexity of the data, and the absence of concrete tokens to consider: it is harder to find a synonym for a patch of an image than for a word. However, images provide an advantage over other types of data: they offer better opportunities to visualize information. This helps with the identification of “errors” and “inconsistencies.”
Visualizing mistakes.
The replication code covers the construction of visual words and their visualization. The visual inspection of these clusters is fundamental to understand some of the patterns that the computer identifies. In some cases, the consistency is obvious and straightforward, but in others, the clustering process produces puzzling results. For example, a visual word with radically different mini patches is a symptom of a low number of key points or a small number of clusters. Similarly, one with almost all mini patches from the same image indicates that either the percentage of features sampled or the precision of the detector is too high.
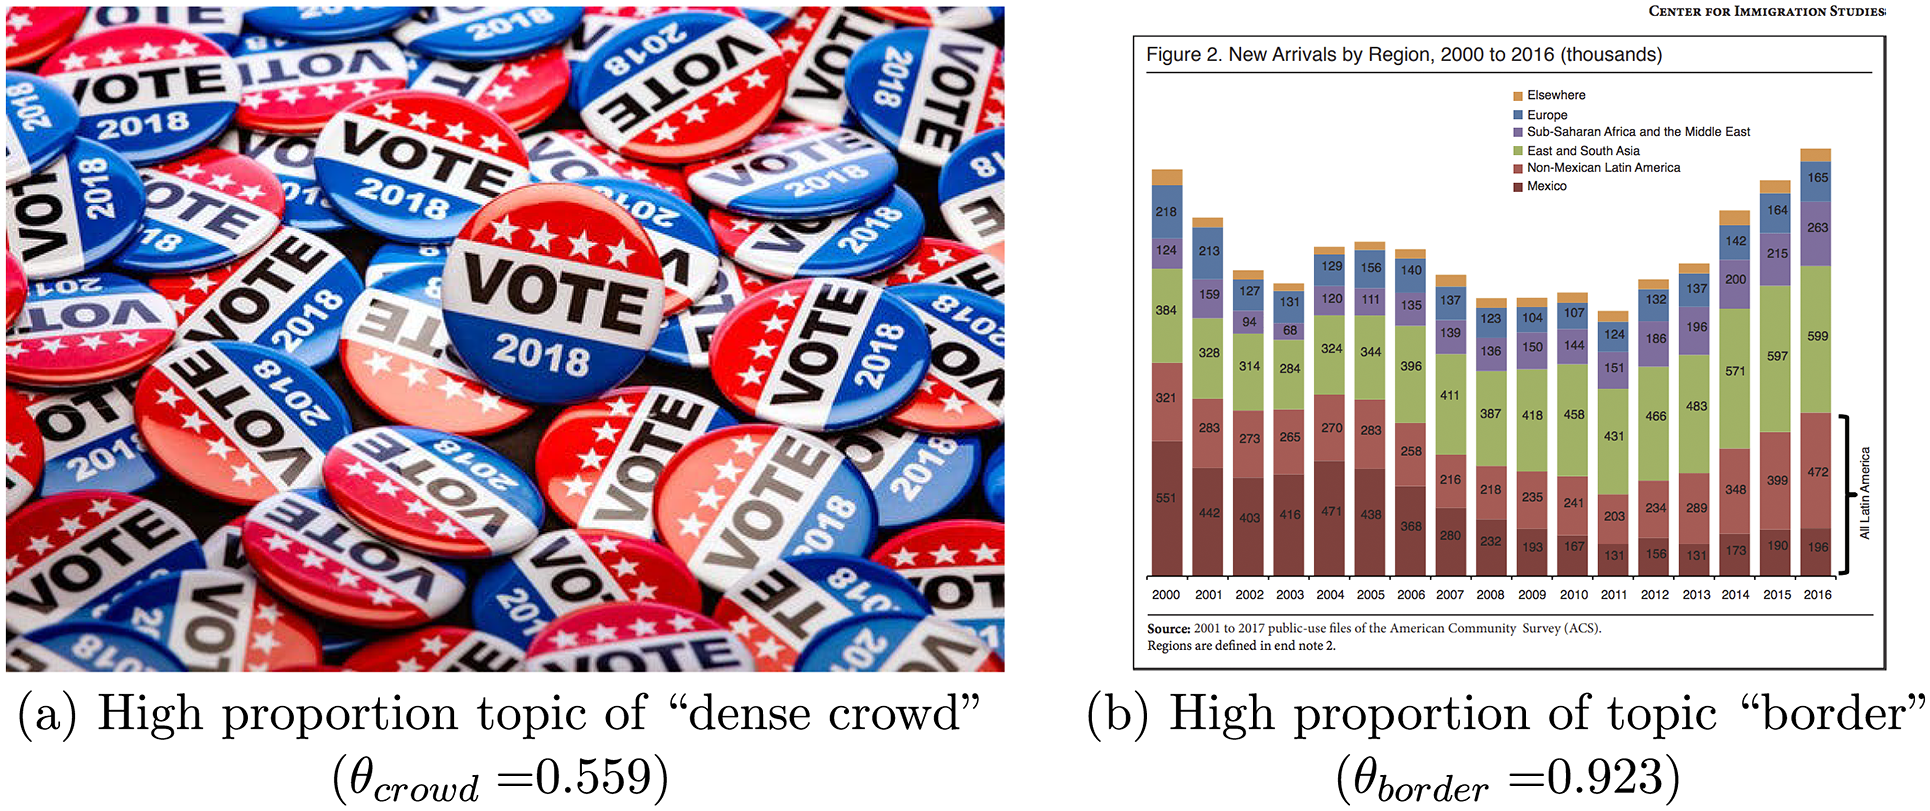
Some of the potential errors and pitfalls become obvious in a post-BoVW stage. For example, Figure 13a has a high percentage of topic “crowd” although it is just a shot of buttons. The texture of the collection of buttons resembles that of a big crowd in terms of pixel intensity changes. Further, Figure 13b is a plot that was paired with the article to illustrate facts. This picture is clustered with the “border/fence” group due to the vertical lines of the graph. Thus, the manual analysis of those pictures or the removal of customized “visual words” are alternatives that help to improve the study. I cannot stress enough the importance of inspecting the results, not only to detect inconsistencies, but also to understand the complexity and depth of the data under study.
Finally, it is important to highlight that while these methods are helpful to quantify and classify visual material, they cannot replace the expertise of humans when it comes to identifying more complex messages underlying it. Therefore, validation and human involvement in the classification process are crucial steps that should not be underestimated.
6 Conclusion and Further Research
The BoVW is a useful technique that reduces the dimensionality of images through the extraction of features represented by pixel intensity changes. This approach involves a series of steps designed to “tokenize” images in a comparable way to words in text. The output of this method, an IVWM, can be used as the basis of unsupervised and semi-supervised models that go beyond single membership classification.
Although the detection of features is simpler and less intricate than those achieved by deep learning methods like CNNs (and so potentially less accurate in supervised predictive tasks), its characteristics make it more transparent and interpretable. Further, the creation of a visual codebook allows the BoVW to be used with common social science tools, like STMs, that work with DTMs. These types of models not only guide the discovery of patterns with substantive covariates inspired by the researcher’s domain knowledge, but also permit the analysis of new questions related to the prevalence and content of visual topics in a corpus of interest. However, the BoVW and CNNs do not compete with each other but instead attend distinct research purposes.
The current article details the logic and mechanics of the steps of the BoVW and provides guidance to implement them. It also discusses some of the advantages of the BoVW with respect to CNNs and introduces to political science a framework to translate unsupervised and semi-supervised text analytical tools to the realm of images. To illustrate this, I presented an analysis of the use of dense crowds by media outlets to frame the scale and potential threat of the caravan of migrants from Central America.
While in its current state the BoVW is an accessible procedure to study questions related to imagery, there are features that can be improved. The BoVW is solely based on pixel intensities, and therefore all images are converted to gray scale. Although intensities and change in them are capturing a lot of the information regarding the content of a picture, color is another important source of information that should not be ignored (Vigo et al. Reference Vigo, Khan, Van De Weijer and Gevers2010). Further studies should consider the inclusion of “color statistics” to the BoVW routine.
Further, the applications of this method to visual framing should be extended to include text and other relevant covariates. In particular, the analysis of whether visual content reinforces, complements, or contradicts factual information provided in texts is fundamental for a proper understanding of political communication processes.
The BoVW can be used to address a variety of questions in multiple fields: electoral campaigns, social movements, migration flows, media coverage of political figures, and so forth. Images overcome one of the main challenges when studying events or issues in different countries: their language is universal and can be captured and synthesized with methods like the BoVW. Thus, the comparison of political issues such as the way in which leaders in each country visually present foreign interactions to their constituencies, or the different frames of protests across countries becomes more viable.
Further, the BoVW can help with experimental designs involving images as treatments by improving information equivalence (Dafoe, Zhang, and Caughey Reference Dafoe, Zhang and Caughey2018). Researchers can use topic proportions to inform their selection of visual treatments varying along a given dimension or to define treatment dosages.
This article addresses issues regarding image analysis and visual framing, and contributes to a blooming literature focused on the extraction and analysis of information that visuals provide. These are efforts oriented toward achieving a better understanding, a “full picture,” of multiple political phenomena and the way in which that information reaches hearts and minds.
Acknowledgments
I would like to thank Michael Bailey, Francisco Cantú, Sanmay Das, Bryce Dietrich, Katie Einstein, Justin Esarey, Emily Gade, Jeff Gill, Soeren Henn, Jonathan Homola, Dan Hopkins, Devin Judge-Lord, Mayya Komisarchik, Chris Lucas, Jacob Montgomery, Betsy Sinclair, Sebastian Vallejo, members of the Political Data Science Lab at Washington University in St. Louis, attendants of the Applied Statistics Workshop at Harvard, New Faces in Political Methodology X, Polmeth XXXV, LatAm Polmeth 2021, and the Methods Workshops at Iowa State, UW-Madison, Stanford, Berkeley, TAMU and UCLA, and two anonymous reviewers for helpful comments. The use of the images in this article is under Fair Use: Copyright Disclaimer Under Section 107 of the Copyright Act in 1976; Allowance is made for “Fair Use” for purposes such as criticism, comment, news reporting, teaching, scholarship, and research. Fair use is a use permitted by copyright statute that might otherwise be infringing. Non-profit, educational or personal use tips the balance in favor of fair use. All rights and credit go directly to the authors and rightful owners of the featured images as indicated in Section A9 in the Appendix and throughout the main text.
Data Availability Statement
Replication code for this article has been published in Code Ocean, a computational reproducibility platform that enables users to run the code and can be viewed interactively at https://doi.org/10.24433/CO.1204365.v1. A preservation copy of the same code and data can also be accessed via Harvard Dataverse at https://doi.org/10.7910/DVN/PZYLYU (Torres Reference Torres2023a, Reference Torresb).
Supplementary Material
For supplementary material accompanying this paper, please visit https://doi.org/10.1017/pan.2023.32.


