


Phyllosilicate minerals are common hydrophobic minerals present as impurities in complex sulfide ores and include aluminium silicate minerals such as pyrophyllite, kaolinite, muscovite and chlorite, as well as the corresponding magnesium silicate minerals, talc, serpentine and phlogopite (Du & Miller, Reference Du and Miller2007). Theoretically, pyrophyllite (Al4Si8O20(OH)4) is composed of 66.65% SiO2, 28.35% Al2O3 and 5.00% H2O, and it is a dioctahedral 2:1 clay mineral consisting of an octahedral aluminium oxyhydroxide sheet sandwiched between two tetrahedral sheets (Bentayeb et al., Reference Bentayeb, Amouric, Olives, Dekayir and Nadiri2003; Deer et al., Reference Deer, Howie and Zussman2013).
Pyrophyllite occurrences are divided into two general groups: pyrophyllites formed by the hydrothermal alteration of acidic volcanics and pyrophyllites of metamorphic origin. Pyrophyllite is associated generally with minerals such as kaolinite, quartz, feldspar, sericite, diaspore, kyanite, andalusite, chloritoid, chlorite, epidote and rutile in these formations (Cornish, Reference Cornish and Leford1983; Harben & Kuzvart, Reference Harben and Kuzvart1997; Harben, Reference Harben1999; Hida & Kitagawa, Reference Hida, Kitagawa, Kogel, Trivedi, Barker and Krukowski2006; Virta, Reference Virta2009; Madejová et al., Reference Madejová, Gates, Petit, Gates, Kloprogge, Madejová and Bergaya2017). Pyrophyllite formations of various mineralogical compositions are known by names such as ‘roseki’, ‘agalmatolite’ and ‘wonderstone’ in various countries (Harben, Reference Harben1999).
High-quality pyrophyllite is used in the refractory, ceramic, fibreglass, pesticide, fertilizer, paper, paint, plastic, rubber, cement, building material and pharmaceutical industries. However, impurities in pyrophyllite ores limit their use and therefore the beneficiation of some ores with small pyrophyllite contents is necessary (Evans & Guggenheim, Reference Evans and Guggenheim1988; Harben, Reference Harben1999; Jena et al., Reference Jena, Singh, Rao, Dhawan, Misra and Das2015; Zelazny & White, Reference Zelazny, White, Dixon and Weed2018). The pyrophyllite contents in ores determine the areas of use of pyrophyllite in industry by determining the refractory properties, coefficient of thermal expansion, hardness and colour (Ciullo, Reference Ciullo1996; Jeong et al., Reference Jeong, Lee, Hong and Park2017). The quality of pyrophyllite is affected adversely by undesirable elements such as Fe, Ti, alkali ions and gangue minerals such as quartz, feldspar, mica and rutile (Harvey & Murray, Reference Harvey and Murray1997; Hida & Kitagawa, Reference Hida, Kitagawa, Kogel, Trivedi, Barker and Krukowski2006; Jeong et al., Reference Jeong, Lee, Hong and Park2017; Kim et al., Reference Kim, Cho, Changa, Kim, Lee and Park2019; Ali et al., Reference Ali, Ahmed, Ahmed and Hefni2021). On the other hand, pyrophyllite can be used as a substitute for kaolinite in many industrial applications such as the ceramic, pottery and filling industries, and it can also be used as a substitute for talc in many applications, especially as a filler pharmaceutical, and in medical applications (Mukhopadhyay et al., Reference Mukhopadhyay, Ghatak and Maiti2010; Ali et al., Reference Ali, Ahmed, Ahmed and Hefni2021).
Various methods have been tested for removing impurities from non-metallic minerals. In the case of pyrophyllite, wet processing methods have been explored, such as flotation, gravity separation, leaching, microwave treatment and magnetic separation (Birinci & Sarıkaya, Reference Birinci and Sarıkaya2004; Bozkaya et al., Reference Bozkaya, Yalçın, Başıbüyük and Bozkaya2007; Bulatovic, Reference Bulatovic2007; Perepelitsyn et al., Reference Perepelitsyn, Proshkin, Rytvin, Ignatenko, Yarosh and Abyzov2008; Xia et al., Reference Xia, Zhong, Liu, Huang, Chang and Li2009; Abdrakhimova, Reference Abdrakhimova2010; Jena et al., Reference Jena, Singh, Rao, Dhawan, Misra and Das2015; Cho et al., Reference Cho, Kim, Choi and Park2016; Kim et al., Reference Kim, Cho, Changa, Kim, Lee and Park2019). Pyrophyllite does not have a layer charge because only Si4+ occupies the tetrahedral sites and two-thirds of the octahedral sites are filled with Al3+ only. The electrically neutral sheets in pyrophyllite are bonded together by relatively weak dipolar and van der Waals forces (Evans & Guggenheim, Reference Evans and Guggenheim1988). Due to this weak interlayer bonding force, the pyrophyllite surface is electrically neutral, which gives rise to natural floatability. Therefore, pyrophyllite is a fast-floating and easy-sliming mineral (Erdemoğlu & Sarıkaya, Reference Erdemoğlu and Sarıkaya2002; Das & Mohanty, Reference Das and Mohanty2009; Zhao et al., Reference Zhao, Yan, Wang, Hui and Gu2017).
The faces of pyrophyllite are naturally hydrophobic; however, the edges of the pyrophyllite particles break the Si–O or Al–O bonds and consequently are hydrophilic (Miller et al., Reference Miller, Abdel Khalek, Basillio, El-Shall, Fa, Forssberg, Fuerstenau, Jameson and Yoon2007). The ratio of hydrophilic/hydrophobic surface sites is expected to affect the electrokinetic properties and the flotation behaviour of this mineral. The point of zero charge for pyrophyllite is reported as pH 2.4 (Hu et al., Reference Hu, Liu and Xu2003). Liu & Bai (Reference Liu and Bai2006) showed that surface ζ-potential variations as a function of pH show similar trends in various pyrophyllite samples. While the isoelectric point of various samples varies from 2.35 to 3.46, the isoelectric point shows a negative correlation with the mass fractions of SiO2 and Na2O. Pyrophyllite reduction is important because in many cases pyrophyllite is considered to be a gangue mineral in flotation separation. Polysaccharides such as guar gum have been studied as pyrophyllite reducers (Zhao et al., Reference Zhao, Yan, Wang, Hui and Gu2017, Reference Zhao, Wang, Wang, Yan, Zhou, Xu and Wang2019a, Reference Zhao, Wang, Yan, Gu, Wang, Wang and Peng2019b, Reference Zhao, Wang, Yan, Gu, Wang, Xu and Peng2019c).
Frothers are surface-active chemicals that concentrate at the air–water interface. They prevent air bubbles from coalescing or bursting by lowering the surface tension of a slurry. Frothing properties can be persistent or non-persistent depending on the desired stability of the froth (Laskowski et al., Reference Laskowski, Tlhone, Williams and Ding2003; Laskowski, Reference Laskowski2004; Melo & Laskowski, Reference Melo and Laskowski2006; Bulatovic, Reference Bulatovic2007; Finch et al., Reference Finch, Nesset and Acuna2008; Atak, Reference Atak2017). Frothers are very effective for the flotation of naturally floating minerals (Gupra et al., Reference Gupra, Banerjee, Mishra and Satidh2007; Khoshdast & Sam, Reference Khoshdast and Sam2011). Previous studies have assessed the effects of frother blends on flotation (Elmahdy & Finch, Reference Elmahdy and Finch2013; Ngorama et al., Reference Ngorama, Wiese and Franzidis2013; Dey et al., Reference Dey, Pani and Singh2014; McFadzean et al., Reference McFadzean, Marozva and Wiese2016; Bayram et al., Reference Bayram, Yenial and Bulut2018). The aim of this study is to investigate the effects of frothers and mixtures of frothers with kerosene on pyrophyllite flotation. The effect of bubble size on flotation was tested by measuring the bubble diameter during the experiments. This study also aimed to obtain optimal outcomes by controlling the flotation steps mineralogically and chemically.
Materials and methods
The pyrophyllite material used in this study was collected from the quarries of the Çimsa Company in the Pütürge region (Malatya, Turkey). The Pütürge metamorphic massif, located in eastern Turkey, is one of the two metamorphic massifs on the Bitlis–Pütürge Suture Zone (Southeast Anatolian Belt), which is the collision zone of the Arabian and Anatolian plates. The metamorphics (Palaeozoic) of the Pütürge massif constitute the basement in the region. An ophiolitic mélange and ophiolitic olistostrome group rocks (Mesozoic) are located in the Bitlis–Pütürge Suture Zone (Yazgan & Chessex, Reference Yazgan and Chessex1991; Dolmaz et al., Reference Dolmaz, Öksüm, Kalyoncuoğlu, Elitok, Aydın and Poyraz2009), followed by Upper Cretaceous magmatic and sedimentary rocks and Tertiary sedimentary (mainly carbonates) and volcanosedimentary rocks (Fig. 1; MTA, 2002).
Location and general geological map of the Malatya–Pütürge region in the Southeast Anatolian Belt (MTA, 2002).

The pyrophyllite rocks related to the gneiss and mica schists of the Pütürge metamorphic massif consist mainly of pyrophyllite, kaolinite (plus dickite), quartz and muscovite and minor amounts of kyanite, sericite, illite and alunite (Uygun & Solakoğlu, Reference Uygun and Solakoğlu2002; Erdemoğlu et al., Reference Erdemoğlu, Birinci and Uysal2020). Pütürge pyrophyllite with small iron and chromium contents has a bright white colour after firing, and it is has been used in white cement production, where it is known to produce the whitest cement in Europe (Uygun & Solakoğlu, Reference Uygun and Solakoğlu2002). There are ~6 million tons of apparent pyrophyllite reserves in the region (Aras et al., Reference Aras, Yılmaz and Ağrılı1993).
The mineralogical compositions of the natural pyrophyllite (NP) sample and final concentrate (FC) samples obtained after flotation experiments were identified using X-ray diffraction (XRD) at the Istanbul Technical University using a Bruker D8 Advance instrument with Ni-filtered Cu-Kα radiation in the 2–70°2θ range at 1° min–1 cm–1 scanning speed, 40 kV tube voltage and 40 mA current. The semi-quantitative mineralogical compositions of the natural and experimented pyrophyllite samples were estimated using the XRD reference intensity method (wt.%; Chung, Reference Chung1975). The heights of the most intense peaks and the reference intensity ratios (RIRs) of kaolinite, feldspar, quartz, illite and mica were used for the calibrations (Bulut et al., Reference Bulut, Chimmeddorj, Esenli and Çelik2009; Ekinci-Şans et al., Reference Ekinci-Şans, Esenli, Kadir and Elliott2015). The kaolinite RIR was also adopted for pyrophyllite. Considering the margin of error of the method, the error in terms of mineral percentage is ±5%. Additionally, the mineral contents determined using XRD were compared with the chemical composition of the NP sample. Major oxide chemical analyses of the samples were performed at Istanbul Technical University (JAL Laboratory) using X-ray fluorescence with a Bruker S8 Tiger instrument on pressed discs that were prepared using a binder and boric acid.
The pyrophyllite sample, with an average size of ~20 mm, was first fed into a jaw crusher and the particle size reduced to <6 mm. Subsequently, the sample was fed into a roller crusher and its particle size was reduced to <1 mm. The wet grinding method in a ceramic mill (diameter: 17 cm; length: 21.5 cm; ball size: 1.8 cm) was used for size reduction. In the grinding process, the solid ratio in pulp was adjusted to 60% and the ball mill charge was 40%. The rotation speed of the ball mill was 80 rpm. Particle-size analyses of the samples with reduced particle sizes were performed using a Malvern Mastersizer 3000 particle-size analyser. For particle-size analysis, the samples were prepared as homogenous suspensions with water (2% solid ratio), which were fed into the device at a concentration sufficient for analysis. The particle-size analysis was performed in triplicate.
In the flotation experiments, two frothers and their mixtures with kerosene were investigated. Methyl isobutyl carbinol (MIBC), pine oil (terpineol) and kerosene (non-ionic collector) reagents were used in the flotation studies. Detailed experiments were carried out depending on the amount of reagents. In this study, only the experimental results that are important in terms of content and distributions have been selected and examined. All flotation experiments were carried out with 300 g of sample using a Denver flotation machine. A pulp ratio of 20% solids in a cell volume of 1.5 L was used. The flotation conditions are listed in Table 1. A flow diagram of the size-reduction and flotation experiments is given in Fig. 2. In the flotation experiments, the bubbles formed at the beginning of the flotation process and at the end of the 5 min conditioning period were photographed from the same angle. A measuring unit was placed at the edge of the cell. Then, bubble diameters were determined as Feret diameters using the ImageJ program. Large numbers of bubble diameters were measured to reduce deviation and to achieve accurate results. The Al2O3 content and recoveries were evaluated by correlating the bubble diameters. The bubble-diameter measurement method and the images taken during the experiment are shown in Fig. 3, and some photographs of bubbles on flotation cells with various reagents are shown in Fig. 4.
Flow diagram of the size reduction and flotation experiments on the ore sample (dashed lines indicate circuits that were implemented only in some situations).

Measurements of bubble diameters and an image of the bubbles during flotation.

Photographs of bubbles on flotation cells with various reagents. From left to right: 150 g t–1 MIBC, 150 g t–1 pine oil, 150 g t–1 kerosene plus MIBC, (150 g t–1 kerosene plus pine oil and 550 g t–1 kerosene plus MIBC (scale bar = 2 cm).

Flotation experiment conditions.

Results
Natural pyrophyllite
The Pütürge NP sample contains abundant pyrophyllite, quartz, kaolinite and smaller or trace amounts of illite–mica and feldspar (Fig. 5). The crystalline phases were identified using mineral cards given in JCPDS (1974) (pyrophyllite: 2-613 and 12-203; quartz: 5-490; kaolinite: 14-164; illite–mica: 9-343 and 7-42; and feldspar–microcline: 19-932). From the XRD modal analysis results and chemical compositions, the mineral abundances (wt.%) of the NP sample were pyrophyllite (40–45%), kaolinite (20–25%), quartz (20–25%), illite–mica (10–15%) and feldspar (<5%).
XRD trace of the Pütürge NP sample.

The spacing values of the basal distances (d 002, d 004, d 006, d 008 and d 00,10) of the Pütürge pyrophyllite were 9.19, 4.59, 3.06, 2.28 and 1.83 Å, respectively (Table 2). Table 1 also lists the XRD data of the basal series for two pyrophyllites from the USA (card no. 2-613) and Japan (card no. 12-203) given in JCPDS (1974) with the Pütürge pyrophyllite. According to the XRD data, the most intense peaks of pyrophyllites are at 9.19, 4.59 and 3.06 Å, and these were used to interpret the flotation results. The most intense peaks were 7.16 and 3.58 Å (d 001 and d 002) for kaolinite, 9.97 and 4.99 Å for illite–mica (d 002 and d 004 for illite; d 003 and d 006 for mica) and 3.24 Å for feldspar–microcline (Fig. 5).
XRD data of the basal series d 00l of two pyrophyllites (card 2-613 for the US pyrophyllite and card 12-203 for the Japanese pyrophyllite; JPDS, 1974) and the Pütürge pyrophyllite.
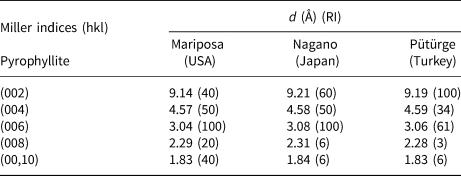
RI = relative intensity.
The chemical composition of the NP sample was in accord with the mineralogical composition. The SiO2 (69.75%) is due to quartz, pyrophyllite and kaolinite, and the Al2O3 (23.04%) is due to pyrophyllite and kaolinite. Some of the SiO2 and Al2O3 contents are associated with feldspar. The K2O (1.02%), CaO (0.74%), Na2O (0.18%) and MgO (0.12%) contents are attributed to illite–mica, feldspar and probably pyrophyllite and/or kaolinite. The NP sample also contains 0.23% Fe2O3, 0.32% TiO2 and 4.60% loss on ignition (LOI). The particle-size analysis results for the NP sample are shown in Fig. 6. Approximately 90% of the material is <23.7 μm in size.
Particle-size distribution of the NP sample.

Flotation experiments
Single use of frothers
Flotation experiments were carried out with two different frothers at two different concentrations. Table 3 shows the effects of the frothers in their single use on the distributions and contents of SiO2, Al2O3 and LOI. Figure 7 shows the bubble diameters depending on the frother used.
Comparison of the effects of the single use of frothers on bubble diameter.

Single usage of frothers.

Cont. = content, Distr. = distribution.
Mixture of frothers with kerosene
Kerosene was mixed with the frothers and the effects of kerosene plus MIBC and kerosene plus pine oil mixtures on flotation were investigated. A total of 150 g t–1 (75 + 75 g t–1, kerosene + frother) of reagent was used. When pine oil and kerosene were used together, the concentrate content was Al2O3 24.08 wt.%, the distribution decreased to 42.63% and the SiO2 content in the concentrate was ~67 wt.%. The large SiO2 content in the concentrate indicated that the concentrate was not clean. On the other hand, in the experiment with the kerosene plus MIBC mixture, the Al2O3 content of the concentrate was 27.17 wt.% and the distribution was 45.98%. As the concentrate distribution was small, totals of 150 g t–1 MIBC and 400 g t–1 kerosene were mixed and the experiment was repeated, resulting in a concentrate with 26.63 wt.% Al2O3 content and a distribution of 65.91% (Table 4). When the results were compared in terms of bubble diameters, the bubble sizes were almost the same in these experiments. The effects of using the kerosene plus frother mixtures on bubble size are shown in Fig. 8.
Comparison of the effects of mixtures of frothers with kerosene on bubble diameter.

Mixture effects of frothers with kerosene.

Cont. = content, Distr. = distribution.
Cleaning circuits in flotation
The test concentrates showing the best results were cleaned without the addition of reagent (except in the case of the single use of pine oil). Experiments were conducted with mixtures of kerosene plus MIBC at small and large dosages of 150 g t–1 for FC-2 and 550 g t–1 for FC-5. In addition, a kerosene plus pine oil mixture of 150 g t–1 for FC-1 and single pine oil usages of 150 g t–1 for FC-3 and 200 g t–1 for FC-4 were examined. The Al2O3 contents of the concentrates were large (Table 5). The effects of these cleaning circuits on bubble diameter are shown in Fig. 9. There was no significant difference in the bubble diameters measured in the cleaning circuits when using combinations of various reagents.
Comparison of the effects of the cleaning circuits on bubble diameter.

Cleaning effects in the flotation experiments.

Cont. = content, Distr. = distribution.
Mineralogical and chemical interpretation
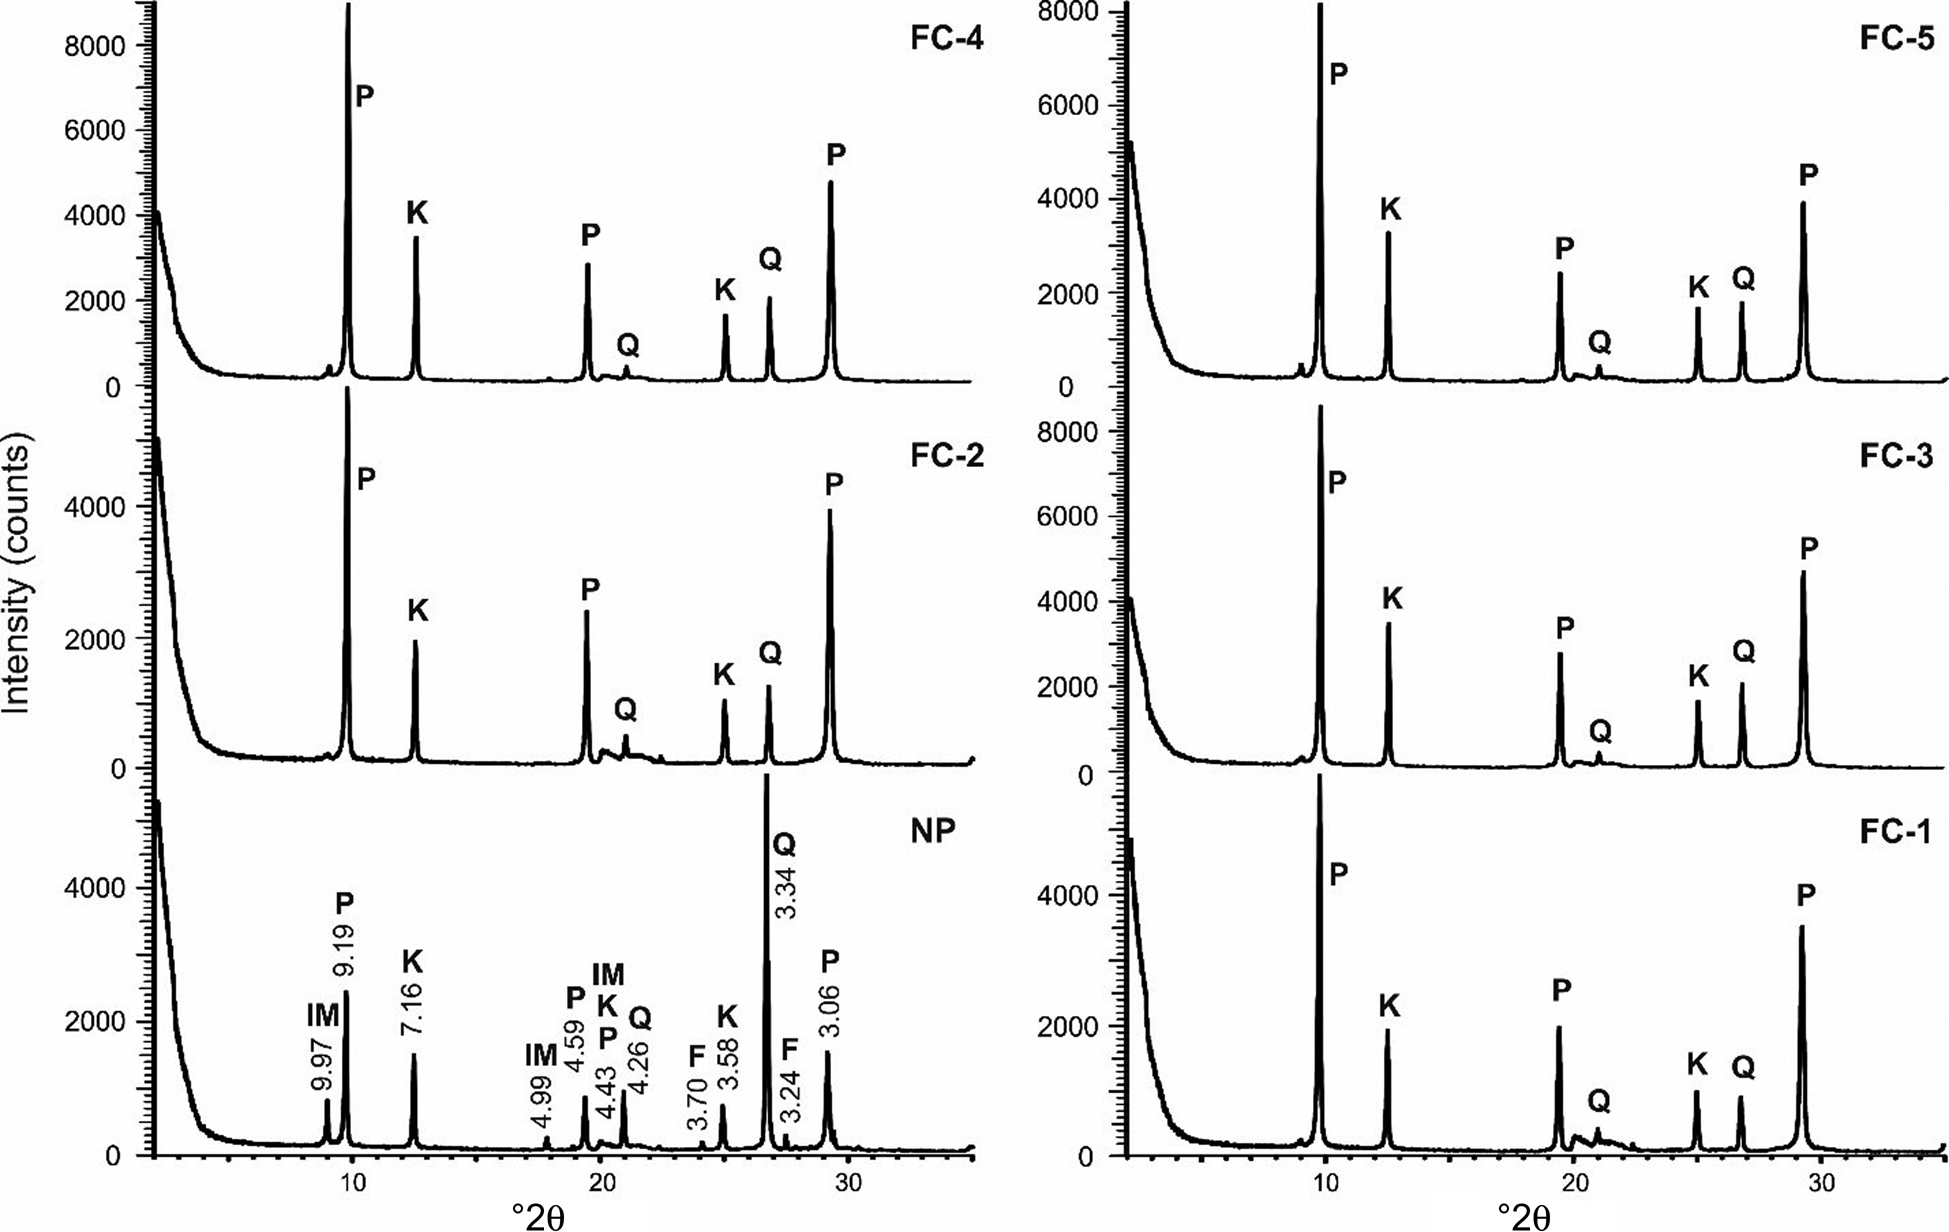
The XRD traces of the NP sample and the FC samples (FC-1 to FC-5) are shown in Fig. 10, and the mineral contents of the samples estimated using quantitative XRD analysis are given in Table 6. Mineral percentages have been presented in 5% intervals (97.5–102.5% in total). The differences between the NP and FC samples were detected using the most intense peaks for each mineral (pyrophyllite: 9.19, 4.59 and 3.06 Å; kaolinite: 7.16 and 3.58 Å; quartz: 3.34 Å; illite–mica: 9.97 Å; feldspar: 3.24 Å).
Comparison of the greatest-intensity peaks for minerals on the XRD traces of the Pütürge pyrophyllite samples. Final concentrates: FC-1: with 150 g t–1 kerosene plus MIBC; FC-2: with 150 g t–1 kerosene plus pine oil; FC-3: with 150 g t–1 pine oil; FC-4: with 200 g t–1 pine oil; FC-5: with 550 g t–1 kerosene plus MIBC. F = feldspar IM = illite–mica, K = kaolinite, P = pyrophyllite, Q = quartz.
Mineral percentages (wt.%) of the NP and FC pyrophyllite samples.

The pyrophyllite and kaolinite contents increased and the quartz, illite–mica and feldspar contents decreased in the FC samples compared to the NP sample (Fig. 10). Hence, flotation appears to be a successful separation method in the light of these XRD results (Table 6). All FC samples were enriched in pyrophyllite (from 40–45% in the NP sample to 60–80% in the FC samples; Table 6). The greatest increases in pyrophyllite percentages were in samples FC-2 (75–80%) and FC-1 (70–75%). The kaolinite content remained unaffected (20–25% in the NP sample and 15–30% in the FC samples). The kaolinite content decreased slightly in FC-2 and increased in FC-3, FC-4 and FC-5.
Regardless of the reagent used, the quartz, illite–mica and feldspar contents were reduced or disappeared in the flotation products. Quartz was reduced greatly (to <10%), feldspar disappeared and mica remained in trace amounts (<2%) in the FC samples (Table 6). Thus, the total abundances these three minerals (quartz, feldspar and illite–mica) decreased from 35–40% in the NP sample to <10% in the concentrated products (Table 6). In terms of quartz, the FC-1 concentrate that used 150 g t–1 kerosene plus MIBC reagent was more successful in terms of separation than the other tests (Table 6). The main result of flotation was the successful transformation of the pyrophyllite samples into an end product consisting almost exclusively of pyrophyllite and kaolinite.
The chemical compositions of the NP and FC samples are listed in Table 7. The Al2O3 content (22.89%) in the NP sample increased in the concentrated products (26.50–30.32%; Table 7) due to increasing pyrophyllite and kaolinite contents. There was no significant difference in the SiO2 contents between the NP and FC samples. The FC-1 concentrate with the smallest quartz content also had the smallest SiO2 content (Tables 6 & 7). The LOI content decreased in FC-1 and FC-2 and increased in FC-3 and FC-4 compared to the NP sample. This result indicates that the FC-1 and FC-2 concentrates are enriched in pyrophyllite.
Chemical composition (wt.%) of the NP and FC pyrophyllite samples.

Discussion
Although various methods such as flotation, magnetic separation, gravity and leaching are used in pyrophyllite beneficiation, flotation is the most commonly used method, mainly because layered silicate minerals can float with any type of collector, even just a frother. The separation of pyrophyllite from other gangue minerals by froth flotation is made easier because pyrophyllite is naturally hydrophobic, easy-sliming and transports easily into flotation concentrates (Zhao et al., Reference Zhao, Wang, Wang, Yan, Zhou, Xu and Wang2019a).
In this study, flotation tests were carried out on Pütürge pyrophyllite ore and successful separation results with slight differences were obtained using various reagents and their combinations. Improved results were obtained when oil collectors were used together with the frothers. In the flotation rougher circuit, the most successful results were obtained for concentrates with 150 g t–1 kerosene plus pine oil and 150 g t–1 kerosene plus MIBC. Rougher concentrates contained 66.69 wt.% SiO2 and 28.06 wt.% Al2O3 contents for kerosene plus MIBC and 64.26 wt.% SiO2 and 29.76 wt.% Al2O3 for kerosene plus pine oil. In addition, kerosene plus frother mixtures were effective for the separation of the concentrates obtained from the cleaning circuits.
To enhance bubble particle aggregates, oily collectors such as kerosene and diesel are often used at small dosages to increase the surface hydrophobicity of naturally hydrophobic minerals such as molybdenite, talc and coal (Cao et al., Reference Cao, Chen and Peng2020). However, the adsorption efficiency of oily collectors on mineral surfaces is relatively low as oily collectors are usually water-insoluble and show poor dispersion in aqueous solution. Previous work has demonstrated the role of surfactants in dispersing oily collectors in aqueous solution, which can be used to improve flotation recovery (Moxon et al., Reference Moxon, Keast-Jones and Aston1988, Zhou et al., Reference Zhou, Yan, Wang, Zhou and Liang2017, Cao et al., Reference Cao, Chen and Peng2020). On the other hand, kerosene-type reagents spread on the solid surface as a thin layer, facilitating the adhesion of the solid to the bubble. The mixture of such reagents with frothers improves the flotation of naturally floating minerals (Bulatovic, Reference Bulatovic2007; Atak, Reference Atak2017). In addition, variation in the bubble diameter was observed in both the rougher and cleaning circuits in the flotation experiments on Pütürge pyrophyllite ore. Although no obvious differences were observed, the bubble diameter increased slightly in the cleaning circuit. More research is needed to obtain more definitive results in this area.
The results of this study are compatible with previous flotation studies conducted on Pütürge pyrophyllite (Erdemoğlu & Sarıkaya, Reference Erdemoğlu and Sarıkaya1999; Erdem & Karaoğlu, Reference Erdem and Karaoğlu2005). In these studies, various frothers were examined in various amounts (50–200 g t–1). The most successful results (61.5 wt.% SiO2, 29.5 wt.% Al2O3 and 6.5 wt.% LOI) were obtained with 100 g t–1 MIBC (38–100 μm particle size, natural pH and 7–8 min flotation time; Erdem & Karaoğlu, Reference Erdem and Karaoğlu2005). Successful results have also been obtained in flotation studies using various collectors. Beneficiation using the flotation technique with dodecylamine as a collector reduced the quartz and coloured mineral contents and increased the brightness of the product (Das & Mohanty, Reference Das and Mohanty2009). Seo et al. (Reference Seo, Choi, Kim, Kim and Bae2020) investigated the efficiency of pyrophyllite beneficiation using ammonium ions as the activator in the presence of an anionic collector, and they reported that the floatability of pyrophyllite increased with increasing anionic collector concentration at a low sodium oleate concentration. The effect of cationic collectors in flotation separation of diaspores from kaolinite, pyrophyllite and illite has been investigated using flotation tests (Zhong et al., Reference Zhong, Liu, Xia, Lu, Hu, Zhao and Yu2008). The flotation results for artificially mixed minerals showed that >65% kaolinite, pyrophyllite and illite were recovered and >80% of the diaspore was depressed. To investigate a novel class of effective silicate mineral collectors, the Gemini quaternary ammonium salt surfactant and its corresponding conventional monomeric surfactant (dodecyl trimethyl ammonium bromide; DTAB) were used to compare the flotation behaviours of illite, pyrophyllite and kaolinite (Xia et al., Reference Xia, Zhong, Liu, Huang, Chang and Li2009). The three silicate minerals with the Gemini surfactant as a collector demonstrated far greater floatability than with corresponding traditional collectors (Xia et al., Reference Xia, Zhong, Liu, Huang, Chang and Li2009). These studies show that ionic collectors are effective at separating pyrophyllite from quartz, which is a gangue mineral. However, the selectivity decreases when the gangue minerals are clay minerals such as illite and kaolinite.
In contrast to previous studies on pyrophyllite beneficiation, this work used a raw material containing a relatively large amount of pyrophyllite. Previous flotation studies on Pütürge pyrophyllite have not provided data on mineral ratios. However, based on their Al2O3 contents, the pyrophyllite samples in these previous studies contained less pyrophyllite than the sample used in this study. Another difference is that this study was carried out on a much finer-grained material. Thus, flotation is also successful for very-fine-grained materials. Obtaining more successful results with MIBC and pine oil in pyrophyllite flotation is also related to the fine particle size of the pyrophyllite. As the optimum size determined for pyrophyllite flotation is finer than 0.1 mm, it follows that alcohol-type frothers would be more efficient in such experiments. Dowfroth 250 is a glycol-type frother and is often effective in the flotation of coarse ores, while MIBC and pine oil are alcohol-type frothers that are effective in the flotation of fine-sized ores (Khoshdast & Sam, Reference Khoshdast and Sam2011; Ngoroma et al., Reference Ngorama, Wiese and Franzidis2013).
Increasing the efficiency of pyrophyllite flotation is generally associated with increasing Al2O3 content. However, if kaolinite is present in addition to pyrophyllite, it is useful to check the mineralogical compositions of the beneficiation products. As the Pütürge pyrophyllite material used in this study contains 40–45% pyrophyllite and 20–25% kaolinite, the flotation results were checked mineralogically along with the chemical compositions. A significant trend holds between the Al2O3 contents of the studied samples and the pyrophyllite and kaolinite peak intensities on the XRD traces. The relative peak intensities of pyrophyllite and kaolinite were also comparable. The XRD RIRs of these two minerals can be considered similar, as they have similar chemical compositions, similar morphologies, their crystal systems are triclinic (space group P1) and their crystallographic parameters are comparable (a:b:c = 0.5761:1.0000:1.0439 or a = 5.160 Å, b = 8.993 Å, c = 9.360 Å for pyrophyllite and a:b:c = 0.5755:1.000:0.8253 for kaolinite; Wardle & Brindley, Reference Wardle and Brindley1972; Bish & Von Dreele, Reference Bish and Von Dreele1989; Bentayeb et al., 2003). On the other hand, the presence of kaolinite in pyrophyllite ores may be beneficial in terms of some usages of these ores. The flexural strength increases with the addition of kaolinite, especially in the production of ceramic composites (Jeong et al., Reference Jeong, Lee, Hong and Park2017). Therefore, pyrophyllite and kaolinite should be considered as useful minerals, and the remaining minerals should be considered as gangue minerals. Therefore, the total pyrophyllite plus kaolinite content (65%) in Pütürge ore increased to 90–95% after flotation, whereas gangue-mineral contents (quartz, feldspar and illite–mica) decreased from 35–40 wt.% to <10 wt.%.
Conclusions
The Pütürge pyrophyllite is currently used mainly in white-cement production. The NP sample contains moderate amounts of pyrophyllite (40–45 wt.%), kaolinite (20–25 wt.%) and quartz (20–25 wt.%) and minor amounts of illite–mica (10–15 wt.%) and feldspar (<5 wt.%). After beneficiation with flotation, pyrophyllite was enriched in the concentrated products. The pyrophyllite content in all FC samples was 60–80 wt.%. There was no significant change in kaolinite abundance. On the other hand, quartz, illite–mica and feldspar either decreased or disappeared. The total amount of pyrophyllite and kaolinite increased from ~65 wt.% in the NP sample to 90–95 wt.% in the concentrated products. The main factors controlling the Al2O3 content in the samples were pyrophyllite and kaolinite abundance. The SiO2 content was affected by of both these minerals and by the quartz percentage.
Acknowledgements
The authors thank the anonymous reviewers for their constructive comments which improved significantly the quality of the paper. The authors also thank the Principal Editor, George Christidis, for his editorial comments and suggestions.


 Open access