INTRODUCTION
Viral gastroenteritis is an important concern for public health and a major cost factor for society. Hospitals and nursing homes are affected in particular [Reference Friesema1, Reference Lopman2]. The epidemic potential of norovirus is striking [Reference Koopmans3, Reference Heijne4] and has been partly attributed to its high infectivity [Reference Teunis5]. There is no clinical treatment for norovirus disease, or a vaccine that protects against infection, although clinical trials are ongoing [Reference Atmar6]. Hygiene measures and quarantining of cases are therefore currently the only option for containing an outbreak [Reference Friesema1, Reference Heijne4]. Norovirus is transmitted via the faecal–oral route: primary foodborne or waterborne cases may shed virus into their environment. Virus deposited on surfaces can then cause outbreaks [Reference Becker7, Reference Evans8] and virus can be transferred by hand contact [Reference Boxman9] followed by ingestion [Reference Boone and Gerba10]. In order to better understand how much virus is deposited in the environment, we have studied virus shedding in infected subjects.
Data from human challenge studies have shown that there may be considerable heterogeneity in the numbers of viruses that are shed by infected subjects [Reference Atmar11, Reference Kirby12]. Generalization of the results from these studies to nosocomial outbreaks raises uncertainty because of small study sizes and the use of experimental infections, with a Norwalk virus (GI.I) or Snow Mountain virus (GII.2) inoculum in healthy volunteers [Reference Graham13].
The present studies extends these experimental findings with outbreak data, involving GII.4 norovirus, a common cause in recent outbreaks [Reference Koopmans3, Reference Verhoef14, Reference Matthews15]. Moreover, in contrast to these experimental studies, the time-course of virus shedding was analysed with a multilevel longitudinal model, incorporating individual variation and measurement error.
In a study of norovirus transmission during outbreaks in a hospital and nursing homes [Reference Sukhrie16, Reference Sukhrie17], enhanced tracking of cases provided data from patients with symptoms of acute norovirus infection as well as any known contacts. Data from respondents from this transmission study were used for the present study of faecal shedding.
MATERIALS AND METHODS
Data
Four distinct outbreaks of gastroenteritis caused by norovirus GII.4 were detected by prospective monitoring during the winters of 2009–2011, in a tertiary-care hospital and three nursing homes. Upon detection of outbreaks of two or more PCR-confirmed cases in the same ward, data were collected from as many patients and healthcare workers as possible, with or without symptoms of norovirus gastroenteritis [Reference Sukhrie17]. Faecal samples were collected from all subjects who gave consent and these were followed up weekly, until they tested negative for norovirus.
Virus concentrations were measured by quantitative (real-time) RT–PCR. Details about sample collection and preparation, and assay performance have been published [Reference Sukhrie18]. All Ct readings were done once, not in duplicate. To avoid inhibition on the target RNA, yeast tRNA was added that can react competitively with the RNase. For quality control a dilution series in yeast tRNA was included until 10−15.
Four NoV GII.4 outbreaks studied in the winters of 2009–2011 were selected for further analysis, yielding a total of 230 faecal samples in 102 (out of a total of 125) subjects. Of these, 47 were patients (32 with symptoms, 15 asymptomatic) and 54 healthcare workers (38 with symptoms, 16 asymptomatic). For one symptomatic case the patient/staff status was missing. There were also 23 subjects (six patients and 17 healthcare workers) with symptoms of gastroenteritis who did not consent to collection of samples. Details are shown in Table 1.
Statistics of the sampled outbreak populations: numbers of infected patients and staff sampled for norovirus shedding, by symptoms, and their ages (mean age in years and 95% range), and collected numbers of samples (no. of observations) per individual
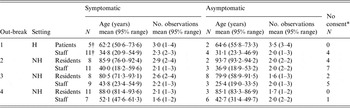
H, Hospital; NH, nursing home.
* Non-compliant, symptomatic subjects who were approached for inclusion but did not give consent.
† The total number of subjects add up to 124 and not 125. In outbreak 1 there was one symptomatic case for whom status (patient or staff) was missing.
Model for the time-course of virus shedding
A realistic model of the time-course of virus shedding must include an initial increase in virus concentration, followed by a decrease to undetectable levels. For virus produced at an infection site and transported by bowel movement, the observed virus concentration in faeces can be written as
 $$C(t\vert \alpha, \beta ) = C_0 {\rm e}^{ - \alpha t} (1 - {\rm e}^{ - (\beta - \alpha )t} )\quad (\beta \gt \alpha ).$$
At onset of shedding (t = 0) the virus concentration C(t) increases from 0 [with rate C 0(β−α) ], reaches a maximum and decreases to zero (with rate α). More details, as well as a tentative biological mechanism, are given in the Supplementary online Appendix, section A.
Assuming the parameters (C 0, α, β) vary among individual infected subjects, this model can be applied in a Bayesian hierarchical framework [Reference Teunis, Ogden and Strachan19]. This results in individual estimates of the time-course of virus shedding, with the variation among these individuals characterized by (joint) probability distributions of the parameters of the regression model [equation (1)]. All models were run in JAGS (v. 3·3·0) [Reference Plummer20] using rjags (v. 3–10) [Reference Plummer21] in R (v. 3·0·1) [22]. Due to censoring tests of model fit using the DIC cannot be used, but in the Supplementary online Appendix the reader can check that the model accurately fits the observed Ct data. Supplementary Figure A1b shows residuals for all observed Ct values in all subjects.
The onset of shedding [t = 0 in equation (1)] cannot be observed. For symptomatic subjects the onset of symptoms may be assumed to occur shortly after the onset of shedding [Reference Sukhrie17]. For asymptomatic subjects an estimate of the onset of shedding may be found that provides the best agreement of the observed virus titres with the time-course of equation (1). This has been achieved by expressing time of onset of shedding relative to the first faecal sample that was collected, and treating the delay between onset and first sample as a parameter that can be estimated. Technical details of this procedure are given in the online Appendix, section B. For the symptomatic subjects the estimates of shedding onset agreed well with the observed symptom onsets, as shown in the online appendix of [Reference Sukhrie17].
Calibration curve
To obtain a titration curve a standard suspension was made of RNA prepared as run-off transcript from cloned fragments (GII.4 Bristol region B, junction ORF I and II). The number of genome copies in an undiluted PCR sample of that suspension can be calculated from the RNA concentration measured by Nano Drop (ND-1000 Isogen Life Science, USA) as follows: an equivalent volume of 0·33 μl (2/15 × 2·5μl) of the RNA solution contains 2279 ng/μl RNA, with 1684 nucleotides (MW ≈ 1684 × 320 + 159 = 539·04 kDa). The concentration of genome copies in undiluted suspension is then
 $$2279 \times \displaystyle{{10^{ - 9}} \over {10^{ - 6}}} \times \displaystyle{{0\!\cdot\!33 \times 10^{ - 6}} \over {539\!\cdot\!04 \times 10^3}} \times N_{{\rm Av}} \approx 8\!\cdot\!487 \times 10^{11} {\rm genome}\;{\rm copies,}$$
where NAv is Avogadro's number (6·02 214 × 1023). Tenfold serial dilutions of this standard suspension were used for obtaining a calibration series of Ct values.
A calibration curve, obtained by linear regression, allows translation of observed Ct values in faecal samples into numbers of genome copies of NoV (GII.4). In the regression procedure, Ct values of 40 were considered censored (Ct ⩾ 40). Supplementary Figure A1c shows the regression curve with (95%) prediction intervals. A Monte Carlo sample of the estimated parameters of this regression model was used to translate Ct estimates into virus concentrations, incorporating measurement error due to translation.
RESULTS
Faecal samples containing norovirus were obtained from 71 symptomatic and 31 asymptomatic subjects. Numbers of patients/staff and their age ranges are given in Table 1.
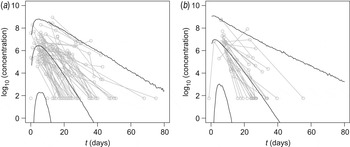
In Figure 1 observed virus concentrations are compared with predicted levels of virus shedding as a function of time, in symptomatic and asymptomatic subjects. Details of the longitudinal model and its biological basis, as well as details of the statistical framework, are given in the Supplementary online Appendix; fitted responses for all individuals may be obtained from the corresponding author as a separate document.
Time-course of virus shedding in (a) symptomatic and (b) asymptomatic subjects. Median and 95% interval of the predicted virus concentration (log10 numbers of viruses/g stool) are shown. Also shown are observed virus concentrations, as measured Ct values translated by means of the standard curve (Supplementary Fig. A1c). Multiple observations from the same subject are connected.

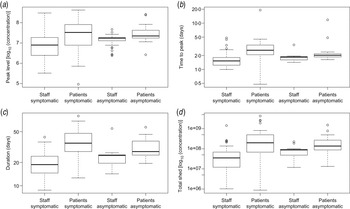
For ease of interpretation, instead of rates of increase and decrease, the time from onset of shedding to peak levels and the duration of shedding (time from onset of shedding to decline to Ct = 40, considered the diagnostic detection limit) can be calculated (Fig. 2b , c ). In addition, the peak levels of virus shed (Fig. 2a ) and the area under the shedding curve can be calculated (Fig. 2d ).
Characteristics of virus shedding for patients and staff: estimated means of (a) peak levels of shed virus (log10 number of viruses/g stool), (b) time from onset of shedding to peak in virus shedding (days), (c) total duration of the shedding period (days) and (d) the estimated area under the shedding curve (log10 numbers of viruses/g stool). Box plots [median, quartiles (box), 95% range (whiskers), and outliers (circles)] of means of Monte Carlo samples of (posterior) predicted values, for staff and patients, symptomatic and asymptomatic.

There is considerable variation, in the averages of peak concentration (105−109 genome copies/g faeces), time to peak (<0·5 to >5 days from onset of shedding), duration of shedding (8–60 days) and area under the shedding curve (106−1010 genome copies/g faeces).
There is an indication that patients, in particular when they have symptoms, may shed higher levels of norovirus, for somewhat longer periods (Fig. 2). However, it should be noted that Figure 2 shows the variation in individual means of predicted characteristics: when uncertainty is taken into account the differences are insignificant (P levels for a non-parametric test for differences in any of these parameters may be found in Supplementary Table A2).
The posterior distributions of these characteristics also do not indicate that symptomatic and asymptomatic subjects have different shedding characteristics. There is, however, considerable uncertainty, as illustrated in the individual estimates in Figure 3.
Characteristics of virus shedding vs. age of individuals: estimated individual (a) peak levels of shed virus (log10 numbers of viruses/g stool), (b) time from onset of shedding to peak in virus shedding (days), (c) total duration of the shedding period (days) and (d) area under the shedding curve (log10 numbers of viruses/g stool). Monte Carlo sample of (posterior) values with mean and uncertainty (95% credible intervals), for symptomatic (black) and asymptomatic (grey) subjects.
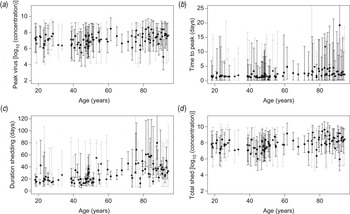
In Figure 3 individual estimates are grouped by age, illustrating that none of the four characteristics of the time-course of shedding (peak levels, time to peak, duration of shedding and area under the shedding curve) appears to depend on age of the infected subjects (Fig. 3).
Estimated time to peak and durations of shedding show positive correlation (Pearson correlation coefficients of 0·873 and 0·973 for symptomatic and asymptomatic subjects, respectively), as do peak levels and area under the shedding curve (correlation coefficient 0·960). For additional details see Supplementary Table A1.
DISCUSSION
Norovirus is transmitted via the faecal–oral route: its high infectivity and persistence in the environment allow the virus to exploit various pathways. Norovirus present on fomites is considered to be important for transmission [Reference Boone and Gerba10]. Such virus can be deposited by infected subjects, via contaminated hands [Reference Boxman9]. As a potential driver for the numbers of viruses that are deposited by infected subjects, the concentration of virus shed in faeces is of interest. Two studies of virus shed by volunteers challenged with Norwalk virus (GI.I) showed considerable variation in the numbers of viruses in stools of infected subjects [Reference Atmar11, Reference Kirby12]. Another study of nosocomial norovirus infection in aged-care facilities showed a range of concentrations and durations of shedding [Reference Aoki23].
The present study comprises a larger number of subjects than previous studies, including some with asymptomatic infections, sampled in the course of a study on nosocomial transmission of norovirus in The Netherlands [Reference Sukhrie17]. In addition, the data were analysed with a longitudinal model, accounting for individual variation in response parameters, as well as measurement error in the quantitative PCR assay. Using these enhanced analysis methods, patterns and quantities of shedding in infected symptomatic and asymptomatic subjects are markedly similar. The variation in peak levels in individual subjects is large, with the minimum as low as a few hundreds of virus genomes/g, and the maximum (95th percentile of the predicted concentration) >1010 virus genomes/g faeces. The peak shedding levels are in the same range as those reported by [Reference Aoki23], and slightly lower than those reported by [Reference Atmar11]. It remains unknown whether the difference may be attributed to the different genotype (GI.I) used in the latter study.
The rates of increase and, more importantly, decrease of virus shedding are also variable, but to a lesser extent. In infected subjects shedding had dropped to low levels (<103 viruses/g) by day 60 post-infection. As symptoms usually do not last longer than 2 weeks the contribution of such long-lasting shedding to transmission may remain small [Reference Sukhrie17].
In a study in hospitalized patients more serious symptoms (longer duration) were associated with higher virus concentrations [Reference Lee24]. In the study reported here such an association was not apparent, in fact, symptomatic subjects seem to shed norovirus in similar numbers as asymptomatic subjects (Fig. 3a , d ), while both categories show considerable variation (mean peak levels of virus/g stool vary over a range of ~4 log10 units).
One may be tempted to interpret the numbers of viruses shed as an indicator for the intensity of infection, with higher numbers corresponding to more infected cells in the intestinal mucosa. If that is true, the variation in numbers shed may not have great clinical significance because shedding appears equally intense in symptomatic and asymptomatic infections. Patients, either symptomatic or asymptomatic, seem to shed higher levels of norovirus than staff, for a longer period. However, the difference is small and insignificant against the large variability in responses (Supplementary Table A2).
Also of note is that a transmission study in the same cohort has shown that symptomatic cases (staff and even more so patients) are more likely to transmit the virus than asymptomatic shedders [Reference Sukhrie17]. As asymptomatic shedders appear to produce equal numbers of viruses as symptomatic cases, this difference in transmission must be attributed to enhanced environmental seeding of the virus, associated with vomiting and diarrhoea. Increased environmental seeding of symptomatic cases may be associated with their producing greater amounts of faeces than asymptomatically infected subjects, and/or a higher frequency of defecation, or diarrhoea may result in a higher probability of contamination. It is important to note that the present study does not capture any shedding of norovirus in vomit. Vomiting has also been documented as a means of depositing norovirus in the environment [Reference Marks25] and norovirus has been detected in the oral cavities of infected subjects [Reference Kirby26]. If faecal shedding indicates virus replication in the intestinal tract, it must be assumed that virus is then shed orally as well.
It is likely that only a fraction of the shed virus genomes is in infectious virus particles, as has been observed for other viruses [Reference Blacklow27–Reference de Roda Husman29]. Assuming that the fraction of infectious virus does not depend on the level of shedding (the peak concentration, or area under the curve), the large variation in peak concentration and/or area under the shedding curve may imply that different infected subjects may shed very different numbers of infectious noroviruses into their environment, and consequently they may have considerably different infectiousness to their contacts.
The present study is part of a greater project aimed at quantifying nosocomial transmission of norovirus in hospital and care facilities. It will be interesting to use the individual shedding patterns as a proxy for the infectiousness of each subject, allowing adjustment of the contribution of any individual to transmission according to the numbers of viruses they shed at any time following infection [Reference Heijne4, Reference Heijne30, Reference Sukhrie17]. Such an individual-based approach may considerably improve the faithfulness of tracking of infections during an outbreak [Reference Teunis31]. Direct use of the estimated virus concentrations to predict risk of transmission from individual infectious subjects seems attractive. It must, however, be realized that at present little is known quantitatively about the role of human behaviour both in spreading shed virus in the environment and in picking up that virus from contaminated fomites.
CONCLUSIONS
During norovirus infection, high numbers of virus are shed in faeces. Numbers of viruses in faeces increase rapidly, reaching peak levels within a few days following onset of infection, followed by a slow decline for several weeks. It may take more than 2 months until faecal concentrations of virus reach undetectable levels. Both peak levels and duration of shedding show considerable individual variation that is not different between symptomatic and asymptomatic infections.
SUPPLEMENTARY MATERIAL
For supplementary material accompanying this paper visit http://dx.doi.org/10.1017/S095026881400274X.
ACKNOWLEDGEMENTS
This work was supported by ZonMw, The Netherlands Organisation for Health Research and Development (grant no. 125010002).
DECLARATION OF INTEREST
None.