

Introduction
Globally, the pessimistic approach to addressing the negative aspects of healthcare services management is becoming a systemic problem (Chan, Reference Chan2018; Department for Health and Ageing, 2017; Patmas, Reference Patmas2010). As a result of the constant focus on poor or mismanaged services, management practices remain inefficient and organizational learning and innovation are in decline (Dadich et al., Reference Dadich, Fulop, Ditton, Campbell, Curry, Eljiz and Karimi2015). The application of the positive organizational scholarship (POS) system to this situation suggests that a preoccupation with negativity arises as people develop strategies to overcome or adapt to failures (Barkow, Cosmides, & Tooby, Reference Barkow, Cosmides and Tooby1995). This implies that studying the ways that people explain, manage, and resolve challenges might also lead to positive insights (Cameron & Caza, Reference Cameron and Caza2004). POS is recognized as successful within the healthcare setting (Dadich, Collier, Hodgins, & Crawford, Reference Dadich, Collier, Hodgins and Crawford2018), and this study attempts to bring POS into the realm of health services. POS is defined as ‘the study of that which is positive, flourishing and lifegiving in [healthcare] organizations’ (Cameron & Caza, Reference Cameron and Caza2004: 731). Positive organizational scholarship in healthcare (POSH) purposefully situates POS in the complex and uncertain context of healthcare, offering ‘principles of reasoning by which valid knowledge is obtained’ (O'Leary, Reference O'Leary2007: 162). It is ‘concerned primarily with the study of especially positive outcomes, processes, and attributes of [healthcare] organizations and their members’ (Cameron, Dutton, & Quinn, Reference Cameron, Dutton and Quinn2003: 3). POSH involves measuring, describing, and documenting uncommonly positive human experiences in the healthcare context. Thus, it contributes to verifying the body of knowledge about positive conditions in [healthcare] organizations (Cameron & Caza, Reference Cameron and Caza2004).
Worldwide, it is perceived that home care staff carry out work that is not in line with established regulations: personal do not receive adequate training, they are not respected, and they have few opportunities for career advancement (Smythe, Jenkins, Galant-Miecznikowska, Bentham, & Oyebode, Reference Smythe, Jenkins, Galant-Miecznikowska, Bentham and Oyebode2017). Nurses in this sector often lack the necessary education to do their jobs, leading to negative outcomes such as high turnover and burnout (Edvardsson, Sandman, Nay, & Karlsson, Reference Edvardsson, Sandman, Nay and Karlsson2009). Since inadequate training appears to be a theme in this sector, our objective is to explore how organizational training might help individuals and organizations function more effectively and even flourish. There have been few other attempts to investigate, from the POSH perspective, the positive phenomena of employee perception of training in this particular setting, that is, with the nursing staff. First, this research proposes a theoretical basis for managing employee perception of training to transform it into positive organizational outcomes. Second, through the lens of POSH, this study explores the mediating role of workplace stress in the relationship between employee perception of training, turnover intention, and job performance. To examine these relationships, we chose employees in an established elderly-care service within the healthcare industry as our sample. We chose this particular sample because of its relevance to related studies and because of increasing concerns about turnover rates, unqualified staff, and stressful work conditions in the industry (Chan, Reference Chan2018; Madden, Mathias, & Madden, Reference Madden, Mathias and Madden2015; Tillott, Walsh, & Moxham, Reference Tillott, Walsh and Moxham2013).
The study contributes to the literature in two ways. First, it contributes to the body of knowledge on POSH by exploring how employee perception of training can strengthen organizations and create positive outcomes. Employee turnover is expensive (Berry, Lelchook, & Clark, Reference Berry, Lelchook and Clark2012), and employee performance is one of the important factors in organizational effectiveness (Kahya, Reference Kahya2009). Thus, many previous studies have investigated the role of training in facilitating positive organizational outcomes (Tharenou, Saks, & Moore, Reference Tharenou, Saks and Moore2007). Our study specifically focused on employee perception of training and organizational outcomes from the POSH perspective. Second, although there have been more positively focused studies recently, empirical research has not yet been conducted to evaluate workplace stress and the perceptions and results of training from the POSH perspective. This study addresses this gap in the literature by exploring ways to reduce workplace stress and turnover intentions and improve job performance through training. This study recognizes the vulnerability of healthcare workers in terms of workplace stress, and it focuses on how to mitigate challenges in this setting to cultivate strengths and incorporate more positivity. It also extends existing research on the benefits of employee perception of training and provides new theoretical insight into how workplace stress can be reduced to increase job performance and decrease turnover intentions among elderly-care workers.
The study uses the Job Demand-Resource (J-DR) model as a theoretical framework (Karasek, Reference Karasek1979) to explain how a proper balance between workplace demands and resources allows healthcare personnel to structure more fulfilling environments and become more positively engaged. To better understand the relationships between training and workplace stress, we study the mediating role of work-related stress in the links between employee perception of training, job performance, and turnover intentions. A key premise of the study is that when employees have high levels of access to work resources (adequate training), it reduces the negative work behavior consequences of increasing job demands.
This paper is structured as follows. First, we evaluate POS in healthcare contexts and the conceptual basis of organizational training, including its positive outcomes and effects on stress. Then, we describe our model and methodology. Finally, we present the empirical results and main contributions of the study and discuss managerial implications.
Literature Review
Positive organizational scholarship in healthcare
POS is ‘concerned primarily with the study of especially positive outcomes, processes, and attributes of organizations and their members’ (Cameron, Dutton, & Quinn, Reference Cameron, Dutton and Quinn2003: 4). Applied to the health care context, the major objectives of POSH are to describe, understand, and eventually improve health service management as it interweaves inquiry with engagement. POSH is described as an emerging movement that motivates researchers to understand human excellence in health services.
The underlying premise of POSH is that healthcare organizations will be more successful in achieving their goals if they comprehend the motivations behind positive behavior in the workplace (Donaldson & Ko, Reference Donaldson and Ko2010). POSH attaches importance not only to minimizing negative situations but also to merging positive and negative situations. It includes methods for explaining, managing, and changing problematic and demanding situations to bring positive aspects to light (Cameron & Caza, Reference Cameron and Caza2004).
Job demands and positive resources are essential components of POSH (Cameron & Dutton, Reference Cameron and Dutton2003). Bakker and Demerouti (Reference Bakker and Demerouti2007), who developed the model of job demands-resources (JD-R), distinguished job demands and resources into two distinct categories. They defined job demands as ‘physical, psychological, social, or organizational aspects of the job’ (p. 312) that demand continuing attention to physical and mental capacities, and they defined job resources as ‘physical, psychological, social, or organizational aspects of the job’ (p. 312) that are used as practical resources in ‘achieving work goals; reducing job demands and the associated physiological and psychological cost’ (p. 312) and advance the subjective growth of employees. Recently, several studies have applied the JD-R model in healthcare services, inspiring further investigation of human resources practices and effects (Ravenswood, Douglas, & Haar, Reference Ravenswood, Douglas and Haar2017; Vander Elst et al., Reference Vander Elst, Cavents, Daneels, Johannik, Baillien, Van den Broeck and Godderis2016).
Healthcare workers serving elderly populations have strenuous duties associated with the long periods of caring for their patients. Caring for patients with dementia or intense physical rehabilitation needs over time can be mentally, emotionally, and physically demanding. Vander Elst et al. (Reference Vander Elst, Cavents, Daneels, Johannik, Baillien, Van den Broeck and Godderis2016) observed that employees can be negatively affected by job demands such as the amount and the emotionally demanding nature of the work, and excessive job demands can lead to fatigue, burnout, and negative behaviors (e.g., turnover intentions, low performance). In contrast, employees are positively affected by job resources such as task autonomy, supportive social networks, and learning opportunities. Among healthcare workers for the elderly, job resources can enhance employee motivation and work engagement and reduce stress levels. In this study, we aim to address a gap in the literature by highlighting the POSH approach for healthcare workers who serve elderly populations. We aim to show that proper job resources, such as different kinds of training, are essential to help them balance their job demands and achieve positive employee outcomes.
Organizational training
Because of constant change, uncertainty, and complexity in their current environment, management and employees understand that their capacity to meet future demands may be inadequate (Sahinidis & Bouris, Reference Sahinidis and Bouris2008). To enhance current levels of performance and to be able to innovate successfully to adapt to the changing environment, an organization's workforce must have up-to-date knowledge and related skills (Tharenou, Saks, & Moore, Reference Tharenou, Saks and Moore2007). Thus, for an organization to maintain competitiveness, it must strive for constant improvement and offer training to its workforce (Salas, Cannon-Bowers, Rhodenizer, & Bowers, Reference Salas, Cannon-Bowers, Rhodenizer and Bowers1999). According to Lee (Reference Lee2015), organizations that are successful invest more in development and training than other organizations.
Training is the organized cultivation of attitudes, knowledge, and skills in employees to help them perform tasks and responsibilities that are essential to their jobs (Latham, Reference Latham1988). Employee training and development is one of the most important investments companies can make to remain competitive in the marketplace. Some organizations are realizing that employee training is increasingly important as a competitive tool (Silva & Dias, Reference Silva and Dias2016). Other organizations, however, continue to underestimate the value of training and instead focus on training's direct costs (associated with providing training) and indirect costs (associated with a loss of productivity and wage costs, since employees cannot work when in training) (Balkin & Richebé, Reference Balkin and Richebé2007). Therefore, it is no surprise that this practice is still in the developmental stages in a significant number of organizations.
Various types of training may have different results in healthcare settings. Many authors have underlined the importance of diverse learning opportunities for employees, which in turn enable organizations to benefit from a range of learning outcomes (Watkins & Marsick, Reference Watkins and Marsick1993; Raelin, Reference Raelin2000). Categories have been formed to help with the conceptualization and planning of different kinds of training, including formal/informal. Trainings can also take place on an individual basis (e.g., through observations or job assignments) or in groups (e.g., coaching and team gatherings). Rosen et al. (Reference Rosen, Salas, Wilson, King, Salisbury, Augenstein and Birnbach2008) and Weaver, Dy, and Rosen (Reference Weaver, Dy and Rosen2014) found that simulation-based training appears promising for teaching teamwork skills and for boosting safe and effective healthcare practices. Several authorities and agencies have recommended that the training types correspond with the needs of the specific working groups (Beech & Leather, Reference Beech and Leather2006). The Royal College of Nursing (RCN) (Royal College of Nursing, 1998: 9) recommended that employers offer ‘appropriate training and education for their staff … commensurate with the degree of risk they face.’ However, this research focused on employee perception of training from the human resource management (HRM) perspective rather than measuring perceptions of employees involved in various types of training and how these perceptions affect organizational outcomes.
Moreover, recent studies have found that HRM practices such as training represent important positive job resources for employees (Bakker & Demerouti, Reference Bakker and Demerouti2018). Demerouti, Bakker, and Gevers (Reference Demerouti, Bakker and Gevers2015) suggested that increasing job resources (i.e., opportunities for personal growth, learning, and development) encourage positive psychology and behavior in the workplace and reduce job dissatisfaction and the burnout that results from excessive work demands. These effects are understandable since job resources can enable an organization with a large number of skilled employees to be a thriving work environment in which employee performance is maximized and turnover intentions are minimized (Spreitzer, Sutcliffe, Dutton, Sonenshein, & Grant, Reference Spreitzer, Sutcliffe, Dutton, Sonenshein and Grant2005). When employees become more positively engaged with their jobs, their intentions to leave decrease.
In this study, organizational training is conceptualized as a multi-dimensional structure that includes the following principles: (1) Supervisor support for training encourages employees to participate in training activities (Noe & Wilk, Reference Noe and Wilk1993). (2) Motivation for training is related to employees' perceptions of training and their levels of participation in different kinds of training activities in organizations (Mathieu, Tannenbaum, & Salas, Reference Mathieu, Tannenbaum and Salas1992). (3) Training can provide employees with the feeling that they have access to learning and growth opportunities (Newman, Thanacoody, & Hui, Reference Newman, Thanacoody and Hui2011). (4) Benefits from trainings demonstrate how employees who participated in trainings perceived these trainings (Bartlett, Reference Bartlett2001).
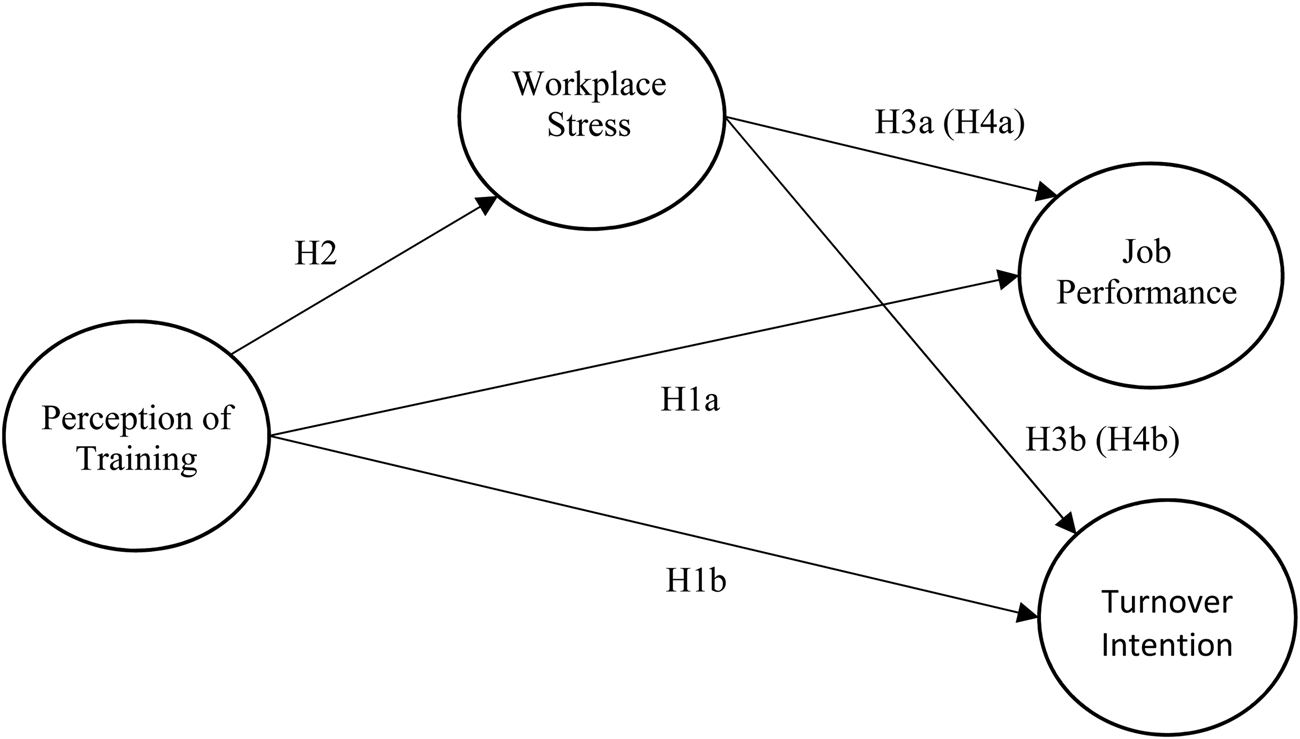
Past research has explored several relationships between training and its results, examining how training affects variables such as job performance and turnover intention (Tharenou, Saks, & Moore, Reference Tharenou, Saks and Moore2007). Studies conducted to date have supported the theory that training relates to both job performance and turnover intentions (Ashar, Ghafoor, Munir, & Hafeez, Reference Ashar, Ghafoor, Munir and Hafeez2013). However, the mechanism through which HRM practices influence positive outcomes requires further research, and viewing these relationships through the wider lens of POSH is also required (Innocenti, Pilati, & Peluso, Reference Innocenti, Pilati and Peluso2011; Stahl, Tung, Kostova, & Zellmer-Bruhn, Reference Stahl, Tung, Kostova and Zellmer-Bruhn2016). This study explores a new way to evaluate the positive outcomes of training in healthcare services by examining the relationship between job performance, turnover intention, and workplace stress in healthcare workers for the elderly, as shown in Figure 1.
The hypothetical model of the study
Organizational training and positive outcomes
This study understands training ‘as the planned intervention that is designed to enhance the determinants of individual job performance’ (Chiaburu & Tekleab, Reference Chiaburu and Tekleab2005: 29). Human capital is considered an essential factor in organizational performance (Nelson & Phelps, Reference Nelson and Phelps1966), and Becker's (Reference Becker1964) model suggested that employee productivity is increased by investing in human capital. In addition, Nelson and Phelps (Reference Nelson and Phelps1966) emphasized that the capability to innovate or to adapt to new technology can be improved by investing in human capital, but at the same time, employers fear losing well-trained employees to competitors, which would waste these considerable investments (Ismail, Reference Ismail2016). In response, human resource administrators and other experts have pointed out the need to develop more cost-effective models for training. In this context, the study of the relationship between training and organizational outcomes can be considered a pivotal research area.
According to perceived organizational support theory (Eisenberger, Armeli, Rexwinkel, Lynch, & Rhodes, Reference Eisenberger, Armeli, Rexwinkel, Lynch and Rhoades2001), employees have general opinions ‘concerning the extent to which the organization values their contributions and cares about their well-being.’ Wayne, Shore, and Liden (Reference Wayne, Shore and Liden1997) argued that employees' perceptions of organizational support can be increased when organizations offer job training, as employees tend to perceive training as an act of beneficence on behalf of their employer. The POS movement has argued that healthcare workers experience more agreeable feelings toward employers who invest in their workforce and that these investments strengthen the connection between employees and employers (Farr-Wharton & Shearman, Reference Farr-Wharton and Shearman2017). The strengthened connection, in turn, may increase positive employee outcomes such as commitment, performance, and satisfaction based on a sense of reciprocal obligation to the organization (Eisenberger, Armeli, Rexwinkel, Lynch, & Rhoades, Reference Eisenberger, Armeli, Rexwinkel, Lynch and Rhoades2001; Madden, Mathias, & Madden, Reference Madden, Mathias and Madden2015). Against the backdrop of these studies, we propose the following hypothesis:
Hypothesis 1a
There is a positive relationship between employee perception of training and job performance.
Since Becker's (Reference Becker1962) inspirational work, researchers have paid more attention to the relationship between training and turnover. To explain the relationship, they have offered several arguments that incorporate ideas about human capital, management of human resources, and social reciprocity (Applebaum, Reference Applebaum2000; Acemoglu & Pischke, Reference Acemoglu and Pischke1999; Huselid, Reference Huselid1995). Batt (Reference Batt2002) found that ‘high involvement’ practices such as training are connected to decreased employee turnover and increased productivity. Another previous study found that an increase in high-performance work practices translates into a decrease in turnover (Huselid, Jackson, & Schuler, Reference Huselid, Jackson and Schuler1997). Turnover intentions are employee inclinations toward willful poor performance and intentions to quit a job (Applebaum, Reference Applebaum2000). As the gap between the necessary and existing skills for achieving a task becomes larger, job satisfaction decreases and employee turnover increases in an organization (Truitt, Reference Truitt2011). As Lynch (Reference Lynch1991) observed, workers who are not trained change jobs more frequently. Empirical data from numerous studies have shown that increasing job resources through training investments decreases employee turnover intentions (Schaufeli & Bakker, Reference Schaufeli and Bakker2004). Thus, actual data have clarified that training and employee turnover intentions are negatively correlated in many organizations (Hequet, Reference Hequet1993). Within the framework of these studies, we propose the following hypothesis:
Hypothesis 1b
There is a negative relationship between employee perception of training and turnover intentions.
The mediating role of workplace stress
Although there is no global agreement on the definition of stress, it is often viewed as changing circumstances that cause people to face pressures or demands that interfere with their having, being, or doing what they desire (Schuler, Reference Schuler1980) and for which results are perceived as having high stakes (Xie, Wang, & Chen, Reference Xie, Wang and Chen2011). Job stress occurs when employees are not provided with adequate training or resources to do their jobs. It depends on the person–environment fit, and both individual and workplace factors tend to be involved (Jamal, Reference Jamal1990).
The Job Demands-Control (JD-C) model of occupational theory (Karasek, Baker, Marxer, Ahlbom, & Theorell, Reference Karasek, Baker, Marxer, Ahlbom and Theorell1981) is based on an interactive consideration of workers and their employment environments. The model describes two phenomenological dimensions that affect workers: demand (i.e., workload and time pressure) and control (i.e., skills discretion, the capacity to use specific job skills, and decision authority). According to Karasek (Reference Karasek1979), individuals in occupations that are high in job demands and low in control experience high levels of stress. Jobs that are high in the demand dimension and low in the control dimension are considered ‘high-strain jobs’ (Karasek & Theorell, Reference Karasek and Theorell1990), and a lack of training or experience can exacerbate low control (Häusser, Mojzisch, Niesel, & Schulz-Hardt, Reference Häusser, Mojzisch, Niesel and Schulz-Hardt2010; Verhofstadt, Baillien, Verhaest, & De Witte, Reference Verhofstadt, Baillien, Verhaest and De Witte2017). In elderly-care services, it is given that workers experience high levels of demand, but without adequate training or skills, workers may experience even more stress from a reduced sense of control.
Karantzas, Mellor, McCabe, Davison, Beaton, and Mrkic (Reference Karantzas, Mellor, McCabe, Davison, Beaton and Mrkic2012) mentioned that workplace stress is especially pronounced in the elderly-care context. One of the main stressors that has been identified in this line of work is workload (Sparks & Cooper, Reference Sparks and Cooper1999). Multiple studies report an alarming trend in healthcare settings: rapidly expanding workloads have increased the demands placed on workers (Dollard, LaMontagne, Caulfield, Blewett, & Shaw, Reference Dollard, LaMontagne, Caulfield, Blewett and Shaw2007; Ravenswood, Douglas, & Haar, Reference Ravenswood, Douglas and Haar2017). This trend could be related to insufficient job resources (i.e., lack of training) or organizational misconceptions about the lowest acceptable qualifications for personal care assistants. In other words, a mismatch between demands and resource allocation can elevate stress levels as underqualified or unprepared workers attempt to provide efficient, high-quality healthcare services (Lliffe, Reference Lliffe2004). To date, no studies have used the POSH approach to explore the relationship between employee perception of training and workplace stress in elderly-care settings. Through the lens of POSH, one could say that focusing on negativity is an evolutionary perspective (Colarelli, Reference Colarelli1998) originating from the idea that humans adaptively learn from failures to reorient themselves toward positive human functioning (Cameron, Reference Cameron2012; Cameron & Dutton, Reference Cameron and Dutton2003). Thus, we propose the following hypothesis:
Hypothesis 2
There is a negative relation between employee perception of training and workplace stress.
Stress is associated with several workplace outcomes that are caused by disruptions in worker functioning. The connection between workplace stress and job performance has been explored by several researchers. According to Wu (Reference Wu2011), job performance depends on prior experience and qualifications and on the current quality of individual (and team) work. Job performance has also been explained as the extent to which individuals can make optimal use of available resources to perform tasks assigned to them (Jamal, Reference Jamal1984). Previous literature has described four types of measurable relationships between job stress and job performance: a curvilinear/u-shaped relationship, a positive linear relationship, a negative linear relationship, and no relationship (Jamal, Reference Jamal1985, Reference Jamal2007).
Scholars who perceive job stress as dysfunctional for an organization and its employees perceive the relationship between performance and job stress as negative and linear (Tourigny, Baba, & Lituchy, Reference Tourigny, Baba and Lituchy2016). When individuals are stressed, they take time out from their jobs to deploy coping mechanisms, or they may engage in counterproductive activities such as dawdling or even self-sabotage, all of which detract from their performance (Jamal, Reference Jamal2016; Sullivan & Bhagat, Reference Sullivan and Bhagat1992). Thus, previous studies have found that excessive job stress causes poor job performance (Jamal, Reference Jamal2016), suggesting that workplace stress is a crucial determinant of job performance. Thus, we derive the following hypothesis:
Hypothesis 3a
There is a negative relation between workplace stress and job performance.
Job stress can disrupt employees' daily work schedules, leading to exhaustion, burnout, and increased turnover intentions (Javed, Balouch, & Hassan, Reference Javed, Balouch and Hassan2014). Work stress has, in fact, become a leading cause of the loss of employees from organizations (Zhang & Lee, Reference Zhang and Lee2010). Employee turnover intention has always been a serious challenge for managers (Lin, Chiang, & Chen, Reference Lin, Chiang and Chen2011), and it is currently one of the most pressing problems in organizations. A recent study clarified that high pressure on the job can significantly increase turnover intentions (Chao, Ku, Wang, & Lin, Reference Chao, Ku, Wang and Lin2016). The following hypothesis is in response to these findings:
Hypothesis 3b
There is a positive relationship between workplace stress and turnover intentions.
Merging these arguments, we presume that a relationship between employee perception of training, job performance, and turnover intention exists and that this relationship could be mediated by workplace stress. With regard to the relationship between employee perception of training and job stress, the stress experienced by care workers for the elderly is partly attributed to the work itself. High job demands arise from caring for long-term patients, some of whom have dementia or are undergoing intense physical rehabilitation. This can lead to significant levels of job stress over time (VonDras, Flittner, Malcore, & Pouliot, Reference VonDras, Flittner, Malcore and Pouliot2009). Hockey's (Reference Hockey1997) compensatory regulatory-control model, which illustrates the behavioral patterns of employees who try to pursue performance and balance demands simultaneously, may help clarify this relationship (Schaufeli, Bakker, & Van Rhenen, Reference Schaufeli, Bakker and Van Rhenen2009). To preserve performance in the face of intensifying job demands, a greater offsetting attempt is needed. If the demands continue to rise, then regulatory difficulties ultimately arise. The depletion of employees' energy causes physiological and psychological damage and increases stress in the workplace (Dollard, Tuckey, & Dormann, Reference Dollard, Tuckey and Dormann2012).
However, according to the JD-R model, if job resources are adequate such that employees are able to cope with demands, the damage may be ameliorated. Employees can then redirect the energy that was mobilized to defend against high demand and apply it to more constructive (rather than defensive) actions. In other words, the harmful effects of demands can be reduced on the condition that sufficient resources are provided to employees (Bakker & Demerouti, Reference Bakker and Demerouti2007). The mutual balance between demands and resources (e.g., Bakker, Demerouti, & Euwema, Reference Bakker, Demerouti and Euwema2005; Xanthopoulou, Bakker, Demerouti, & Schaufeli, Reference Xanthopoulou, Bakker, Demerouti and Schaufeli2007), which is the concern of this study, can be seen in this process. This means that organizations that support and motivate their care workers with adequate training options may be more likely to reduce workplace stress. At the same time, organizations can transform negative turnover intentions into positive outcomes through the judicious application of the POS approach.
The relationships between employee perception of training, workplace stress, job performance, and turnover intention are described by the following hypotheses:
Hypothesis 4a
Stress mediates the relationship between employee perception of training and job performance.
Hypothesis 4b
Stress mediates the relationship between employee perception of training and turnover intention.
Method
Participants
There have been complaints that healthcare workers for the elderly often do not have the necessary education or training to do their jobs (Somerville, Reference Somerville2006). Thus, we chose to study this particular population. Our study participants comprised 317 employees from 12 care homes for the elderly in Northern Cyprus. These care homes employed nearly 580 care workers in Northern Cyprus, and our participants were selected randomly from this group. Of the elderly-care homes, eight belonged to the private sector and four were public. Researchers distributed questionnaires to the care workers, and 328 questionnaires were completed (a 56% response rate). However, when the returned questionnaires were examined, 11 were found to be invalid. Therefore, in total, 317 valid responses were used in this research. The sample consisted of 35 male and 282 female care workers, ranging in age from 20 to 60 years. Our sample was representative of the high level of feminization of the elderly-care workforce in Northern Cyprus (Güven Lisaniler, Reference Güven Lisaniler2010). Most participants were between 31 and 50 years old (32.1%) and had tenures of approximately 1–2 years.
Measures
All questions were scored on a 5-point Likert scale, with answers ranging from completely disagree (1) to completely agree (5). Thus, high total scores showed a high level of agreement with the items.
Training perception
Training perception was measured with a scale adapted from three different studies: Bartlett (Reference Bartlett2001), Noe and Wilk (Reference Noe and Wilk1993), and Noe and Schmitt (Reference Noe and Schmitt1986). The questionnaire, which was originally written in English, was translated into Turkish based on Brislin, Lonner, and Thorndike (Reference Brislin, Lonner and Thorndike1973). The translation model had five parts: forward and backward translations (parts one and two); separate assessments of the forward and backward translations (parts three and four); and finally experts' discussion (part five). The scale that was used for measuring training perceptions assessed four aspects of training: motivation for training, accessibility of training, benefits from training, and support during training. The six items used for the motivation-for-training scale and the four items used for the benefits-from-training scale were adapted from Noe and Wilk (Reference Noe and Wilk1993); the four items used for the accessibility-of-training scale were adapted from Bartlett (Reference Bartlett2001); and the five items used in the support-for-training section were adapted from Noe and Wilk (Reference Noe and Wilk1993) and Bartlett (Reference Bartlett2001). Sample items are ‘Participating in training programs will help my personal development,’ ‘I believe I can improve my skills by participating in training programs,’ ‘This organization provides access to training,’ and ‘My manager enthusiastically supports my participation in training programs.’ The scales' Cronbach's α reliability scores were .88, .94, .90, and .94, respectively.
Job stress
A 4-item scale was modified from House and Rizzo (Reference House and Rizzo1972) to use to assess the job stress of care workers. The scale evaluated ‘the existence of tensions and pressures growing out of job requirements, including the possible outcomes in terms of feelings or physical symptoms’ (House & Rizzo, Reference House and Rizzo1972: 481). Sample items are ‘I seem to tire quickly’ and ‘I work under a great deal of tension.’ A higher score denoted a higher level of job stress. In a reliability test, this scale scored .94.
Turnover intention
Turnover intention was measured using four items adapted from Farh, Tsui, Xin, and Cheung (Reference Farh, Tsui, Xin and Cheng1998). Sample items are ‘I often think of quitting my present job’ and ‘I may leave this organization and work for another in the next year.’ This scale scored .89 in the reliability test.
Performance: Performance was measured with a 5-item scale adapted from Kirkman and Rosen (Reference Kirkman and Rosen1999). Sample items are ‘I respond quickly when problems come up’ and ‘I meet or exceed my goals.’ Cronbach's α reliability was .84.
Confirmatory factor analysis
To test the construct validity of the research variables, confirmatory factor analysis (CFA) was conducted using AMOS software. In the test, a maximum likelihood estimation of the covariance matrix was undertaken. On the job stress, performance, and turnover intention scales, we tested one-factor models separately. As hypothesized, the one-factor models fit the data: job stress (χ2 = 23.23, p < .01; df = 15, goodness of fit [GFI] = .91, comparative fit index [CFI] = .90, root mean square error of approximation [RMSEA] = .06, incremental fit index [IFI] = .89); performance (χ2 = 22.81, p < .01; df = 14, GFI = .92, CFI = .92, RMSEA = .06, IFI = .91); and turnover (χ2 = 18.52, p < .01; df = 12, GFI = .91, CFI = .89, RMSEA = .05, IFI = .91). Since the training perception scale was multi-dimensional, we tested three different models (four-factor, one-factor, and independent factors) for CFA. The results indicated that while the four-factor model yielded an acceptable fit (χ2 = 66.42, p < .01; df = 44, GFI = .90, CFI = .89, RMSEA = .05, IFI = .90), the one-factor and independent factors models did not.
Results
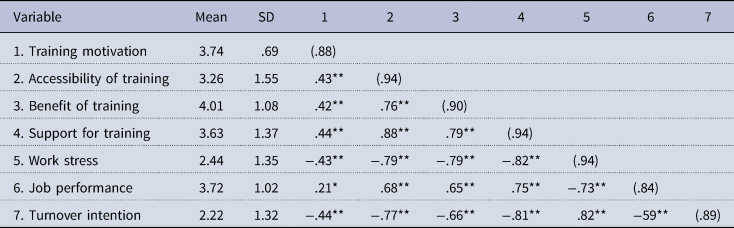
The correlation results are shown in Table 1. The average of all variables is above the midpoint. A significant relationship is observed between all variables. The subdimensions for the perception of employee training are negatively correlated with workplace stress and turnover intentions, while they are positively correlated with job performance.
Means, standard deviations, reliability scores, and correlations

*p < .10 **p < .05.
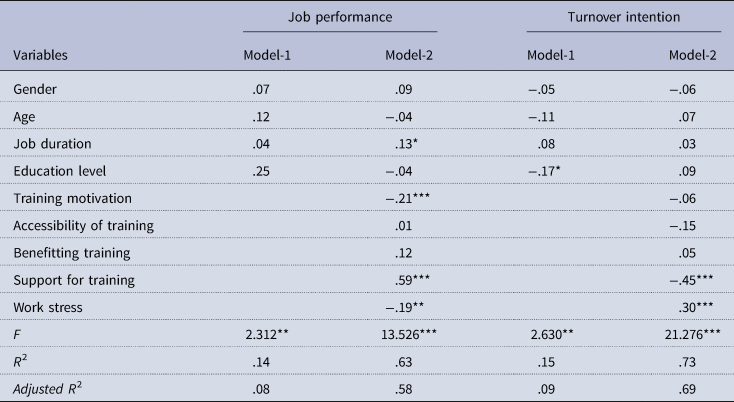
Hierarchical regression analysis was conducted to discover whether employee training dimensions played a significant role in the dependent variables. Table 2 shows the regression analysis for dimensions of employee perception of training and their effects on job performance and turnover intentions. In the first step, the demographic variables of age, gender, job duration, and educational level were entered and controlled. In the second step, independent variables were included in the model. When the demographic variables were controlled, support for training (β = .59, p < .001) had a positive effect on job performance, while motivation for training had a negative effect (β = −.21, p < .001). Conversely, perceptions about access to training (β = .01, p > .10) and benefits of training (β = .12, p < .10) did not affect job performance. For the second dependent variable, support for training (β = −.63, p < .001) and access to training (β = −.25, p < .10) had a significant negative impact on turnover intentions; however, no significant effect was found for benefits of training (β = .02, p > .10) or motivation for training (β = −.06, p > .10) on turnover intentions. Workplace stress had a significant and negative impact on job performance (β = −.20, p < .05); on the other hand, it had a significant and positive effect on turnover intention (β = 30, p < .001).
Regression analyses

Note: The entries in the table are standardized βs.
*p < .10, **p < .05, ***p < .001.
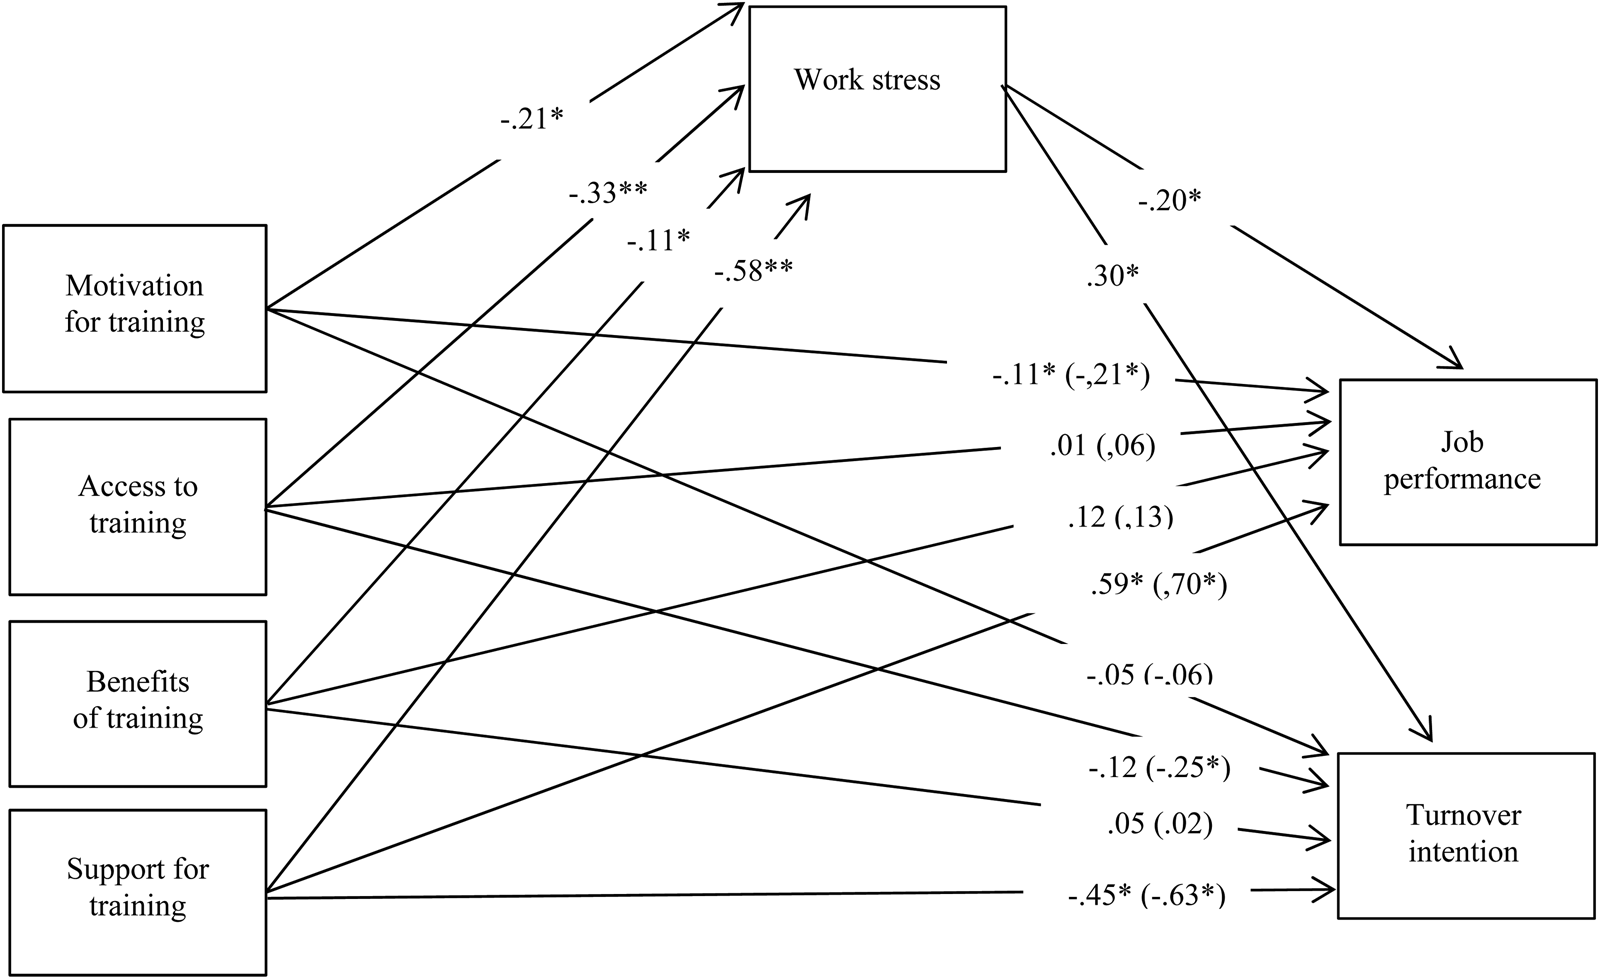
To test the mediation effect of workplace stress in the relation between employee perception of training, job performance, and turnover intentions, a path analytic model was tested using AMOS 16.0 (Byrne, Reference Byrne2013; Cheung & Lau, Reference Cheung and Lau2008; Raykov & Marcoulides, Reference Raykov and Marcoulides2006). The model tests depended on the covariance matrix and used maximum likelihood estimation. The model is illustrated in Figure 2.
Results of the path model (*p < 0.05 **p < 0.01)

In the model, the standardized path estimate values are shown on the arrows. In the first model, job performance and turnover intentions were indigenous variables, and employee perception of training was an exogenous variable. The standardized path estimates of the first model are included in parentheses. According to the results, motivation for training had a significant and negative impact on job performance (standardized β = −.21, p < .05), while support for training had a significant and positive impact (standardized β = .70, p < .05). However, access to training (standardized β = .06, p > .10) and benefits of training (standardized β = .13, p > .10) did not have a significant effect on job performance. For the second variable, support for training (standardized β = −.63, p < .05) and access to training (standardized β = −.25, p < .10) had significant and negative impacts on turnover intention. However, motivation for training (standardized β = −.06, p > .10) and benefits of training (standardized β = .02, p > .10) did not have a significant effect on turnover intention. The overall fit indices for the first model were in the acceptable range (χ2 = 8.47, p < .01; df = 3, GFI = .90, CFI = .90, IFI = .91, RMSEA = .05).
In the second model, job performance and turnover intentions were considered indigenous variables, employee perception of training was exogenous, and workplace stress was the mediating variable. The standardized path estimates of the second model are shown outside the parentheses. The findings demonstrated that motivation for training (standardized β = −.21, p < .05), access to training (standardized β = −.33, p < .001), benefits of training (standardized β = −.11, p < .10), and support for training (β = −.58, p < .001) affected workplace stress negatively and significantly. Additionally, workplace stress had a significant negative impact on job performance (standardized β = −20, p < .10), but after the inclusion of workplace stress in the model, the impact of motivation for training (standardized β = −.11, p < .10) and support for training (standardized β = .59, p < .05) on job performance decreased. In addition, workplace stress had a significantly positive impact on turnover intention (standardized β = .30, p < .05), but after the inclusion of workplace stress in the model, the impact of support for training on turnover intention decreased (standardized β = −.45, p < .10), and access to training was insignificant (standardized β = −.12, p > .10). Thus, workplace stress partially mediated the relationship between training and job performance and between training and turnover intention. Hence, Hypotheses 1a, 1b, 4a, and 4b were partially accepted, while 3a, 3b, and 2 were fully accepted. The fit indices for the second model were in the acceptable range (χ2 = 10.11, p < .01; df = 5; GFI = .91, CFI = .89, IFI = .91, RMSEA = .05).
Discussion
Through the lens of POSH, this study tested (a) the effect of employee perception of training on the organizational outcomes of job performance and turnover intention and (b) the mediating role of workplace stress in the relationship between employee perceptions of training, job performance, and turnover intention. Our findings are consistent with the posited POSH conceptual framework and suggest that training helped workers develop both practical and emotional coping mechanisms to manage stress and led to positive employee behaviors, such as high job performance and low turnover intention. These results are similar to those of earlier empirical works (e.g., Karantzas et al., Reference Karantzas, Mellor, McCabe, Davison, Beaton and Mrkic2012; Newman, Thanacoody, & Hui, Reference Newman, Thanacoody and Hui2011; Ravenswood, Douglas, & Haar, Reference Ravenswood, Douglas and Haar2017), but this study expanded on previous research by incorporating the POSH approach. This allowed us to assess training dimensions, job stress, and employee outcomes specifically in elderly-care contexts. Our findings demonstrated that workplace stress plays a mediating role in the relationship between employee perception of training, job performance, and turnover intentions. The major findings are as follows.
The first hypothesis (1a) addressed the positive relationship between employee perception of training and job performance. Support for training had a strong and positive impact on job performance, suggesting that management or leadership styles may be one of the most important factors in employee performance. From the POS perspective, administrative aid as a job resource generates stable effects on positive employee behaviors, including performance and motivation (Chan, Reference Chan2018). Other researchers have confirmed that elderly-care workers with supportive supervisors have higher performance and are better able to maintain their commitments to their work (Karantzas et al., Reference Karantzas, Mellor, McCabe, Davison, Beaton and Mrkic2012; Lawn, Westwood, Jordans, Zabeen, & O'Connor, Reference Lawn, Westwood, Jordans, Zabeen and O'Connor2016). In contrast to support for training, motivation for training had a negative impact on job performance, and access to training and benefits of training had insignificant effects. Thus, hypothesis 1(a) is partially accepted.
For hypothesis 1(b), the results indicated that support for training was directly associated with turnover intentions. This finding is in line with previous research showing that managerial support for training directly and negatively affected turnover intentions (Shuck, Reio, & Rocco, Reference Shuck, Reio and Rocco2014). Perceived organizational support theory also supports these results. Employees were less likely to report turnover intentions when they were given professional development support through access to trainings and other educational activities and through direct encouragement from supervisors (Eisenberger, Huntington, Hutchison, & Sowa, Reference Eisenberger, Huntington, Hutchison and Sowa1986; Shuck, Twyford, Reio, & Shuck, Reference Shuck, Twyford, Reio and Shuck2011). Motivation for training and benefits of training had insignificant effects on turnover intentions. Thus, hypothesis 1(b) is partially accepted.
The second hypothesis of this study focused on the relationship between employee perception of training and workplace stress. An initial correlation and regression analysis showed a negative relationship between workplace stress and training, suggesting that training could reduce workplace stress for elderly-care workers, while a lack of training could increase it. This finding further suggests that if organizations could provide more educational opportunities to care workers, workplace stress could be minimized and more positive outcomes could be realized. Thus, hypothesis 2 is fully accepted.
The third hypothesis (3a–b) examined the relationship between workplace stress, job performance, and turnover intentions. Table 1 shows a negative correlation between workplace stress and job performance and a positive correlation between workplace stress and turnover intentions. These results demonstrate a positive relationship between workplace stress and turnover intention and a negative relationship between stress and job performance, implying that workplace stress can lead to a loss of employees in organizations and adversely affect employees' effectiveness. This finding is consistent with previous research findings (Chao et al., Reference Chao, Ku, Wang and Lin2016; Tourigny, Baba, & Lituchy, Reference Tourigny, Baba and Lituchy2016). Thus, hypothesis 3(a–b) is fully accepted.
Lastly, the fourth (4a–b) hypothesis investigated the mediating role of workplace stress on the perception of training, job performance, and turnover intention. Senior managers of elderly-care organizations should heed this result. One of the most important roles of senior managers is to provide elderly-care employees with regular access to training programs to help them develop their skills. This is in accordance with general academic opinion. The JD-R model suggests that when employees experience high job resources (adequate training), it mitigates the negative work behavior consequences that tend to result from increasing job demands. Results have shown that adequate resources (especially support and motivation for training) reduce workplace stress and its associated negative work behaviors. Therefore, resources would also increase job performance and reduce turnover intentions. Applying the experiential perspective of POSH, one could consider that providing stressed employees with opportunities for training and professional development is a shift from a problem-focused approach to a solution-focused approach. However, our results did not show substantial improvements from access to training or benefits of training in the mediating effect. Thus, hypothesis 4(a–b) is partially accepted.
Some dimensions of training perception did not show the expected results and perhaps need to be developed further for favorable outcomes to be realized. First, contrary to expectations, motivation for training had a strong and negative impact on job performance. This finding differed from the findings of other studies, such as Tannenbaum, Mathieu, Salas, and Cannon-Bowers (Reference Tannenbaum, Mathieu, Salas and Cannon-Bowers1991) and Gegenfurtner (Reference Gegenfurtner2011). One of the reasons for this finding may have been our study sample. In the majority of elderly-care facilities, training is not voluntary, which could lower motivation for training and adversely affect job performance. Moreover, access to training and benefits of training did not have significant effects on job performance, either. In elderly-care facilities in Northern Cyprus, training is not voluntary, and thus, supervisors decide who participates in training. For employees who were unable to access the benefits of training programs, training opportunities did not affect job performance. Third, motivations for training and benefits of training had insignificant effects on turnover intentions. Since there are limited educational and external (financial) reward opportunities for care workers in Northern Cyprus, workers might be unmotivated and display turnover intentions. Previous studies mentioned that a majority of care workers for the elderly were more driven by external or financial rewards, and this turned out to be the unique determining factor of turnover intention (De Gieter, De Cooman, Hofmans, Pepermans, & Jegers, Reference De Gieter, De Cooman, Hofmans, Pepermans and Jegers2012; De Gieter & Hofmans, Reference De Gieter and Hofmans2015).
Conclusion
Theoretical contribution
Our study makes two significant theoretical contributions. First, although the perception of training and its positive outcomes have been substantially researched, few studies have explored the strengths of training dimensions in nursing homes through the POSH lens. Bakker and Demerouti (Reference Bakker and Demerouti2018) found that human resource practices such as increasing the frequency of training create important positive job resources for employees. The present study expanded the existing literature by developing a comprehensive POSH-based model to assess different dimensions of training and organizational outcomes (i.e., job performance and turnover intention) in the nursing home environment. Thus, our study accords with the POSH literature finding that various dimensions of training (four, in this case) can build organizational strengths in elderly-care facilities and foster positive outcomes. Moreover, the four training dimensions' distinct effects that were demonstrated in this study can address the tautology problem in the concept of training. Thus, different dimensions of training are linked to organizational outcomes in different ways in nursing homes.
Further, we studied a novel aspect of the perception of training – the mediating effect of workplace stress on the training outcomes of elderly-care workers – by integrating the POSH lens with empirically substantiated research. This study contributes to the literature that shows a positive relationship between training and job performance and a negative relationship between training and turnover intention (Newman, Thanacoody, & Hui, Reference Newman, Thanacoody and Hui2011; Park, Kang, & Kim, Reference Park, Kang and Kim2018) but also shows that workplace stress has a mediating role in those relationships and leads to negative outcomes. Thus, the current study has integrated the POSH lens into the literature. It has also demonstrated how inadequate training in nursing homes can lead to detrimental long-term effects and has highlighted how negative employee behaviors can be transformed into positive outcomes and organizational strengths. Organizations that support elderly-care workers with adequate training opportunities are more likely to reduce workplace stress levels and transform negative turnover intentions into positive outcomes, such as improved job performance. This study is an attempt to explore how to build organizational strength and help employees flourish in Northern Cyprus private nursing homes. It contributes to the base of knowledge on staff performance and reduced turnover intentions in the provision of healthcare services.
Within the perception of training literature, we relied on JD-R theory (Bakker & Demerouti, Reference Bakker and Demerouti2007; Demerouti, Nachreiner, Bakker, & Schaufeli, Reference Demerouti, Nachreiner, Bakker and Schaufeli2001) to help us understand the mediating role of workplace stress. To our knowledge, our study is the first to use the JD-R as a theoretical framework to examine the mediating role of workplace stress in employee perception of training and positive organizational outcomes. Our objective was to create new knowledge about training practices that can reduce workplace stress and support positive organizational outcomes in nursing homes. According to JD-R theory, when adequate job resources or trainings are available to help elderly-care workers cope with their demanding workloads, it may mitigate harmful effects. In accordance with POSH, then, organizations that provide trainings and educational activities for elderly-care workers can reduce workplace stress and help employees transform negative behaviors into positive outcomes.
Managerial implications
The findings of this study have many important implications for managers and researchers. Elderly-care workers around the world face demanding workloads; hence, many policies have been dedicated to labor force planning in this sector (World Health Organization, 2017).
The primary finding in this research is that support for training is one of the most important mid-level variables that can be used to produce a consistent positive effect on employee behaviors. Support for training can reduce workplace stress and turnover intentions and lead to improvements in employees' job performance. Thus, staff mentoring and training programs are an important way to ensure optimal performance and minimal turnover among elderly-care workers. In practice, managers could encourage employees to think of the organization as their family or in-group (Dodson & Zincavage, Reference Dodson and Zincavage2007), which might convince them to remain in their jobs and put forth more effort, thereby improving job performance.
On the other hand, some of our findings suggest a need for improvement on individual, managerial, and policy levels for the realization of more positive outcomes. First, there was a weak relationship between the benefits of training, job performance, and turnover intentions. This indicates that in Northern Cyprus, both intrinsic and extrinsic rewards are low among elderly-care workers. Intrinsic rewards are low because training is not voluntary, and there are no annual performance reviews; extrinsic rewards are low because there are no financial benefits for employees who attend training programs. To boost rewards, according to the POSH approach, managers should explore ways to increase employees' positive subjective experiences (Nilsson, Reference Nilsson2015). They should consider raising salaries, offering fringe benefit packages, and allowing voluntary attendance at training programs. Previous research supports this approach, as it shows that both intrinsic and extrinsic factors play a role in improving job performance and reducing turnover intentions (De Gieter & Hofmans, Reference De Gieter and Hofmans2015).
Second, this research confirms that access to training has an insignificant impact on job performance and a significant impact on turnover intentions. This suggests that policy interventions may be necessary to professionalize and enhance the quality of trainings, establish systems for quality management, and widen the extent of practice (Montague, Burgess, & Connell, Reference Montague, Burgess and Connell2015). Managers are also responsible for bringing about these results. Senior managers in elderly-care settings should recognize that one of their key roles is to provide training programs to help employees increase their knowledge base and develop their skills. Managers should also inform employees about how to access valuable training opportunities, and they should encourage their employees' attendance to ensure the most positive results. This approach will be perceived by employees as attentiveness and as employers investing in their well-being. In sum, when employees have access to training that will increase their work-related knowledge and skills, it can reduce workplace stress, decrease turnover intentions, and enhance job performance in an organization.
Third, our research shows that motivation for training has a significant negative effect on job performance and a low effect on turnover intentions. The primary reason for motivation's negative effect may be the compulsory nature of training programs, with managers deciding who will take part. Thus, employees may believe they are not adequately prepared to practice recently acquired knowledge and skills in the work environment. Because elderly-care workers have complex and demanding jobs, they may need regular training programs to refresh their knowledge and gain new skills. Therefore, the government should mandate continuing professional development for elderly-care workers. When managers ensure that employees have the necessary skills and knowledge to perform their jobs, it will have a positive influence on employees and reduce their stress levels.
Limitations and suggestions for future research
This study has several limitations, such as the use of self-report surveys, which are prone to common method bias. However, according to Spector (Reference Spector1994), if an instrument largely reflects a literature review and the data analysis employs pattern matching, self-reporting techniques are more likely to be valid. The scope of this study is restricted to Northern Cyprus and to one sector, which is an additional limitation. Thus, it is important to consider sectoral and regional differences when generalizing the results. To broaden the relevance of this research, future studies should include other countries and industries. Another limitation of the study is that we addressed only employee training perceptions (benefits of training, access to training, etc.) as HRM practices and their organizational outcomes. More research is needed to identify the kinds of training that are most efficient in different workplace environments, particularly within healthcare organizations. Future researchers can investigate which training models and methods (e.g., off-the-job, on-the-job, or team training) yield the most positive organizational outcomes in terms of POSH.
In sum, this study presented empirical evidence for the mediating role of workplace stress in the relationships among employee perception of training, job performance, and turnover intentions in an elderly-care context. Theoretically, this study expanded on the POSH approach by analyzing the integration of relationships between the perception of training, outcomes, and the mediating role of stress. This study revealed that employee perception of training and job-related stress both affect job performance and turnover intentions in elderly-care workers and that workplace stress mediates the relationship between these variables and training.
Acknowledgement
None.
Funding
The authors had no financial support.
Disclosure Statement
No contribution.
Contribution
The authors have no personal interest or benefit arising from the application of the research.
Harun SESEN works as a Professor of Management at the Faculty of Economics and Administrative Sciences, European University of Lefke, Gemikonagi, Northern Cyprus. His research interests include organizational behavior, entrepreneurship, and innovation. He has published several books on management topics and papers in journals including Leadership & Organization Development Journal, Educational Psychology, Education + Training, and The Journal of Entrepreneurship.
Şenay Sahil ERTAN is currently a PhD candidate and working as a research assistant in the Faculty of Economics and Administrative Sciences, Department of Business Administration at the European University of Lefke, Gemikonagi, Northern Cyprus. Her recent research interests include human resource management practices, gender, and self-employed women.