
This book is the product of a conference by the same title, “The Arc of the Chinese Economy,” held under the auspices of the Center for the Study of Contemporary China at the University of Pennsylvania on March 31–April 1, 2023. It is one of a series of edited volumes published by the Center.
The growth of the Chinese economy in the last four decades is one of the most transformative events of global economic history. It is especially dramatic considering China’s population of 1.4 billion and its vast territory and heterogeneity. China’s gross domestic product (GDP) grew from US$360.86 billion in 1990 to US$17.79 trillion in 2023, a fiftyfold increase in nominal dollars. In comparison with the U.S., Chinese economic growth was tenfold, from 6.1 percent of U.S. GDP in 1990 to 64.2 percent of the U.S. in 2023. In purchasing power parity (PPP) terms, China’s GDP grew from 18.6 percent of the U.S. in 1990 to 125.0 percent of the U.S. in 2023, a nearly sevenfold increase. In terms of per capita purchasing power, China grew from 4.1 percent of the U.S. in 1990 to 29.7 percent of the U.S. in 2023, more than a sevenfold increase (World Bank, n.d. (a); n.d. (b); and n.d.(c)).Footnote 1 The increase in per capita purchasing power relative to the U.S. was somewhat higher than the increase of GDP in PPP terms in part because China’s population grew more slowly than U.S., 23.3 percent (from 1.143 to 1.410 billion) for China versus 34.6 percent (from 248.709 to 334.91 million) for the U.S., from 1990 to 2023.
By World Bank criteria, China became a lower-middle-income country in 2001 and an upper-middle-income country in 2010. And like many middle-income countries, China faces headwinds and, to borrow language from the World Bank website, a “structural slowdown” of the Chinese economy is anticipated in the medium term. The juxtaposition of spectacular past growth with more modest growth expectations renders forecasting the arc of the Chinese economy challenging. Forecasts have evolved over time and toward a more cautious outlook. Pre-COVID, continued rapid growth was anticipated. In 2018, the IMF projected that Chinese GDP in nominal dollars (not PPP) would overtake the U.S. by 2030 due to “accelerating rebalancing efforts, increasing the role of market forces, fostering openness, and modernizing policy frameworks” (Saber, Reference Saber2018). Post-COVID, forecasts have been revised downward and double-digit annual growth statistics accepted as things of the past. Still, the range of predictions regarding the future growth rates of the Chinese economy was substantial through 2023 when the headlines ran the gamut. A sample of October 2023 headlines includes the following: “World Bank Sees China’s Growth Sputtering to Slowest Rate Since 1960s;” “IMF sees signs China stabilizing, reforms can boost medium-term growth;” and “JP Morgan, Nomura Raises China 2023 Economic Growth Forecast” (Chaung, Reference Chaung2023; Economic Times, 2023; Reuters, 2023). Concerns about China’s long-term growth prospects intensified in early 2024 when it became evident that end of zero-COVID restrictions did not produce the expected economic rebound. This triggered a lively debate about “peak China,” the notion that China’s GDP in proportion to global GDP was in inexorable decline. The Rhodium Group (2024), in particular, questioned whether the Chinese economy would ever regain its earlier momentum: “ … it is extremely unlikely that China will regain its previous peak as a proportion of the global economy.” China’s announcement of 5.0 percent GDP 2024 growth – on target – did little to allay these concerns because growth remained unbalanced: Despite a fourth-quarter $1.4 trillion stimulus package, domestic consumption lagged industrial production and nearly a third of 2024 GDP growth was due to China’s $1 trillion trade surplus.Footnote 2
The topic of our conference and the title of this book, “The Arc of the Chinese Economy,” has become exceedingly relevant, more so than nearly two years ago when the conference convened. Where China’s economy is going is no longer a technical issue but is rather of consequence for Chinese households whose wealth is at risk, for the global economy reliant on Chinese economic growth despite “de-risking” and “decoupling” from China, and even for the global balance of power. These issues and many others are addressed in the chapters ahead. While the chapters are written mainly by economists (though in one instance by statisticians, another by demographers, and yet another by a political scientist), they are intended for lay readers as well as academicians. The chapters are full of surprises. To mention one: State penetration of the Chinese economy via partial and indirect ownership of enterprises accelerated rapidly following the Global Financial Crisis (GFC) and is far more extensive than most scholars had imagined. Not surprising, perhaps, is that several of the chapters, though not all, envision a slow-growth scenario for China. This raises further questions: Why have expectations for the Chinese economy shifted from robust to little or no growth? What steps might China take, what policy levers it can pull, to inch away from slow growth? And what are China’s long-term growth prospects? We hope this book provides suggestive answers – plural as there are no single or simple answers – to these questions and many more.
We begin with a pair of observations. The first concerns GDP, the total output of goods and services within a country’s borders. There are settled ways of measuring GDP by expenditure or income.Footnote 3 However, as in other domains there are no reliable methods for forecasting GDP growth, which is why forecasts differ and the forecasting industry flourishes. The IMF, perhaps the most authoritative source of country-level GDP forecasts, acknowledges that it has no standard methodology for forecasting growth. Rather, IMF growth forecasts originate locally and are based on country-specific assumptions and models (International Monetary Fund, 2024). In this regard, a recent research result is startling: From 2010 to 2020, same-year World Bank country GDP forecasts were off by 1.3 percentage points and IMF forecasts by 1.5 percentage points with the IMF consistently more optimistic than the World Bank (Gatti et al., Reference Gatti, Lederman, Islam, Nguyen, Lotfi and Emam Mousa2024).
Of special relevance to forecasting is the growth accounting model that estimates GDP growth as the sum of growth in capital, labor, and productivity. The term accounting is critical: The model accounts for the contributions of capital, labor, and productivity to growth after the fact. But it cannot forecast growth because productivity is a residual derived from observed capital, labor, and GDP growth – in other words, productivity growth is not knowable until GDP growth has been ascertained.Footnote 4 Complicating matters, the error or stochastic component of GDP forecasts is magnified several times in developing compared to developed economies (Hong and Tan, Reference Hong and Tan2014).
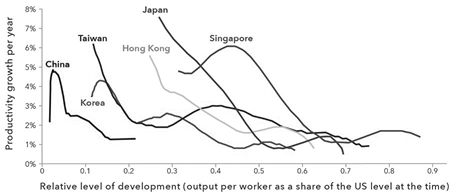
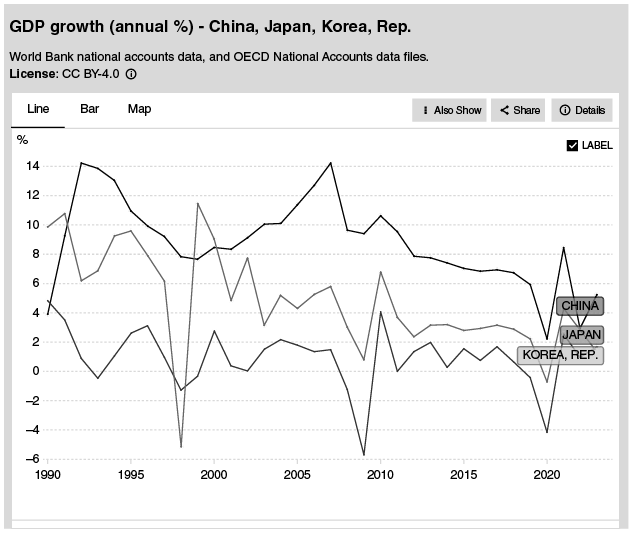
The second observation concerns China’s actual GDP growth that may (or, less likely, may not) have taken a sharp turn. Until recently, the Chinese economy has performed superbly and weathered economic storms better than most countries. Some relevant data are captured in a comparison of the real growth of China, Japan, and Korea from 1990 to 2023. Figure 1.1, from the World Bank, displays the differences in the three countries’ growth trajectories. From 1992 to 2021, except for Korea in 1999, China’s growth rate remained consistently above Japan’s and Korea’s. China’s GDP performance during the GFC was stellar: China recorded 9.7 percent growth in 2008 and 9.4 percent 2009, while Japan recorded −1.2 percent growth in 2008 and −5.7 percent in 2009, and Korea 3.0 percent growth in 2008 and 0.8 percent in 2009. Since 2021, however, the gap between China, Japan, and Korea has narrowed. China’s real GDP growth in 2022 was 3.0 percent compared to 1.0 percent in Japan and 2.6 percent in Korea. And China’s 5.2 percent real growth rate in 2023, though higher than Japan’s 1.7 percent and Korea’s 1.4 percent, hardly compares to its performance in earlier years. Nor is China’s growth expected to be exceptional in comparison with the larger region. The World Bank estimates 2024 GDP growth in East Asia ex China and in South Asia at 4.8 percent and 6.4 percent, respectively, compared with China’s reported 5.0 percent. Whether China will return to exceptional growth is far from certain but highly consequential.
GDP growth of China, Japan, and Korea, 1990–2023
Expert Forecasts
We began the “The Arc of the Chinese Economy” conference with a panel of experts tasked with forecasting the trajectory of the Chinese economy.Footnote 5 The panel included Justin Lin Yifu (Peking University), Lant Pritchett (Oxford University), Thomas Rawski (University of Pittsburgh), Michael Zheng Song (Chinese University of Hong Kong), and Chenggang Xu (Stanford University). Daniel Rosen (The Rhodium Group) served as discussant. These presentations were brief, not intended as book chapters and, by design, disparate. The panel, like the entire conference, was recorded. Our account of the expert presentations is taken from these recordings and has been approved by the presenters.
Justin Lin began by focusing on the potential of the Chinese economy for growth through 2035, which he pegged at around 8 percent. Lin’s logic was as follows: According to Penn World Table, China’s per capita GDP was 22.6 percent of that of the U.S. in 2019. This ratio was similar to that of Germany’s per capita GDP relative to the U.S. in 1946, Japan’s relative to the U.S. in 1956, and Korea’s relative to the U.S. in 1985. Germany enjoyed annual per capita GDP growth rate of 8.6 percent from 1946 to 1962; Japan also achieved annual per capita GDP growth rate of 8.6 percent from 1956 to 1972; and Korea’s annual per capita GDP growth rate was 8.1 percent from 1985 to 2001. Lin thus suggests that China’s growth potential from 2019 when it reached 22.6 percent of the U.S., then, should also be in the range 8 percent. Actual growth through 2035, according to Lin, will likely be somewhat lower, averaging 5–6 percent provided there are no “black swan” events such as wars, global recessions, or Covid-like pandemics. Lin cited several factors contributing to the robustness of the Chinese economy including abundant human capital, a large domestic market, short innovation cycles and a comprehensive industrial sector. Interestingly, Lin projected that, going forward, investment will be mainly in productivity-enhancing innovations and account for about 40 percent of Chinese GDP growth, while consumption will drive the remaining 60 percent.
Lant Pritchett, in sharp contrast to Lin, called for a “factual characterization” of growth processes. For Pritchett, the principal fact is this: The reliability of forecasts of GDP growth has historically not been very good, especially for developing economies experiencing high rates of growth. Whereas ten-year growth projections for Organisation for Economic Co-operation and Development (OECD) economies have been relatively accurate with roughly +/− 20 percent error, developing economies often experience sharp turning points or phase transitions where forecasting errors can approach 100 percent.Footnote 6 Hence, according to Pritchett, “ … extrapolation [is] a very bad forecast of the future” for these economies. Economic phase transitions have several characteristics: unexpected and massive accelerations or decelerations of growth, regression to the mean where economies of high-growth countries decelerate while low-growth countries accelerate, and underestimation of both the magnitude of change and the duration of the post-transition state. An example cited by Pritchett is Mexico’s 1982 bankruptcy and the subsequent LDC (less developed country) debt crisis that lasted seven years. Pritchett then estimates a worst-case scenario for China. Based on the forecast errors for countries with similar growth spurts, China’s 2029 real per capita GDP could fall as much as 55 percent below current forecasts and actually contract from 2019 to 2029. He ends with a stark reminder: “…there are often major decelerations in growth and we often miss them…We shouldn’t rule out that it can happen because it frequently does happen.”
Tom Rawski shares Justin Lin’s confidence in the long-run potential of the Chinese economy. His confidence is based partly on the historic legacy of entrepreneurship that fueled the post-1978 market explosion and is evident today in the commercial success of overseas Chinese and the abundance of entrepreneurs at home. Rawski also takes reassurance from institutional changes, especially gains in education, health, and infrastructure, as well as “R&D investment on a grand scale.” Still, according to Rawski, the whole remains less than the sum of its parts, and China is performing substantially below its production possibility frontier. The proximate explanation lies in the declining growth rate of productivity. For most countries, productivity gains are greatest in the early stages of development. Citing a figure from Rajan and Leng (Reference Rajah and Leng2022)’s Lowy Institute report reproduced here as Figure 1.2, Rawski argued that the total factor productivity (TFP) slowed at a much earlier stage of China’s development, as measured by the output per worker relative to the U.S. level, than that of other East Asian economies. Rawski attributes China’s early productivity slowdown to a partial revival of pre-1978 constraints including priority given to the “security sector” in preference to the commercial sector, criticism of and constraints placed on entrepreneurs, and China’s international behavior that has eroded confidence of overseas investors and customers. Absent reforms, Rawski concluded, Chinese productivity and GDP will continue to lag. Rawski also cautioned that consumer prices in China may have risen faster than the reported CPI and hence China’s GDP price deflators may be understated and its productivity and GDP growth overstated.
Evolution of TFP growth rates for selected economies as a function of their per capita GDP relative to the U.S.

Michael Song is more sanguine than Rawski about the quality of Chinese economic data. His analysis indicates that distortions in local-generated data have been largely corrected by the National Bureau of Statistics such that, nationwide, “misreporting is quite limited.” This said, Song’s prognosis for the Chinese economy is far less sanguine than Rawski’s. The proximate cause of the poor prognosis is declining productivity growth. Not only did China’s GDP growth decelerate sharply following the GFC, but also that productivity growth fell in tandem with the GDP growth. Two statistics are illustrative. While productivity growth accounted for 30–40 percent of GDP growth prior to the GFC, Song estimates that the post-GFC contribution of productivity growth to China’s GDP growth declined to 10–20 percent. And while the returns to capital were in the range of 20 percent prior to the GFC, these returns plummeted to 10 percent by 2020. Underlying the post-2008 slide in the productivity growth and the returns to capital was a sharp change in government policy. According to Song, prior to the GFC, local governments in China were effectively forbidden from borrowing; however, China’s RMB 4 trillion (approximately US$ 586 billion) economic stimulus package announced in late 2008 relied heavily (approximately 70 percent) on local government contributions for which there was no ready cash and could be funded only through indebtedness. Shortly after, the People’s Bank of China (PBOC) and the China Banking Regulatory Commission called on local governments “to attract and inspirit banking financial institutions to provide more credit support for centrally-funded projects by increasing the discount interests from the local finance, improving the credit rewarding and compensation mechanism and setting up legal platforms for the governments to make investments and raise funds” (PBOC and China Banking Regulatory Commission, 2009), effectively legalizing local government investment corporations, today known as local government financing vehicles (LGFVs). What followed, according to Song, was a sea change. Aggregate social financing in China ballooned from slightly over 100 percent to nearly 300 percent of GDP from 2008 to 2020. From 2017 to 2022, local government bonds and LGFV debts in proportion to GDP increased from 34 to 50 percent. Song also shows that returns to infrastructure investment in China have fallen below both the U.S. and E.U. since 2008. Song’s larger thesis, which deserves attention, is that the role of local government shifted dramatically and decisively during the GFC. Prior to the GFC, local government was entrepreneurial, striking deals benefitting both private enterprises and government. Post-GFC, local governments shifted to financial engineering to rollover their maturing debts and borrow new debt in order to maintain local GDP growth. Ultimately, if Song’s thesis is correct, local governments will have to revert to the entrepreneurial model to reignite sustainable growth.
Chenggang Xu is even less sanguine. Fundamentally, Xu believes that today’s economy of the People’s Republic of China shares certain similarities with the later decades of the former Soviet Union (FSU). According to Xu, prior to 1957 and under the influence of the FSU, China established a Soviet-type totalitarian regime (central planning is an essential part of it). However, since the Great Leap Forward (1958–1962) and the Cultural Revolution (1966–1976), China deviated from a Soviet-type regime and evolved into a regionally administered totalitarian (RADT) regime. The post-Mao reforms inherited this regime, facilitating regional competition across counties, municipalities, and provinces for GDP growth, where such competition was deemed acceptable. The incentives created by this competition were essential for the unintended development of the private sector. This development was key to China’s decades-long rapid growth and also evolved Chinese institutions toward a more relaxed regional decentralized authoritarian regime. According to Xu, however, regional competition lost its effectiveness since the mid-2000s, as competition for growth alone became unacceptable due to rising social stability and environmental issues.Footnote 7
The driving force behind China’s rise has been the private sector and globalization. However, the Chinese Communist Party (CCP) has regarded key elements of the ever-growing private sector and globalization as threats to its rule. The reversion to totalitarian regime occurred when the Xi government came to office, extending state control over the private sector while international trade and technology transfer became restricted as China’s relations with the West deteriorated. In Xu’s terms, China has now reverted to RADT, which will persistently enlarge state sector (with soft-budget constraints), depress private sector, and further deteriorate relationships with advanced economies. Putting these together, Xu’s forecast for the Chinese economy is as stark as his analysis: persistent weaknesses on both the supply side (cancellation of the Ant Financial IPO, jailing of entrepreneurs, and the collapse of real estate) and the demand side (low levels of secondary education, depressed household consumption, and population decline) indicating a persistent “Brezhnev-era stagnation.”Footnote 8
Daniel Rosen, who discussed these expert forecasts, noted that they ranged from 2 to 8 percent medium-term growth of the Chinese economy; and he added that the International Monetary Fund (IMF) forecasts, generally considered the most reliable, anticipate post-2024 growth rates in the range of 3 percent. Rosen then focused on the expected directionality for the key drivers of China’s GDP growth. Household and government expenditures, according to Rosen, will remain constrained. Fixed-asset investment will remain severely constrained: Diminished marginal returns will limit infrastructure investment while the real estate sector still needs to shrink by half to balance supply with demand – Rosen commented that there is “no way” for capital expenditures to grow without a leveling-off of real estate. Further, net exports have little room to grow given trade constraints imposed by the West. Underlying these forecasts is Rosen’s view of how reversals at the policy level have coursed through the economy. According to Rosen, China continued to pursue neoliberal marketization through Xi Jinping’s first term ending in 2018. However commonsensical and nonideological these reforms were, they raised the specter of political instability for the Communist Party. “Compromises were going to need to be made … each and every one of those next steps in terms of basic policy reform had to be canceled, put on the sidelines,” leaving the West profoundly uncomfortable because “China is diverting back to a more intervened-upon approach” with likely negative consequences for innovation and productivity.
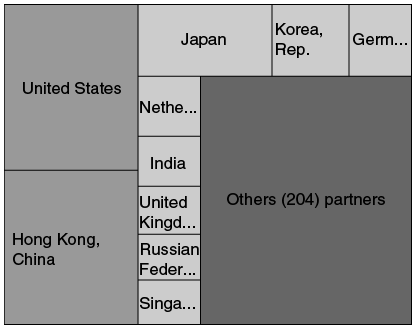
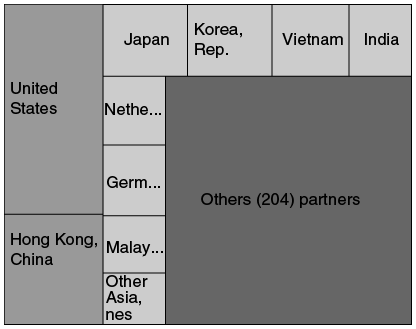
Not represented on the expert panel, or elsewhere in “The Arc of the Chinese Economy” conference, are the views of investment firms that, perhaps unsurprisingly, tend to support Justin Lin’s forecast of robust economic growth, at least of late. There are two key observations. The first is connected with industrial policy. While the academic research about industrial policy is vast and often reaches divergent conclusions,Footnote 9 China’s manufacturing base is pivoting from heavy industry to digital industries exemplified by online retailing, virtual services (healthcare especially), and digital integration of supply chains. It is also shifting rapidly toward green industries, notably electrification of vehicles (Bu et al. Reference Bu, Chung, Leung, Wang, Xia and Xia2021). Growth in China’s digital and green economies in 2022 more than offset the contraction in real estate: The digital economy contributed 3.1 percent and the green economy contributed 1.6 percent to China’s 2022 GDP growth, more than offsetting the 3.7 percent loss in real estate according to KKR (McVey and Lim, Reference McVey and Lim2023). These new industries are investment-intensive and are anticipated to be productivity-enhancing, with the former contributing to short-term GDP growth and the latter to medium- to long-term growth. Second, just as China’s manufacturing base is pivoting, so is its foreign trade. The trade war notwithstanding, U.S.–China trade grew through 2022 (though it declined by 17 percent in 2023 relative to 2022). Still, China’s trading partners, especially its export partners, have shifted away from Europe and toward its neighbors in East Asia. As shown in Figure 1.3, the largest shares of 2012 Chinese exports went to the U.S., Hong Kong, Japan, Korea, Germany, the Netherlands, India, U.K., Russia, and Singapore in that order. China’s largest 2022 export partners were the U.S., Hong Kong, Japan, Korea, Vietnam, India, the Netherlands, Germany, Malaysia, and Taiwan (the euphemism for Taiwan is “Other Asia, NES”).Footnote 10 The dark spot is that investors are not necessarily impressed by these arguments or, better, that they believe the negative consequences of China’s “more intervened-upon approach” to the economy will more than outweigh the gains due to industrial policy and shifting trade partners. In the third quarter of 2023 and for the first time ever since 1998, China posted a net outflow of foreign direct investment (FDI). The outflow was small, $11.8 billion, but signals a waning of confidence in the direction of the Chinese economy. Indeed, the waning confidence, not just of foreign investors as shown by the net outflow of FDI but also of the domestic consumers and investors, in the Chinese economy may be the biggest headwind facing the Chinese economy in the short term.
Chinese export partner shares, 2012 and 2022.
China 2012 export partner share

China 2022 export partner share

The question of China’s potential growth also needs to be revisited. In a recent IMF working paper (Muir et al., Reference Muir, Novta and Oeking2024), potential growth estimates differ from actual growth or conventional growth projections by assuming efficient allocation of factor inputs across economic sectors. This differs from Justin Lin’s approach of estimating China’s potential growth by comparison with growth rates of other countries at roughly the same stage of development. Several findings are notable. Looking backward, Muir et al. (Reference Muir, Novta and Oeking2024) find that “China’s potential growth peaked in 2005–2006 [at around 10 percent] and has fallen since in line with weaker productivity growth, less productive capital, and a shrinking workforce …” (p. 12). Looking forward, there are two projections, one a baseline and one a reform model. The baseline model assumes no structural changes while the reform model assumes decelerated capital investment, enhancement of human capital and retirement at age 65, and productivity improvements in the secondary and tertiary sectors of the economy, the last mainly by shifting production into the private sector (see Table 1.1, page 16, for a comparison of the baseline and reform scenarios). Under the baseline projection, 2025, 2030, and 2040 potential growth rates are estimated at 4.2, 3.4, and 2.2 percent, respectively. The 2030 and 2040 estimates correspond almost exactly to the Lowy Institute’s forecast that the “Chinese economic growth can be expected to decelerate to roughly 3% by 2030 and 2% by 2040, compared to the pre-Covid trend of a little above 6%” (Rajah and Leng, Reference Rajah and Leng2022).Footnote 11 The reform scenario increases potential growth rates to 4.6 percent in 2030 and 3.6 percent in 2040. One small step in the direction of reform has been taken. In September 2024, the government announced that the retirement age would inch upward to sixty-three for men, fifty-nine for women in white-collar jobs, and fifty-five for other women in the workforce by 2040.
There is danger of losing sight of the forest for the trees. Growth potential in the 2–4 percent range sounds minuscule in comparison with China’s heady growth rates of the early 2000s. However, in comparison with other countries, including the U.S., it is still substantial. The Congressional Budget Office (2024) estimates potential U.S. GDP growth at 2.1 percent through 2034 and 1.6 percent for the following two decades. Long-term growth rates on China’s periphery, in Vietnam and the Philippines in particular, may exceed 4 percent and India’s could be even higher. In comparison with the U.S. and Canada, the E.U., and Japan and Korea, however, China’s potential long-term GDP growth is robust.
Has Productivity or Investment Driven GDP?
Xiaodong Zhu’s chapter, “China’s Productivity Challenge,” challenges the conventional wisdom about China’s rapid economic growth from reform and opening (roughly 1978) to the 2007–2009 GFC and the slowing of growth since. The conventional wisdom, simplified, is this: China’s growth throughout has been driven more by investment than consumption, especially investment in heavy industry, infrastructure, and real estate. By most accounts, fixed-asset investment has accounted for about 40 percent of Chinese GDP growth since 2000 despite the emergence of an urban middle class whose size exceeds the entire U.S. population. In the early stages of China’s post-1978 development, investment improved living standards and yielded solid economic gains. Later, high levels of investment continued to fuel GDP growth, but excess capacity became legion in industry (China’s overcapacity in steel exceeds the total steel output of the EU), infrastructure (“zombie” rail lines and stations abound as China’s railway debt approaches US$1 trillion), and real estate (where by some accounts there are enough empty flats to house China’s entire population). Ultimately, excess capacity has driven returns downward and today throttles economic growth. The investment story could easily be recast as a productivity story: Excess investment has sapped productivity (because the value of outputs hasn’t increased as fast as inputs) and hence economic growth, but the conventional wisdom is that investment per se has been the culprit.
Based on years of research, Zhu challenges the thesis. The key assumption – possibly controversial – is that real investment should be compared to real GDP, here in 1978 prices, rather than comparing nominal investment to nominal GDP. The difference is quite dramatic: The real investment rate, that is, real investment as a percentage of real GDP, fell from 30 percent in 1978 to 15 percent in 1990 and returned to 25 percent (rather than 40 percent) in the early 2000s. Two key findings follow. One is that real investment contributed only slightly if at all to GDP growth. A simulation using the Solow growth model where the real investment rate was constrained to 15 percent yielded 8.5 percentage point GDP growth per year from 1990 to 2007 in comparison to actual GDP growth of 9.5 percentage points per year. A similar simulation from 2007 to 2022 where the real investment rate was assumed to increase 0.65 percentage points per year from 2014 yielded annual GDP growth rates about 0.5 percent higher than actual GDP growth during this period. The second finding is that TFP growth has tracked Chinese GDP growth closely. Visually, the correspondence of TFP growth with GDP growth is striking as are two key data points: TFP growth averaged 4 percent during China’s period of rapid GDP growth through 2007 and has remained 1 percent since when GDP growth has been anemic.
Zhu next asks what lies behind China’s initial TFP growth and its subsequent deceleration. While some “potential sources” of productivity growth are well understood, others are surprising, even counterintuitive. Among the early sources of productivity growth was agricultural reform, resulting in increased output and, simultaneously, a shift of agricultural labor to industry, largely to private and township-and-village enterprises rather than state-owned enterprises (SOEs). The most dramatic gains in agricultural productivity occurred well before 2007. Collective production in agriculture (called the team production system) was fully displaced by the household responsibility system by 1983. Zhu notes that gains in agricultural productivity and labor reallocation from farm to industry contributed 1.5 percent to overall Chinese TFP growth from 1978 to 2007 with much of this contribution” occurring in the 1980s when agriculture remained a large portion of the Chinese economy. TFP growth within Chinese agriculture peaked a decade later, from 1995 to 2000, before decelerating sharply and somewhat inexplicably from 2000 to 2007 (Wang et al. Reference Wang, Tuan, Gale, Somwarum and Hansen2013).
The account of trade liberalization is more counterintuitive. The conventional wisdom is that China’s 2001 accession to the World Trade Organization (WTO) exposed its economy to global competition, forcing productivity improvements. Actually, according to Zhu, international trade liberalization from 2000 to 2005 contributed only 1 percent per year to TFP growth, while during the same period domestic trade liberalization, the diminution of interprovincial trade barriers, contributed 2 percent per year. From 2005 to 2010, however, both international and internal trade costs appear to have decreased China’s GDP growth (and, by implication, productivity growth), internal trade costs far more than international costs, despite China’s massive investment in high-speed rail, railways, and airports (Hao et al. Reference Hao, Sun, Tombe and Zhu2020). A better understanding of whether and why domestic trade barriers resurfaced post-2005 (or post-Global Financial Crisis) is essential to understanding the arc of the Chinese economy.
Zhu also cites a series of institutional factors contributing to Chinese productivity growth. Hukou (household registration) reform appears to have facilitated internal migration and accelerated productivity growth by 1–1.2 percent per year at least through 2015. What Zhu calls “bottom-up institutional change” encompassing the household responsibility system, the emergence of township-and-village enterprises, and even the mantra of “grasp the large, let go of the small” SOEs in all likelihood contributed substantially to productivity gains prior to 2007. Trade-driven technological innovation may also have contributed to pre-2007 productivity gains.
The details notwithstanding, Zhu’s message is clear: Productivity, not investment, drove China’s pre-2007 growth; the quantifiable drivers of productivity growth were agricultural productivity, internal migration, and the diminution of internal trade barriers; non-quantifiable institutional changes also contributed significantly to productivity growth. Post-2007, most of the drivers of growth, save for internal migration, were attenuated due largely to an expanded state presence, in response to the GFC, in the Chinese economy.
Has the “Demographic Dividend” Been Spent?
Feng Wang, Ke Shen, and Yong Cai have an entirely different perspective on the Chinese economy. Their chapter, “When the Abundance Ends,” reserves mention of productivity and GDP until the closing paragraphs. The focus, instead, is principally on the gap between household earnings and consumption: When earnings exceed consumption, there is a surplus and hence abundance, but when consumption exceeds earnings, abundance ends. Moreover, abundance or its reversal in their view is driven principally by the intersection of demography with changing patterns of household consumption, and to a lesser extent, with shifts in ages of peak earnings. The revolution in Chinese agriculture, migration, domestic trade barriers, and institutional changes other than family planning policies are barely mentioned. A key result is a revised understanding of China’s “demographic dividend.” The demographic dividend is generally understood in population terms as a sharp increase in the working-age population relative to total population caused by a dramatic decline in fertility (from 7.5 births per woman in 1963 to 1.2 births in 2021 per the World Bank (n.d. (d)).Footnote 12 The increase in the working-age population in proportion to total population was temporary, however. As smaller cohorts work their way up the population pyramid, the working-age population in proportion to total population begins to shrink so that the demographic dividend turns into a demographic deficit. If working age is defined as 15–64, then the share of working-age adults in China rose from 70 percent in 2000 to 75 percent in 2010 and then fell to 68 percent in 2021 per Feng et al. A narrower definition of working age more consistent with the official retirement age of sixty for men and fifty-five for women yields an even smaller proportion of people currently of working age. According to a recently released National Bureau of Statistics report, China’s age 16–59 population was only 62 percent of the total population at the end of 2022 (Cheng, Reference Cheng2023).
Feng et al. think of the “demographic dividend” differently. Rather than a population number, either a low ratio of the under 15 and over 64 population to 15–64 population (the dependency ratio) or, its reciprocal, a high ratio of 15–64 to under 15 and over 64 (the effective support ratio), the demographic dividend is an economic number, surpluses or deficits accruing at the intersection of demography and age-specific income and consumption (or lifecycle surpluses or deficits). To illustrate the difference: China’s support ratio peaked in 2013, about the same time economic growth decelerated sharply, and the support ratio appears to account for 15 percent of China’s 1980–2010 increase in per capita income. Income, however, is only half the story. The other half is expenditures since the balance of income and expenditures determines the level of abundance or scarcity people experience. Using National Transfer Accounts (NTA) methodology that has been applied worldwide, Feng et al. calculate per capita lifecycle surpluses and deficits as well as aggregate surpluses and deficits in China for the early 2000s.
The results are striking. Per capita lifecycle surpluses (deficits) have shifted dramatically over time. In 2002, dependent populations had modest lifecycle deficits while surpluses for people of working age were also modest. By 2018, per capita deficits and surpluses were three to four times larger for dependent and working populations, the deficits caused largely by education (for the young) and health care (for the elderly). China’s aggregate lifecycle surplus quintupled from 2002 to 2014 but then dropped by 60 percent from 2014 to 2018 due to the combined effects of aging and a sharp increase in lifecycle deficits for the elderly. Looking forward, it appears likely that China’s lifecycle surplus will turn to a deficit, and abundance to scarcity. An easing of housing costs could mitigate the scarcity but have untoward effects as well. Raising the official retirement age could reduce lifecycle deficits of the elderly, if wages were maintained with age. A sharp increase in productivity could also shift the balance of incomes and expenditures, but this would depend on a reduced state presence in the Chinese economy, currently uncertain at best.
How Should China Pursue Innovation?
The message of Kevin Zheng Zhou and Meitong Dong’s “Innovation in China: Drivers, Challenges, and Future Directions” parallels in some respects Xiaodong Xu and Feng et al. It is that the policy-driven, that is, top-down, Chinese innovation system has yielded mixed results. The 1985 PRC patent law was followed closely by the “Decision on the Reforms of the Science & Technology (S&T) System” that reformed the central science and technology apparatus while introducing technology markets into China, the latter “an abrupt departure from previous thinking, which treated the product of mental labor as a public good that could not be privatized,” intended to speed the application of research results to production (Simon, Reference Simon1989: 608–609). China’s S&T objectives were subsequently shaped by the 1995 Decision on Accelerating the Progress of S&T and the 2006 National Medium and Long-Term Plan (MLP) for the Development of Science and Technology. The MLP called for increased R&D expenditures, indigenous innovation, and reduced dependence on technology from overseas, the last reversing language in the 1985 Decision aimed at expanding technology imports. The 2006 MLP also set aggressive targets for patents and scientific citations that would place China among the top five nations globally (Sun and Cao, Reference Sun and Cao2021).
The MLP immediately impacted the volume of new patents. Data from the State Intellectual Property Office (SIPO) assembled by Zhou and Dong show that patenting was quiescent before 2006 after which it took off exponentially: Barely 300,000 patents were granted in 2006 compared to 4.6 million in 2021. Recently, however, nearly two-thirds of Chinese patents have been utility patents on minor inventions for which there is no U.S. provision, as distinct from patents on major inventions and designs.Footnote 13 Foreign patents as a percentage of SIPO-granted patents peaked in 2005 at about 20 percent and have since fallen below 5 percent. The largest number of foreign patents are granted to Japanese entities. Of firms listed on the Shanghai and Shenzhen stock exchanges, private enterprises have been granted nearly five times as many patents as SOEs. However, patenting by listed private firms has declined since 2018 while patenting by SOEs has increased. Patents are most heavily concentrated in China’s coastal regions from Beijing to Guangdong as well as Chongqing but sparse in China’s northeastern rust belt of Liaoning, Jilin, and Heilongjiang as well as most interior provinces. Zhou and Dong also show a close correspondence of FDI inflows with patenting. Overseas patenting by Chinese firms, however, appears to be driven mainly by subsidies offered by the Chinese central government. And they question whether collaborative innovation with Belt and Road partners will contribute to China’s technological capabilities. They do raise the possibility of breakthrough innovations in electric vehicle technology, semiconductors, and digital innovation, the latter exemplified by companies such as ByteDance and Shein. These instances notwithstanding, Zhou and Dong question the long-term efficacy of China’s reliance on policy-driven and domestic sources of innovation. Open innovation and openness to innovation from advanced countries, according to Zhou and Dong, will best accelerate China’s technological progress and hence China’s productivity and growth.
Can the Surfeit of Real Estate Be Unwound?
Wei Xiong’s chapter, “Derisking Real Estate in China’s Hybrid Economy,” asks how the risks inherent in an outsized real estate sector can be managed. As to the size of the Chinese real estate sector, though estimates vary, real estate accounts for around 30 percent of Chinese GDP when inputs like supporting infrastructure are included (Rogoff and Yang, Reference Rogoff and Yang2021). Sixty to seventy percent of household wealth is real estate and the share of local government revenues from land sales peaked at 30 percent in 2021. Xiong argues that a hybrid model of real estate combining ultimate government land ownership with private markets for development and sales could, in principle, manage these risks. Optimally, urban planning would guide government land sales that, in turn, would fund infrastructure development. At the same time, development and sales of residential units by private real estate firms would promote efficient markets and provide market signals that would, in turn, guide government land sales. Under the hybrid model, “ … state intervention and the market complement each other, balancing market externalities and promoting economic efficiency.”
What has gone awry – why hasn’t the hybrid model curbed the excesses of the real estate market? The real estate story parallels Michael Song’s account of excessive investment in infrastructure: Local governments lost control of their finances due to Zhu Rongji’s 1994 tax reforms, the central government mandated local governments to fund 70 percent of an RMB 4 trillion stimulus package in the wake of the GFC, and the PBOC and CBRC relaxed limitations on local government borrowing and issued guidance for the use of LGFVs to borrow in support of stimulus-mandated projects, real estate especially. Mandated expenditures under the stimulus package in conjunction with career incentives rewarding government officials for local GDP growth – recall that the calculation of GDP depends on what is spent and is insensitive to debt – fueled a frenzy of LGFV borrowing that has resulted in a vast oversupply of housing where, by some calculations, the entire Mainland population could be accommodated in apartments that currently stand vacant.
Loss of local fiscal autonomy and the excesses of LGFVs, however, are only part of the story. The other part is – or was – the seemingly unlimited appetite for risk of Chinese real estate firms and households. Confirmation bias operated: So many units were built and prices escalated so rapidly that a downturn was unimaginable. And implicit guarantees including government-mandated price floors encouraged widespread discounting of risk. Rather than curbing the excesses of the public sector, then, real estate markets exacerbated these excesses until they were rudely awakened by the August 2020 “three red lines” capping the indebtedness of real estate companies that had been borrowing from LGFVs and their customers. Chinese real estate has since been troubled. Prices are down, especially in second- and third-tier cities, and real estate giants like Country Garden and Evergrande remain perilously close to bankruptcy.
What is the exit path – how can Chinese real estate be restored to health? Xiong suggests that while government policies can be adjusted to avert a hard landing in real estate, only a return to rapid economic growth offers a permanent solution. The question, then, is where China will find a growth engine to replace real estate. And absent a new growth engine, Xiong asks, will the government be tempted to try to restart real estate and infrastructure development and with what consequences for these already overextended sectors?
How Far Does Chinese State Control Extend?
Jeff Cai, Xian Gu, Linda Zhao, and Wu Zhu’s chapter, “State Ownership in China: An Equity Network Perspective,” states that understanding SOEs is the key to studying the Chinese economy if only because of SOEs’ inferior performance and reliance on cheap credit and outright subsidies (Harrison et al. Reference Harrison, Meyer, Wang, Zhao and Zhao2019). It further argues that widely used data from the Chinese Ministry of Finance, State-Owned Assets Supervision and Administration Commission of the State Council (SASAC), and the National Bureau of Statistics greatly understate the extensiveness of state ownership whether gauged by the number of enterprises or their assets. To gauge actual state ownership, Cai et al. utilize firm registration and ownership data from China’s State Administration of Industry and Commerce (SAIC) covering upwards of 90 million firms as of 2017. These data, which include the names of shareholders and their shareholdings, allow the construction of ownership trees whose roots are 127 central government SOEs, 850 provincially owned firms, and nearly a quarter million SOEs directly owned by municipal and county governments. How far the branches of these trees extend and how many firms they encompass then depends on the ownership threshold chosen: 100 percent (wholly state-owned), 50 percent (majority state-owned), 30 percent (here called relative state control), and 10 percent or nonzero (partial state control). At the 100 percent ownership threshold, Cai et al. find a total of 37,991 central, 36,056 provincial, and 299,665 municipal or county SOEs in the SAIC dataset. At the 30 percent ownership threshold, the numbers of central, provincial, and local SOEs are 116,972, 113,336, and 489,872, respectively. Whatever the threshold, the total number of SOEs found in the SAIC data far exceeds other estimates of the reach of Chinese state ownership, though in some instances state ownership is restricted to centrally owned SOEs. Carsten Holz (Reference Holz2018), for example, found the Chinese Finance Ministry claimed full, majority, or relative control of 167,399 firms in 2015, while SASAC claimed a subset of 124,966 of these. Note, however, that the definition of relative control used by Holz is broader than Cai et al., since it encompasses firms less than 30 percent state-owned where the state retains control rights.Footnote 14
The reach of the state into business enterprises, whether measured by the number of enterprises controlled by the state or the aggregate capital of enterprises under state control, may be less significant than how this reach has shifted over time. This shift, consistent with the doctrine of “mixed ownership reform” promulgated by Xi Jinping in 2013, points toward more extensive state ownership at lower thresholds of control and at lower levels of the economy. To illustrate: From 1999 to 2017, the total capital of SOEs in proportion to the entire Chinese economy decreased if SOEs were defined using 30–100 percent state-ownership control but increased when the SOEs were defined using a threshold of state ownership below 30 percent. Further, from 1999 to 2017, the total capital of SOEs in proportion to the Chinese economy increased sharply for local SOEs, somewhat for provincial SOEs, and actually decreased for central SOEs. The SAIC data, moreover, do not capture increased influence of the Communist Party even in wholly private enterprises, more than half of which today have party branches.
Why ultimate government ownership, especially local government ownership, of business enterprises has spread rapidly in China still requires explanation given the inefficiencies associated with state control. There are two simple – and opposing – explanations. One is that Xi Jinping’s calculus places ideological objectives, specifically extending the power of the state, ahead of efficiency, as Kevin Rudd (Reference Rudd2023) and many others have argued. The other is the rise of an intermediate form of organization, state shareholding companies relying on private investment managers to deploy state assets. These assets totaled 17 trillion RMB by 2017, nearly half of which were managed by shareholding companies owned by provincial and municipal governments (Chen and Rithmire, Reference Chen and Rithmire2020). A further explanation is the growth of LGFVs. Daokui Li (Reference Li2023) has suggested that extended ownership chains may be partly due to nesting or pyramiding of LGFVs. According to Li, many LGFVs are organized vertically such that each is fractionally owned by a parent and, in turn, holds fractional ownership of several layers of subsidiaries: “Typically, local governments register a parent company, such as a local government financing vehicle (LGFV). This parent entity secures financing with, say, 30–40 percent comprising borrowed capital and 60–70 percent being its own funds. This parent company then invests in a subsidiary, which in turn borrows more and invests in a sub-subsidiary, and so on.”
The nested financial structure, according to Li, is constructed to conceal the true amount of LGFV indebtedness since much of their reported capital is in fact debt. Li estimates the actual 2020 LGFV debt at 90 trillion RMB or 88 percent of Chinese GDP. This is about 150 percent of IMF and World Bank estimates of LGFV indebtedness and far beyond the capacity of local governments to repay.
How Open Is China – and Will China Remain Open?
The path forward for China’s overseas trade and especially its export engine is less fraught than for real estate. Shang-Jin Wei and Xinding Yu’s chapter, “China’s Journey in Embracing Economic Openness: Four Perspectives,” begins by asking how China’s “dual circulation” strategy should be understood. While several answers are suggested, Wei and Yu argue that the fundamental issue is how China’s engagement with the global economy and the development of the domestic economy as well as the relationship of the two are to be measured since one is not necessarily the obverse of the other. Their results suggest a dynamic of the Chinese economy not captured by GDP and productivity measures. Wei and Yu begin with a conventional measure of openness, the trade ratio calculated as exports plus imports divided by GDP. China’s trade ratio rocketed from 10 in 1978 to 64 percent in 2006, two years before the GFC, before settling back to around 38 percent currently. They next construct a cross-national measure of expected or “normal” openness where the trade ratio is estimated as a function of a country’s GDP per capita and GDP using cross-country data. Here, China’s actual openness greatly exceeds the predicted openness in 2006 but falls close to its predicted value by 2021. The simplest conclusion is that China’s trade openness today is unexceptional, “only slightly higher than what one would have predicted based on cross-country experience.” Another measure of concern is China’s current account surplus, which increased sharply after its WTO accession and tariff reductions. Wei and Yu suggest counterintuitively that tariff reductions and hence openness may be consistent with growing surpluses: a “ … decrease in the price of imported products leads to a decrease in the price of the ‘capital’ factor used intensively in the production of imported products …” and hence “ … a capital outflow and a current account surplus for the country.”
Beyond openness, Wei and Yu then explore the quality or sophistication of Chinese exports. The measure of quality is itself sophisticated: It is based on an estimate of the technological level of each product in a country’s export bundle (intuitively the weighted average GDP per capita of countries exporting a given product) times the share of that product in the bundle. Here the results are stunning: From 2006, China’s export sophistication has greatly exceeded other large developing countries (Brazil, India, Indonesia, and Russia) and the expected level of export sophistication predicted from its GDP per capita and GDP based on a cross-country regression. Wei and Yu also develop several broader measures of openness incorporating both the role of foreign-invested firms in domestic production and trade openness; specifically, the broader measures incorporate the role of foreign-invested firms not only in their direct exporting activities but also in their sales in the local market and in supporting domestic firms’ production. China’s openness by this broader measure is about 50 percent higher than looking at the export activities alone, but interestingly, the broadly defined economic openness measure also peaked around 2006. Yet China remained above the U.S. and Japan for two decades according to this broader measure of openness. Only time will tell whether China can remain as open in the rapidly evolving geopolitical environment and whether it can continue reaping the benefits of openness while averting the risks. Microsoft’s decision on maintaining its China-based artificial intelligence (AI) laboratories is emblematic of the choices ahead.
Will the Renminbi Dominate?
Bin Wei and Vivian Zhanwei Yue’s chapter, “RMB Internationalization and Digitization,” explores the gap between the strength of the Chinese economy, the second largest globally, and the somewhat weaker international position of China’s currency, the renminbi (RMB), vis-à-vis the U.S. dollar, the euro, the British pound sterling, and the Japanese yen. Internationalization refers to a currency’s acceptance and usage outside of the country where it was issued. A currency is internationalized to the extent that it is used to settle overseas transactions, is freely convertible to other currencies, is held in the reserves of foreign banks, and is regarded as a “safe haven” whose value will hold in periods of economic turbulence. The RMB’s recent record on these dimensions is mixed. The use of the RMB to settle trade in goods and services under current account has risen dramatically but unevenly since 2010. The settlement of cross-border investments in RMB also rose unevenly in the 2010s. Though it is the fifth most traded currency globally, the RMB’s share of turnover in foreign exchange markets remains small, 7 percent – note that foreign exchange percentages total 200 percent because both sides of transactions are counted – and about 3 percent of foreign reserves globally were in RMB as of the third quarter of 2022. Limited convertibility of the RMB on capital accounts remains an obstacle to its international acceptance as do concerns about the soundness of Chinese financial institutions.
Digitalization of the RMB potentially gives impetus to RMB internationalization since the digital payment system as currently designed will interoperate with many foreign currency platforms. Interoperability potentially advantages the RMB vis-à-vis other currencies by speeding cross-border transactions and lowering costs – and shielding targeted individuals and firms from U.S. sanctions by circumventing correspondent banks. However, a digital RMB may not prove as advantageous domestically where few consumers can see the difference between digital platforms making payments in nondigital currency and payments made directly in digital currency. Together, AliPay and WeChat Pay have more than a billion users and a 92 percent share of China’s digital payments market, while the e-RMB’s domestic market penetration remains minuscule (Orcutt, Reference Orcutt2023). There’s also the question of what role remains for commercial banks should e-RMBs issued and traceable by the central bank, the PBOC, become widely circulated.
The End of Reform and Opening?
After more than four decades, has Xi Jinping chosen to end China’s grand experiment of “reform and opening”? The experiment appears to have been an unqualified success. The plainest of statistics tell the story of economic growth and poverty alleviation. From 1978 to 2021, China’s per capita GDP rose from $381 to $12,175 in constant 2010 U.S. dollars (World Bank, n.d. (f)). The number of Chinese living in extreme poverty shrank by nearly 800 million, accounting for close to three-quarters of the people lifted from extreme poverty globally. Whether any economy can sustain this pace of growth for four decades or longer was addressed in our opening session. Here we confront a somewhat different question: whether China’s leadership intends to retain economic growth as a top priority or to subordinate growth to other objectives.
Yasheng Huang suggests that China’s leaders may have, for now, strayed from economic growth. In his chapter, “The Political Economy of Common Prosperity,” he characterizes Xi Jinping’s common prosperity program as a “policy pivot” that represents an epochal change with the objective of shifting power away from private capital and toward the state, and he argues that it has little or nothing to do with altering the overall distribution of wealth. In Huang’s language, common prosperity aimed to “cut the corporate sector to its appropriate role.” To be sure, common prosperity was advertised as evening out imbalances, improving public services, and revitalizing rural communities. But the actual policy target was the immense wealth accumulated by entrepreneurs in industries like private education, online video gaming, entertainment, and technology; yet few, if any, steps were taken to increase labor’s share of income or the household share of GDP, which remain intractably low for a country at China’s level of development. Huang finds the forced charitable contributions of firms such as Pinduoduo and JD.com all but risible. Ultimately, he argues, the common prosperity program will prove self-defeating since it is fundamentally predatory and will “accentuate the secular economic slowdown that is already well in place” and ultimately detract from China’s actual common prosperity goals.
Barry Naughton’s chapter in this volume, “The ‘Summer of 2021’ and the Trajectory of China’s Economic System,” by contrast, sees a diastrophism, a reconfiguration of China’s economic landscape, “the crystallization of qualitatively different economic system.” The reason is not simply the “summer storm” of regulatory crackdown on some of China’s most prominent and prosperous firms. It is further, according to Naughton, a much-enlarged set of policy objectives tantamount to new rules for economic decision-making – as to both who makes decisions and how decisions are made. The “summer storm” actually began in August 2020 with the “three red lines” limiting the borrowing of real estate firms, which led to significant liquidity problems and, in several cases, default of the Chinese real estate developers. Two months later, Alibaba’s Jack Ma made his now (in)famous speech at the Lujiazui economic forum where he chided bankers and bank regulators for archaic practices. Shortly after, the regulators canceled the listing of Alibaba subsidiary Ant Financial, slated to be the largest IPO ever, and Ma then went into exile in Tokyo for nearly two years. And in July 2021, the Cybersecurity Administration of China (CAC) opened an investigation of Didi Global, the ride-hailing app, that culminated in its delisting from the New York Stock Exchange a year later. The shadow of Didi remains: Currently the CAC is reviewing how Shein, among the leading makers of ultra-fast fashion, handles information about its Chinese contractors and suppliers, which may, like Didi, derail Shein’s U.S. listing.
The underlying policy objectives, Naughton argues, multiplied as the “summer storm” intensified. These include common prosperity, a reversal of population decline, strengthening the manufacturing base, information security, and what Naughton calls “self-strengthening” or toughening of society, as, per Xi, hard times may lie ahead: “ … we are bound to encounter headwinds” (Ministry of Foreign Affairs, 2023). De-emphasized was GDP growth and the shifting of growth drivers from investment to household consumption. Moreover, “ … the multidimensionality of the demands … shows that the objective instead is to generate an ongoing responsiveness to a variety of policy objectives, which can be constantly updated or changed … this [is] a change in the decision-maker’s objective function and decision criteria, rather than a change in regulatory framework.”
Compounding the multiplicity of goals has been the vagueness or inconsistency of policy instruments with which to reach these goals, for example, tax or welfare reforms that might level income inequalities have been conspicuously absent. This has been coupled with a degradation of Chinese economic and other key data. The consequence is not only that the incentives for economic growth have been significantly weakened since 2021, but the signals needed for businesses and government to adjust to circumstances have also faded.
Naughton raises some extraordinarily interesting questions. For example, was China’s phase of rapid growth due to the success of a principal-agent model applied at huge scale – pursuing GDP targets single-mindedly and rewarding officials meeting these targets? And was the subsequent decline in growth rates due to the abandonment of this model as objectives multiplied and their inconsistencies became manifest? Or, contra Naughton, was the setting of GDP targets itself inherently flawed? There is reason to believe the latter. Large-scale target setting is characteristic of command economies. An entire genre of Soviet poster art is captioned, “We shall fulfill and overfulfill the plan for …” or “We shall fulfill the five-year plan …” And a large literature on the economy of the FSU argued that while plans were fulfilled, often they were not fulfilled as intended. A plant with a tonnage quota for iron pipe would make thicker and heavier pipe without producing more pipe. The late Martin Weitzman took this argument a step further in his “ratchet model” of command economies where quotas are shown to be self-defeating: Apparatchiks rewarded for fulfilling quotas would also be punished with higher quotas the following year – this is the ratchet. Anticipating the ratchet, many managers would deliberately miss their quotas causing output to lag rather than grow (Weitzman, Reference Weitzman1980).
The peculiar nature of GDP growth compounds the target-setting problem. As we discussed previously, the usual measure of GDP is based on expenditures – consumption, investment, and net exports. Thus, incentivizing GDP growth means incentivizing expenditures, mainly investment, as China has done, because investment is much more amenable to the control of the local government officials. Much of the investment is borrowed – to which simple GDP growth measures do not capture – and, of late, of limited economic value, for example, China’s ghost cities and the suspension bridges of Guizhou Province, population 38.5 million or 3 percent of China, with 40 of the 100 highest bridges in the world (Yang, Reference Yang2020). The consequence of overinvestment, however, is the erosion of productivity growth, which, as argued most forcefully in Chapter 2, is the ultimate driver of GDP growth. Hence, setting GDP growth targets, while effective in the short run to motivate local government officials, ultimately proves self-limiting. As several authors point out, while almost any investment works out in the early stages of development, at later stages investment proves not to be the nostrum it once was. And this seems to have been the case with China.
The method of William H. Overholt’s chapter, “China’s Coming Era of Slow Growth,” is different. In Overholt’s analysis, the minutiae of GDP are incidental; instead, what is central to his analysis is a developmental construct, the East Asian development model, a distillation of the key elements of the high-growth economies on the periphery of Mainland China.Footnote 15 These elements include a priority for economic (read: GDP) growth, centralized and technocratic management, rapid infrastructure development, and gradual opening to foreign trade and investment. GDP growth holds at 10 percent for a generation in the model and 7 percent for “a few years” before settling in the vicinity of 3 percent. Somewhere on this path, the “complexity revolution” is encountered. Though Overholt is not especially clear as to its details, the general notion is that once everyone has adequate food and shelter, economic diversification (of goods and services) and political diversification (of interests) follow. Central planning and autocracy accommodate complexity poorly, and countries tracking the East Asia development model move toward decentralization and democratization.
China has not done this, however. To paraphrase Overholt, China has chosen to fight the complexity revolution rather than leveraging it. The fight is at multiple levels. And it is likely to be lost due to a “collection of depressive trends” including the insertion of party cadres into senior levels of private and state-owned enterprises, investment in manufacturing industries already rife with overcapacity, discouragement of entrepreneurship, quashing of private and English-language education, a state school system more fit to the twentieth century than the twenty-first century, resistance to property taxation to temper speculative bubbles, resistance to policies favoring household consumption over fixed-asset investment, and choking off discourse with foreign scholars and elites.
China faces a myriad of risks, but for Overholt, the greatest risk lies in the deterioration of the U.S.–China relationship where the U.S. appears to have greatly overestimated China’s economic and military capacities as it did with the FSU. The concern is that designation of China as a strategic competitor will descend into an adversarial relationship, economic warfare, and then limited war or worse. Overholt tells us that the tide has changed in China – we prefer to say the tectonics have changed. Overholt, the author of The Rise of China (1994), tells us that China’s rise is no longer inexorable. And Overholt tells us that elites seldom take cognizance of tidal or tectonic changes until they must, until “institutionalized doctrine hits a brick wall.” We are hoping for a landing on a softer surface, for reasoned discourse relying on established knowledge and the work of scholars in this volume, and for recognition that, in the long run, command economies simply don’t work very well for a complex modern economy, even with all the advancement in digitization of the economy and in computing power.
The Arc of the Chinese Economy
After forty years of rapid economic growth, China will inevitably shift away from a single-minded focus on GDP growth. The Chinese government has gradually adopted other objectives such as common prosperity, “high-quality growth,” and, more importantly, security, including economic, national, and social security.Footnote 16 The old growth model, which relied heavily on investment and exports and benefited tremendously from “catching up” and the demographic dividend, no matter how the dividend is construed, will inevitably change. China does not have the choice of staying put.
The transition to a new growth model is challenging and carries myriad risks. For example, for Chinese growth to wean off its reliance on investment and export, domestic consumption must grow. However, China’s 2021 household consumption in proportion to GDP was 34 percent, among the lowest in the world, compared to 68 percent in the United States, 60 percent in India, 49 percent in South Korea, and the OECD average of 60 percent.Footnote 17 Perhaps the first objective of a common prosperity program should be encouragement of household consumption via a strengthened social safety net. Regrettably, it appears that debt-ridden local governments are currently moving in the opposite direction by reducing retiree medical benefits.
Another risk is the downturn of the real estate sector that, together with real estate-related industries, accounts for nearly 25 percent of the Chinese GDP. The cooling of the Chinese real estate carries significant risk for the local governments, nearly 40 percent of whose revenues have been from land sales. Indeed, the bursting of Chinese real estate sector coupled with declining population for the first time since the 1959–1961 Great Chinese Famine raises the specter of Japanification. The similarities to Japan are indeed real. But as pointed out by Goldman Sachs (2023): “… while deteriorating demographics, a debt overhang, and an asset-bubble-burst were all important ingredients to Japan’s malaise at the turn of the century, a key contributor to its Japanification was a fundamental change in longer-term growth expectations.”
Avoiding a Japanese-style slump will crucially depend on the Chinese government’s ability to manage growth expectations. So far, signs of success are scarce. A key measure of expectations is consumer confidence. The OECD’s (2025) composite consumer confidence index for China plummeted from the mid-120s to the high 80s in April 2022 and has not recovered since.
Still, several factors could help China avert Japanification. First, China’s GDP per capita relative to the United States remains significantly lower than Japan’s in the 1990s, hence the Chinese economy arguably has a higher potential growth rate. Second, whatever happens in the Chinese stock market is far less likely to spill over into the real economy than in Japan. Mainland stock markets have consistently underperformed both the Chinese economy and the stock markets of other developing economies. And Chinese stock market bubbles have been far less pronounced than the Japanese market bubble of the late 1980s.Footnote 18 Third, while China’s deteriorating demography will no doubt exert significant fiscal pressure on the pay-as-you-go pension and health care systems, workforce decline need not be a major drag on Chinese economic growth as it has been for Japan. The quality of Chinese human resources is increasing. Current retirees born in the 1950s and 1960s tend to have low levels of human capital and thus are the least productive, while younger cohorts are far better educated. Further, the impact of an aging workforce can be partially offset by labor-replacing technologies, including robotics and AI. China is currently the country with the largest number of industrial robots, though the robot density remains lower than Korea or Japan. Also critical is repopulating China’s workforce, which could be accomplished by raising the retirement age more rapidly than currently planned and to the OECD level of sixty-six for men and women. Reform of the pension system together with job redesign and transition to a more service-oriented economy could facilitate retaining near-retirees in the workforce. And given wide rural-urban and regional imbalances, China’s urban workforce could grow even as the overall population and workforce decline (Fang, Reference Fang, Melissa, Schardin and Pardue2023). These notwithstanding, high youth unemployment rates suggest that there is no labor shortage in China – for now. Whether due to a statistical anomaly, since rectified, created by classifying student job seekers as unemployed or the cultural anomaly of young people withdrawing from the labor force by “laying flat” or a mismatch between available jobs and the skills of recent graduates, a surfeit rather than a shortage of labor seems to be indicated.
Japanification may also depend on whether the Chinese people and the larger global community retain confidence in China’s long-term prospects. There is tangential evidence. Multiple surveys confirm that the Chinese public consistently expresses high levels of trust in government and business.Footnote 19 While surveys exaggerate the level of political trust in China due to social desirability, people’s tendency to give “right” answers when asked their opinions (Nicholson and Huang, Reference Nicholson and Huang2023), there is no evidence suggesting that trust in business and government is higher in Japan – and the U.S. – than China.Footnote 20 Premier Li Qiang has said, “… we have notable institutional strength” (Embassy of the People’s Republic of China in the United States of America, 2023). It is possible that he is right. The confidence of the larger global community is more tenuous as evidenced by a simmering U.S.–China trade war and China’s push for “dual circulation,” sometimes understood as leveraging a strong domestic base to expand but to rely less on overseas markets.
Ultimately, three sets of forces and their intersection will shape the trajectory of the Chinese economy over the next ten to fifteen years: the political economy, the relationship with the West, and fundamental economic and demographic change (Fang, Reference Fang, Melissa, Schardin and Pardue2023):
1. China’s internal political economy will determine the relationship between the state and the market. The CCP’s primary objective is to maintain its political power, which makes economic growth secondary to preserving regime stability. In response to perceived internal and external threats, the CCP has turned to more centralized economic policies and tightened regulation of firms in order to solidify its political control.
2. China’s relationship with the U.S.-led West will determine China’s access to foreign technology, finances, and markets. U.S.–China relations are at a forty-year low for a number of reasons, including U.S. trade sanctions initiated by President Trump and continued by President Biden, tariffs going into place imminently, the threat the U.S. perceives that China poses to the established global order (such as to the dollar’s global dominance), and tensions that often accompany a rising power challenging an established power (the so-called “Thucydides Trap”). Trade sanctions imposed on China by the U.S. and other Western countries have limited China’s access to foreign technology, finances, and markets. Citing national security concerns, the U.S. Congress and the Trump and Biden administrations have taken actions, and are considering further actions, to decouple the U.S. economy from China’s in several ways, including through new restrictions on trade in response to what the U.S. calls China’s unfair trade practices and cybersecurity threats, and restrictions on Chinese military entities’ access to advanced technologies. Such actions weaken China’s access to the global economic system and further inflame tensions between the two countries. In response to perceived external threats, China is likely to turn further inward as the CCP doubles down on preserving its domestic power through a more centralized economy.
3. Fundamental economic and demographic challenges will weaken China’s economic growth prospects. While China faces serious economic challenges such as an aging population and declining workforce, a real estate bubble, and drastic income inequality, these challenges can be addressed by the right reforms. However, the most significant risk is that necessary reform efforts may be blocked by vested interests (such as executives and workers of SOEs, local governments, and the military) spurred by perceived external threats to China’s national security and perceived internal threats to social stability.
We also believe that China’s obsession with its GDP growth targets may crimp its long-term growth just as production quotas per Weitzman (Reference Weitzman1980) may have crimped the economy of the FSU:
… targets are always two-edged swords, … what you measure rather than what you want is most often what you get. The measure – not the cause – of GDP is output. Short-term GDP targets get you greater output, not the creativity and innovation that are the ultimate sources of efficiency and hence economic growth and improvement in peoples’ well-being
To be sure, the rhetoric of high-quality growth abounds in China. But so do national, provincial, and even local GDP targets and headlines comparing performance against targets. And these headlines can be confusing. Twenty-one of twenty-nine Chinese provinces reporting their 2024 GDP as of late January 2025, including Sichuan and Henan, fell short of their targets (Caixin Global, Reference Global2025). Guangdong failed to meet its GDP target for the third year in a row (Zou, Reference Zuo2025). We need not reconcile these reports with China’s 5.0 percent GDP growth in 2024. However, we would suggest that greater attention to structural reform and less attention to GDP targets would be beneficial.
So, the arc of the Chinese economy is hard to pin down, which is not surprising. In a best-case scenario, China would pursue internal market-deepening reforms and policies and policy instruments to revitalize TFP growth. This would require fundamental reform – a withdrawal of the state from large parts of the economy, an understanding of GDP growth as a desirable outcome instead of a tournament whose winners gain political advancement, and a priority for innovation and productivity. Were TFP growth to return to 4 percent, then Chinese GDP could grow steadily by 6 percent annually in the next 10 to 15 years. Critical, however, is where that growth occurs. If 6 percent growth flowed to households and the social safety net, education, and medical care especially, then the Chinese people would be far better off. If, however, China subordinates its market-oriented reform to centralized decision-making, top-down planned resource allocation, and marginalization of private enterprises, then TFP and economic growth could grind to zero. Much will depend on whether the U.S. and China can mend their relationship, which will in turn depend on the direction taken by the CCP. Bluntly, can the Party grasp that innovation and productivity by command are unlikely, that relaxation rather than tightening of political and economic controls is ultimately best for the Party and the people? We worry that the current dynamics may have put China on a path toward diminished economic growth in the name of social and regime stability.
Epilogue
The Arc of the Chinese Economy conference took place in April 2023. The official real GDP growth rate from China’s National Bureau of Statistics for 2023 was 5.2 percent, reaching a total of RMB 129.42 trillion (approximately US$17.79 trillion) after an upward adjustment in December 2024 (National Bureau of Statistics of China, 2024). It should be noted that some analysts held that China’s 2023 official growth rate may have been exaggerated. Daniel Rosen (Reference Rosen2023), for example, argued that “Taken together, depending on how negative property investment is assumed to have been in 2023, China’s 2023 GDP probably grew 0 to 2.5%.” The Rhodium Group headed by Rosen estimates China’s actual 2024 GDP growth at 2.4–2.8 percent, well below the official 5 percent figure (Rosen et al. Reference Rosen, Wright, Smith, Mingey and Quinn2024). The slowdown of the Chinese economy is driven by both the structural issues and more short-term business cycle issues. The structural issues faced by the Chinese economy are well summarized in William H. Overholt’s final chapter in this book. Logan Wright’s (Reference Wright2023: 2) Congressional testimony about the Chinese economy concurs with Overholt: “Simply put, most of the factors that contributed to China’s rapid growth over the past two decades – an expanding labor force, unprecedented credit and investment growth, a booming property sector, a one-time buildup of infrastructure, and a constructive external environment – cannot be repeated in the next decade.”
The second Trump administration may further heighten the U.S.–China trade tension. Regardless of whether, and when, Trump will follow through on his campaign rhetoric that he would impose a 60 percent tariff on all Chinese imports, it is clear that China’s external environment for trade and investment with western countries is not expected to improve, and in fact more likely to deteriorate. The Chinese government has finally come to embrace the importance of stimulating domestic consumption in a series of economic stimulus measures. The first bout of the economic stimulus was unveiled on September 24, 2024, and spearheaded by the PBOC, which came amid mounting pressures from a slowing property market, weak consumer demand, and global economic uncertainties. This bout of stimulus focuses on monetary stimulus, and it features key reductions in the reserve requirement ratio (RRR) and policy interest rates. It also includes measures to support the real estate sector, including cuts to mortgage rates and down payment ratios, aiming to stimulate home purchases. Somewhat unconventionally, the PBOC introduced a liquidity support program for securities and loans to companies for stock buybacks, which is aimed at restoring investor confidence in a flagging Chinese stock market (Interesse, Reference Interesse2024). A more significant stimulus came on December 9, 2024, ahead of the annual Politburo Central Economic Work Conference to set key targets and policy interventions for 2025. It officially shifts China’s monetary policy to “appropriately loose” for 2025, the first easing of its stance in some fourteen years, alongside a more proactive fiscal policy to spur economic growth. Besides the easing of the monetary policy stance, China will step up “unconventional” counter-cyclical adjustments, focusing on expanding domestic demand and boosting consumption (Yao and Zhang, Reference Yao and Zhang2024). The Chinese government has been reluctant in stimulating domestic consumption in dealing with business-cycle downturns and has historically chosen stimulating investment. Stimulating investment has led to production overcapacity, particularly in sectors that are targeted by China’s industrial policy that cannot be absorbed by domestic demand, which must rely on export expansion. Such a strategy is no longer sustainable amid the worsening external trade environment, with both the United States and the European Union threatening hefty tariffs against Chinese imports, particularly on EVs and solar panels. The December 2024 policy announcement for the first time introduced a large consumption stimulus, estimated to be on the order of 10 trillion RMB, to subsidize purchases of new electric appliances and home improvements, including rural homes.
These counter-cyclical measures should not be confused with structural reforms that are necessary for sustained growth. China’s household consumption share of GDP hovered in the 37–39 percent range over the last ten years and stood at 39 percent in 2023, which is significantly lower than the household consumption share of roughly 56 percent of global GDP and 48 percent of GDP in upper-middle-income countries (World Bank, n.d. (e)). Boosting the consumption share requires fundamental reforms in the income distribution and further strengthening of the social insurance programs. One-time consumption stimulus will not solve the structural problems underlying the low consumption share. Large-scale, government-funded infrastructure investments, such as high-speed railways and highways, as an engine for economic growth have run their course as these projects enter into low-returns territory. Private investment must take on increasing importance as local governments are now increasingly saddled with unsustainable debt burdens. But to boost private investment, it is necessary to restart the market-deepening reforms, and the government must reverse the trend of the resurgence of the state (see Chapter 9) and roll back some of the seemingly arbitrary regulations against private business in the past years (see Chapter 8). In addition, the real estate sector, which accounted for close to 20 percent of Chinese economic growth in the last decade, has experienced significant downturns.
What then will be the next engines of growth? It is easy to imagine industries fueling growth: electric vehicles where China today has a commanding lead; electrical generation and distribution where China dominates solar panel production, has perfected ultra-high voltage transmission and may be close to commercializing fusion energy; or generative artificial intelligence where DeepSeek has taken the world by surprise. The question is who China’s customers for its most advanced technologies will be. Domestic demand is likely to remain weak given high levels of household indebtedness, the erosion of household assets as real estate stagnates or worse, and probably more importantly, a less than sanguine outlook among both consumers and producers about the prospect of the engine of economic growth roaring back to life. A rapidly aging population compounds these challenges (Chapter 4). And there will be pushback from overseas markets, including developing countries, should an onslaught of Chinese goods and services threaten jobs or the capacity to develop their own nascent industries. Whether China can achieve balance in several dimensions – economically by encouraging consumption at home, politically by reassuring its trading partners that they will not be swamped by Chinese exports, and socially by rebuilding safety nets making it easier for people to raise children and remain secure in old age – remains to be seen. We believe that the analysis presented by the distinguished authors in this book provides a useful guide to think about these questions and hence the arc of the Chinese economy in the next decade and beyond.
The Arc: Reprise
Two months after submitting the final version of “The Arc …” to the publisher, the second Trump administration imposed tariffs on virtually all imports entering the U.S. and especially steep tariffs, up to 154 percent, on Chinese imports. China responded with tariffs of their own, and at this writing the two countries are at loggerheads. Stephen Miran, now Chairman of the Council of Economic Advisers, has diagnosed the underlying problem as an imbalanced global trading system where “ … persistent dollar overvaluation … is driven by inelastic demand for reserve assets. As global GDP grows, it becomes increasingly burdensome for the United States to finance the provision of reserve assets and the defense umbrella, as the manufacturing and tradeable sectors bear the brunt of the costs” (2024: 1). China is clearly in the crosshairs as its persistent and growing trade surplus with the U.S. is perceived, rightly or wrongly, to have caused the displacement of U.S. manufacturing. The solution envisaged by the second Trump Administration involves steep “reciprocal” tariffs to crimp demand for imports alongside realignment of currencies with a softening of the U.S. dollar vis-à-vis the Chinese renminbi. Miran acknowledges that tariffs and currency realignment will be difficult to implement without disrupting the U.S. much less the global economy: the path to reconfiguring global trading and finance to America’s advantage “… is narrow, and will require careful planning, precise execution, and attention to steps to minimize adverse consequences” (2004: 38). So far, evidence of careful planning and precise execution is scant, leaving the world awash in uncertainty and markets in disarray.
Does this uncertainty alter China’s choices going forward? The reflexive answer is yes, since China’s access to U.S. and E.U. markets will likely be further constrained by steep tariffs – the ASEAN countries have already displaced the U.S. and E.U. as China’s largest export destinations, and China’s trade with the Global South is growing rapidly. Still, in our judgment, the fundamental lessons remain intact. Two are critical at this juncture. One is that China’s productivity growth slowdown must be addressed as productivity growth remains the principal driver of continued GDP growth. The other is that household consumption must be buoyed if only to offset the deceleration of exports and fixed-asset investment, especially real estate.
Neither will be easily achieved. Total factor productivity is itself a derived construct (“the Solow residual”) making it difficult to pinpoint its exact causes. What is clear is that Chinese TFP growth fell by nearly half following the GFC and has not recovered since, despite gains in high-profile industries like electric vehicles and solar panels. The remedies per a new Asia Development Bank (2025) report include greater investment in human capital, correcting resource misallocation across industrial sectors and provinces, including redoubling the support for the private sector and facilitating market-based merger, acquisition, and bankruptcy, and greater investment in basic research and breakthrough innovation rather than applied research. Stimulating household consumption may prove more daunting. Household wealth suffered with the deterioration of the real estate market, and consumer sentiment remains weak. One-time measures, for example, government rebates on purchases of large appliances, are palliatives but no more. Ideally, the Chinese government would bear more of the risks, especially health care and retirement costs, currently left to households and constraining spending. While the logic of shifting risks from households to the government seems impeccable, whether the government can afford to bear these risks remains uncertain given that tax revenues in China are at best stagnant (Wright, Reference Wright2025). This said, boosting household consumption and service consumption in particular is now the number one economic priority at all levels of Chinese government. China may finally be focusing on its overdue task of rebalancing its economy away from reliance on exports and fixed-asset investment.
A long-run solution to the consumption shortfall, however, must address China’s low labor share of income and extreme income inequality leaving many households without discretionary spending capacity. The Rhodium Group’s Logan Wright (Reference Wright2025) has argued that the government should actively rebalance incomes adding, “Consumption growth will remain tethered to household income growth and will remain constrained by income inequality.” Asked by the South China Morning Post whether a more equitable wealth distribution would spur household consumption, Peking University economist Michael Pettis stated bluntly, “It’s the only solution. It is mainly distortions in the distribution of wealth and GDP that lead to weak domestic consumption” (Yang, Reference Yang2025).
With or without a world awash in new uncertainties, China’s economy faces substantial challenges – as well as opportunities. We hope the chapters in this book inform the conversations and solutions that emerge.