


Introduction
Recently scientists reported an abundance peak in nanodiamonds (NDs) at multiple locations across North America that is restricted to a thin sediment layer, the Younger Dryas boundary layer (YDB), which dates to the Younger Dryas (YD) onset at 12.9±0.1 ka (Reference FirestoneFirestone and others, 2007;Reference KennettKennett and others, 2009a). A peak in hexagonal diamonds (lons- daleite) was also reported in the YDB at Arlington Canyon, California, USA (Reference KennettKennett and others, 2009b). The only known explanation for terrestrial lonsdaleite is by arrival inside extraterrestrial objects and/or by impact of such objects with the Earth’s surface (Reference DeCarli, Bowden, Jones, Price, Koeberl and MacLeodDeCarli and others, 2002). This discovery begged a prediction that a coeval layer with high ND concentrations should be preserved in the Greenland ice sheet. No layers of NDs have previously been reported from the Greenland ice sheet, or any other form of glacial ice, although Reference Yates, Arden, Wright, Pillinger and HutchisonYates and others (1992) reported finding diamond concentrations in Greenland crocoites holes, which are melt depressions in surface ice that contain micrometeoritic material. However, those diamonds were not in a discrete layer and were found embedded in metal-alloy cosmic grains, rather than being free in the ice. Consequently, we conducted a pilot investigation on a section of the Greenland ice sheet that potentially spans the last deglacial in search of a layer containing an abundance of free NDs that might be coeval with that of the YDB, a study that included both field and laboratory components. The purpose of this contribution is to describe this pilot experiment and its limitations, to present our results and to suggest future work related to the discovery of NDs in this sequence.
Methods and Site Selection
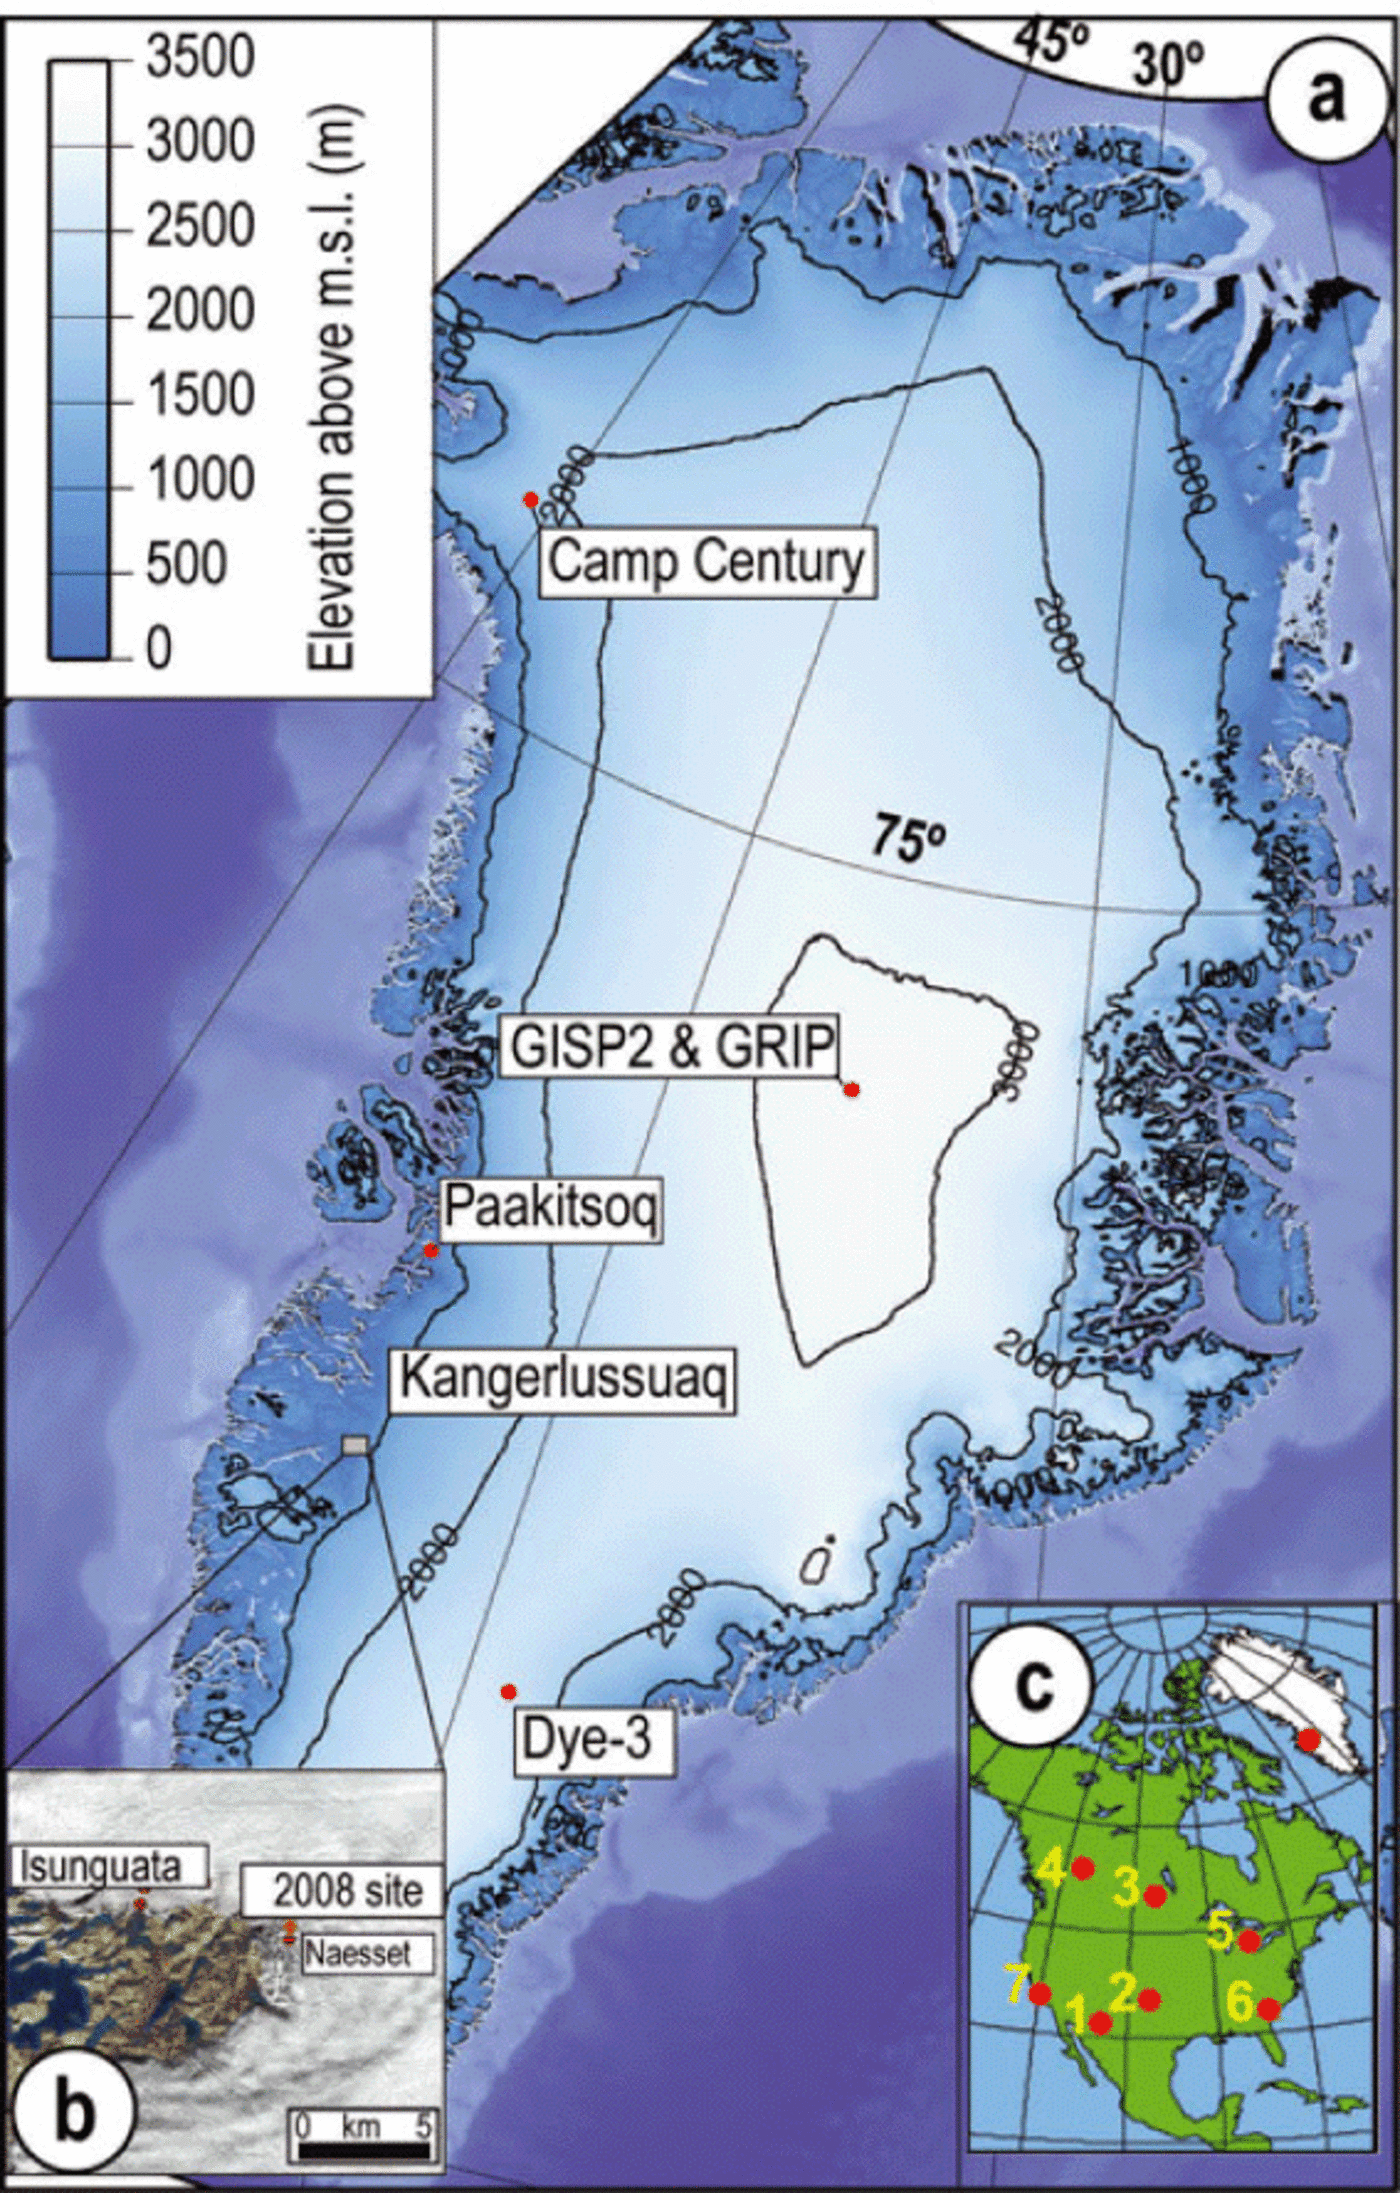
Ice samples of large volume were necessary to conduct these investigations, and sufficient ice from deep cores (e.g. Greenland Ice Sheet Project 2 (GISP2), Greenland Icecore Project (GRIP) or NorthGRIP) are unavailable. Consequently, we followed the earlier approach of Reference Reeh, Oerter and ThomsenReeh and others (2002) and Reference Petrenko, Severinghaus, Brook, Reeh and SchaeferPetrenko and others (2006), who sampled the ice margin to obtain a stratigraphic sequence over the interval from the last deglacial through the Holocene. In cooperation with PBS Nova documentary productions, we conducted fieldwork in late 2008 during which several authors (A.V.K., P.A.M. and J.P.S.) sampled at a margin site east of Kangerlussuaq, West Greenland, ~-1km inland from the ice margin (Fig. 1). Our goal was to collect continuous samples of ice extending from the end of the last glacial episode through the early Holocene, including the 1300year long YD cooling episode. One of the authors (J.P.S.) has considerable experience sampling along the Greenland ice-sheet margin, and he identified a candidate for the YD-age section based on visual inspection of dust stratigraphy (Reference Reeh, Oerter and ThomsenReeh and others, 2002;Reference Petrenko, Severinghaus, Brook, Reeh and SchaeferPetrenko and others, 2006). Our sampling was guided by the presence of clear, dust-poor ice of assumed early Holocene age, stratigraph- ically higher than a sharp visual change into dusty ice of inferred YD age, beneath which was another sharp change into clear ice of assumed BØlling-AllerØd (BA) age that was preceded by dusty ice of assumed Late-glacial age (Figs 2 and 3). The dusty last-glacial ice was in turn separated by a major stratigraphic break from underlying clear ice that may date to the Eemian (the previous interglacial). The transitions between these climatic episodes are consistent with that expected for a Late-glacial through early Holocene ice sequence in Greenland.
Distribution of impact markers at sites in the Northern Hemisphere. (a) The Greenland ice sheet showing ice-core drilling sites, elevation contours and, with inset (b), location of the 2008 sampling site and the closest site, Næsset, with stable-isotope ratios reported by Reference Reeh, Oerter and ThomsenReeh and others (2002). The closest source region for the ice transported to the margin near Kangerlussuaq is the region near Dye-3. (c) Sampling site in Greenland relative to North American sites with known YDB nanodiamond material: (1) Murray Springs, Arizona, USA: 200 ppb; (2) Bull Creek, Oklahomka, USA: 100 ppb; (3) Lake Hind, Manitoba, Canada: 70 ppb; (4) Chobot, Alberta, Canada: 10 ppb; (5) Gainey, Michigan, USA: 3700 ppb; (6) Topper, South Carolina, USA: 108 ppb; (7) Arlington Canyon, California, USA: 1340 ppb (from Reference KennettKennett and others, 2009a,b).
Lower section of the trench at Kangerlussuaq, showing dusty ice of the last glacial episode, which contains very low abundances of NDs. This lower dusty section is immediately overlain by clearer, less dusty, whiter ice inferred to represent the Bølling_Allerød climatic episode, which contains few NDs. Position of layer containing abundant NDs is shown higher in the section.

Upper section of the trench at Kangerlussuaq showing a dusty ice layer sandwiched between clearer ice. The ND-peak layer lies immediately below the base of the dusty layer, as marked. Preliminary data suggest that the dusty layer may represent the YD cooling episode. If so, then the ND peak immediately pre-dates the base of the dusty layer marking the YD onset.

To acquire surface samples, we scraped away ~1 cm from the ice surface and then continuously collected at 15 cm intervals along the selected transect for 4.5 m. For additional samples, we shifted 1 m parallel to the surface sample transect and excavated a 17 m long subsurface trench that included a deglacial age sequence extending from before the BA into the early Holocene. If the stratigraphic interpretation we have adopted is correct, the continuous sequence of ice samples we collected represents ~6000 years of ice, spanning the YD at a resolution of about every 50-100 years.
After returning to the laboratory, we measured stable oxygen isotope values in the melted water from these samples using standard analytical procedures. In addition, we searched for extraterrestrial material within the samples and identified the NDs and their allotropes using high- resolution electron microscopy (HREM), transmission electron microscopy (TEM) and scanning transmission electron microscopy (STEM) to produce high-resolution lattice images and selected area electron diffraction (SAED) patterns, which display crystal lattice spacings that are uniquely attributable to the individual diamond polymorphs. (See Appendix for detailed methodology.)
Raman spectra were acquired using a Thermo Fisher Scientific DXR Raman Microscope by analyzing acid- resistant residue on copper TEM grids with silicon monoxide film. Using the 532 nm laser, the beam size was 0.7 pm with a resolution of ± 2.0 cm-1 at very low wattage (0.5 mW) to avoid damaging the diamonds. A 100x objective was used with a 25 pm pinhole aperture.
Results and Discussion
Oxygen isotopes and stratigraphy
Ice near the margins of the ice sheet at Kangerlussuaq was transported from its original accumulation area at higher ice- sheet elevations up to hundreds of kilometers from the east. Due to deformation and shearing, it was thinner when it reached the ice margin, causing the YD ice to vary unevenly in thickness. For example, at GISP2 the YD ice is ~98m thick (Reference MeeseMeese and others, 1997), while away from central Greenland, at six sampling sites (Camp Century, Dye-3, Isunguata, N^sset, Paakitsoq and Kangerlussuaq) the YD thickness ranges from 1 to 50 m, with an average of 12.8 m. Near Kangerlussuaq, the inferred YD layer is 1 m thick, just as it is along the ice margin at Paakitsoq, ~-350km to the north (Table 1). Even though it is possible that a complete stratigraphic record has not been preserved at all locations along Greenland’s margin, the ice profile studied at Kangerlussuaq displayed dust stratigraphy and isotopic values similar to deep ice-core records (Reference Reeh, Oerter and ThomsenReeh and others, 2002;Reference Petrenko, Severinghaus, Brook, Reeh and SchaeferPetrenko and others, 2006), suggesting that the YD layer is in the correct stratigraphic position at that site.
Characteristics of the Kangerlussuaq section compared to other sites reported for Greenland

We used the changes in δ18O values to constrain the age of the sequence through comparison with isotopic sequences described elsewhere in the Greenland ice sheet, including ice cores from Dye-3, Camp Century (Reference DansgaardDansgaard and others, 1982) and GISP2 (Reference Stuiver and GrootesStuiver and Grootes, 2000). Our trench and surface samples, taken at relatively low resolution, yielded δ18O profiles for both trench and surface transects that exhibited a high degree of variability, but they still generally correspond to the distinctive sequence of warming/cooling episodes between the late last-glacial episode and early Holocene as recognized in the deep ice cores (Table 1). The observed δ18O values measured in trench and surface samples are about –34.9% in the lower part of the profile (Fig. 4), and this is within the range of values for glacial ice reported from six proximal Greenland sites (-33.0% to -42.0%). Also, the δ18O values for the glacial episode differ by only 0.7% from Dye-3, the closest ice core (Reference DansgaardDansgaard and others, 1982) located upstream from the Kangerlussuaq site. Significantly, since the Dye-3 accumulation area is similar to Kangerlussuaq, that site is the most likely to reveal a comparable δ18O record (Table 1). Maximum δ18O values of about -31.0% in the upper part of the Kangerlussuaq profile are also similar to the earliest Holocene values of about -31.0% in Dye-3 (Reference DansgaardDansgaard and others, 1982). The absence of higher values at Kangerlussuaq suggests that the younger part of the Holocene is absent and that the sampled profile does not extend further into the early Holocene, where values are typically about -27.0% (Reference DansgaardDansgaard and others, 1982, 1989;Reference Reeh, Oerter and ThomsenReeh and others, 2002).
Time series of δ18O values from the surface samples at the Kangerlussuaq site. The ND-peak layer is designated by a vertical gray line.

Based upon the dust stratigraphy and the δ18O values, the sequence at Kangerlussuaq is therefore consistent with a chronology that extends across the interval of deglaciation, ranging from the Late-glacial through the earliest Holocene. This deglacial sequence contains an interval of dustier ice with δ18O values (about -33.0%) that appear to represent the cooler conditions of the YD. It is noteworthy that the glacial δ18O values of the lower dusty ice contrast with the much higher δ18O values of the basal ice that appears to correlate with the Eemian episode (penultimate interglacial).
Nanodiamonds
Several authors report abundant NDs (n-diamonds, lons- daleite, cubics and other allotropes) in the YDB layer dating to 12.9 ± 0.1 ka at seven terrestrial sites across North America (Reference KennettKennett and others, 2009a,b). Now, in an ice layer from the Kangerlussuaq study site, we have detected a ND-rich peak in a layer of ice (ND-peak layer) that is estimated to contain total ND abundances of 5-50 parts per billion (ppb), equivalent to 1-10×109 per cm of ice (Fig. 5; Table 2). These values are consistent with the lower end of the range of 10-3700 ppb estimated at terrestrial North American YDB sites (Reference KennettKennett and others, 2009a). Analytical results from this pilot study for lonsdaleite and n-diamonds are provided in Figures 6 and 7 and Table 3.
Vertical abundance distribution of NDs from Table 2 compared with a low-resolution δ18O trench record that exhibits an apparent episode of cooling that may represent the YD. Distance down trench is shown at left and sample numbers are shown at right.
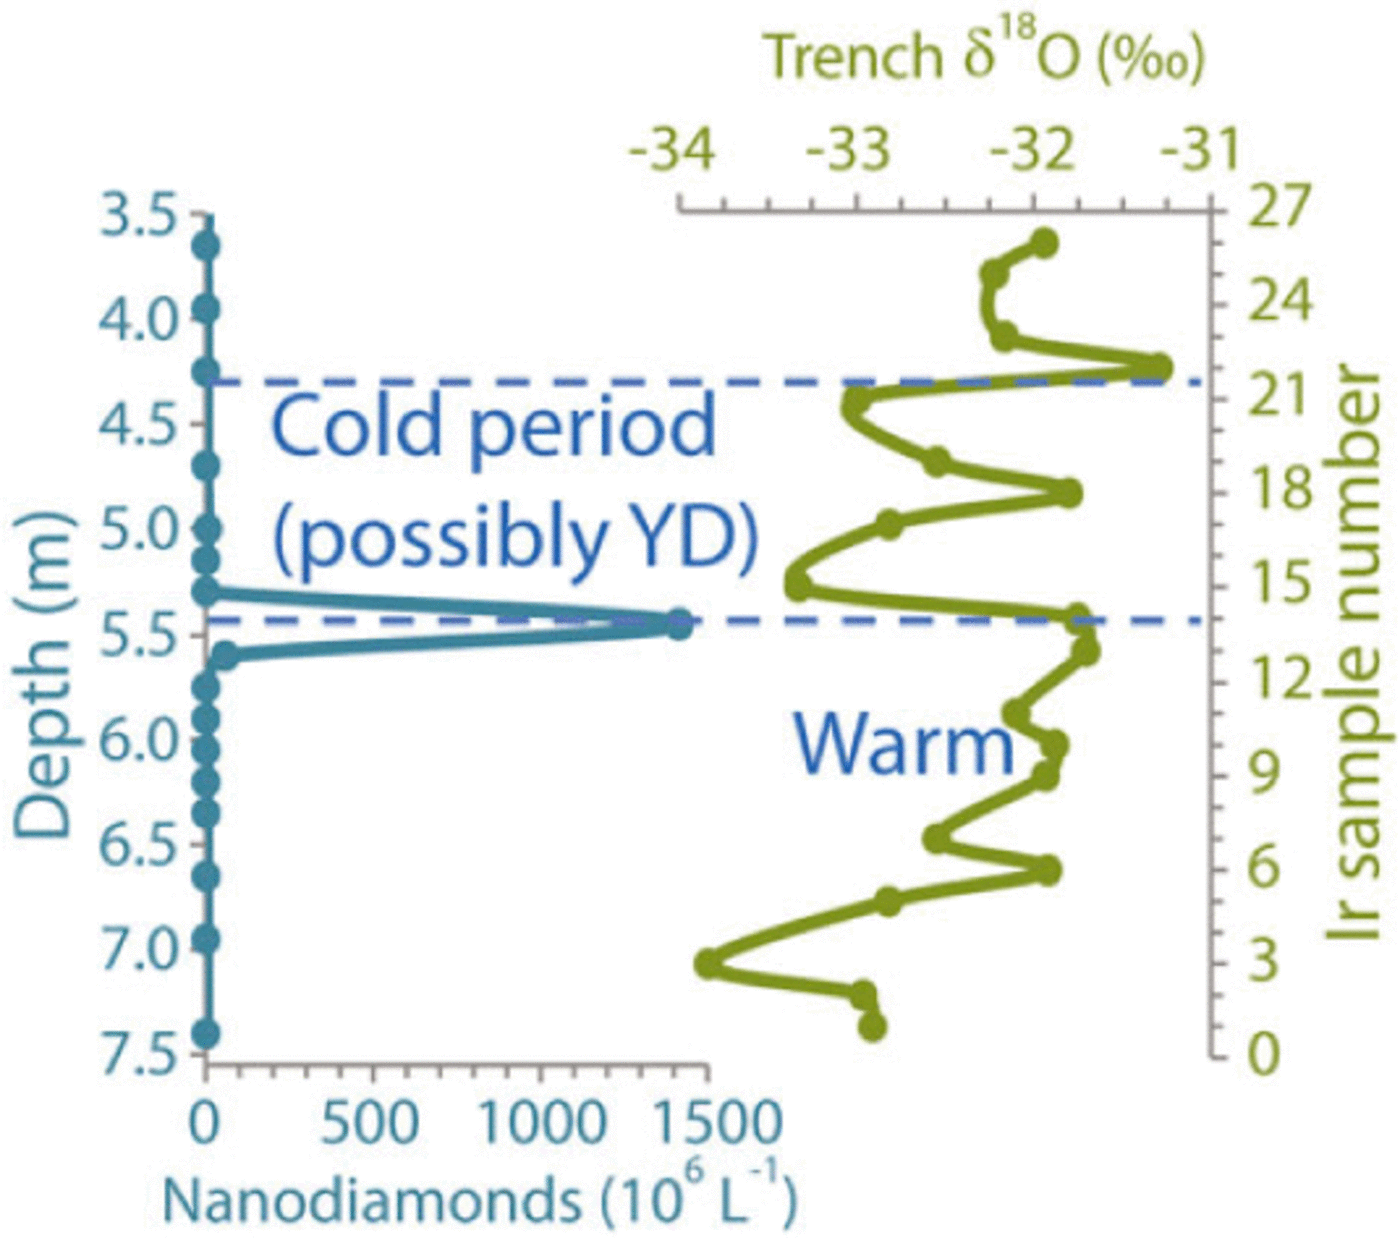
Estimated concentrations of NDs by depth and sample for the Kangerlussuaq section. Based on HREM images, approximately one-third of the total NDs are estimated to be lonsdaleite, one-third are n-diamonds and the balance is comprised of other diamond allotropes

Lonsdaleite analyses. (a) TEM image of group of lonsdaleite crystals. (b) HREM image showing characteristic lonsdaleite lattice spacings. (c) SAED pattern of lonsdaleite. (d) Fast Fourier transform (FFT) of lonsdaleite ND crystal. All values (Miller indices) are consistent with each other and with the published lattice spacings for lonsdaleite as shown in Table 3. Sample numbers, as referenced in Table 2, are shown in the lower left of each image.

N-diamond analyses. (a) TEM image of group of n-diamonds. (b) HREM image showing characteristic n-diamond lattice spacings. Dark and light alternating lattice bands indicate twinned crystals, a common characteristic of n-diamonds in the Greenland section. In contrast, lonsdaleite from Greenland (Fig. 6) displays no indication of twinning. (c) SAED pattern of n-diamonds. (d) FFT of n-diamond crystal. All lattice spacings (Miller indices) are consistent with each other and with published spacings for n-diamonds as shown in Table 3. Sample numbers, as referenced in Table 2, are shown in the lower left of each image.

Lattice d-spacings for n-diamonds and lonsdaleite. The second column for each type shows accepted values for each particular lattice, and the third column displays the observed lattice d-spacings from the Greenland samples, indicating good matches with each calculated spacing. In crystallography, Miller indices, expressed as hkl values, are a notational system used to describe the orientation of a family of planes of atoms as revealed by exposure to X-rays or a beam of electrons. A ‘d-spacing’ value is the spacing (herein as nm) between adjacent planes. Any crystal, such as diamond, displays a uniquely individual set of d-spacings (Wenk and Bulakh, 2004)

Researchers have produced lonsdaleite experimentally at high temperatures (1000-1700°C) with pressures of >15 GPa (2×10⁶psi), followed by rapid quenching (Reference DeCarli, Bowden, Jones, Price, Koeberl and MacLeodDeCarli and others, 2002), just as would occur during a hypervelocity cosmic impact. In addition, lonsdaleite has been experimentally produced by carbon-vapor deposition (CVD), whereby an oxygen-deficient (hypoxic), carbon-rich 13 000°C vapor was quenched onto a warm substrate (800-1200°C) at typical atmospheric pressure (Reference Maruyama, Makino, Kikukawa and ShiraishiMaruyama and others, 1992), conditions which could occur in an impact fireball. Neither of these sets of experimental conditions is known to occur in nature, supporting the observation that lonsdaleite has never been confirmed in association with terrestrial diamonds (Reference DeCarli, Bowden, Jones, Price, Koeberl and MacLeodDeCarli and others, 2002). Lonsdaleite has only previously been found on Earth either inside fallen meteorites (Reference Hanneman, Strong and BundyHanneman and others, 1967), in which they formed by shock metamorphism in space, or in association with terrestrial impact craters (Reference DeCarli, Bowden, Jones, Price, Koeberl and MacLeodDeCarli and others, 2002), in which they formed by shock metamorphism during hypervelocity impact. Consequently, the presence of lonsdaleite is considered a robust indicator of the influx of cosmic material or of a cosmic impact, since there are no known natural terrestrial processes, such as tectonism, volcanism or biomass burning, that are accepted as being capable of providing the requisite conditions for lonsdaleite formation (Reference DeCarli, Bowden, Jones, Price, Koeberl and MacLeodDeCarli and others, 2002).
Of the various polytypes in the ND-peak layer, lons- daleite accounts for approximately one-third of the total NDs detected in the ND-rich layer. These are typically monocrystalline, displaying a generally rounded morphology with slightly irregular edges (Fig. 6). Lonsdaleite varies from ~2 to 40nm in diameter, with most crystals falling at the lower end of that range; they are crystallographically identical to lonsdaleite from impact craters, such as Popigai, Russia (Reference Koeberl, Masaitis, Shafransovsky, Gilmour, Langenhorst and ShrauderKoeberl and others, 1997), except that Popigai diamonds are angular or tabular rather than rounded. We detected no lonsdaleite in ice younger than the ND-peak layer, but low concentrations of <0.003 parts per trillion (ppt) were detected in older adjacent layers, possibly due to ice ablation and downslope transport of material from the ND-peak layer.
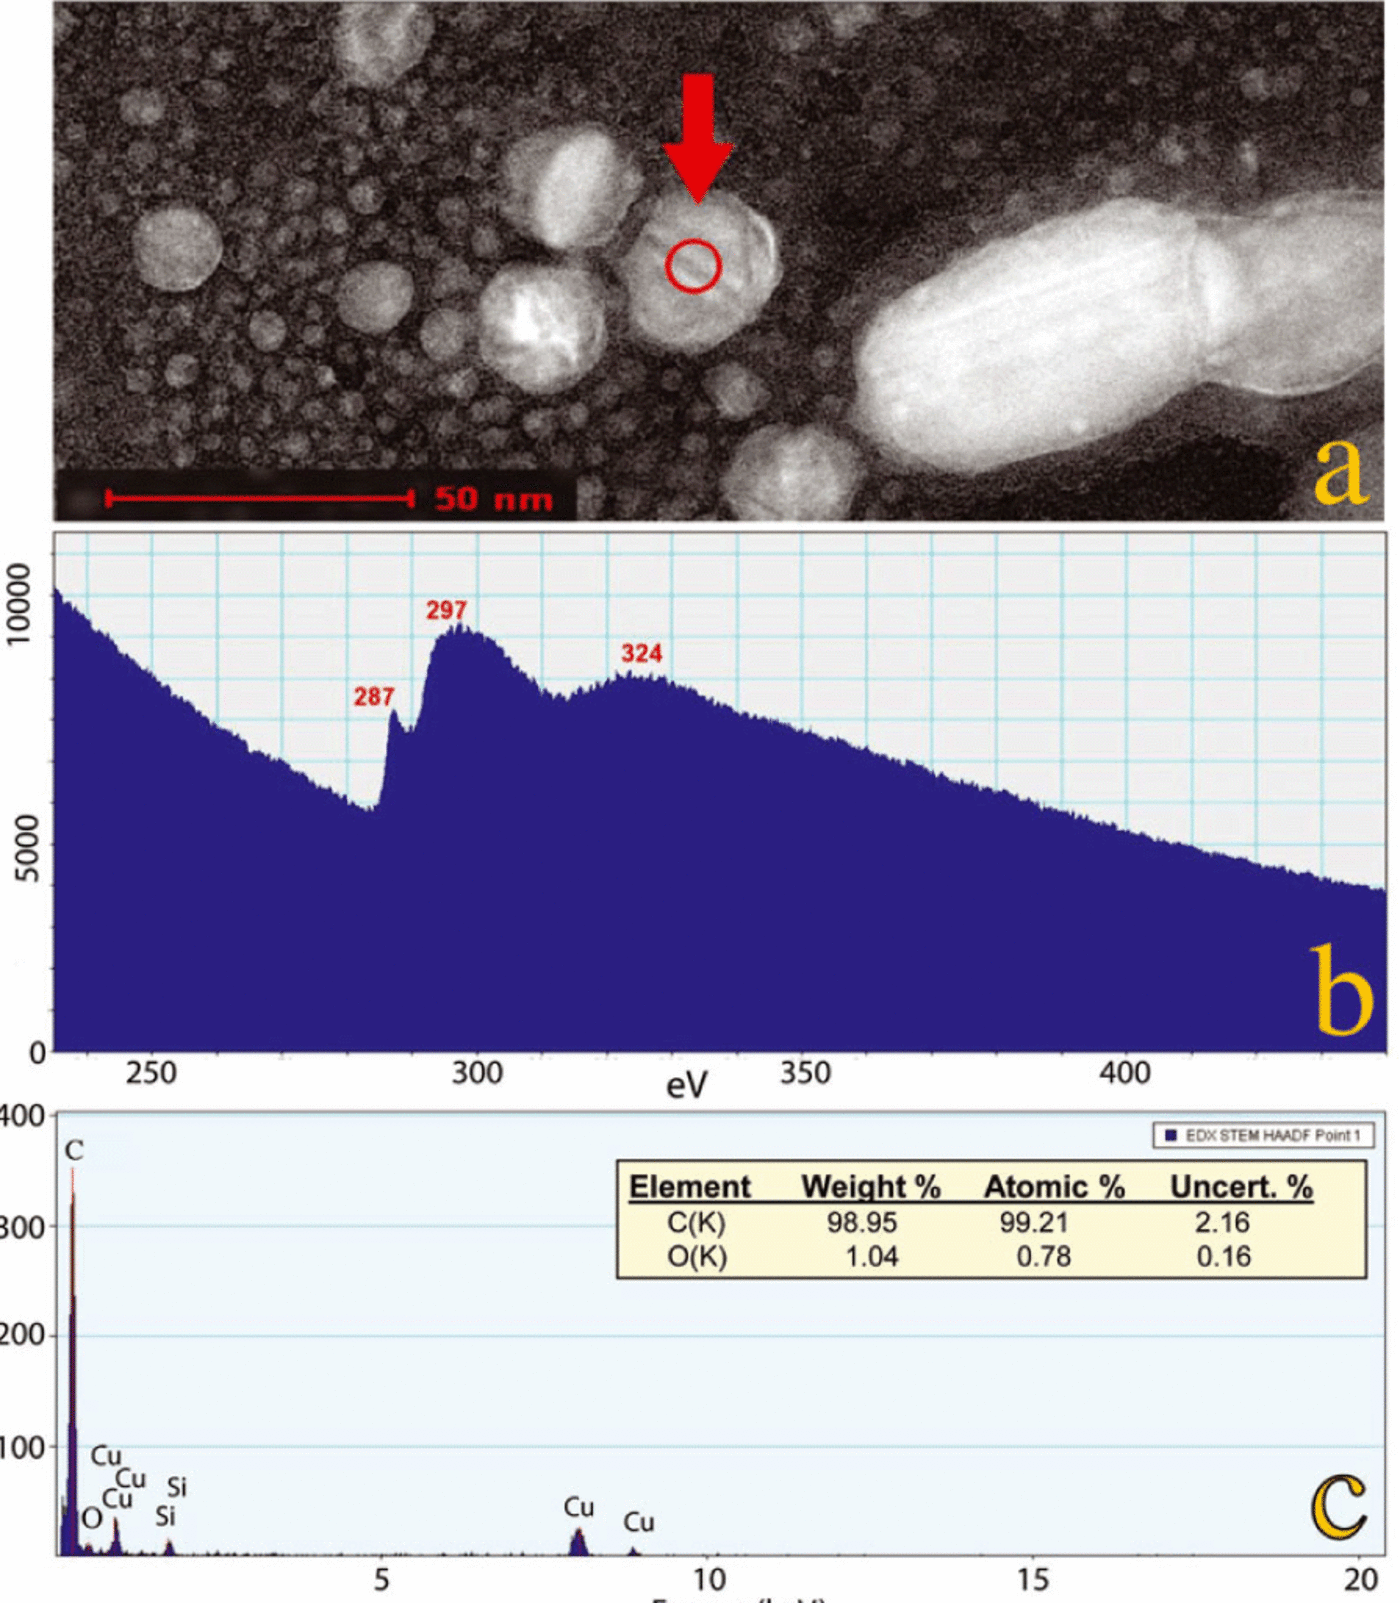
N-diamonds account for approximately an additional one-third of the total NDs detected in the ND-peak layer. Analytical results from HREM, TEM, electron energy-loss spectroscopy (EELS) and Raman are shown for n-diamonds in Figures 7-9 and Table 3. Energy-dispersive X-ray spectroscopy (EDS) confirms that the n-diamonds are composed of elemental carbon (~99%), and EELS indicates that the crystalline habit of selected crystals matches that of n-diamond (Fig. 8), displaying a mix of sp2 and sp3 bonding (Reference KonyashinKonyashin and others, 2001;Reference Peng, Bursill, Jiang, Orwa and PrawerPeng and others, 2001). In the laboratory, n-diamonds can be produced experimentally by oxygen-deficient (hypoxic) TNT detonation (Reference Yamada and SawaokaYamada and Sawaoka, 1994) and are typically rounded and often polycrystalline, ranging from ~2 to 40nm (Fig. 2.9 by T.L. Daulton in Reference Shenderova and GruenShenderova and Gruen, 2007). For n-diamonds from Greenland’s ND-peak layer, HREM and TEM imaging reveal that they are also typically rounded and often polycrystalline, ranging in size from 4 to 200 nm, with most falling within the range 4-10 nm. Therefore, the shape and size of the Greenland n-diamonds suggest that they formed not by shock metamorphism but rather by processes such as high-temperature CVD and/or high-explosive detonation, which duplicate conditions known to occur during a cosmic impact.
Energy-dispersive X-ray spectroscopy (EDS) and electron energy-loss spectroscopy (EELS) analyses of an n-diamond from the ND-peak layer in the Greenland section (sample No. 14; 5.40 m). (a) A dark-field STEM image of many n-diamonds, one of which (arrow) displays diagonal bands that are characteristic of twinning, a common condition for the Greenland n-diamonds. Several analyses were conducted in the area of the spot circled, as follows: (b) An EELS core-loss spectrum revealed a pre-peak at 287 eV and a sigma peak at 297 eV, both of which are characteristic of n-diamonds. A low-loss spectrum (not shown) displayed a peak at 22 eV, and this in addition to the previous coreloss eV values matches those reported for n-diamonds (Reference KonyashinKonyashin and others, 2001; Reference Peng, Bursill, Jiang, Orwa and PrawerPeng and others, 2001). The n-diamond values differ distinctively from the respective values for other carbon allotropes, such as cubic diamonds, lonsdaleite, graphite and amorphous carbon (Reference Peng, Bursill, Jiang, Orwa and PrawerPeng and others, 2001). (c) EDS analysis confirming that the crystal analyzed is dominantly elemental carbon (~99%). Corrections were made for small amounts of copper (Cu) from the TEM grid and silicon (Si) from the EDS detector.
Acid-resistant residue from the Greenland ND-peak layer (No. 14) analyzed by Raman spectroscopy reveals several broad peaks. These peaks are centered at 1360 and 1585 cm–1, which are characteristic values for n-diamond (Reference Konyashin, Khvostov, Babaev, Guseva, Mayer and SirenkoKonyashin and others, 2006); the 1585 cm–1 peak is the largest apparent in this spectrum. There are no visible peaks for rutile or copper, eliminating the possibility that n-diamonds are those minerals, all of which have similar, though distinctive, SAED patterns. The Raman spectra, along with SAED patterns and EDS, reveal the likely presence of abundant amorphous carbon intermixed with the n-diamonds. Lonsdaleite is not readily apparent in this Raman spectrum, possibly due to its much lower abundance relative to n-diamonds.

Our analysis of the Greenland sequence revealed low background concentrations of NDs in 16 non-ND-peak layer ice samples spanning an estimated interval of ~6000 years (Table 2). We detected no lonsdaleite within younger ice above the ND-peak layer, but we found lonsdaleite and n-diamonds at low concentrations intermittently in older ice below the ND-peak layer. The presence of these apparently older NDs most likely results from redeposition by ice ablation of NDs found in the peak layer. For the entire ice transect analyzed, spanning an estimated interval from ~16 to ~11 ka, only one ND peak was discovered, and that occurs in clear ice immediately preceding a dusty ice layer that is consistent with the onset of the YD cooling episode. Other than that, the background levels of NDs are about the same whether found in clear ice or dusty ice, indicating that there is no apparent direct relationship between the abundances of terrestrial dust and NDs. The average background of non-peak-layer NDs in the ~6000 years of sampled intervals in this Greenland section ranges from 0.0 to 0.1 ppt and averages 0.01 ppt, which is lower than in the ND-peak layer by a factor of 500 000-5 000 000 times (Table 2).
Alternate hypotheses
Regarding the origin of the Greenland ND-peak layer, there are several hypotheses, one of which is that the lonsdaleite and n-diamonds have not been conclusively identified. Obviously, it is important that care be taken to correctly identify the ND allotropes and differentiate them from other mineral species, which can appear similar. For example, lonsdaleite and n-diamonds display diffraction lines with values within a few percent of the lines of other minerals such as quartz, rutile, copper, graphite and graphene. However, when occasionally encountering those crystals during TEM analysis, we found their shapes to be morphologically unlike the spherical to highly rounded Greenland diamonds. Furthermore, all of the alternate crystals display additional diffraction lines and/or are missing some lines (e.g. quartz displays additional non-diamond lines at 0.426, 0 334 and 0.246 nm;graphite displays an additional line at 335 nm; and graphene is missing the lonsdaleite lines of 0193 and 0.150 nm), making it relatively straightforward to differentiate those crystals from diamonds. Furthermore, SAED, EDS, EELS and Raman analyses all clearly indicate that the reported Greenland diamonds are dominantly carbon (~90-99%), while quartz, rutile and copper are barely detectable (~0% to ~2%), thus eliminating the possibility that the dominant minerals are other than diamonds. In fact, the combination of these various analyses is considered to provide conclusive identification of any unknown crystal. Thus, multiple lines of evidence indicate that the Greenland ND-peak layer contains highly abundant lonsdaleite and n-diamonds, which are morphologically and analytically indistinguishable from the lonsdaleite and n-diamonds found across North America in YDB carbon spherules and sediments.
A second hypothesis is that the NDs resulted from an unusually intense, non-catastrophic influx of ET diamonds, such as from a heavy meteor shower. To test this hypothesis, we surveyed the literature for ET diamond morphologies, and found that many researchers have analyzed meteoritic diamonds and presolar diamonds in cosmic dust, and reported finding angular, euhedral and/or plate-like NDs (e.g. Reference Grady, Lee, Arden and PillingerGrady and others, 1995;Reference Shenderova and GruenShenderova and Gruen, 2007; Reference Marosits, Daulton, Sudek and OttMarosits and others, 2008). In addition, T.L. Daulton reported finding quasi-rounded, decahedral, multiply twinned cubic NDs (Fig. 2.11 by Daulton in Reference Shenderova and GruenShenderova and Gruen, 2007 but, to our knowledge, no one has reported finding rounded monocrystalline NDs within cosmic material. In addition, we prepared our own diamond extracts from three meteorites and confirmed the presence of lonsdaleite in a ureilite (NWA 2971) and cubic diamonds in two carbonaceous chondrites (Allende and Murchison) with the same angular or euhedral morphology as reported in other meteorites, but those NDs are dissimilar in morphology to the Greenland lonsdaleite and n-diamonds. Testing continues, but so far we have detected no n-diamonds in any meteoritic samples, nor, to our knowledge, have other researchers conclusively identified n-diamonds, rounded or otherwise, in any meteoritic samples. Since the rounded n-diamonds found in Greenland are unlike any diamonds found in meteorites or presolar grains, this difference strongly suggests that they did not arrive from space. Instead, it appears that they formed upon Earth impact, most likely through a process such as high- temperature CVD and/or high-explosive detonation, which typically produces rounded laboratory NDs that are identical to those from Greenland (Fig. 2.9 by Daulton in Reference Shenderova and GruenShenderova and Gruen, 2007). If the Greenland NDs did form during an Earth impact, then carbonaceous material in terrestrial target rocks, biomass and/or possibly the impactor supplied their carbon.
Another hypothesis is that the Greenland ND-peak abundances may simply have resulted from a small localized meteorite impact and that the diamond-rich YDB layer in North America is not the same as the Greenland ND-peak layer. However, this seems unlikely since the Greenland ND- peak layer appears to have been deposited between 14.6 and 11.6 ka, and is the only peak layer apparent in that interval of ice. In all the sample profiles studied in Greenland, throughout North America and across Europe, an area spanning ~-12 000km and distributed across ~10% of the Earth, there is only one ND peak at ~12.9 ± 0.1 ka, which is evident in each of the sedimentary sequences that span many thousands of years. Therefore, the simplest and most compelling explanation is that the ND-peak layer in Greenland is the same as the ND-rich continental YDB.
The final, and preferred, hypothesis is that the Greenland ND-peak layer, which appears to date to the onset of the YD, is the result of a major impact event. In support of this, the continent-wide Cretaceous-Tertiary (K-T) boundary layer is accepted to contain NDs that did not arrive from space inside the impactor, but rather crystallized from carbon-rich terrestrial material during that hypervelocity impact (Reference Gilmour, Russell, Arden, Lee, Franchi and PillingerGil-mour and others, 1992). During our Greenland research, we also examined NDs extracted from K-T sediments collected in Caravaca, Spain, and Needles Point, New Zealand. The impact layers at both sites display substantial abundances of lonsdaleite and n-diamonds having the same morphology and range of sizes as those found in the Greenland samples (Reference BunchBunch and others, 2008;Reference West, Kennett, Kennett, Bunch, Stafford and WolbachWest and others, 2009), while background levels were at zero or very low, as they are in Greenland. Likewise, NDs extracted from YDB samples collected in North America and Europe display the same rounded morphology and range of sizes as those found in the K-T sediments and in Greenland (Reference KennettKennett and others, 2009a). ND abundances from the YDB are found to range up to 3700 ppb, which is lower than, but comparable to, the lower values for the K-T impact event, which has ND abundances from ~3200 to 45 000 ppb. Similarly, Greenland ND abundances are found at up to 5 × 10⁶ times above background and are comparable to YDB abundances of NDs at other sites. Thus, since the type and morphology of the Greenland NDs indicate that they are not meteoritic or presolar diamonds, the presence of the ND-peak layer in Greenland is most consistent with a major impact event, such as occurred at the K-T boundary.
Of course, it is possible that the NDs in Greenland formed through some as-yet undiscovered natural process other than cosmic impact;however, that seems unlikely, since intense diamond research spanning more than a century indicates that the formation of NDs, and lonsdaleite in particular, requires extraordinary temperature, pressure and redox conditions that rule out natural processes that occur either on or below the surface of the Earth (Reference DeCarli, Bowden, Jones, Price, Koeberl and MacLeodDeCarli and others, 2002). Thus, since the YDB is the only other known continent-wide diamond layer in the entire tested geologic record other than that at the K-T boundary, the most consistent hypothesis is that NDs in the YDB formed during a major cosmic impact event.
Future work
The data presented herein result from a preliminary study. The discovery of a potential postglacial peak in NDs in the Greenland ice sheet is exciting, and although a few unanswered questions have arisen, we are presenting our results to stimulate further investigation and debate. For example, this study was undertaken using Greenland ice samples taken at relatively coarse resolution, and, to significantly refine the findings presented here, higher- resolution sampling is needed. Further areas of potential exploration should include: (1) more precise dating through use of δ18O;(2) more detailed geochemical time-series measurements, including for osmium and iridium;(3) utilization of improved diamond-extraction procedures to minimize acid-resistant amorphous carbon, which currently limits available analytical procedures;and (4) expanded analyses of diamond allotropes, such as by Raman spectroscopy. All of these analyses require more extensive, higher- resolution sampling in Greenland.
Conclusions
The discovery in Greenland ice of abundant n-diamonds and lonsdaleite, along with other possible diamond allotropes, represents the only known depositional layer of free diamonds yet reported from glacial ice anywhere on Earth (e.g. ice sheets and caps; alpine glaciers). An inferred last deglacial age for the ND-peak layer is based on dust stratigraphy and constrained by oxygen isotopic values of the ice. This stratigraphy suggests that the ND-peak layer was deposited after the end of the last glacial episode (14.6 ka) and prior to the earliest Holocene (11.6 ka), which is consistent with the date of formation of the YDB in North America at 12.9 ± 0.1 ka. Also, the ND-peak layer occurs immediately below the base of an especially dusty ice zone, which, according to the dust stratigraphy, may represent the onset of the YD cooling episode. However, higher-resolution stratigraphic studies are needed to confirm this age.
Since lonsdaleite is only known to form during high- temperature/high-pressure cosmic events, its presence currently can be explained in only two ways: either the lonsdaleite arrived already formed within meteoritic material or it crystallized during a hypervelocity impact with the Earth’s surface. The rounded morphology, range of allotropes and very high abundance of NDs in the ND-peak layer appear to exclude the first possibility, arrival inside meteoritic material. Regarding a possible impact event, the Greenland NDs are identical to those found in the K-T impact layers, so the presence of rounded n-diamonds and lonsdaleite in Greenland ice suggests that a large cosmic impact occurred, and further investigations are necessary to determine the nature and scope of this event. In summary, since continent-wide layers containing NDs are only known to exist at the K-T boundary and the YDB, then the existence of this layer in Greenland ice appears consistent with the occurrence of a major impact event that correlates with the nanodiamond-rich YDB in North America at 12.9 ± 0.1 ka.
Acknowledgements
Research was partially funded by the US National Oceanic and Atmospheric Administration (Department of Commerce grant NA08OAR4310867) and the US National Science Foundation (grant ATM-0713769). HREM work was conducted at the CAMCOR High Resolution Facility in the Lorry I. Lokey Laboratories at University of Oregon with support from the Office of Research. We thank the FEI Company for their generous support and technical assistance with HREM (FEI Titan™ 80-300 scanning/transmission electron microscope). We thank Thermo Fisher Scientific, Inc., S. Heier, T. Deschaines and J. Hellgeth for their generous support and technical assistance with the Thermo Fisher Scientific DXR Raman Microscope. We also gratefully acknowledge PBS’s NOVA series, E. Hadingham (senior science editor), D. Hamilton (producer-director) and S. Pyne (assistant producer) for encouragement and financial support for fieldwork in Greenland by A.V.K., P.A.M. and J.P.S. We thank the three reviewers for their valuable comments and suggestions.
Appendix
Stable oxygen isotope δ18O measurements from glacial ice
We utilized a Multiprep peripheral running both Sira software and a Prism-Up software package. We aliquoted 375 μL of sample water to a Wheaton 1.0 mL V-Vial (Wheaton #986284). After transferring a suite of samples to a glove bag and sealing the bag, the atmosphere was purged from the bag with a stream of CO2 gas. When 1 atm of CO2 was reached within the glove bag, screw tops were placed on each sample vial. These screw tops contain a penetrable septa backed by a Kel-F disc. The water samples were then equilibrated with CO2 overnight at 30°C. When equilibrated the sample gas was admitted to the Multiprep peripheral via a needle that pierces both the septa and Kel-F disc, and dried by passing through a trap held at -80°C. The gas was then transferred into the dual inlet of the Sira mass spectrometer for measurement. We report the difference in absolute oxygen isotopic ratios between samples of Greenland ice and Vienna Standard Mean Ocean Water (V-SMOW). By measuring the difference in isotopic ratios, we can more precisely detect fluctuations or changes in values than if we only reported absolute isotopic values. Data are reported as enrichment, 8, expressed as per mil (%) relative to V-SMOW (Reference Stuiver and GrootesStuiver and Grootes, 2000). A calibrated working standard gas of tank CO2 is used in the laboratory. Sample values are measured against this working standard gas, and then converted and reported relative to the international standard V-SMOW by also measuring three working water standards on a daily basis. These laboratory standards are reported in Table 4. The working standards are close in isotopic value to the international water standards V-SMOW and GISPand have been calibrated directly to these internationally accepted standards as well as International Atomic Energy Agency standards IAEA OH-1, IAEA OH-2, IAEA OH-3 and IAEA OH-4.
Stable oxygen isotope standards

Concentrating nanodiamonds from ice
A detailed protocol is provided so other researchers can adequately test the results presented herein. Modified from Reference Huss and LewisHuss and Lewis (1995), this process is suitable for processing residue from ice samples that may contain NDs. This protocol is not recommended for terrestrial bulk sediment that contains NDs with a wide mix of other minerals that require more aggressive acid digestion. CAUTION: other standard ND extraction protocols are not recommended for extracting n-diamonds.
Supplies
50 mL centrifuge tubes (if necessary, substitute 15 mL tubes throughout);glass vials;beakers (Teflon or Pyrex-acid- washed);Teflon spatulas;analytical grade hydrochloric acid and ammonia. Pre-weigh all containers. All digestions/ extractions should be conducted in fume hoods when appropriate.
Extracting the nanodiamonds
Evaporation. Nearly all ND polytypes are metastable, except cubics, so do not exceed 100°C in any processing step. Optimal amount of ice or meltwater is 0.5-1 L. Less ice decreases the potential for detecting NDs.
-
1. Measure weight and volume of ice or meltwater.
-
2. Place in a beaker and evaporate at <100°C. Take care to not overheat.
-
3. Thoroughly scrape out residue with a spatula and weigh.
Hydrochloric acid. Diamonds are naturally hydrophobic. However, they may become hydrophilic after long deposition due to addition of surface contaminants, which make them less susceptible to extraction. To remove possible contaminants:
-
1. Place a measured aliquot in a 50 mL centrifuge tube.
-
2. Fill with concentrated HCl at pH of <1.
-
3. Ultrasonicate for 1-2 hours.
-
4. Evaporate acid at <100°C to ~1-2 mL.
-
5. Recover the ND-rich residue by scraping the container with the appropriate spatulas.
Ammonia. In a neutral/alkaline environment NDs become colloidal, permitting efficient separation from most other minerals.
To place NDs into colloidal suspension:
-
1. Place residue in a beaker and fill with ammonia. The pH should be >7, with pH of 10-12 being preferable.
-
2. Sonicate for 1 hour at room temperature.
-
3. Heat in oven or on hotplate at ~40-60°C for 24-48 hours.
-
4. Remove from hotplate and sonicate for 5-10 min every 3-6 hours. Ensure the pH exceeds 7.
-
5. Centrifuge at 1000g (1500 rpm) for 2 hours to separate out any suspended clay particles.
-
6. Transfer the supernatant to a 50mL polypropylene centrifuge tube and start evaporating the solution at 100°C.
-
7. Repeat steps 1-6 another one to five times, depending upon whether you wish to extract the maximum percentage of NDs.
-
8. Each time, add the resulting supernatant to the evaporating supernatant tube.
-
9. Reduce the final evaporating volume to 1-2 mL. Cool.
Hydrochloric acid. Polar ice may contain substantial concentrations of ocean salts, which complicate TEM analyses. To both dilute the dissolved salts and to flocculate the suspended NDs:
-
1. Mix HCl with a supply of de-ionized water until a pH of <0.5 is reached.
-
2. Fill the centrifuge tube containing diamondiferous supernatant with the HCl mixture.
-
3. Sonicate for 30 min.
-
4. Cap tubes and heat in oven or on hotplate at ~40-60°C for 24-96 hours.
-
5. To condense flocculates, centrifuge at 1 000g (~1500 rpm) for ~1 hour.
-
6. Using pipette, draw down most of supernatant, leaving 5-1 mL without disturbing the solid residue. Set supernatant aside.
-
7. Scrape tube with a spatula to concentrate residue.
-
8. Remove contents to a glass vial, washing tube with alcohol.
-
9. For more complete recovery, repeat steps 1-8 for supernatant.
-
10. Combine each ND-bearing separation.
-
11. Add enough ammonia to neutralize solution.
-
12. Dry to constant weight at <100°C.
Analyzing the nanodiamonds
The most stable TEM grids available are covered with carbon- only films. Most other films are unsuitable because the electron beam can cause NDs to increase in temperature, causing the grid film to rupture. Grids with a 200- to 300- count mesh work best. To reduce heating, it is best to keep TEM voltages in the 80-100 kV range, though higher voltages are suitable if the beam is kept dispersed rather than tightly focused. The same TEM grids can be used for SEM, STEM and HREM.
Making a TEM grid
-
1. To the vial of dry neutralized residue, add two to three drops of ammonium hydroxide (pH > 12) to colloidally re-suspend any NDs.
-
2. Weigh the TEM grid before adding the solution.
-
3. Pipette one drop of this admixture onto the grid and then use the pipette to draw off most of the drop.
-
4. Dry the grid at room temperature.
-
5. Weigh the TEM grid after adding the solution and drying. This facilitates estimation of ND abundances.
-
6. Typically, at least 5-10% of the grid area should be randomly searched.
Analytical microscope protocol
For TEM work, we used JEOL 1200EX II and JEOL TEM 1210 transmission electron microscopes. Lower electron-beam voltages (60-80 kV) were preferred because some ND polymorphs, such as n-diamonds and lonsdaleite, are metastable and may vaporize at the high temperatures generated at higher voltages. The TEMs were used to identify and image single and clustered crystals, and ND polymorphs were identified via SAED and FFT. Multiple measurements were taken across larger diamonds to determine composition. High-resolution TEM analysis was carried out in a FEI Titan™ 80-300 scanning transmission electron microscope (STEM) (FEI, Hillsboro, Oregon), which is equipped with an image corrector, high-angle annular dark field (HAADF) detector, EDS detector, Gatan imaging filter (GIF) and a 4-megapixel charge-coupled device (CCD) camera. The magnification of the microscope was calibrated using a standard cross-grating carbon replica (2160 lines mm-1) evaporated with gold. Chemical analysis was carried out using EDS and EELS. HREM and SAED patterns were used to determine the structure of the diamonds. Interplanar spacing measurement and FFT image processing were performed using Digital Micrograph software. EDS and EELS analysis demonstrated that the nanoparticles in HREM images contain only carbon.
Estimated quantities
ND concentrations (number and ppb) were estimated by calculating the starting weight of each bulk ice sample, weight of the residue after evaporation, weight of extract used per grid, average number of NDs in a representative area of a grid, percentage of non-diamonds encountered during testing and net percentage of the grid displaying NDs.
Data storage
All original data files were uploaded to the US National Snow and Ice Data Center (NSIDC).



