

Introduction
Proteins are an essential part of cellular life as they perform a multitude of functions in cells. In biology, there is a close relationship between the structure and function of molecules, and consequently changes in protein conformation can have dramatic effects on the biological function. Sometimes proteins deviate from the native conformations by misfolding and aggregation, which has been associated with misfunction and diseases. One example of protein aggregation is amyloid formation, which is associated with diseases such as Alzheimer's disease, Parkinson's disease, and diabetes mellitus type 2 (Chiti and Dobson, Reference Chiti and Dobson2017; Eisenberg and Sawaya, Reference Eisenberg and Sawaya2017). Apart from being associated with diseases, amyloids also have potential for being used in engineered biomaterials (Cherny and Gazit, Reference Cherny and Gazit2008), and there are several examples of functional amyloids in humans and other organisms (Fowler et al., Reference Fowler, Koulov, Balch and Kelly2007). Bacteria and fungi may for example utilize amyloid aggregates in processes such as adhesion to surfaces, cell aggregation, and biofilm formation as well as in lowering of air-water surface tension (Fowler et al., Reference Fowler, Koulov, Balch and Kelly2007).
Amyloid aggregates are made of intermolecular β-sheets stacked together into long-fibrillar structures, with the β-sheets extending along the long axis of the fibrils. The width of fibrils typically vary from a few nanometers to a few tens of nanometers, and they can be several micrometers long (Chiti and Dobson, Reference Chiti and Dobson2017; Eisenberg and Sawaya, Reference Eisenberg and Sawaya2017). The special arrangement of the peptide molecules in these structures is called cross-β structure, due to the characteristic diffraction pattern the fibrils give rise to when aligned (Eanes and Glenner, Reference Eanes and Glenner1968; Sunde et al., Reference Sunde, Serpell, Bartlam, Fraser, Pepys and Blake1997). Amyloid formation has received significant attention in recent decades, mainly because of its possible role in different neurodegenerative diseases, and there has been a significant progress in the understanding of amyloid fibril structure. However, there are many unresolved questions related to the mechanisms of amyloid formation and the relation between amyloids and diseases (Chiti and Dobson, Reference Chiti and Dobson2017; Eisenberg and Sawaya, Reference Eisenberg and Sawaya2017).
Because amyloids all share the structural feature of being made of stacked β-sheets it is possible that they also share some common mechanisms of formation and toxicity. Deepened understanding of the basic mechanisms by which amyloid formation occurs can be highly valuable for the understanding of amyloid-related diseases. One approach to elucidate these mechanisms is to use simple and well-defined model systems that are easier to probe and control compared with biological systems with complex composition. In the current study, we use a model peptide composed of a peptide fragment from the so-called non-amyloid-β component (NAC) region of the protein α-synuclein (Ueda et al., Reference Ueda, Fukushima, Masliah, Xia, Iwai, Yoshimoto, Otero, Kondo, Ihara and Saitoh1993; Brookes and St Clair, Reference Brookes and Stclair1994). α-Synuclein amyloid formation has been associated with Parkinson's disease, and it is a major constituent of so-called Lewy bodies in neurons, which are hallmarks of the disease (Spillantini et al., Reference Spillantini, Crowther, Jakes, Hasegawa and Goedert1998a, Reference Spillantini, Crowther, Jakes, Cairns, Lantos and Goedertb, Reference Spillantini, Schmidt, Lee, Trojanowski, Jakes and Goedert1997; Serpell et al., Reference Serpell, Berriman, Jakes, Goedert and Crowther2000; Chiti and Dobson, Reference Chiti and Dobson2017). The peptide fragment, spanning from residue 68 to 78 of α-synuclein (68-GAVVTGVTAVA-78), has been suggested to be a minimal fragment of the protein that can give rise to amyloid formation and toxic effects on cells by itself, and has been given the name NACore (Bodles et al., Reference Bodles, Guthrie, Greer and Irvine2001; Rodriguez et al., Reference Rodriguez, Ivanova, Sawaya, Cascio, Reyes, Shi, Sangwan, Guenther, Johnson, Zhang, Jiang, Arbing, Nannenga, Hattne, Whitelegge, Brewster, Messerschmidt, Boutet, Sauter, Gonen and Eisenberg2015). It has previously been shown that the NACore peptide can form both fibrils and small three-dimensional (3D) crystals, and a crystal structure with atomic resolution has recently been determined (Rodriguez et al., Reference Rodriguez, Ivanova, Sawaya, Cascio, Reyes, Shi, Sangwan, Guenther, Johnson, Zhang, Jiang, Arbing, Nannenga, Hattne, Whitelegge, Brewster, Messerschmidt, Boutet, Sauter, Gonen and Eisenberg2015). The crystal structure obtained for NACore might be relevant to the understanding of some of the α-synuclein fibril polymorphs, although later studies have shown that the full-length protein can also arrange with rather different molecular packing in its amyloid fibrils (Tuttle et al., Reference Tuttle, Comellas, Nieuwkoop, Covell, Berthold, Kloepper, Courtney, Kim, Barclay, Kendall, Wan, Stubbs, Schwieters, Lee, George and Rienstra2016; Guerrero-Ferreira et al., Reference Guerrero-Ferreira, Taylor, Mona, Ringler, Lauer, Riek, Britschgi and Stahlberg2018; Li et al., Reference Li, Ge, Murray, Sheth, Zhang, Nair, Sawaya, Shin, Boyer, Ye, Eisenberg, Zhou and Jiang2018). The NACore peptide is therefore probably best viewed as a model peptide that can yield insights into the amyloid phenomena in general, rather than as a specific model for full-length α-synuclein. Here we have investigated how two different solution conditions affect the aggregation of the NACore model peptide, and we discuss how these processes of self-assembly could relate to the behavior of other amyloids, from a physicochemical perspective. In particular, we consider the role of meta-stable states in the formation of amyloids in relation to the aggregation behavior of NACore. To our knowledge, there is no other published work that focuses on the aggregation of the NACore peptide following the major study by Rodriguez et al. (Reference Rodriguez, Ivanova, Sawaya, Cascio, Reyes, Shi, Sangwan, Guenther, Johnson, Zhang, Jiang, Arbing, Nannenga, Hattne, Whitelegge, Brewster, Messerschmidt, Boutet, Sauter, Gonen and Eisenberg2015). The current study therefore also contributes to a foundation for future studies using NACore as a model system for amyloid formation and peptide self-assembly.
Materials and methods
Peptide and sample preparation
Synthetic NACore peptide was purchased from Innovagen AB as a lyophilized powder (GAVVTGVTAVA, uncapped trifluoroacetic acid (TFA) salt, >95% purity as determined by analytical high-performance liquid chromatography and mass spectrometry). The peptide has a molar mass of 944 g mol−1, and samples were prepared as follows for all experiments except for X-ray scattering. Lyophilized peptide powder was dissolved in 2 mM NaOH (pH 11.3) at a concentration of 0.2 mg ml−1 (0.2 mM). NaH2PO4 solutions of different concentrations were then added to the dissolved peptide to lower the pH and induce aggregation. The pH was lowered to either about 6 or 8. For the pH 6 condition the final composition was 0.1 mg ml−1 lyophilized peptide (0.1 mM), 1 mM NaOH, and 10 mM NaH2PO4. For the pH 8 condition the final composition was 0.1 mg ml−1 lyophilized peptide, 1 mM NaOH, and 1 mM NaH2PO4. The samples were then kept quiescently in closed glass vials at room temperature during the incubation period. The nominal peptide concentrations used here were based on the weight of the lyophilized peptide powder, and consequently the actual peptide concentrations are lower because of residual salt and water.
Cryogenic transmission electron microscopy (cryo-TEM)
Either 4 h or 4 days after inducing aggregation by lowering the pH, the samples were dispersed by pipetting up and down and 4 µl of each sample was then transferred to a glow discharged lacey carbon film on a copper grid (Ted Pella) and vitrified in liquid ethane using an automatic plunge freezer (Leica EM GP). The grids were stored in liquid nitrogen until use. A Fischione Model 2550 cryo transfer tomography holder was used to transfer the samples into the transmission electron microscope, a JEM-2200FS (JEOL), equipped with an in-column energy filter (Omega filter), which allows zero-loss imaging. The accelerating voltage was 200 kV and images were recorded with a TVIPS TemCam-F416 digital camera using Serial EM under low-dose conditions.
X-ray scattering
Lyophilized peptide was dispersed in 2 mM NaOH to a concentration of approximately 1 mg ml−1 under gentle agitation for approximately 45 min. A solution of NaH2PO4 was then added to a final composition of 0.5 mg ml−1 lyophilized peptide, 1 mM NaOH, and 10 mM NaH2PO4. The sample was incubated quiescently in a closed glass container overnight (about 20 h) at room temperature. Although this preparation of aggregates was performed at a higher peptide concentration than in the procedure in the section ‘Peptide and sample preparation’, the resulting aggregates appeared very similar, except for faster aggregation kinetics. After incubation the peptide sample was filtered through a small piece of cotton cloth attached to the tip of a syringe. The flow through was discarded and the gel-like pellet above the filter was transferred to a glass vial. Based on visual inspection and circular dichroism (CD) spectroscopy it was observed that most of the peptide was retained above the filter, resulting in a roughly 20-fold increase of peptide concentration compared with the sample before filtration. Part of the sample was transferred to a 1.5 mm diameter glass capillary tube that was mounted and measured in a Ganesha 300 XL X-ray scattering system (SAXSLab) with a 2D PILATUS detector (Dectris) and a GeniX Cu ULD SL X-ray source (Xenocs). Three different detector distances, together covering a q-value range of about 3 × 10⁻² to 25 nm−1, were used. Water was used as a blank with the same setup of the instrument. The scattering from the blank was subtracted from the data before plotting. The measurements were performed at room temperature in an evacuated chamber. A powder diffraction pattern based on a previously reported crystal structure for NACore (PDB ID: 4RIL) (Berman et al., Reference Berman, Westbrook, Feng, Gilliland, Bhat, Weissig, Shindyalov and Bourne2000; Rodriguez et al., Reference Rodriguez, Ivanova, Sawaya, Cascio, Reyes, Shi, Sangwan, Guenther, Johnson, Zhang, Jiang, Arbing, Nannenga, Hattne, Whitelegge, Brewster, Messerschmidt, Boutet, Sauter, Gonen and Eisenberg2015) was calculated using Mercury 3.10 (The Cambridge Crystallographic Data Center, CCDC) (Macrae et al., Reference Macrae, Bruno, Chisholm, Edgington, Mccabe, Pidcock, Rodriguez-Monge, Taylor, Van De Streek and Wood2008).
Circular dichroism (CD) spectroscopy kinetics
The CD spectrum of each sample was measured at different time points. Just before each measurement the sample was dispersed by pipetting up and down and 300 µl of sample was then transferred from the sample vial to a 1 mm path length quartz cuvette (Hellma 110-QS) for measurement. The measurements were performed using a JASCO J-715 CD spectrometer (1 nm band width, 2 s response time, and 20 nm min−1 scan rate). The average of eight scans was used for each spectrum. The HT voltage remained below 500 V for all spectra. The measurements were performed at room temperature. Each individual CD spectrum was fitted with a linear combination of the initial and steady state spectra of the same sample (with the sum of weights equal to 1) such that the sum of the squared residuals between the fit and the fitted spectrum was minimized.
Thioflavin T (ThT) fluorescence kinetics
Before each measurement each sample was dispersed by pipetting up and down, and 50 µl of sample was then transferred into a buffer solution with ThT in a quartz cuvette (Hellma 108.002F-QS). The final composition in the cuvette for all samples was 10 µg ml−1 lyophilized peptide, 10 µM ThT, 1 mM NaH2PO4, and 1 mM Na2HPO4. The content in the cuvette was left to equilibrate for approximately 5 min before the fluorescence was measured using the fluorescence spectrophotometer (Varian Cary Eclipse, excitation at 440 nm and emission monitored from 460 to 660 nm). Each sample was measured three times, with mixing between each measurement.
Results
pH can be used to control NACore fibrillation
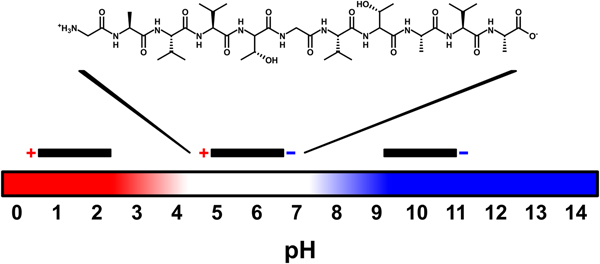
All the amino acid residues of NACore have non-polar side chains, except for two threonine residues. None of the side chains are charged, but at neutral pH the N- and C-termini of the peptide have one positive and one negative charge, respectively. By changing the pH, the net charge of the peptide can be altered. At low pH the C-terminus becomes protonated and the peptide is expected to acquire a net charge of +1. At high pH, the N-terminus becomes deprotonated leading to a net charge of −1. The pK a values for these two sites are expected to be about 3.5 and 8, respectively (Pace et al., Reference Pace, Grimsley and Scholtz2009) (Fig. 1). The peptide has a low solubility in pure water. However, by increasing the pH of the sample through addition of NaOH (2 mM, pH 11.3) the peptide acquires a net negative charge and becomes more soluble (~0.5 mg ml−1, corresponding to about 0.5 mM, at room temperature, Fig. S1a). Under such conditions it has a predominately disordered structure, as judged by CD spectroscopy, and remains unstructured over time (several weeks, Fig. S1b).
Schematic illustration of peptide charge for different pH values. The charges vary with pH because of protonation and deprotonation of the N- and C-termini of the uncapped NACore peptide. Above a pH of about 8 the peptide has a net charge of −1, and below a pH of about 3.5 it has a net charge of +1. At a pH of about 5.5 (the expected isoelectric point) the peptide is zwitter-ionic and has a net charge of zero.

We are here interested in peptide aggregation starting from the disordered state. This was achieved by first dissolving lyophilized peptide at high pH, and then lowering the solubility of the peptide by a pH drop through the addition of NaH2PO4. This induces aggregation, and the formed aggregates appear as macroscopic gel-like particles, prone to syneresis (expulsion of solvent). We here compare two different aggregation conditions. In the first condition, peptide was dissolved in 2 mM NaOH and then diluted with a NaH2PO4 solution to a pH of about 6, which is close to the isoelectric point of the peptide (expected to be at about pH 5.5, based on the pK a values of the N- and C-termini). In the second condition, the dissolved peptide was instead diluted with a lower concentration of NaH2PO4 to a pH of about 8, which is close to the expected pK a value of the N-terminus. In the first condition the peptide is thus expected to have had a net charge of essentially zero, whereas in the second condition the peptide is expected to still have carried a partial net negative charge. Because the pH was altered by the addition of various amounts of NaH2PO4, the ionic strength was higher in the first than in the second condition (about 12 and 3 mM, respectively).
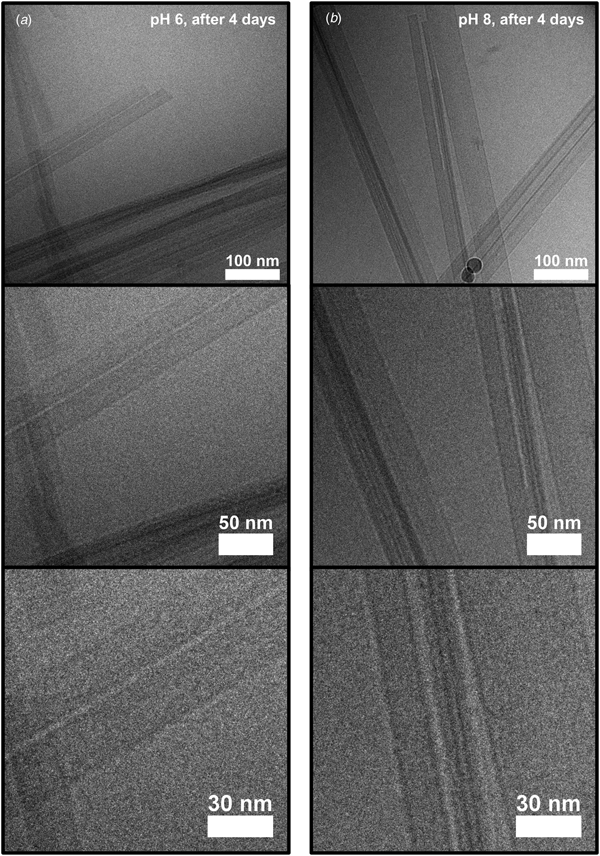
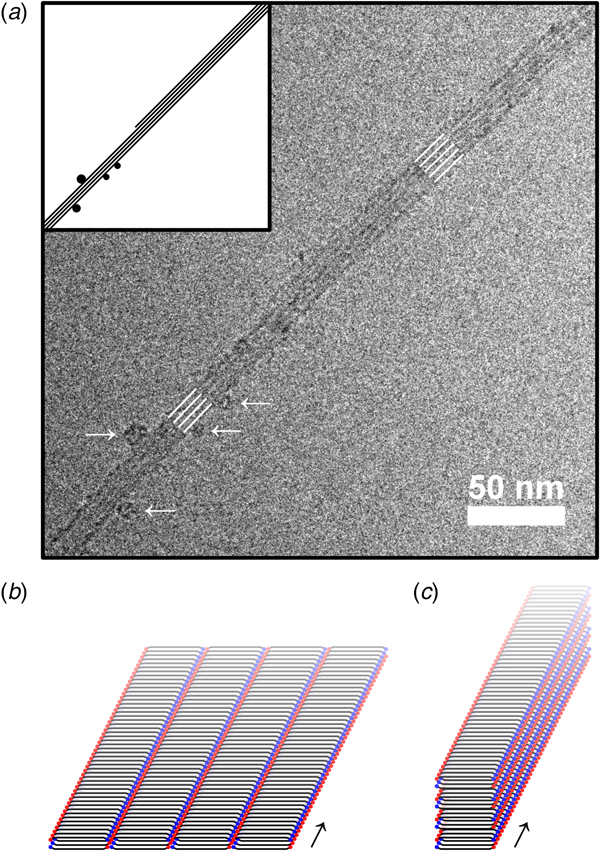
We first conclude that both conditions led to formation of fibrils. The whole aggregation process lasted for several days, as will be described in more detail below, but fibrils could be observed already after a few hours using cryo-TEM (Fig. 2). The fibrillar structures observed at the early stage of the aggregation process (Fig. 2) show clear similarities with the fibrils in samples that had been left to aggregate for several days (Fig. 3). In both cases, the fibrils had a minimum width of about 10 nm. The fibrils were typically very long, often extending for several micrometers, and only with very occasional twists (Fig. S2). Furthermore, the fibrils appeared to have a rectangular cross-section (Fig. S2), thus resembling ribbons. Similar ribbon-like fibril morphologies have been observed also for other peptide systems, such as for fragments of amyloid-β, calcitonin, amylin (IAPP), bovine insulin, fragments of barnase, and glucagon, as well as for short custom-designed model peptides (Fraser et al., Reference Fraser, Nguyen, Surewicz and Kirschner1991; Bauer et al., Reference Bauer, Aebi, Haner, Hermann, Muller, Arvinte and Merkle1995; Goldsbury et al., Reference Goldsbury, Cooper, Goldie, Muller, Saafi, Gruijters and Misur1997; Aggeli et al., Reference Aggeli, Nyrkova, Bell, Harding, Carrick, Mcleish, Semenov and Boden2001; Jimenez et al., Reference Jimenez, Nettleton, Bouchard, Robinson, Dobson and Saibil2002; Diaz-Avalos et al., Reference Diaz-Avalos, Long, Fontano, Balbirnie, Grothe, Eisenberg and Caspar2003; Saiki et al., Reference Saiki, Honda, Kawasaki, Zhou, Kaito, Konakahara and Morii2005; Pedersen et al., Reference Pedersen, Dikov, Flink, Hjuler, Christiansen and Otzen2006). The cryo-TEM images in Figs 2 and 3 further show that fibrils were typically associated into bundles rather than fully separated from each other. Very interestingly, the sides of the fibrillar aggregates were coated with small globular structures at an early stage of the aggregation process under the pH 6 condition (Fig. 2a). This was not seen for the sample at pH 8 (Fig. 2b), and only very few of these globular structures could be discerned from the cryo-TEM images at the later time point in the aggregation process (Fig. 3). Supplementary experiments based on seeded aggregation also revealed similar globular structures on the sides of fibrils at pH 6 (see Figs S5 and S6, and Fig. 5a). Another interesting observation is that a lamellar pattern sometimes could be resolved across the width of the fibrils (Figs 4 and 5a). This lamellar pattern gives information about the molecular packing of the peptide molecules and will be described further below.
Cryo-TEM images (zero-loss with a 6 eV slit) of peptide samples frozen 4 h after lowering the pH to either about 6 (a) or about 8 (b), at three different magnifications. Peptide fibrils with a minimum width of about 10 nm are visible in both types of samples. Interestingly, small globular structures can be seen along the sides of the fibrils in (a), but not in (b).

Cryo-TEM images (zero-loss with a 6 eV slit) of peptide samples frozen 4 days after lowering the pH to either about 6 (a) or about 8 (b), at three magnifications. Fibrils are visible, and they look similar to the ones frozen after 4 h (Fig. 2), except that globular structures covering the fibril sides are not clearly apparent.

(a) Lamellar pattern observed along the width of an especially wide ribbon-like peptide fibril in cryo-TEM (zero-loss with a 15 eV slit). The separation between the stripes is 3.6 nm based on the peak in the 2D Fourier transform of a zoomed in section of the image. (b) X-ray scattering of up-concentrated aggregated peptide material. The separation between the stripes in the cryo-TEM image agrees with the bump at around q = 1.7 nm−1, suggesting that these features derive from the same periodicity in the molecular packing. The slope of the scattering profile in two sections of the low q region is indicated. (c) The high q region of the X-ray scattering profile (WAXS) shown in (b), together with a calculated powder diffraction pattern for the peptide crystal structure from Rodriguez et al. (Reference Rodriguez, Ivanova, Sawaya, Cascio, Reyes, Shi, Sangwan, Guenther, Johnson, Zhang, Jiang, Arbing, Nannenga, Hattne, Whitelegge, Brewster, Messerschmidt, Boutet, Sauter, Gonen and Eisenberg2015) (blue curve). The q-values for the calculated powder diffraction pattern had to be scaled with a factor of 0.97 to align with the experimental data, but otherwise agrees very well in terms of the positions of the peaks. The peaks labeled 1, 2, 3, 4, and 5 are located at q-values of 1.7, 3.7, 4.5, 7.4, and 13 nm−1, in the experimental data (corresponding to 3.6, 1.7, 1.4, 0.85, and 0.47 nm in real space). We assign these peaks to the periodicities with miller indices [2, 0, 0], [2, 0, −1], [2, 0, 1], [2, 0, −2], [0, 0, 2], [2, 0, 2], [1, 1, −1], and [1, 1, 1] in the crystal structure (where [2, 0, −2], [0, 0, 2], and [2, 0, 2], as well as [1, 1, −1] and [1, 1, 1] fuse into single peaks). The inset in (c) shows the 2D scattering pattern on the X-ray detector after background subtraction.

(a) A zoomed-in section of a cryo-TEM image from a seeded fibrillation experiment at pH 6 (see Figs S5 and S6). In this image a fibril with the same type of 3.6 nm lamellar pattern as reported in Fig. 4 can be seen (marked with white lines) and several globular structures can be observed along the side of the fibril. The most prominent of these are marked with white arrows. Interestingly, the number of lines in the lamellar pattern changes from five in the top right section to four in the bottom left section. This could give clues about the mode of fibril growth. The inset shows a schematic interpretation of the observed structure. (b) Schematic cartoon of the terminus-to-terminus packing of peptide fibrils, which is the apparent mode of packing in the ribbon-like fibrils, based on comparison between cryo-TEM and X-ray scattering data. In the figure, the basic unit of the fibril is made of two sandwiched parallel β-sheets. The N- and C-peptide termini are shown as blue and red dots, respectively. The ribbons are expected to be stabilized through ionic interaction between match-up termini of the β-sheet sandwiches. (c) Schematic cartoon of the face-to-face packing of peptide fibrils, where interaction between the β-sheet sandwiches occurs primarily through the peptide side chains. The arrows in (b) and (c) show the long axis of the fibrils.

Molecular organization of the peptide in the ribbon-like fibrils
To obtain information about the fibrillar structures at a molecular level, we performed wide-angle X-ray scattering (WAXS) on peptide aggregates prepared by pH quenching from 11.3 to about 6 (Figs 4b and 4c). WAXS reveals structures at the level of a few nanometers and below. The WAXS pattern had several peaks, indicating an ordered molecular structure. In particular, a sharp peak was observed at 13 nm−1, and a broader peak was present at 7.4 nm−1 (Fig. 4c). These peaks correspond to periodicities of 0.47 and 0.85 nm in real space and are characteristic for the separation between β-strands within β-sheets and between stacked β-sheets in amyloid-type aggregates (Sunde et al., Reference Sunde, Serpell, Bartlam, Fraser, Pepys and Blake1997; Rodriguez et al., Reference Rodriguez, Ivanova, Sawaya, Cascio, Reyes, Shi, Sangwan, Guenther, Johnson, Zhang, Jiang, Arbing, Nannenga, Hattne, Whitelegge, Brewster, Messerschmidt, Boutet, Sauter, Gonen and Eisenberg2015). It should be noted that due to the limited sensitivity of the instrument, the sample that was measured with X-ray scattering had a peptide concentration that was approximately 100 times higher (~10 mg ml−1) than the samples studied using cryo-TEM. This may have influenced some aspects of the aggregate structure, in particular the higher order packing of the fibrils, such as bundling. Rodriguez et al. performed WAXS on a dispersion of NACore nanocrystals (Rodriguez et al., Reference Rodriguez, Ivanova, Sawaya, Cascio, Reyes, Shi, Sangwan, Guenther, Johnson, Zhang, Jiang, Arbing, Nannenga, Hattne, Whitelegge, Brewster, Messerschmidt, Boutet, Sauter, Gonen and Eisenberg2015). Although our sample preparation is different from the one used by Rodriguez et al., their reported WAXS pattern is still very similar to the one we obtained. This suggests that the packing at the molecular level is the same and that it is a very general type of packing for the NACore peptide. Indeed, the scattering pattern we obtained also agrees with a calculated powder diffraction pattern based on their reported crystal structure (PDB ID: 4RIL) (Rodriguez et al., Reference Rodriguez, Ivanova, Sawaya, Cascio, Reyes, Shi, Sangwan, Guenther, Johnson, Zhang, Jiang, Arbing, Nannenga, Hattne, Whitelegge, Brewster, Messerschmidt, Boutet, Sauter, Gonen and Eisenberg2015) (Fig. 4c).
Features of the WAXS diffraction pattern (Figs 4b and 4c) and the cryo-TEM data of the aggregated peptide can be correlated with each other. We measured the separation between the stripes of the lamellar pattern sometimes resolved along the width of fibrils in the cryo-TEM images and obtained a value of 3.6 nm (Fig. 4a). This agrees well with the broad peak in the WAXS pattern at q = 1.7 nm−1, corresponding to a periodicity in real space that is also approximately 3.6 nm (Figs 4b and 4c). If the molecular packing in the NACore fibrils in the cryo-TEM images is the same as in the crystal structure from Rodriguez et al. (Reference Rodriguez, Ivanova, Sawaya, Cascio, Reyes, Shi, Sangwan, Guenther, Johnson, Zhang, Jiang, Arbing, Nannenga, Hattne, Whitelegge, Brewster, Messerschmidt, Boutet, Sauter, Gonen and Eisenberg2015), as is suggested by our WAXS data, then this separation corresponds to the periodicity [2, 0, 0] in the crystal structure, which comes from the terminus-to-terminus packing of extended NACore molecules. This apparent molecular orientation, where the terminus-to-terminus packing of the peptide molecules makes up the width of ribbon-like fibrils (Fig. 5b), is different from the molecular packing that has sometimes been implied in the literature for other ribbon-forming peptides (Saiki et al., Reference Saiki, Honda, Kawasaki, Zhou, Kaito, Konakahara and Morii2005; Reynolds et al., Reference Reynolds, Adamcik, Berryman, Handschin, Zanjani, Li, Liu, Zhang and Mezzenga2017), where the width of the ribbons is formed by the face-to-face packing of many β-sheets (Fig. 5c).
In addition to WAXS, we also measured X-ray scattering for smaller q-values (small-angle X-ray scattering; SAXS). In Fig. 4b we present the full SAXS and WAXS patterns on a double logarithmic scale. At low q (below 0.1 nm−1) the scattered intensity, I(q), shows a power law with I(q) proportional to q −2.2. The exponent is close to 2, which is expected for large two-dimensional (2D) objects (Lindner and Zemb, Reference Lindner and Zemb2002). Hence, it is possible that the aggregates have grown to become more disk-like when the sample was being concentrated. Another possibility is that the fibrillar aggregates, as observed by cryo-TEM, have retained their shape and dimensions, and that the exponent is associated with an effective structure factor (Solomon and Spicer, Reference Solomon and Spicer2010). In this case the particle form factor would show a q −1 decay in this q-range. However, if the fibrils are not colloidally stable they may aggregate into clusters, and if such clusters can be described as mass fractals of dimension D (less than 3), we expect I(q) to be proportional to q −D. Fibril aggregation into fractal-like clusters with D ≈ 2.2 is supported by the fact that the samples, as viewed by the naked eye, become somewhat turbid when the peptide self-assembles. Furthermore, the pH of 6 is very close to the expected isoelectric point of the peptide, and the fibrils are thus not expected to carry any significant net charge. Around approximately q = 0.3 nm−1, we see a crossover from q −2.2 to an exponent of −4 (Fig. 4b). This indicates that we here have reached the so-called Porod regime (Lindner and Zemb, Reference Lindner and Zemb2002), and we can estimate the smallest dimension of the fibril cross-section as approximately 3 nm.
Lowering the pH closer to the isoelectric point does not lead to faster fibrillation
The aggregation process was followed over time for the two different pH conditions using CD spectroscopy to study changes in peptide secondary structure. After lowering the pH, the CD measurements show a gradual transition from a disordered structure to a β-sheet containing structure. At a concentration of 0.1 mg ml−1 lyophilized peptide (about 0.1 mM) the fibrillation typically extended over several days (Figs 6a–6c). At each measured time point, the CD spectra of each sample was fitted with a linear combination of the initial state spectrum, which corresponds to unstructured peptide, and the final steady state spectrum, which corresponds to the stable state enriched in the β-sheet structure. Figure 6c shows how the fractions of the final spectrum in the linear combinations increase with time, and thus shows the progression of the transformation process. Under the pH 8 condition the half-time of the process was about 12 h (Fig. 6c). Here, the half-time is defined as the time at which the monitored quantity has reached half of its final steady state value. The half-time for the pH 6 condition was about 16 h (Fig. 6c). In other words, even though the lower pH is closer to the expected isoelectric point of the peptide, the conformational change was slightly slower. A slightly faster fibrillation for the higher pH condition was also supported by similar experiments performed with a separate batch of synthetic peptide (Fig. S3), as well as based on seeded aggregation reactions (Fig. S5). However, the presence of a clear lag phase during unseeded fibrillation, which we did not observe in the experiments of Fig. 6, is something that we have found to be variable between peptide batches (Fig. S3). In addition to CD spectroscopy, the process of amyloid formation was also monitored using ThT fluorescence (Nilsson, Reference Nilsson2004). This was done on a separately prepared set of samples, but again the half-time of the aggregation process was shown to be slightly shorter for the higher pH condition (about 10 h) compared with the lower pH condition (about 14 h), similar to the CD data (Fig. 6d).
CD spectra of peptide samples as a function of time for two replicates after lowering the pH to about 6 (a) or 8 (b). The samples came from the same initial solution of peptide dissolved at high pH. The fits are linear combinations of the initial (0 h) and final (144 h) spectra for each sample. (c) The fraction of the final spectrum in the linear combinations used in the fits, plotted as a function of time. (d) Normalized ThT fluorescence from peptide samples after lowering the pH to either about 6 or 8 as a function of time, from a different experiment using another initial solution of dissolved peptide than the CD measurements. The circles and crosses show data points for two separate sets of replicate samples (and each data point is the average of three measurements on the same sample). From (c) and (d) the half-times of the processes can be estimated by calculating where linearly interpolated lines for each sample reach half the steady state value. For the CD measurements this gives averages of about 12 and 16 h for the pH 8 and 6 samples, respectively (11.87 and 11.58 h for the two pH 8 replicates, compared with 16.33 and 15.71 h for the two pH 6 replicates, which yields p = 0.0062 for an unpaired two-tailed t test assuming equal variance). For the ThT fluorescence measurements the corresponding average values are about 10 and 14 h for the pH 8 and 6 samples, respectively (9.094 and 10.33 h, compared with 13.46 and 13.63 h for the individual replicates, yielding p = 0.025 for the same t test). The samples at pH 8 thus reached steady state slightly faster than the samples at pH 6, based both on the CD spectroscopy and ThT fluorescence data.

In the final CD spectra the amplitude of the peak around 200 nm was approximately 70% larger under the pH 8 condition than the amplitude of the corresponding peak under the pH 6 condition (Figs 6a and 6b). It is difficult to tell to what extent this was due to actual differences in morphology or extent of aggregation versus due to factors such as differences in light scattering and sample heterogeneity (Bustamante et al., Reference Bustamante, Tinoco and Maestre1983; Wallace and Teeters, Reference Wallace and Teeters1987). Similar to the CD data, the measured absolute ThT signal also differed between the two pH conditions in that the absolute intensity of the fluorescence reached a higher plateau value for the pH 6 samples than for the pH 8 samples (about 60% higher, Fig. S7). This could indicate that the final amount of β-sheet differed between the two conditions, or could alternatively be due to other factors, such as differences in the accessibility of ThT binding sites. Supplementary experiments based on centrifugation suggest that the final amount of aggregated material is rather similar for the two pH conditions (Fig. S4).
Discussion
Fibril morphology and lack of regular twisting
The morphology of a β-sheet with the lowest free energy is in general a twisted structure, which can be understood on basis of the chiral nature of amino acids (Chothia, Reference Chothia1973; Weatherford and Salemme, Reference Weatherford and Salemme1979). Many amyloid fibrils have an inherent twist (Chiti and Dobson, Reference Chiti and Dobson2017; Eisenberg and Sawaya, Reference Eisenberg and Sawaya2017). This is likely due to that the preferred twist of β-sheets is conserved to some extent even when they assemble into fibrils. However, due to geometric reasons the degree of twisting must decrease as the fibrils extend in width (Aggeli et al., Reference Aggeli, Nyrkova, Bell, Harding, Carrick, Mcleish, Semenov and Boden2001). A possible explanation for the non-twisted nature of the ribbon-like NACore fibrils observed here using cryo-TEM is thus that the fibrils extend sufficiently in width and/or thickness to counteract twisting. This effect could be enhanced by the molecular orientation of the peptide molecules within the fibrils. If the width of the NACore fibrils observed in cryo-TEM arises primarily from the terminus-to-terminus packing as suggested by our data (Fig. 5b), rather than from the face-to-face packing (Fig. 5c), then there is likely more stringent geometric constraints imposed on the fibrils (due to ionic interactions, see Fig. 5), leading to a less twisted morphology (Periole et al., Reference Periole, Huber, Bonito-Oliva, Aberg, Van Der Wel, Sakmar and Marrink2018).
Fibrillation kinetics and metastable states
With regard to fibrillation kinetics, it is interesting that lowering the pH closer to the expected isoelectric point of the NACore peptide, together with the associated increase of the ionic strength, led to a slightly slower fibrillation, rather than faster (Fig. 6). This observation can give insights into the physical factors that determine the rate of growth of the fibrils. Since the fibrillation lasts several days, it seems clear that the fibrillation process is not simply diffusion limited, but that there exists some other type of free energy barrier that limits the rate of fibril formation. The peptide is expected to have a partial net negative charge at pH 8, but to have a net charge of essentially zero at pH 6. One could therefore have expected that the fibrillation would go faster closer to the isoelectric point at pH 6, due to a lower electrostatic barrier. However, there are other factors that can influence the fibrillation kinetics:
I. Highly ordered amyloid aggregates are likely not the only types of aggregates that can form from the peptide. It is likely that amorphous aggregates also can form. This has indeed been suggested for other amyloid systems, such as for concanavalin A, β2-microglobulin, and full length α-synuclein (Hoyer et al., Reference Hoyer, Antony, Cherny, Heim, Jovin and Subramaniam2002; Vetri et al., Reference Vetri, Canale, Relini, Librizzi, Militello, Gliozzi and Leone2007; Yoshimura et al., Reference Yoshimura, Lin, Yagi, Lee, Kitayama, Sakurai, So, Ogi, Naiki and Goto2012). A sudden strong reduction of peptide solubility, for example caused by a quick change in pH to the isoelectric point, could lead to the formation of such amorphous aggregates through jamming of the system. The highly ordered amyloid fibrils could still be thermodynamically more stable, but conversion from jammed amorphous aggregates might be slow. At a pH further away from the isoelectric point of the peptide, the system is likely less prone to jamming (Hagan et al., Reference Hagan, Elrad and Jack2011).
II. For the highly ordered amyloid fibrils to grow, each attaching peptide molecule must be in a conformation that allows it to fit into the site of attachment. A change in solution conditions (such as pH or salt concentration) could change the distribution of internal conformations adopted by each peptide molecule, and make it either less or more likely to attach successfully to a growing fibril. A drop in pH could thereby cause a distribution of peptide molecule conformations that leads to slower fibril formation. A molecular dynamics simulation study of the preferred conformations of various α-synuclein fragments has recently been performed (Ilie et al., Reference Ilie, Nayar, Den Otter, Van Der Vegt and Briels2018), showing that the intrinsically preferred conformations of the isolated peptide fragments can indeed be quite far from their conformations in fibrils (of full length α-synuclein).
Both examples listed above are related to metastability at some level of the system. In this context, the globular structures attached to the sides of fibrils observed with cryo-TEM at an early time point of the aggregation process (Figs 2a and 5a) for the condition with a pH close to the expected isoelectric point of NACore are particularly interesting. We propose that these structures are amorphous NACore containing peptide aggregates adsorbed on the surface of already existing fibrils and that this causes a slight inhibition of fibrillation through mechanism I alone or in combination with II. Supplementary experiments based on seeded fibrillation reactions also give support to this idea (Figs S5 and S6, and Fig. 5a). This is similar to the previously proposed nucleated conformational conversion mechanism of amyloid formation (Serio et al., Reference Serio, Cashikar, Kowal, Sawicki, Moslehi, Serpell, Arnsdorf and Lindquist2000; Lee et al., Reference Lee, Culyba, Powers and Kelly2011; Wei et al., Reference Wei, Jiang, Xu, Li, Zhang, Yan, Chan-Park, Liu, Tang, Mu and Pervushin2011; Auer et al., Reference Auer, Ricchiuto and Kashchiev2012). Rather than the intermediate structures being directly on-pathway, our comparison between different fibrillation conditions suggests that they are part of a somewhat slower kinetic path.
There is also a strong similarity between this proposed behavior and a simulation study by Saric et al. (Reference Saric, Buell, Meisl, Michaels, Dobson, Linse, Knowles and Frenkel2016). In their study they investigated the effects of peptide–peptide interactions on the kinetics of fibril growth in a coarse-grained model. They found that increasing monomer-fibril affinity initially led to faster fibrillation, but when the affinity was too strong, peptide molecules became kinetically trapped on the surface of fibrils. In their system, the faster growth at intermediate monomer-fibril affinities occurred through a secondary-nucleation-like process. Secondary nucleation has been proposed as the dominant amyloid fibril growth mechanism for proteins such as amyloid-β and α-synuclein under certain conditions (Cohen et al., Reference Cohen, Linse, Luheshi, Hellstrand, White, Rajah, Otzen, Vendruscolo, Dobson and Knowles2013; Buell et al., Reference Buell, Galvagnion, Gaspar, Sparr, Vendruscolo, Knowles, Linse and Dobson2014; Tornquist et al., Reference Tornquist, Michaels, Sanagavarapu, Yang, Meisl, Cohen, Knowles and Linse2018). Our observations might thus have special relevance in relation to mechanisms of secondary nucleation in amyloid systems. We also note the similarity between small globular NACore containing peptide aggregates and amyloid oligomers, which have commonly been suggested to be more toxic to cells than mature fibrils (Chiti and Dobson, Reference Chiti and Dobson2017; Eisenberg and Sawaya, Reference Eisenberg and Sawaya2017).
Speculation
An important aspect of peptide self-assembly concerns the equilibrium state. We speculate here that the NACore fibrils observed with cryo-TEM are precipitated fragments of a 3D crystalline peptide phase, and consequently that even the fibrils are meta-stable and not at true thermodynamic equilibrium. This is along similar lines as arguments by Reynolds et al. (Reference Reynolds, Adamcik, Berryman, Handschin, Zanjani, Li, Liu, Zhang and Mezzenga2017) and Adamcik and Mezzenga (Reference Adamcik and Mezzenga2018).
Supplementary material
The supplementary material for this article can be found at https://doi.org/10.1017/S0033583519000039
Author ORCIDs
Jon Pallbo, 0000-0003-3652-3551
Acknowledgements
We thank Dr. Anna Carnerup for performing the cryoTEM imaging at the national Center for High Resolution Electron Microscopy (nCHREM) in Lund, Sweden.
Financial support
Financial support from Knut and Alice Wallenberg Foundation (KAW 2014.0052) and The Swedish Research Council (E.S., 2015-04248) are acknowledged. The Knut and Alice Wallenberg Foundation also funded the acquisition of equipment used for SAXS and WAXS.
Conflict of interest
None.




 Open access

