

1 Introduction
The purposes of the paper are two. The first is methodological–to illustrate how Signal Detection Theory (SDT) (Reference Green and SwetsGreen & Swets, 1966; Reference SwetsSwets, 1996; Reference Swets, Dawes and MonahanSwets et al., 2000; Reference WickensWickens, 2002), which was developed to analyze the behavior of a single judge, can be applied to the analysis of system-level decision making behavior (e.g., McClelland, 2011; Reference Swets, Dawes and MonahanSwets et al., 2000). The distinction between idiographic and nomothetic approaches in psychology is widely attributed to Allport (1937). In JDM, idiographic research typically involves intensive study of an individual in order to achieve better understanding of him or her; e.g., Gonzalez-Vallejo et al. (1998) developed models of individual physicians’ diagnostic judgments and treatment decisions for acute otitis media in children. Nomothetic research in JDM generally involves investigations of large groups of people to find general laws of behavior that hold for people in general; e.g., Tversky and Kahneman’s (1981) well-known studies of framing effects on preference reversal, which aggregates and summarizes the responses of large numbers of respondents to the same problem frame.
Generally speaking, idiographic research relies on a single individual-many cases paradigm, whereas nomothetic research relies on a many individuals-one case paradigm. The present study illustrates what can be called systemic research, which relies on a many individuals-many cases approach, and which yields results that describe the JDM behaviors of systems, rather than those of specific individuals or of “people in general.”
The second purpose of the paper is substantive—to use SDT to analyze the ability of the U.S. child welfare services system to detect child maltreatment and to investigate dissimilarities in system performance for different racial and ethnic groups. This is a substantive topic of considerable practical and policy importance. To give some idea of the scale of the problem, in the United States during 2011 (U.S. Department of Health and Human Services, 2012), Child Protective Services (CPS) agencies received an estimated 3.4 million referrals alleging child abuse or neglect, involving an estimated 6.2 million children. An estimated 57.6% of the referrals came from teachers, police officers, lawyers, social services staff, or others who had contact with the alleged victim as part of their jobs. Friends, neighbors, and relatives submitted 18.2% of the reports. 21.5% of the victims were African Americans, 22.1% were Hispanic, and 43.9% were White.
The disproportional representation of minority children in the child welfare system has been a topic of concern for more than forty years (e.g., Ards et al., 2003; Reference BarthBarth, 2005; Billingsley & Giovanni, 1972; Reference CaseyCasey Family Programs, 2006; Chapin Hall Center for Children, 2008; Courtney & Skyles, 2003; Reference Derezotes, Poertner and TestaDerezotes et al., 2005; Reference HillHill, 2006; Reference Needell, Brookhart and LeeNeedell et al., 2003; Reference Shaw, Putnam-Hornstein, Magruder and NeedellShaw et al., 2008; U.S. General Accountability Office, 2007; Reference Yaun, Hedderson and CurtisYaun et al. 2003). Perhaps because of lack of agreement about the precise nature, extent, or causes of racial and ethnic disproportionality, it remains an issue of continued concern (e.g., Bartholet, 2009, 2011; Reference Bartholet, Wulczyn, Barth and LedermanBartholet et al., 2011; Reference Dorch, Bathman, Foster, Ingels, Lee, Miramontes and YoungbloodDorch et al., 2010; Reference Drake and Jonson-ReidDrake & Jonson-Reid, 2011; Reference Drake and Jonson-ReidDrake et al., 2011; Reference McRoy, Belanger and GreenMcRoy et al., 2011; Reference MumpowerMumpower, 2010; Reference Putnam-HornsteinPutnam-Hornstein, 2011; Reference Richardson and DerezotesRichardson & Derezotes, 2010).
Mumpower (2010) analyzed the “front end” (Courtney & Skyles, 2003) of the child welfare services system—the referral and substantiation processes—in terms of the system’s ability to detect instances of child maltreatment. That paper was intended primarily for scholars and practitioners in the field of child welfare services and made use of only rudimentary SDT analytic methods. Nonetheless, even those simple analyses gave evidence that there were higher rates of false positives, false negatives, and true positives for Blacks than for other groups.
The present paper makes use of more sophisticated SDT analytic techniques and extends the earlier work in two important ways. First, it considers both the Endangerment and Harm Standards (discussed below) of child maltreatment and examines differences in results and conclusions depending on which standard is used to define child maltreatment. Second, SDT analyses of decision performance offer new insights into effects associated with race and ethnicity in the child welfare services system.
In particular, the paper addresses seven research questions:
-
1. What is the probability that instances of child maltreatment will be detected by the child welfare services system?
-
2. What is the overall accuracy of the child welfare screening system? How accurate is the system with respect to maltreatment? How accurate is the system with respect to non-maltreatment?
-
3. What are the rates of false negatives and false positives? Are the rates different for the two types of errors?
-
4. What is the probability that allegations of child maltreatment will be substantiated?
-
5. How accurate is the screening process? What percentage of cases is accurately classified?
-
6. What shapes of ROC curves and what values of d ′ and C (defined below) characterize the performance of the child welfare services system?
-
7. Are there differences among racial and ethnic groups with respect to the answers for each of the above questions?
2 Method
SDT analyses are widely used in psychological, social, and medical research (e.g., see Swets, 1996; Reference Swets, Dawes and MonahanSwets et al., 2000), but have been used rarely by social work researchers or others studying child welfare or child welfare services (for exceptions, see Dalgleish, 1988; Reference Egu and WeissEgu & Weiss, 2003; Reference Mansell, Ota, Erasmus and MarksMansell et al., 2011; Reference RuscioRuscio, 1998; Reference Shlonsky and WagnerShlonsky & Wagner, 2005). The basic framework for the analyses appears in Figure 1. Two key variables are included in all analyses.
Framework for SDT analysis of the referral and substantiation processes of the child welfare services system.
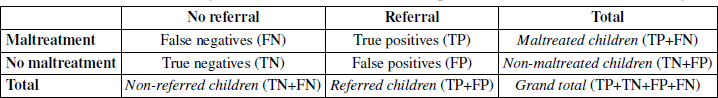
The first is maltreatment, which is defined to have only two possible states—either the presence of maltreatment or its absence. The second variable is simply whether or not a referral—an allegation of neglect or abuse—has been made. There are four possible exhaustive and mutually exclusive outcomes:
-
1. True positives (TP), defined as children for whom a referral has been made and for whom that allegation has been substantiated,
-
2. False positives (FP), defined as children for whom a referral was made but was not substantiated,
-
3. True negatives (TN), defined as children for whom no referral was made and who are not maltreated, and
-
4. False negatives (FN), defined as children for whom no referral was made but who are in fact neglected or abused.
Eight performance measures can be derived from this simple matrix. The first five were used in Mumpower (2010). The additional three measures, d ′, C, and ROC are commonly used in SDT analyses, but were not included in the earlier paper, which addressed a more substantively oriented audience.
-
1. The positive predictive value is the probability that a referral will be ascertained to have been mistreated. This is defined as the number of true positives divided by the total number of referrals: TP/(TP+FP). The maximum positive predictive value is 1.0, which would be achieved if every referral were found to have been mistreated.
-
2. The negative predictive value is the probability that a child who is not referred is not mistreated. This is computed by dividing the number of true negatives by the total number of children who were not referred: TN/(TN+FN). The maximum negative predictive value is 1.0, which would mean that every child who was not referred was also not mistreated.
-
3. The true positive rate is the percentage of maltreatment cases that are referred and substantiated. The true positive rate is defined as the number of true positives divided by the sum of true positives plus false negatives: TP/(TP+FN). The maximum true positive value is 1.0, which would mean that every maltreated child was referred and substantiated. Correspondingly, the false negative rate is simply (1−TP).
-
4. The false positive rate is the percentage of children who are not maltreated and who were referred. It is computed by dividing the number of false positives by the sum of true negatives plus false positives: FP/(TN+FP). The minimum false positive value is 0.0, which would mean that no non-maltreated child was referred.
-
5. Accuracy measures the percentage of correct diagnoses, weighting both positive and negative diagnoses equally. It is computed by summing the number of true positives and true negatives and dividing by the sum of all cells: (TP+TN)/(TP+TN+FP+FN). The maximum value is 1.0, if every case is correctly classified
SDT is concerned with situations in which judgments are made to categorize ambiguous stimuli. The stimuli may represent a signal or they may represent noise. SDT estimates two main parameters from empirical data.
-
6. The first of these is called d ′, which represents the strength of the signal relative to the noise. A value of 0.0 would mean that the signal is not differentiable from noise. Higher values of d ′ represent a stronger signal, reflecting the degree to which the signal and noise distributions are separated. In theory, there is no upper limit to the value of d ′, but in practice the upper limit is about 4.0, which would signify that there is virtually no overlap between the noise and signal distributions. A value of 1.0 indicates that the mean of the signal distribution lies one standard deviation to the right of the mean of the noise distribution. Typically, the noise distribution is assumed to be normally distributed. Because SDT assumes that signal is added to noise, the signal distribution is also assumed to be normally distributed and to have the same variance as the noise distribution.
-
7. The second main parameter in SDT is called C and reflects the strategy for setting a decision threshold to decide whether to make a positive decision. SDT presumes that decision makers establish a threshold and make a positive decision when that value is exceeded—in this case, decide to make a referral. But errors sometimes occur. Sometimes when the threshold is exceeded the case will be from the noise distribution; this results in a false positive. Sometimes when the threshold is not exceeded the case will nevertheless be from the signal distribution; this results in a false negative. The value of C measures the propensity of the decision maker to make a positive decision. A value of 0.0 indicates that the decision threshold is set at a level that yields equal rates of false positives and false negatives. A positive value of C indicates that the decision maker is conservative in setting the threshold, meaning that the rate of false negatives is higher than the rate of false positives. A negative value of C indicates that the decision maker is liberal in setting the threshold, meaning that the rate of false positives is higher than the rate of false negatives.
-
8. The Receiver Operating Characteristic (ROC) curve combines information about d ′ and C and shows how decision performance varies as a function of the interaction between signal strength (as measured by d ′) and decision threshold (as measured by C). Specifically, the ROC plots the joint distribution of TP and FP probabilities, with p(TP) plotted on the y-axis and p(FP) plotted on the x-axis. Highly arched curves indicate a strong signal, whereas flatter curves reflect weaker signal strength. A straight-line, diagonal ROC (from the origin to the northeast) signifies the absence of a signal, or guessing. All possible values of C lie somewhere on the ROC curve. The specific location indicates the tradeoffs between true positives and false positives.
2.1 Data sources
Data for the present analyses come from three sources. First, the Fourth National Incidence Study of Child Abuse and Neglect (NIS-4) is a report to Congress from the Administration for Children and Families, U.S. Department of Health and Human Services (Reference Sedlak, Mettenburg, Basena, Petta, McPherson, Greene and LiSedlak et al., 2010). NIS-4 provides estimates of the incidence of child abuse and neglect in the United States. It serves as the nation’s needs assessment on child abuse and neglect. NIS-4 included children who were investigated by CPS agencies, but also used a sentinel survey methodology to obtain data regarding other children who were recognized as maltreated by community professionals. These include professionals that have contact with children and families in police and sheriffs’ departments, public schools, day care centers, hospitals, voluntary social service agencies, mental health agencies, county juvenile probation and public health departments, public housing, and shelters for runaway and homeless youth and for victims of domestic violence. NIS-4 estimates therefore include both abused and neglected children who are in the official CPS statistics and those who are not. NIS-4 is based on data from a nationally representative sample (based on a sample size of 140,206 CPS data forms from 122 counties) collected during a three-month study period that spanned 2005–2006. The NIS uses standard definitions of abuse and neglect so that estimates of the numbers of maltreated children and incidence rates have a calibrated, standard meaning across various sites, sources, and cycles. (For further details, please see the Methodology section, Sedlak et al., 2010, pp. 2-1–2-20; also see https://www.nis4.org/DefAbuse.asp.)
The second data source is the National Child Abuse and Neglect Data System (NCANDS). In particular, the analyses use data contained in Child Maltreatment 2009 (U.S. Department of Health and Human Services, 2010), which provides national and state statistics about child maltreatment derived from data collected by CPS agencies. National statistics are based primarily on case-level data.
The third data source is the series of Child Welfare Services Reports for California (Reference Needell, Webster, Armijo, Lee, Dawson, Magruder, Exel, Glasser, Williams, Zimmerman, Simon, Putnam-Hornstein, Frerer, Cuccaro-Alamin, Lou, Peng, Holmes and MooreNeedell et al., 2011). The Child Welfare Dynamic Report System is part of the California Child Welfare Performance Indicators Project, which is a collaborative effort between the California Department of Social Services and the University of California, Berkeley. Among other information, this system provides summary statistics relating to referral and substantiation rates for California children in various racial and ethnic groups. (Data from the State of California are also included, along with data from all other states, in the NCANDS database as well.)
3 Analyses and results
3.1 National sample statistics
It is instructive to begin with national data to define a baseline case. These analyses define maltreatment to include both abuse and neglect and rely on definitions of maltreatment, abuse, and neglect used in the NIS-4, which uses two standards in estimating the incidence of child maltreatment—the Harm Standard and the Endangerment standard. The Harm Standard is relatively stringent, classifying children as maltreated only if they have already experienced demonstrable harm as a result of maltreatment. Incidence estimates based on the Endangerment Standard include all Harm Standard children, but also include children who have not yet been harmed by maltreatment, but who have experienced abuse or neglect that placed them in danger of being harmed. (For further discussion of the two standards, see https://www.nis4.org/DefAbuse.asp.)
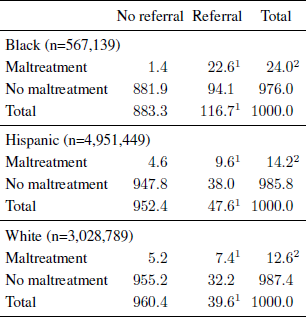
An analysis of U.S. national data regarding referrals and substantiations of child maltreatment for the Endangerment and Harm Standards is given in Table 1. According to NIS-4 (Reference Sedlak, Mettenburg, Basena, Petta, McPherson, Greene and LiSedlak et al., 2010), the estimated national incidence of Maltreatment is 39.5 per 1,000 children for the Endangerment Standard and 17.1 for the Harm Standard, as shown in the marginal entries for Total Maltreatment. According to Child Maltreatment 2009 (U.S. Department of Health and Human Services, 2010), the national incidence of referrals is 43.1 per 1,000 children, as shown in the marginal entries for Total Referral, and the national incidence of victimization (as indicated by substantiated referrals) is 10.1 per 1,000 children, as shown in the cell entry for Maltreatment/Referral. All remaining cell values are derived arithmetically.

1 Source: NIS-4, Table 3-3 (Reference Sedlak, Mettenburg, Basena, Petta, McPherson, Greene and LiSedlak et al., 2010)
2 Source: NIS-4, Table 3-1 (Reference Sedlak, Mettenburg, Basena, Petta, McPherson, Greene and LiSedlak et al., 2010)
3 Source: Child Maltreatment 2009, Table 2-1 (U.S. Dept. of Health and Human Services, 2010)
4 Source: Child Maltreatment 2009, Table 3-5 (U.S. Dept. of Health and Human Services, 2010)
As shown in Table 3, the positive predictive value is 0.23 indicating that nationally about 23% of referrals are substantiated. The two standards lead to only slightly different estimates of negative predictive value. Under the Endangerment Standard, the estimated negative predictive value is 0.97; under the Harm Standard, the negative predictive value is 0.99. The vast majority of those children who are not referred are not maltreated.

Although they differ little with respect to positive predictive and negative predictive values, the two standards lead to substantially different estimates of the true positive rate. Under the Endangerment Standard, the estimated true positive rate is 0.26; under the Harm Standard, the estimated true positive rate is 0.59. If the less stringent standard is used, it is estimated that only 26% of maltreated children are referred and substantiated. If the more stringent definition is used, the estimated percentage of maltreated children who are substantiated referrals rises to 59%.
The estimated false positive rate for each standard is 0.03; the rates are not precisely identical but round to the same numerical value. Accuracy is 0.94 for the Endangerment Standard and 0.96 for the Harm Standard; under either standard, the vast majority of cases are correctly categorized, largely because the vast majority of children are not maltreated and a vast majority of children who are not maltreated are also not referred.
SDT summarizes information about the performance of the referral and substantiation portion of the child welfare system in terms of two key parameters. For the Endangerment Standard, d ′ is 1.16 and C is 1.24. For the Harm Standard, d ′ is 2.06 and C is 0.80. Substantially different values of these two indices are obtained depending on whether one assumes that the signal is defined by the Endangerment Standard or by the Harm Standard. If one assumes that the appropriate definition of the signal is given by the Endangerment Standard, then the d ′ value of 1.16 means that the signal distribution is shifted 1.16 standard deviations to the right of the noise distribution, as depicted in the top part of Figure 2. If one assumes that the appropriate definition of the signal is given by the Harm Standard, then the d ′ value of 2.06 signifies that the signal distribution is shifted further to the right, 2.06 standard deviations to the right of the mean of the noise distribution, as shown in the bottom part of Figure 2. Clearly, the signal and noise distributions overlap to a lesser degree under the Harm Standard than under the Endangerment Standard, which is to say that there is a stronger signal when the data are analyzed under the assumptions of the Harm Standard.
Graphical representation of the SDT analysis of 2009 national child welfare services referral and substantiation data.
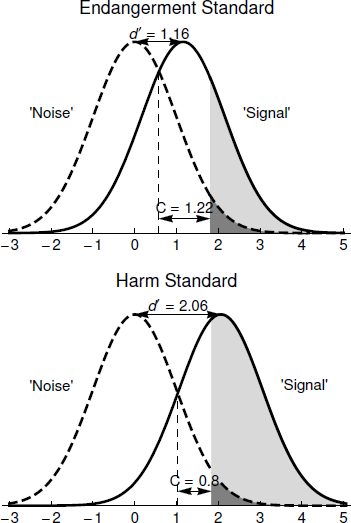
C is a measure of the location of the decision threshold for making a referral. The value of C is 1.22 for the Endangerment Standard, as depicted in the top part of Figure 2, and 0.80 for the Harm Standard, as depicted in the bottom part of Figure 2. For both standards, C takes a positive value, signifying that the false negative rate is higher than the false positive rate. As seen in Table 2 and depicted graphically in Figure 2, under the Endangerment Standard the false positive rate is 0.03 whereas the false negative rate is 0.74. Under the Harm Standard, the false positive rate is 0.03 whereas the false negative rate is 0.41. Comparing the top and bottom parts of Figure 2 makes it clear how d ′ and C interact so that it is possible to have virtually identical false positive rates but quite different false negative rates under the two standards. Under both, the decision process is conservative in the sense that the false negative rate is higher than the false positive rate, but it is substantially more conservative under the Endangerment Standard than under the Harm Standard.
The ROC curves for the SDT analysis of the 2009 national child welfare services referral and substantiation data are shown in Figure 3. As can be seen, the ROC curve for the Harm Standard is arched to a much greater degree than is the ROC curve for the Endangerment Standard, reflecting a stronger signal under the Harm Standard than under the Endangerment Standard. The location of C on the ROC curve, as shown in Figure 3, depicts graphically the extent to which the decision threshold C is set at a conservative level.
ROC curves for the SDT analysis of 2009 national child welfare services referral and substantiation data.

3.2 An analysis of the referral and substantiation processes of the child welfare services system for different racial and ethnic groups
We used data from the State of California to examine the question of whether performance for the referral and substantiation processes of the child welfare services system differed for different racial or ethnic groups. The California Child Welfare Performance Indicators Project provided access to an important element of the analysis—the ratio of substantiated to unsubstantiated referrals for each racial and ethnic group—a statistic that is not readily available for national data.
SDT analyses were conducted for 2010 State of California data to examine the extent of disproportionality during the referral and substantiation stages of the child welfare system process. Data for Black, Hispanic, and White populations appear in Table 3 for the Endangerment Standard and in Table 4 for the Harm Standard. NIS-4 data are not available at the state level, so the analyses relied on national estimates of child maltreatment incidence rates for all three groups.Footnote 1

1 Source: Needell et al. (2011)
2 Source: NIS-4, Table 4–4 (Reference Sedlak, Mettenburg, Basena, Petta, McPherson, Greene and LiSedlak et al., 2010)
1 Source: Needell et al. (2011)
2 Source: NIS-4, Table 4–4 (Reference Sedlak, Mettenburg, Basena, Petta, McPherson, Greene and LiSedlak et al., 2010)
The incidence of referrals is markedly higher for Blacks than for the other two groups. For Black children, the referral incidence is 116.7 per 1,000—a rate roughly two and a half times that of the other groups—47.6 per 1,000 for Hispanics, and 39.6 per 1,000 for Whites. The incidence of true positives (i.e., substantiated referrals) is two to three times higher for Blacks (22.6 per 1,000) than for Hispanics (9.6 per 1,000) or Whites (7.4 per 1,000). The incidence of false positives is also much higher for Blacks than for the other groups, however. For Blacks, the incidence is 94.1 per 1,000, which is roughly two-and-a-half times greater than for Hispanics (38.0 per 1,000) and roughly three times greater than for Whites (32.2 per 1,000).
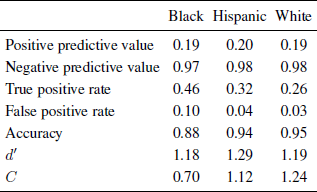
Performance measures for Black, Hispanic, and White populations for the Endangerment Standard appear in Table 5 and for the Harm Standard appear in Table 6. The positive predictive value varies little across the three major ethnic and racial groups, ranging between 0.19 and 0.20 under either standard. For all groups, about one-fifth or fewer of referrals are substantiated.

Estimates of negative predictive value differ somewhat depending on whether the analysis is based on the less stringent Endangerment Standard or the more stringent Harm Standard, but the probability that a non-referred child is not being maltreated is quite high, approaching 1.0 under either standard. For the Endangerment Standard, the negative predictive value varies little across groups, ranging from 0.97 to 0.98. For the Harm Standard, the negative predictive value rounds to 1.0 for all three major racial and ethnic groups.
On the other hand, there are quite notable differences in true positive rates both between standards and between racial and ethnic groups. The true positive rate under the Endangerment Standard ranges in values from 0.26 for Whites, to 0.32 for Hispanics, to 0.46 for Blacks. Under the more stringent Harm Standard, the true positive rate is higher for all groups but substantial differences remain across ethnic and racial groups; true positive rates range, in ascending order, from 0.59 for Whites, to 0.68 for Hispanics, to 0.94 for Blacks.
For the false positive rate, there is essentially no difference with respect to the two standards but substantial differences between racial and ethnic groups. Under both the Endangerment Standard and the Harm Standard, the false positive rate is higher for Blacks than for other groups. Under the Endangerment Standard, the false positive rate is 0.03 for Whites, 0.04 for Hispanics, and 0.10 for Blacks. The rates round to the same values under the Harm Standard: 0.03 for Whites, 0.04 for Hispanics, and 0.10 for Blacks.
Accuracy rates are somewhat lower for the Endangerment Standard than for the Harm Standard. The level of Accuracy is lowest for Blacks for both standards. For the Endangerment Standard, Accuracy ranges from 0.88 for Blacks, to 0.94 for Hispanics, to 0.95 for Whites. For the Harm Standard, Accuracy ranges from 0.91 for Blacks to 0.96 for Hispanics and Whites.
The SDT analyses summarize the overall pattern of results and bring them into clearer focus. The value of d ′, is higher under the more stringent Harm Standard, indicating a more readily detectable signal when demonstrable harm is defined as the signal. Differences in d ′ among racial and ethnic groups are modest under the Endangerment Standard; d ′ for Blacks is 1.18, for Whites is 1.19, and for Hispanics is 1.29. Under the Harm Standard, there are greater differences in the values of d ′ across groups. The value of d ′ is 2.06 for Whites, 2.22 for Hispanics, and 2.89 for Blacks, suggesting that under the Harm Standard the signal may be stronger for Blacks than for other groups.
There are substantial differences across groups with respect to C, indicating substantial differences in the decision threshold for making a referral. For the Endangerment Standard analyses, the value of C for Whites is 1.24, for Hispanics is 1.12, and for Blacks is 0.70. The decision threshold is conservative for all three groups, but comparatively less so for Blacks. For the Harm Standard, the value of C is lower than for the Endangerment standard, and there are again substantial differences across groups. The value for Whites is 0.81. For Hispanics it drops to 0.66, reflecting a less conservative tendency toward referral. For Blacks the value of C drops to −0.13, reflecting a liberal tendency toward referral, meaning that the false positive rate is higher than the false negative rate.
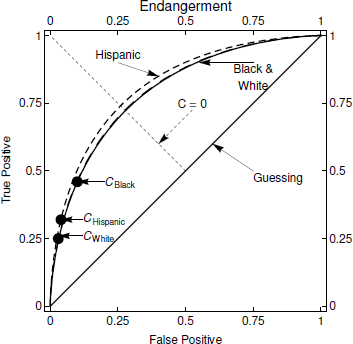
The differences between groups in SDT terms are summarized by their ROC curves. These ROCs also permit us to address questions about how decision performance might change in response to potential changes in decision process behavior. The ROC for the California data for the Endangerment Standard appears in Figure 4 and for the Harm Standard in Figure 5. The ROC curves illustrate the key points of the SDT analyses:
ROC curve for 2010 California data, endangerment standard.
ROC curve for 2010 California data, harm standard.
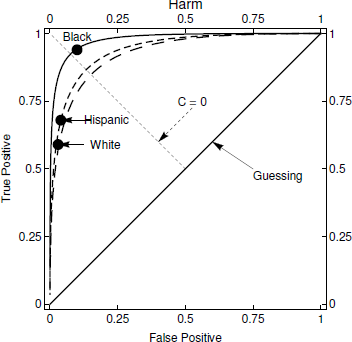
-
• For Blacks, Hispanics, and Whites, the ROCs for the Harm Standard are much more highly arched than the ROCs for the Endangerment Standard indicating stronger signal strength.
-
• For the Endangerment Standard (Figure 4), C is located on the upwards slope of the ROC curve fors all three groups. This represents conservative behavior, or a disinclination to make a referral. To illustrate, if no referrals were made C would be located at the origin of the ROC curve which would mean that no false positive errors would ever be made. Of course, that would mean that the true positive rate would be 0.0 too because no maltreated children would be identified. (Conversely, if every case were referred, C would be located at the far northeast corner of the graph. With this referral policy, the true positive rate would be 1.0 because all maltreated children would be referred. However, the false positive rate would be 1.0 too because all non-maltreated children would also be referred.) While C is conservative for all groups, it is less so for Blacks than for the others.
-
• For the Harm Standard (Figure 5), C is located on the ROC curves in a similar position for Hispanics and Whites, on the upwards slope between the origin and northwest corner although higher up on the curve than for the Endangerment Standard. As before, this represents conservative behavior although less pronounced than for the Endangerment Standard. Figure 5 illustrates quite different results for Blacks, with C located at a much higher point on the curve, reflecting liberal behavior that results in a lower false positive rate than false negative rate.
3.3 Disproportionate compared to what? Overrepresentation versus underrepresentation
In California, Blacks are disproportionately referred into the system (with an incidence of 116.7 per 1,000), which is approximately 2½ to 3 times the rate of other groups. According to the best available estimate, the NIS-4 data, the incidence of child maltreatment for Blacks is roughly 25% higher than the Overall incidence for the Endangerment standard (49.6 per 1,000 for Blacks as compared to an Overall incidence of 39.5 per 1,000) and roughly 40% higher for the Endangerment standard (24.0 per 1,000 for Blacks as compared to an Overall incidence of 17.1 per 1,000). On the face of it, differences between Blacks and other groups in rates of incidence of maltreatment appear to be far and away outstripped by differences between Blacks and everyone else in rates of referral, at least in California. But for all groups only about 20% of referrals are substantiated. Perhaps a case might be made that the different rates of referral are appropriate in light of the substantiation rate, because on average five referrals need to be made in order to detect one additional case of maltreatment. Furthermore, the incidence of false negatives per 1,000 is higher for Blacks (27.0) than for Hispanics (20.6) and Whites (21.2), which means that the system is more likely to fail to detect Black children who are maltreated.
So, are Blacks over-represented or under-represented? Arguments have been made on both sides of the case (sometimes simultaneously, see Besharov, 1993; Reference MumpowerMumpower, 2010). Data themselves do not and cannot yield a definitive answer to this question. The question can be answered meaningfully only in the context of value judgments about the costs of making errors—false positives and false negatives—and the benefits of making correct diagnoses–true positives and true negatives.
These are weighty issues that cannot be resolved in this paper, but SDT provides several interesting perspectives from which to address the question. When the index C takes a value of 0.0, the false positive rate and the false negative rate are the same. The analyses have shown that under the Endangerment standard, the value of C is positive for all three groups, which means that the decision threshold is set at levels that result in higher false positive rates than false negative rates. Thus, the referral and substantiation processes appear to give more weight to avoiding false positive errors than to avoiding false negative errors, a tendency that is more pronounced for Hispanics and Whites than for Blacks. Under the Harm standard, the value of C is positive for Hispanics and Whites; only for Blacks does C take a negative value (−0.13), which means that only for Blacks is the false negative rate lower than the false positive rate.
But decisions about tradeoffs between types of errors need to take into account frequencies as well as rates. Because the base rate of maltreatment is relatively low, identical error rates would yield a far greater number of false positives than false negatives. In addition, achieving equal error rates would require a substantial increase in the number of referrals for most groups. It is instructive to analyze how frequencies would change if all three groups were treated equivalently in terms of the decision threshold C. Table 7 presents three sets of results are given for each group—the results that would be obtained if the decision threshold (C value) that was used for Blacks were used for every group, the results if the C value for Hispanics were used for every group, and, finally, the results if the C value for Whites were used for every group.
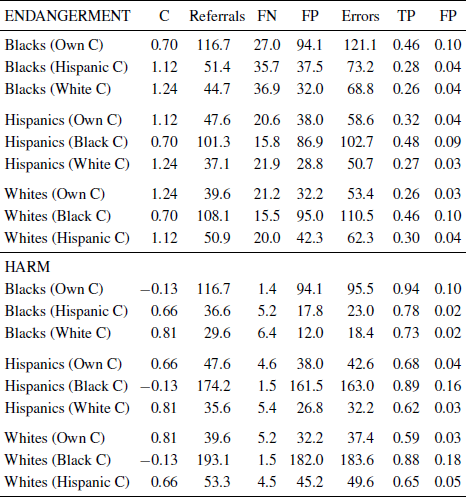
These analyses make it very clear that the tradeoffs between types of errors observed in the California data are not the same across the three groups. As can be seen in Table 7, if C for Blacks was applied to other groups, the total number of referrals would increase sharply for Hispanics and Whites. For Hispanics the number of referrals would increase from 47.6 per 1,000 to 101.3 per 1,000 under the Endangerment Standard and to 174.2 per 1,000 under the Harm Standard. If the Black C value were used for Whites, the number of referrals would increase from 39.6 per 1,000 to 108.1 per 1,000 under the Endangerment Standard and 193.1 per 1,000 under the Harm Standard.
Further, the number of false positives would increase and the number of false negatives would decrease if the Black C value were used for all groups. If the Black C value were used for Hispanics, the number of false positives under the Endangerment Standard would rise from 38 per 1,000 to 86.9 per 1,000 and the number of false negatives would drop from 20.6 per 1,000 to 15.8 per 1,000. Under the Harm Standard, the number of false positives for Hispanics would rise from 38 per 1,000 to 161.5 per 1,000 and the number of false negatives would drop from 4.6 per 1,000 to 1.5 per 1,000. A similar pattern of results for Whites is observed if the Black C value were used for them, as can be seen in Table 7.
Conversely, if the decision threshold C were set at the same level for Blacks as it is for Hispanics and Whites, the total number of Black referrals would drop, the number of false positives would also drop, and the number of false negatives would increase. For example, if the White C value were used in making decisions for Blacks, under the Endangerment Standard the total number of Black referrals would drop from 116.7 per 1,000 to 44.7 per 1,000, the number of false positives would drop from 94.1 per 1,000 to 32.0 per 1,000, and the number of false negatives would increase from 27.0 per 1,000 to 36.9 per 1,000.
If the decision threshold C were set at the same level for all groups as it was for Blacks, both the true positive and false positive rates would increase sharply for Hispanics and Whites, under both the Endangerment and Harm standards. Conversely, if the decision threshold C were set at the same level for Blacks as it is for Hispanics and Whites, both the true positive and false positive rates for Blacks would decrease sharply, under both the Endangerment and Harm standards.
3.4 Differences between groups in implied trade-offs between false negatives and false positives
The immediately preceding analyses lay out the implications if groups were treated the same with respect to C, but what are the implicit (dis)utilities for false positives and false negatives that would justify the observed values of C for the various groups? The concepts of average substitution and marginal substitution rates are helpful here. Imagine that no referrals at all were made. If no referrals were made, all the errors would be false negatives. As the number of referrals increases, two things happen—the number of false positives increases and the number of false negatives decreases. The average substitution rate is the number of additional false positives incurred on average to reduce the number of false negatives by one. As can be seen in Table 8, the average substitution rate is roughly equivalent for all groups; approximately four additional false positives were incurred for every false negative eliminated.

The marginal substitution rate, which uses the present statistics as a baseline and estimates the number of additional false positives necessary to eliminate one additional false negative, is more informative about differences between groups in the implicit weights assigned to false positives and false negatives. The substitution rates, whose computation is explained in the Appendix, under both the Endangerment and Harm standards appear in Table 8 and suggest substantial differences between groups. Under the Endangerment Standard, the estimated substitution rate is somewhat higher for Blacks (8.47) than for Hispanics (7.29) or Whites (6.35). Differences between groups are considerably more pronounced under the Harm Standard. The marginal substitution rate for Blacks (59.91) is far higher than for Hispanics (16.73) or for Whites (13.72). The question then becomes whether it is worth incurring 59.91(or 16.73, or 13.72) additional false positives in order to detect an additional true positive. (See Reference Stewart and MumpowerStewart & Mumpower, 2004, for an analogous problem in the context of mammography screening.) There is and can be no definitive answer to what is fundamentally a values question, but it is difficult to think of a ready rationale why there should be different marginal substitution rates for different ethnic or racial groups.
4 Conclusion
The present study supports the major conclusions reported in Mumpower (2010). Specifically, it supports the earlier findings that the referral and substantiation processes of the child welfare services system do not function in the same manner for Blacks as they do for Hispanics and Whites. Blacks are disproportionately represented in terms of the incidence of their referral into the system. The level of accuracy is lower for Blacks—the rate of correct diagnoses is lower and the rate of errors, especially false positive errors, is higher than for other groups.
Signal detection theory (SDT) analyses help to clarify the nature of the differences between the groups. SDT analyzes the data in terms of two key parameters: d ′, a measure of signal strength, and C, a measure of where the threshold is set for making a referral decision. The results show virtually no difference among the groups with respect to d ′ when the data are analyzed under the assumptions of the Endangerment Standard, but a somewhat stronger signal for Blacks than for other groups when the data are analyzed under the assumptions of the Harm Standard.Footnote 2
The SDT analyses make it abundantly clear, that there are substantial differences among the three major racial and ethnic groups in the value of C, for both Endangerment and Harm Standards. The extent and practical implications of these differences are illustrated by the results regarding estimated outcomes if the decision threshold for Whites were applied for Blacks. If the White C value were applied to Blacks, under the Endangerment Standard the referral frequency would drop from 116.7 per 1,000 to 44.7 per 1,000, the incidence of false negatives would rise from 27 per 1,000 to 36.9 per 1,000, the incidence of false positives would drop from 94.1 per 1,000 to 32 per 1,000, the total number of errors would drop from 121.1 per 1,000 to 68.8 per 1,000, the true positive rate would drop from 0.46 to 0.26 and the false positive rate would drop from 0.10 to 0.04. These would be profound changes.
Conversely, the analyses also showed that if decisions about Hispanics and Whites were made using the same decision thresholds that were used for Blacks, the changes would be equally dramatic, including higher rates of referral, higher rates of true positives and lower rates of false negatives. For example, if the Black C value were applied to Whites, under the Endangerment Standard the referral frequency would rise from 39.6 per 1,000 to 108.1 per 1,000, the incidence of false negatives would drop from 21.2 per 1,000 to 15.5 per 1,000, the incidence of false positives would rise from 32.2 per 1,000 to 95.0 per 1,000, the total number of errors would rise from 53.4 per 1,000 to 110.5 per 1,000, the true positive rate would rise from 0.26 to 0.46 and the false positive rate would rise from 0.03 to 0.10.
Which decision threshold is most appropriate? This is a value question that analyses such as the present ones cannot address directly. The present analyses clearly do show, however, that different ethnic and racial groups are treated quite differently within the referral and substantiation processes.
For many years, the meaning of and causes for disproportionality have been contentious topics at the forefront of policy debates regarding child welfare services. Some have argued that disproportionality is solely the result of explicit or implicit discrimination. Conversely, others have argued that disproportionality simply reflects differences among groups in rates of incidence. The present analysis makes it clear that policy prescriptions derived from either extreme position miss the mark. Neither point of view adequately or accurately captures the data. Normatively, one might expect higher rates of referral and substantiation for groups with higher rates of incidence, but the data indicate that observed rates of referral and substantiation are not commensurate with best estimates of differences between groups in rates of incidence.
Two further points about the results should be emphasized.
First, the present study focuses exclusively on the ability to detect instances of child maltreatment and makes no assumptions about its causes. The evidence (e.g., Drake et al., 2009; Sedlak, McPherson, & Das, 2010;) suggests that race and ethnicity add little or no predictive ability after controlling for other factors such as poverty. Differences among racial and ethnic groups in NIS-4 estimates of rates of child maltreatment do not imply that characteristics of race or ethnicity somehow cause such differences. In a similar vein, although our results show that Blacks are treated differently from other major ethnic or racial groups within the child welfare services system, this difference does not necessarily support the conclusion that the system is racist or prejudiced. The observed results might be a function of other unobserved variables—such as differences in measurement error, class, or poverty—that are correlated with race and ethnicity.
Second, substantiation is an imperfect proxy for the variable that we are truly interested in–child maltreatment. Further, it dichotomizes a continuously distributed variable with attendant potential problems for analysis. Research (Drake, 1996; Hussey et al., 2005; Kohl et al., 2009; U.S. Department of Health and Human Services, N.D.) has shown that the differences between substantiated and unsubstantiated referrals in terms of the clinical services that they require or receive are less clear cut than might have been assumed. Despite its potential shortcomings, substantiation remains a widely reported and analyzed variable in child welfare and the present analysis reveals distinct differences among Blacks and other racial and ethnic groups in terms of typical patterns of referrals and substantiation.
The analyses indicate that the most important difference in the manner in which racial or ethnic groups are treated during referral and substantiation is that there is a lower threshold for referring Blacks into the system. Other important differences, such as higher rates of both true positives and false positives, flow from differences across groups in C. Interpreting differences among ethnic and racial groups is not perfectly straightforward because base rates of child maltreatment are not the same across groups. The analyses make clear that, even taking into account differences in base rate, referral and substantiation statistics would look quite different if Blacks were treated the same as Hispanics or Whites, or vice versa.
The child welfare systems involve a series of judgments and decisions—decisions about whether to refer, whether to investigate, how to classify, and so on. Such decisions are typically made by individuals, although sometimes in consultation with peers or subject to review by supervisors. Despite the fact that the data in the present analyses reflect aggregation of literally millions of such decisions by individuals, analyzing those data with SDT techniques yields “as-if” models of system behavior that are highly informative. In particular, these analyses clearly reveal quite different patterns of JDM behavior with respect to different racial and ethnic groups. In this way, our research illustrates the potential of SDT, and JDM research more generally, to contribute to analyses of system-level decision making processes, thereby aiding our ability to address significant public policy problems. In conclusion, the present study illustrates the value of systemic research which takes a many individuals-many cases approach to build models that describe the JDM behaviors of systems, as opposed to the behaviors of specific individuals or “people in general”.
Appendix: Computation of marginal substitution rates
The marginal substitution rates are more readily computed using β, an alternative representation of the decision threshold. For a given set of rates (base, true positive, false positive) and a substitution rate for the relative comparison of the costs associated with a false negative and a false positive, the optimal β, the one that would minimize total costs, is given by the product of the relative base rates (negative to positive) and the relative error costs (Reference Coombs, Dawes and TverskyCoombs, Dawes, & Tversky, 1970). That is,
For a given set of rates (base, true positive, false positive), let SR = Cost(FP)/Cost(FN) be the marginal substitution rate, i.e., the number of false positives tolerated to avoid one false negative, then
The system’s operating threshold β is not likely to be optimal. The operating threshold is estimated from the data using e d ′C. Setting β = β allows solving for the effective substitution rate for that particular operating threshold. For example, for Blacks under the Endangerment Standard, the relative base rates of negative and positive from Table 3 are 950.4 and 49.6 so
The operating values are d ′ = 1.18 and C = 0.70, so the effective threshold is β =e 1.18(0.70)=2.28. Then 2.28 = 19.2/SR implies SR = 8.42. That is, under the Endangerment Standard for Blacks, the system behaves as if the cost of 8.42 false positives is equivalent to the cost of one false negative. The other substitution rates in Table 8 are calculated in the same manner.


 Open access