




Introduction
Contemporary Russia remains a multiethnic and multireligious state, formally inheriting the federal structure that existed in the Soviet period, including ethnic autonomies. However, in recent decades, it has increasingly demonstrated features of a centralized, ethnocentric, and neo-imperial regime. This shift has been accompanied by the steady marginalization and assimilation of ethnic minorities, the consolidation of Russian national identity as state-forming, and a narrowing of regional autonomy. Amidst this backdrop, questions about the long-term stability of the Russian Federation have become increasingly urgent, particularly in light of the war against Ukraine, which has further intensified interethnic tensions and raised the specter of future fragmentation.
This article explores the demographic foundations of potential separatist tendencies within Russia’s ethnic republics. Specifically, it investigates whether current ethno-demographic and ethno-territorial trends suggest a growing potential for secessionist movements, especially under conditions of state weakening or political crisis. While many factors — political, economic, geopolitical — influence the integrity of multinational states, this study focuses on demographic and cultural dynamics that shape identity, cohesion, and political expression among minority populations.
Rather than viewing separatism as an immediate political reaction, this article treats it as a possible long-term consequence of cumulative shifts in population structure, language use, and regional ethnic composition. For instance, recent language policy reforms that prioritize Russian at the expense of minority languages may not provoke direct separatist action, but they do contribute to cultural homogenization and fuel dissatisfaction in regions where linguistic identity remains central. As Krouglov (Reference Krouglov2022) has shown, such policies diminish the functionality and prestige of minority languages, which may erode the cultural basis for local identities over time and limit intergenerational transmission. While the political implications of such changes are not automatic, they may increase alienation from the federal center in some republics.
This article addresses the following research questions :
-
1. How are the size, territorial concentration, and linguistic assimilation of ethnic groups in Russia changing in the 21st century?
-
2. Do these demographic patterns indicate a potential for increased ethnic differentiation or mobilization in the future?
-
3. Which republics display the greatest ethno-demographic potential for separatism, and on what basis?
To answer these questions, the article proceeds as follows: first, it offers a brief historical overview of Russia’s multinational statehood; second, it analyzes census data, adjusting for undercounting and methodological flaws; third, it proposes a typology of separatist potential based on the share, growth, and concentration of titular ethnic groups; and finally, it reflects on the implications of these trends for Russia’s political stability and territorial integrity.
Background
Russia, in all forms of its historical existence, has been a multi-ethnic and multi-religious state. At the peak of its expansion in the 19th century, the Russian Empire was one of the largest in human history, with possessions stretching from Warsaw and Helsinki to the Pacific Ocean in northeast Asia and Alaska in North America. With its vast territory, Russia was also one of the most ethno-religiously diverse countries. For example, according to the 1897 census of the Russian Empire, ethnic Russians made up only 44 percent of its inhabitants, and the largest ethnic groups were Ukrainians (18 percent), Poles (6 percent), Belarusians (5 percent), Jews (4 percent), and so on.
However, both during the Tsarist period and for most of the Soviet Union’s existence, the authorities, with varying degrees of rigidity, sought to marginalize ethnic minorities and promote their assimilation, forming a narrative of “the messianic role of the Russian people.” As Hosking (Reference Hosking2006) has shown, the idea that Russians are “the chosen people” is rooted in Russian Orthodoxy, and the communists merely reshaped this notion into messianic socialism, in which the Soviet order would lead the world in a new direction.
For the Russian Empire and then the Soviet Union, issues of territorial organization and interethnic relations have always played a paramount role. The models of interaction among people changed over time: from favoritism toward certain ethnic groups to their discrimination and even direct genocide through deportations or famine.
In the 20th century, the collapse of political regimes twice led to the partial disintegration of the Russian state: in 1917, after the revolutions and the outbreak of the Civil War, and in 1991, after the fall of the communist regime and the loss of the Soviet Union in the Cold War. Both times, large ethnic groups on the empire’s periphery regained or gained independence following crises in the imperial center.
After the collapse of the Soviet Union, a number of nations within Russia sought secession or greater autonomy. “The main centers of separatism in the Russian Federation were Chechnya and Dagestan, but separatist sentiments and movements were also widespread in Ingushetia, Tuva, Tatarstan, Bashkortostan, Yakutia, and Buryatia. In total, between 31 and 75 sites of ethno-territorial tension were recorded in Russia during the 1990s” (Mironov Reference Mironov2023, 702). In the 1990s and 2000s, the attempted secession of the Chechen Republic ended in two bloody wars, a violent suppression of the separatist movement, and, as a result, the establishment on the territory of Chechnya of the brutal regime of Ramzan Kadyrov’s personal power (Halbach Reference Halbach2018). In other cases, “the parade of sovereignty” of the 1990s ended in the 2000s with the gradual degradation of federal relations in favor of a de facto unitary state (Gel’man Reference Gel’man, Hale, Johnson and Lankina2023). For example, in 2004, direct elections of regional leaders, including presidents of republics, were abolished, and their offices were renamed from “presidents” to “heads,” symbolizing the loss of their subjectivity.
The strengthening of Vladimir Putin’s authoritarian regime was also accompanied by increasing rhetoric about “the greatness of the Russian people” and its “gifts to its neighbors.” Some of the theses of Russian propaganda are a blatant copy of the Nazi ideology, for example, the thesis of a “divided nation” which ideologically justifies territorial claims to neighboring countries (Karakashian Reference Karakashian2017). Inside the country, the authorities and the socio-political mainstream have created a narrative about the exclusively positive role of ethnic Russians in their relations with other peoples. For instance, virtually all conquests in the history of the Russian state are referred to in current official discourse as “voluntary incorporation into Russia,” and Russians are attributed the role of “civilizer of backward peoples.” As Blakkisrud has shown: “National identity has undoubtedly become more russkii -centered, but, at the same time, the Kremlin keeps the definition of ‘Russianness’ intentionally vague, blurring the boundaries between ‘nation’ and ‘civilization’” (Blakkisrud Reference Blakkisrud2023, 64), which, as the Russian authorities intend, will allow them to incorporate ethnic minorities into their neo-imperialist project and eventually assimilate them. So, “we can observe how ethnic nationalism, which previously had been a rather marginal phenomenon, moved to centre-stage” (Kolstø Reference Kolstø2022, 113). Moreover, nationalism and xenophobia have deeper roots in Russian society, as their levels are also high among those in opposition to the current regime (Chapman et al. Reference Chapman, Marquardt, Herrera and Gerber2018).
In 2018, the abolition of compulsory learning of national languages in autonomous republics led to deafening discontent among regional elites, because “changes which diminish the role of minority languages may lead to further deterioration of their status” (Krouglov Reference Krouglov2022, 412). As Prina emphasizes, “Putin’s leadership’s overwhelming statism and promotion of Russian patriotism are inexorably leading to a reduction of Russia’s diversity” (Prina Reference Prina2016). Modern Russia, unlike the previous openly imperial forms of its existence, has a far more homogeneous ethnic core. Following the 2020 constitutional amendments, ethnic Russians were officially declared the “state-forming people.” While Russians made up slightly more than half of the total population in the USSR, in the Russian Federation, they account for more than 80 percent. This demographic shift has changed the political landscape and increased the temptation among national elites to construct a more unitary, ethnocultural Russian nation-state — a risky project in a formally federal and multiethnic country (Kolstø Reference Kolstø2000, 13).
The nationalist and neo-imperialist rhetoric of the Russian authorities was accompanied by discussions of the threat of Russia’s disintegration due to demographic and migration processes, “extinction of Russians,” “replacement [local population] immigration,” and so on (Fediunin Reference Fediunin2023). This rhetoric has become one of the ideological pillars of the modern revanchist regime in Russia. The government and its loyal “experts” have formed a narrative in society about the threat of the country’s collapse if the supreme power is weakened, and as a result of “demographic pressure from non-Russian outskirts” and the influx of immigrants. As Silaev (Reference Silaev and Kandelya2015) writes: “A commonplace here has been the judgment that ethnic movements led to the collapse of the Soviet Union and have the potential to have an equally devastating effect on the Russian Federation” (39).
The aggressive war against Ukraine that was openly launched by Russia in 2022 has brought the official, neo-imperialist rhetoric of the authorities and most political forces in the country to a qualitatively new level (Goode Reference Goode2025). Now they deny the very existence of Ukrainians as a separate nation, which, according to this logic, has no right to its own state. This is especially important because the Ukrainians in both the Russian Empire and the USSR were the second most populous nation. Therefore, from an ideological point of view, Russia’s aggression against Ukraine is a war on the right to exist of all post-Soviet states as independent countries. That is why the Ukrainian regions occupied by the Russian army were annexed, even though the Russian authorities had the opportunity to establish a puppet regime in the occupied territories, nominally preserving the sovereignty of Ukraine. However, the choice was made precisely in favor of the annexation, thus making it clear that Russia does not intend to put up with the independence of post-Soviet states.
The war against Ukraine is also being waged largely at the hands of ethnic minorities. Some analysts believe that in this way, the Russian authorities are trying to reduce the demographic potential of the peoples they see as prone to separatism. For instance, statistics on Russian army casualties compiled by the BBC show a fivefold higher mortality rate among ethnic Buryats and Tuvans compared to ethnic Russians, and an approximately 20–30 percent higher mortality rate among the North Caucasus peoples, Tatars, and Bashkirs.Footnote 1 And in general, as Zmyvalova (Reference Zmyvalova2023) points out: “Since the beginning of the war in Ukraine, the situation with the rights of Indigenous peoples of Russia keeps getting worse” (1). Many experts (Michel Reference Michel2023) consider the scenario of Russia’s decolonization, where national autonomies are likely to seek independence, as happened following the collapse of the Russian Empire and the USSR, as one of the plausible outcomes. “If the Russian government today stands up for the rights of ethnic Russians abroad, then Russian residents of other nationalities become second-class citizens. It is only a matter of time when this thought will appear in the minds of the Chechens, Ingush, Buryats, or Yakuts fighting in Ukraine” (Rojek, Reference Rojek2022).
Along with this, while prioritizing the ethnic factor in the hypothetical disintegration of Russia, we cannot exclude the scenario of its breakup on a territorial basis. After all, according to Tishkov (Reference Tishkov1995), the cultural distance between different geographical groups of ethnic Russians is not infrequently more significant than between Russians in long-term contact with representatives of local national groups. And there have already been examples of such quasi-separatist movements among Russians in history. For instance, in the predominantly Russian ethnic regions of Siberia in the early 20th century, there was a movement of “regionalism” ( oblostnichestvo ), which aimed to achieve autonomy in the interests of the entire population of Siberia (Zhigunova Reference Zhigunova2011). And in the 1990s, there was an attempt to create a “supranational” Ural Republic. In modern Russia, too, the authorities take the threat of separatist sentiments among ethnic Russians extremely seriously, which is evident in their struggle against attempts to record their regional identity as a nationality in censuses (for example, Siberian). Therefore, it is not at all impossible that ethnic Russians may support the secessionist movement of indigenous peoples or even become the initiators of “Russian separatism.” However, in this article, I consider precisely the ethnic processes.
Theoretical and methodological framework of the study
Forecasting the processes of political and territorial development of Russia and the probability of its disintegration is very speculative. A very limited number of experts predicted the collapse of the USSR. Andrei Amalrik (Reference Amalrik1970) argued that the Soviet Union was weakened by internal contradictions and decay. He believed that the system, though seemingly stable, was actually rigid and isolated, incapable of adapting to changing realities. But Amalrik rather viewed these contradictions from a political science point of view, underestimating ethnic tensions and the desire of some peoples to regain independence.
More than a decade before the collapse of the USSR, Hélène d’Encausse “reveals that the Soviet community is not a single homogeneous nation, but that national cleavages are perpetuated in demographic cleavages, creating imbalances which may cause significant problems in the near future” (d’Encausse Reference d’Encausse1980, 48). But in contrast to Amalrik, d’Encausse clearly exaggerated the significance of the ethno-demographic factor, which, in her opinion, should have first of all provoked the collapse of the Soviet Union due to the numerical growth of Muslim nations. Another prediction of the Soviet empire breakup was made by Randall Collins, who in the late 1970s elaborated “Geopolitical Theory Prediction of the Russian Empire Breakdown.” (Collins Reference Collins1978). Its advantage is that it comprehensively considers all the factors that led to the collapse, paying important attention to ethnic processes, but not absolutizing them.
Since Collins’ theory covers a whole range of areas of state development (economic, territorial, and military resources, intra-elite conflicts, and so on), I will focus on the ethno-demographic factor in scenarios of Russia’s future, recognizing the importance of other factors. Describing the significance of the ethnic factor in the collapse of the Soviet Union, Collins noted three interrelated aspects:
-
1. “Nationalist agitation and ethnic population movements within the USSR and Soviet Block,” (Collins Reference Collins1999, 52) which became possible immediately after the Soviet security services loosened their grip on society.
-
2. “Ethnic hostility to foreign rule increased when an empire controlled two or more layers of ethnically distinct territories beyond the home ethnic heartland” (Collins Reference Collins1999, 54).
-
3. “Mobilization of the movements that led to formal breakup was facilitated by the fact that the component republics were already organized as nominally sovereign ethnic groups” (Collins Reference Collins1999, 55).
Summarizing, Collins writes that “ethnicity cannot be considered a primary cause of the Soviet breakdown but is rather the organizational medium through which GP [geopolitical] overextension worked itself out” (Collins Reference Collins1999, 55). Thus, following Collins, I do not argue that ethno-demographic trends alone can lead either to the disintegration of Russia or, on the contrary, to the strengthening of the current regime and its expansionist ambitions. I see ethno-demographic processes as those that can either promote or hinder one or another scenario.
Also, the collapse of the Soviet Union shows that the processes of formation of national self-consciousness (as a prerequisite for separatist aspirations) are much broader than primitive ethnic primordialist nationalism. Here, it is enough to mention the example of Ukraine, when at the referendum on independence in December 1991, 90 percent of the inhabitants of Ukraine were in favor, although ethnic Ukrainians at that time constituted 73 percent of the country’s population; that is, the withdrawal from Moscow’s control was supported by the majority of ethnic minorities, including Russians in all regions of Ukraine (including Crimea). In fact, Philip Roeder wrote about this on the eve of the USSR’s collapse: “Soviet federalism made it likely that cadres would mobilize their constituent behind instrumental rather than primordial agendas” (Reference Roeder1991, 231).
Consequently, the options for the future development of separatist aspirations in the Russian autonomies are not at all limited to the possibilities of ethnically motivated nationalist movements. Moreover, their probable success will largely be determined by the ability to incorporate representatives of other ethnic groups into these movements and offer them a worthy place in the new state projects.
Despite the strengths of Collins’ methodological framework, it lacks specific indicators to assess the likelihood of national separatism. To estimate the ethno-demographic potential for separatism, I also drew on the methodological findings of Michael Bleaney and Arcangelo Dimico (2017), who employed mathematical models to study the relationship between ethnic diversity and conflict. They concluded that “what matters [in the emergence of conflicts] is polarization, either at the national or the local level. Because the regional distribution of ethnic groups within a country can be very uneven, an ethnically fractionalized country may be quite polarized in some localities, even if its NP [national polarization] measure is not particularly high” (Bleaney and Dimico Reference Bleaney and Dimico2017, 374). This conclusion, of course, fully applies to a country as ethnically diverse and economically unevenly developed as Russia. However, the specific indicators of separatism potential based on demographic data, presented in the final part of this article, are my own elaboration.
When discussing the works that studied the role of ethno-national mobilization in the disintegration of the Soviet Union, it is also worth mentioning Mark Beissinger (Reference Beissinger2002), who showed the “tidal” nature of nationalism, where movements in one republic influenced those in others, and Andrey Shcherbak (Reference Shcherbak2015), who studied Soviet nationalities policy and concluded that it inadvertently promoted cultural and political nationalism, while aimed at fostering unity and integration. Also, certain aspects of potential separatism in Russian autonomies have been examined by some Western analysts: Gail Lapidus (Reference Lapidus1999), Daniel Treisman (Reference Treisman1997), and Louk Hagendoorn et al. (Reference Hagendoorn, Poppe and Minescu2008).
The works of Russian authors devoted to the potential of national separatism mainly belong to the relatively liberal period from the 1990s to the 2000s (Stepanov Reference Stepanov2000), while in recent years, the authorities have been persecuted for the very discussion of this topic, with the exception of those works that present the issue from a pro-government position (Mironov Reference Mironov2023).
Finally, as part of the description of the theoretical and methodological approach, it is necessary to say a few words about the understanding of the empirical data on which it is based. As in other countries, the only reliable source of information on the ethnic composition of the population in Russia is censuses. At the same time, the figures obtained in the censuses are not the absolute verity, as the censuses are conducted at the moment of certain socio-political events and moods in society. Therefore, when considering census data, it is always necessary to remember the context of time to which they correspond, especially in authoritarian countries with widespread chauvinistic views, such as Putin’s Russia. If we look at Russian census data, we can see that the increase in the share of the Russian ethnic majority falls on the harshest decades of the totalitarian regime (from the 1930s to the 1950s and the 2010s), while the increase in the number of minorities falls on the decades of relative liberalism in nationality policy (1920s, and from the 1980s to the 1990s). Collins also writes about the same issue from a slightly different perspective: “when a state is geopolitically strong, the prestige of its dominant ethnic group is also high. Conversely, a geopolitically weak state lowers its dominant ethnic prestige,” which enables us “to predict the main variations in ethnic structure and long-term dynamics” (Collins Reference Collins1999, 81). That is why I do not consider the trends of increasing assimilation processes in Russia in recent decades, which we will discuss in detail below, as “final” and “inevitable,” as it is obvious that the very socio-political atmosphere in which the censuses were conducted (especially the last one in 2021) pushed the population of ethnically mixed origin to choose a more prestigious and safer ethnicity, that is, Russian. However, in case of a weakening of the current regime or its collapse (as in 1917 and 1991), some renaissance of identities among the currently suppressed ethnic minorities is highly likely.Footnote 2
Methodology for studying ethno-demographic trends in Russia, or how to analyze poor-quality censuses
The empirical material for this study is the results of censuses, but the last two of them (2010 and 2021) were conducted without full coverage of the population, and the different magnitudes of undercount do not allow for the use of the results of these censuses without additional calculations. I calculated the projection of the ethnic structure of the undercounted population for all regions of Russia and then added the obtained data to the counted population. This enabled me to compare these data with previous censuses and identify trends.
Since 1926, censuses have been conducted on the territory of Russia with approximately a ten-year time lag. The censuses of the Soviet period, despite significant claims to them regarding voluntary participation and free choice in recording “nationality,”Footnote 3 were held with almost one hundred percent coverage. The quality of Russian censuses has arguably declined since the collapse of the USSR. One indication of this trend is the growing share of census records lacking ethnicity information: from 1 percent in the 2002 census to 4 percent in 2010 and 11 percent in 2021. Almost all experts agree that such an increase in the share of residents with unknown ethnicity is not due to the emergence of some groups unwilling to indicate their ethnicity, but to a decline in the quality of the census procedure itself, collecting data not from people’s answers, but from documents from their places of residence, in which nationality is simply not recorded (Tishkov Reference Tishkov2023, 198).
There are also suspicions of falsification of census forms by ordinary census enumerators and government officials in order to inflate population numbers, usually in favor of the Russian ethnic majority. In addition, under the increasingly authoritarian regime in Russia, the free recording of ethnicity, especially by residents from discriminated ethnic groups, was obviously not observed. Russia has a very deep historical practice of ethnic restrictions, repressions, and even genocides, and the whitewashing by modern authorities of the Tsarist and Soviet regimes’ crimes certainly contributes to the desire of some ethnic minorities to hide their identity. For instance, my research among residents with Ukrainian identity shows that on the eve of the 2021 census, 61 percent of them were going to enroll in the census as Russians, with respondents themselves explaining their motivation usually by political reasons (Author Paper). Nevertheless, despite doubts about the reliability of the latest census results, there are simply no other statistics on the ethnic composition of Russia’s population.
Given the significant undercount of the population by ethnicity, it is simply impossible to analyze the absolute data of the last two censuses as they were published because they show a distorted picture. For example, the number of ethnic Russians in the country according to these data has been declining: in 2002, 116 million; in 2010, 111 million; and in 2021, 104 million, from which someone can conclude that “the extinction of Russians” is rapid, which, as will be shown below, does not correspond to reality. Moreover, many nationalistically-minded “experts” in Russia deliberately manipulate the data of recent censuses to form chauvinistic and anti-immigrant sentiments. For example, Efremov (Reference Efremov2016) described an example of such manipulation of the 2010 census results by a leading Russian demographer.
It would seem that the way out of the situation when the use of absolute census data is irrelevant is to analyze the percentage distribution of ethnic groups in the population who indicated their ethnicity. Nevertheless, even these data are not sufficiently valid, as the value of undercounting of the population by ethnicity in the 2021 census varied greatly in different regions: from 26 percent in the Khanty-Mansi Autonomous Okrug to zero in the Chechen Republic. These disproportions in the amount of undercount distort not only the absolute, but also the relative data. In fact, a large undercount in the ethnically Russian regions and some republics (Komi, Khakassia, Udmurtia) reduces the share of the corresponding ethnic groups and increases the share of those peoples in whose regions the undercount was small. In addition, in all regions, the percentage of undercount was higher in urban areas compared to rural areas, which also significantly skewed even the percentage distribution in the official totals for individual regions.
How to use the results of the 2021 census in such a situation? In my opinion, the only way is to calculate the projection of the ethnic structure of the registered population on the residents with “unknown nationality” and the more detailed, fractional by administrative-territorial units this calculation will be, the more accurate data for the country as a whole it will show.Footnote 4 In this article, I present data from my recalculation of the 2021 census results for the urban and rural populations of each of Russia’s 83 regionsFootnote 5 for ethnic groups with a population of over 200 thousand and then aggregated into the total data for the country as a whole (Table 1). In other words, I projected the ethnic structure of the population with the indicated ethnicity onto the entire population in the urban/rural breakdown for each region.Footnote 6 Also, to enable comparison with the 2010 census data, I made a recalculation for it as well. Certainly, the data obtained in this way are estimates, but without these calculations, it is practically impossible to analyze ethno-demographic trends in modern Russia.
Population of the largest peoples of Russia according to official and estimated data of the 2010 and 2021 censuses

Table 1. Long description
The table is organized into 10 columns. The first two columns list the Rank number for the 2021 census and the Ethnic Group. The remaining columns are split into two major sections: CENSUS 2010 and CENSUS 2021. Each census section contains four sub-columns: Only those recorded, Value of undercount, Margin of errors plus or minus, and Projection to the entire population.
* Total Population: 2010 projection was 142,856,536; 2021 projection increased to 144,699,673.
* Rank 1, Russians: 2010 projection of 115,913,263 increased to 118,320,097 in 2021.
* Rank 2, Tatars: 2010 projection of 5,440,158 decreased to 4,975,107 in 2021.
* Rank 3, Chechens: 2010 projection of 1,439,063 increased to 1,688,774 in 2021.
* Rank 4, Bashkirs: 2010 projection of 1,628,569 increased slightly to 1,632,501 in 2021.
* Rank 5, Chuvashs: 2010 projection of 1,489,535 decreased to 1,155,927 in 2021.
* Rank 8, Ukrainians: Showed a significant decrease from a 2010 projection of 2,017,990 to 825,002 in 2021.
* Rank 22, Tajiks: Showed a significant increase from a 2010 projection of 210,774 to 401,009 in 2021.
* Rank 26, Belarusians: Decreased from a 2010 projection of 549,164 to 228,113 in 2021.
* Rank 31, Komi: Decreased from a 2010 projection of 240,678 to 166,548 in 2021.
The 2021 data generally shows a much higher Value of undercount compared to 2010, with the total undercount rising from 5,629,429 to 16,344,980.
i Hereinafter, the census statistics are taken from: https://rosstat.gov.ru/perepisi_naseleniya
ii With the Mishars
iii On Karachays
iv On Kabardins
v On Avars, Dargins, Kumyks, Laktsy, Lezgins, Tabasaran
As shown in Figure 1, the magnitude of undercounting of different ethnic groups during the last two censuses in Russia fluctuated greatly. Thus, the largest undercount was characteristic of the more urbanized peoples living more often in the northern regions: Komi, 13.9 percent; Ukrainians, 13.6 percent; Belarusians, 13.4 percent; and Uzbeks and Tajiks, 12.9 percent each. Above the average undercount for the country (11.3 percent), there was also an undercount among the Russian ethnic majority, 12.2 percent.
Estimated undercount of the largest ethnic groups in Russia according to the 2010 and 2021 censuses, percent.

Figure 1. Long description
The y-axis represents the percentage of undercount from 0 to 14. The x-axis lists 28 categories including ethnic groups and a total average. In every category, the 2021 undercount is significantly higher than the 2010 undercount.
Data points from left to right (2010 percent, 2021 percent):
* Komi: 5.2, 13.9
* Ukrainians: 4.5, 13.6
* Belarusians: 5.0, 13.4
* Uzbeks: 5.1, 12.9
* Tajiks: 5.0, 12.9
* Russians: 4.2, 12.2
* Total: 3.9, 11.3
* Azerbaijanis: 3.7, 10.9
* Yakuts: 2.5, 10.6
* Germans: 3.4, 10.0
* Armenians: 3.2, 9.1
* Kazakhs: 4.3, 9.0
* Udmurts: 3.5, 8.3
* Chuvashs: 3.6, 7.8
* Buryats: 2.2, 7.6
* Roma Gypsies: 3.3, 6.7
* Tuvans: 1.5, 6.5
* Ossetians: 1.3, 6.5
* Mari: 4.1, 6.4
* Tatars: 2.4, 5.9
* Mordvins: 2.2, 5.8
* Ingush: 1.0, 3.9
* Lezgins: 1.4, 3.8
* Bashkirs: 2.7, 3.8
* Kumyks: 1.0, 2.9
* Kabardins: 0.4, 2.7
* Dargins: 1.0, 2.2
* Avars: 0.9, 2.0
* Karachays: 0.9, 1.8
* Chechens: 0.5, 0.9
All other ethnic groups, including all “titular” peoples of the republics (except for the Komi), were counted better than the national average, which can be explained, first of all, by the desire of the republics’ authorities to more fully record the ethnic composition of the population in order to preserve their status. The lowest level of undercounting is characteristic of the peoples of the North Caucasus: Chechens, 0.9 percent; Karachays, 1.8 percent; Avars, 2 percent, and so on (Figure 1). These calculations significantly change the assessment of ethno-demographic trends in Russia in the period 2010–2021. The number of ethnic Russians did not decrease from 111 to 104 million, as nominal census data show, but, on the contrary, even increased from 116 to 118 million people (Table 1). Relative data are also different. The share of the Russian ethnic majority in 2021 was not 80.9 percent, but 81.8 percent.
A view from historical retrospect: Ethnic processes in Russia over the last hundred years
Before analyzing the ethnic processes of recent decades in more detail, let us consider the general picture of ethno-demographic transformations over the last almost a hundred years in order to assess whether any fundamental changes have occurred. As shown in Figure 2, the share of the Russian ethnic majority and ethnic minorities combined over the last hundred years has varied within five percentage points (p.p.), which can hardly be considered significant (the minimum share of Russians was recorded by the 1926 census, 78.3 percent, the maximum in 1959, 83.3 percent). The most dramatic fluctuation in this ratio was due to a precipitous decline in the number of one people, Ukrainians, between 1926 and 1939, and a significant increase in Russians. During these 13 years, the number of Ukrainians more than halved from 6.9 to 3.2 million, while the number of Russians increased from 72.4 to 89.7 million (Table 2). Such dynamics were caused by direct (mass mortality) and indirect (“rewriting” of the remaining intimidated autochthonous Ukrainian population into Russians) consequences of the famine of 1932–1933, Holodomor, recognized in many countries as a genocide of the Ukrainian people.Footnote 7 Therefore, the increase in the share of Russians in the population in the period 1926–1939 by 4.6 p.p. was due to a decrease in the number of Ukrainians by 4.4 p.p. (Figure 2). At the same time, despite the mass “rewriting” of Ukrainians into Russians as a result of genocide and repression, this population for many decades retained Ukrainian identity, which was gradually, from generation to generation, “washed out” due to the prohibition of everything Ukrainian in the places of its compact residence (Author Paper).
Share of major peoples in the population of Russia according to the censuses of 1926–2021 (within 1991 borders), percent.
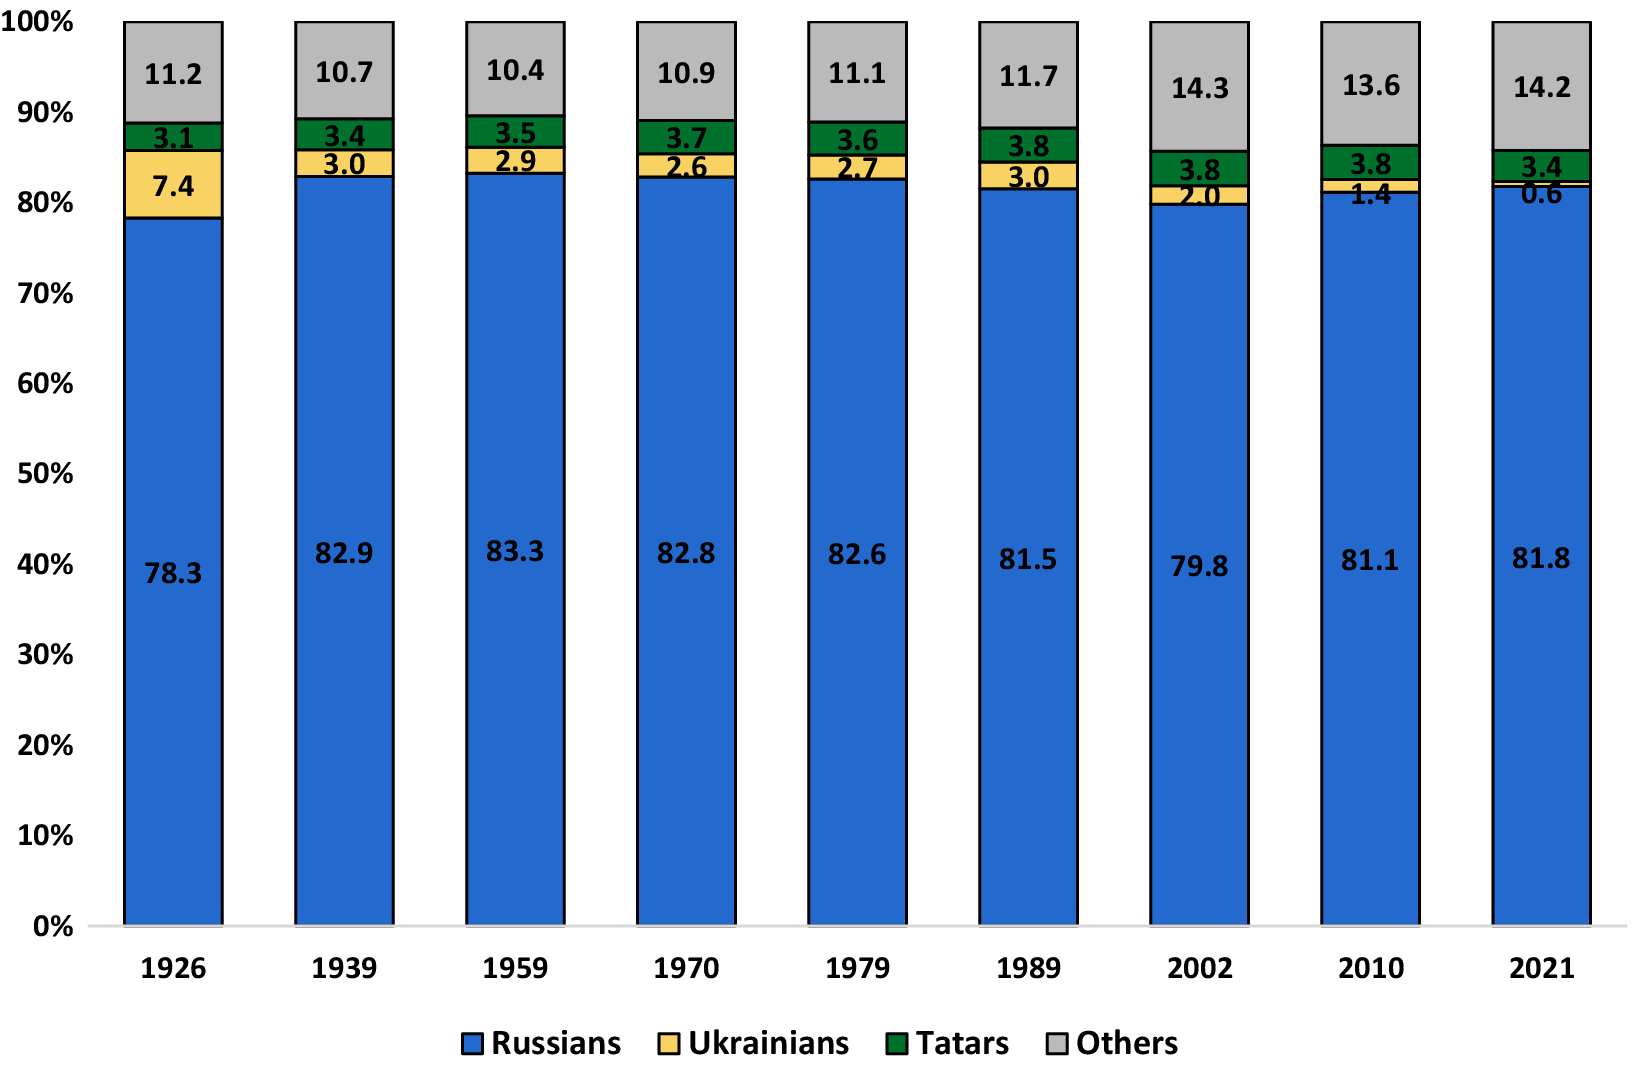
Figure 2. Long description
The Y axis represents percentage from 0 to 100. The X axis lists census years 1926, 1939, 1959, 1970, 1979, 1989, 2002, 2010, and 2021. Each bar is divided into four categories from bottom to top.
Russians in blue form the largest base. Their share starts at 78.3 percent in 1926, peaks at 83.3 percent in 1959, and ends at 81.8 percent in 2021.
Ukrainians in yellow sit above Russians. Their share shows a significant decline from 7.4 percent in 1926 to 3.0 percent in 1939, continuing a downward trend to 0.6 percent by 2021.
Tatars in green are the third layer. Their share remains relatively stable, starting at 3.1 percent in 1926 and fluctuating slightly between 3.4 and 3.8 percent through 2021.
Others in grey represent the top layer. This group starts at 11.2 percent in 1926, reaches a low of 10.4 percent in 1959, and increases to 14.2 percent by 2021.
Number of the ten largest ethnic groups in Russia according to the censuses of 1926–2021, people (beginning)
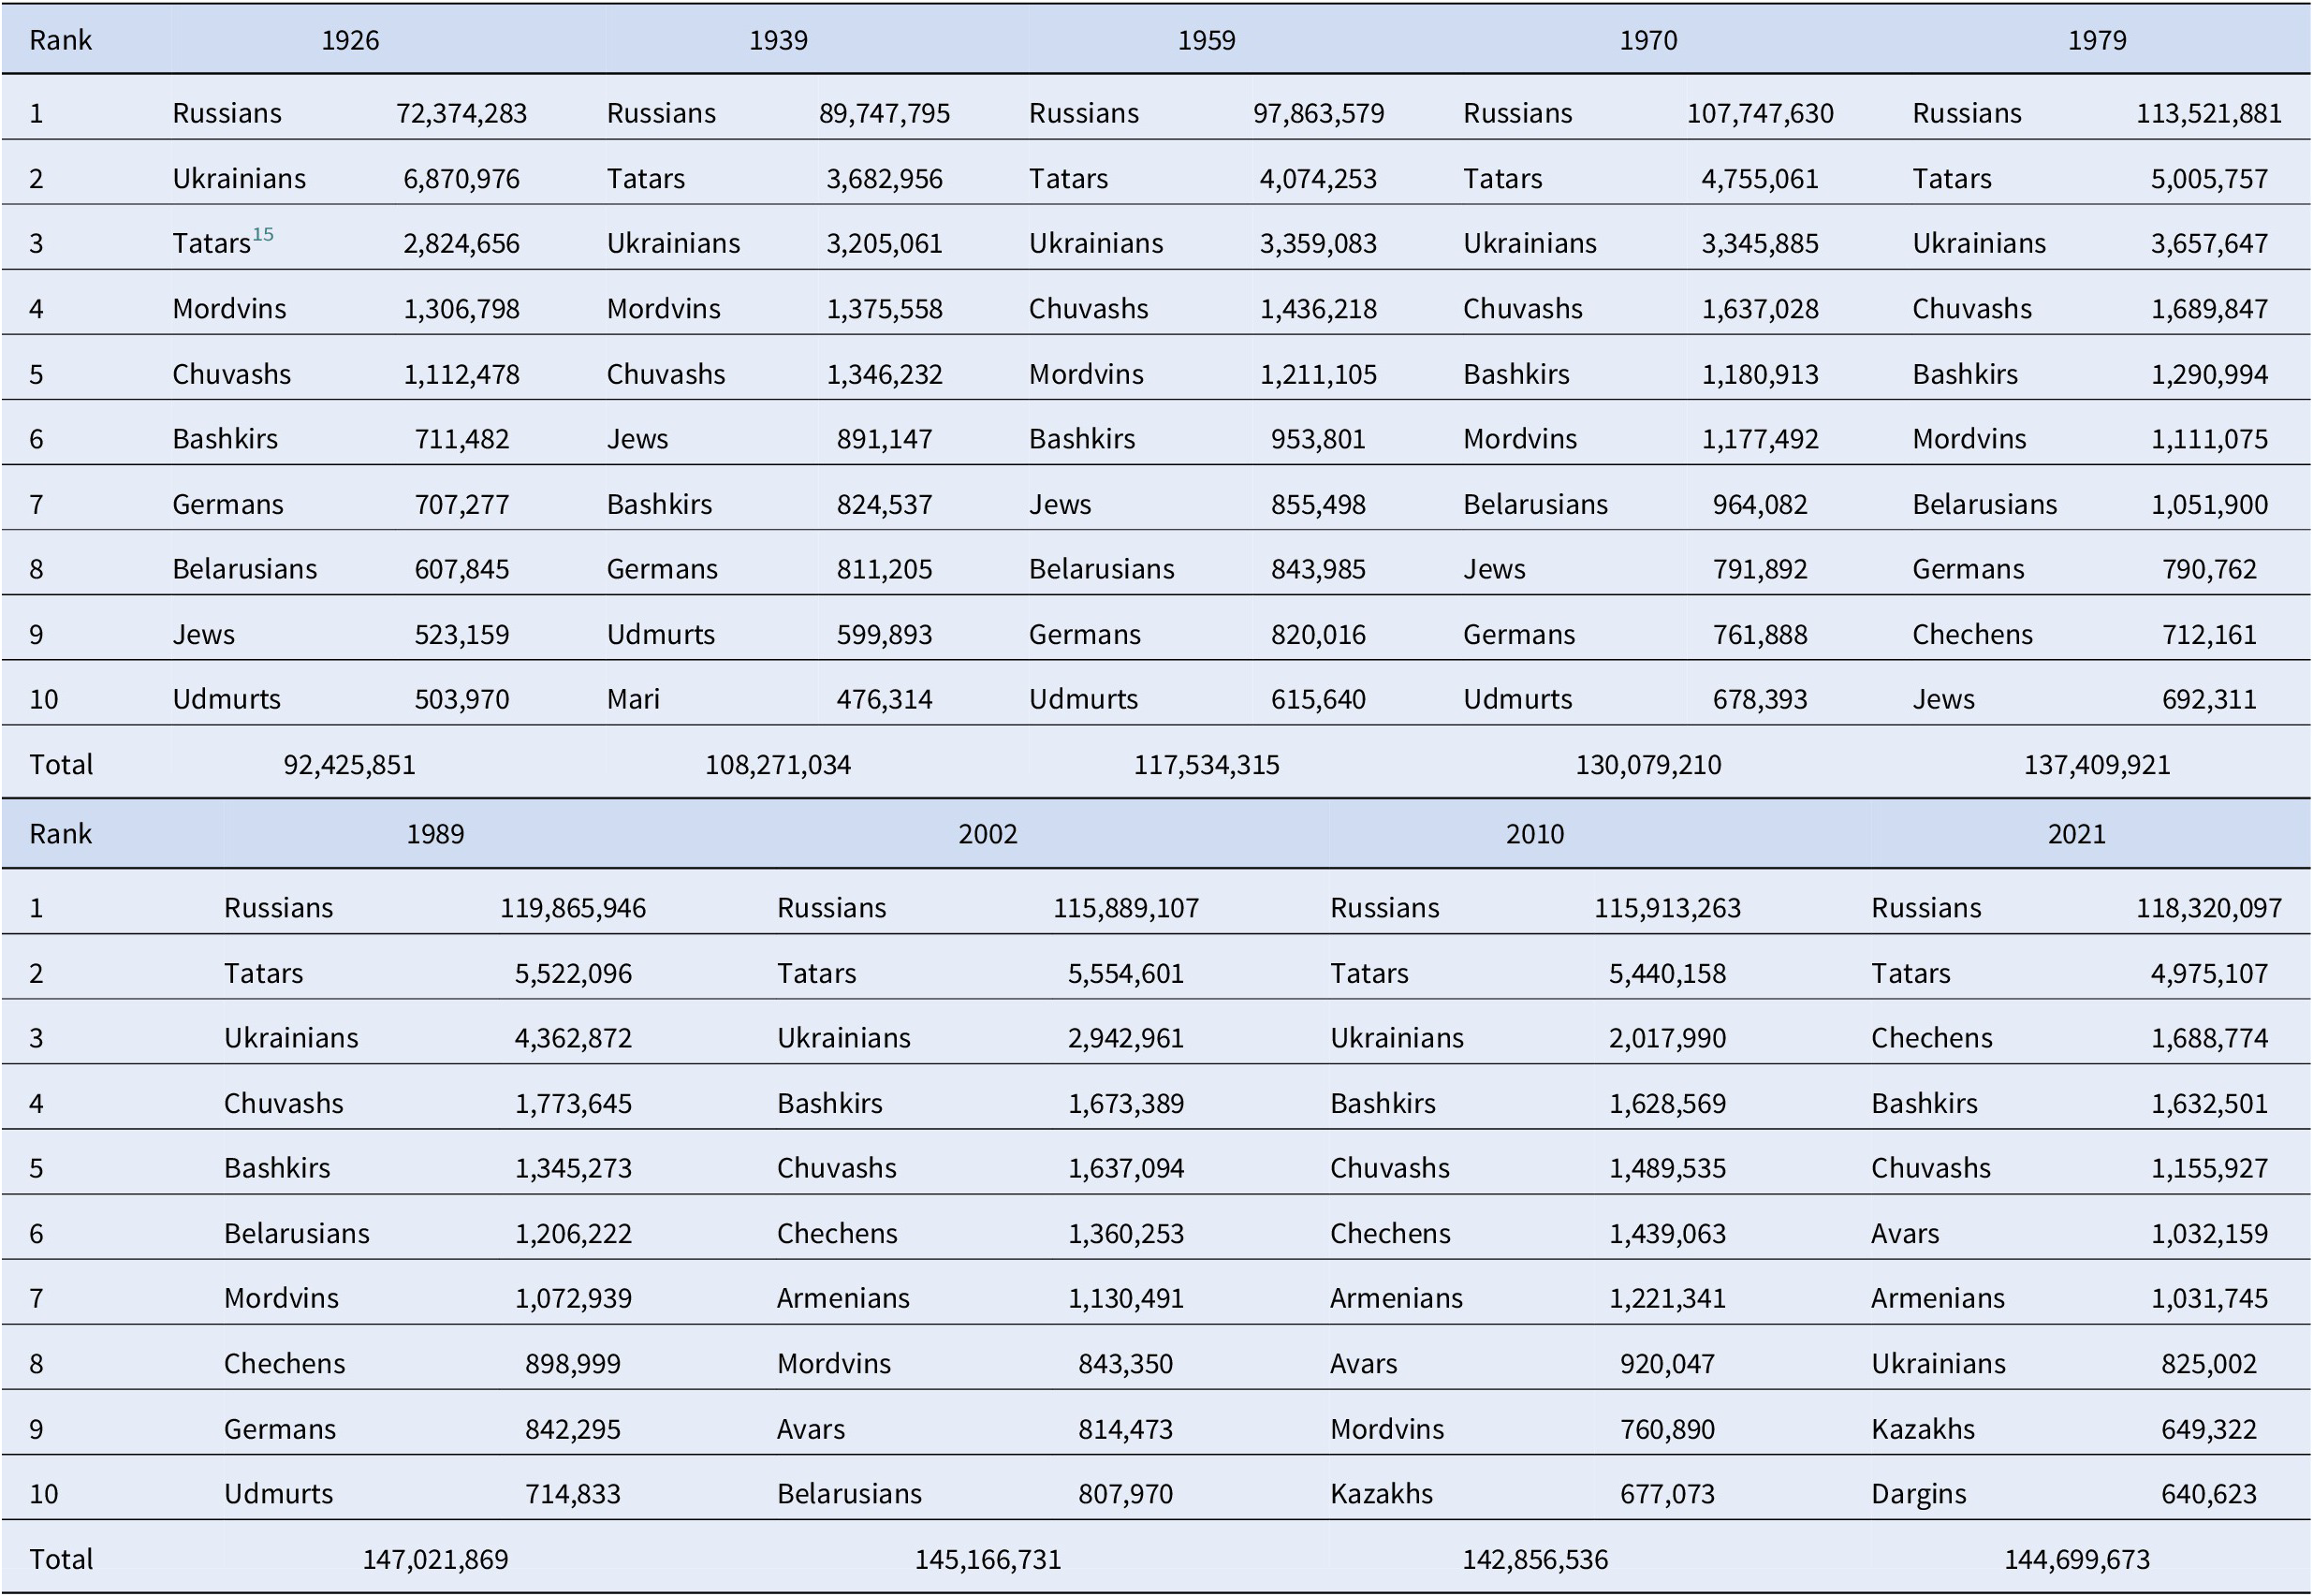
Table 2. Long description
The data is split into two table sections.
Section 1 covers 1926 to 1979.
* 1926: Russians (72,374,283), Ukrainians (6,870,976), Tatars (2,824,656), Mordvins (1,306,798), Chuvashs (1,112,478), Bashkirs (711,482), Germans (707,277), Belarusians (607,845), Jews (523,159), Udmurts (503,970). Total: 92,425,851.
* 1939: Russians (89,747,795), Tatars (3,682,956), Ukrainians (3,205,061), Mordvins (1,375,558), Chuvashs (1,346,232), Jews (891,147), Bashkirs (824,537), Germans (811,205), Udmurts (599,893), Mari (476,314). Total: 108,271,034.
* 1959: Russians (97,863,579), Tatars (4,074,253), Ukrainians (3,359,083), Chuvashs (1,436,218), Mordvins (1,211,105), Bashkirs (953,801), Jews (855,498), Belarusians (843,985), Germans (820,016), Udmurts (615,640). Total: 117,534,315.
* 1970: Russians (107,747,630), Tatars (4,755,061), Ukrainians (3,345,885), Chuvashs (1,637,028), Bashkirs (1,180,913), Mordvins (1,177,492), Belarusians (964,082), Jews (791,892), Germans (761,888), Udmurts (678,393). Total: 130,079,210.
* 1979: Russians (113,521,881), Tatars (5,005,757), Ukrainians (3,657,647), Chuvashs (1,689,847), Bashkirs (1,290,994), Mordvins (1,111,075), Belarusians (1,051,900), Germans (790,762), Chechens (712,161), Jews (692,311). Total: 137,409,921.
Section 2 covers 1989 to 2021.
* 1989: Russians (119,865,946), Tatars (5,522,096), Ukrainians (4,362,872), Chuvashs (1,773,645), Bashkirs (1,345,273), Belarusians (1,206,222), Mordvins (1,072,939), Chechens (898,999), Germans (842,295), Udmurts (714,833). Total: 147,021,869.
* 2002: Russians (115,889,107), Tatars (5,554,601), Ukrainians (2,942,961), Bashkirs (1,673,389), Chuvashs (1,637,094), Chechens (1,360,253), Armenians (1,130,491), Mordvins (843,350), Avars (814,473), Belarusians (807,970). Total: 145,166,731.
* 2010: Russians (115,913,263), Tatars (5,440,158), Ukrainians (2,017,990), Bashkirs (1,628,569), Chuvashs (1,489,535), Chechens (1,439,063), Armenians (1,221,341), Avars (920,047), Mordvins (760,890), Kazakhs (677,073). Total: 142,856,536.
* 2021: Russians (118,320,097), Tatars (4,975,107), Chechens (1,688,774), Bashkirs (1,632,501), Chuvashs (1,155,927), Avars (1,032,159), Armenians (1,031,745), Ukrainians (825,002), Kazakhs (649,322), Dargins (640,623). Total: 144,699,673.
So, the Ukrainians, who until the 1930s were the second largest ethnic group in Russia (2.4 times larger than the Tatars, who followed them in terms of numbers), by the end of the 1930s “dropped” to the third place in the ranking column, “passing” ahead of the Tatars. This ranking of the three largest peoples, the Russians, Tatars, and Ukrainians, was maintained in all censuses from 1939 to 2010. The dynamics of the number of other people in the Soviet period were to a much greater extent determined by natural-demographic or migration reasons. For example, the number of Tatars, due to a higher birth rate, gradually increased both in absolute and relative terms: in 1926, 3.1 percent; in 1939, 3.4 percent; in 1959, 3.5 percent; and in 1989, 3.8 percent. The population of all other ethnic minorities in aggregate (without Tatars and Ukrainians) gradually declined until the 1960s, and then began to increase, strongly accelerating its growth after the collapse of the USSR, due to mass migration to Russia from other post-Soviet states (in 1989, 11.7 percent; in 2002, 14.3 percent). However, in the last two decades, the share of ethnic minorities has generally remained stable (in 2010, 13.6 percent; in 2021, 14.2 percent).
Thus, over the last hundred years, no fundamental changes in the ratio of the Russian ethnic majority and ethnic minorities have occurred; the share of Russians in the population during most of the period fluctuated in the range of 80–83 percent, and their current relative number (81.8 percent) is in no “way out” of this range. If we consider the numerical dynamics of the largest ethnic groups in Russia over the last hundred years in more detail, by groups of peoples, then the following trends can be identified:
-
1. Decreases of indigenous peoples of the Finno-Ugric linguistic group. If in 1939 there were three such ethnic groups among the first ten largest peoples (the Mordvins in 4th place, the Udmurts in the 9th, and the Mari in the 10th), then by 1979, only the Mordvins in 6th place, and according to the census of 2021, the Mordvins, as the largest people of the Finno-Ugric group, took only 17th place. The Mordvins reached their maximum number in 1939, and now their number has decreased 2.7 times; the Udmurts and Mari reached their peak number in 1989, and now they have decreased 1.7 times and 1.4 times, respectively.
-
2. Population growth up to the end of the 20th century and the beginning of depopulation in the last two decades of the largest peoples of the Turkic language group from the Volga region: Tatars, Bashkirs, and Chuvashs. The number of Chuvashs reached its peak in 1989 and then decreased by 1.5 times; Tatars and Bashkirs in 2002 (since then, their number decreased by 10 percent and 2 percent, respectively).
-
3. Growth in the number and share of the peoples of the North Caucasus. Up until 1979, there were no North Caucasian peoples in the top ten largest ethnic groups in Russia (Chechens ranked 9th in 1979). In 2021, there were already three North Caucasian peoples in the top ten: Chechens in 3rd place, Avars in 6th place, and Dargins in 10th. Since the collapse of the USSR, the number of Chechens (even despite two bloody wars in Chechnya) and Avars has increased 1.9 times, Dargins 1.8 times, and so on.
-
4. Ethnic groups, which can be categorized by the presence of statehood outside Russia, and therefore perceived as “foreign” and potentially disloyal or even hostile. Over the last hundred years, among such ethnic groups, the top ten peoples of Russia have included Ukrainians, Belarusians, Jews, Germans, Armenians, and Kazakhs. Due to the lack of “their” administrative-territorial autonomiesFootnote 8 (although many of them have places of compact residence), these peoples have not had, and do not have, institutional opportunities to maintain their ethno-cultural identity and are therefore more susceptible to assimilation. The mentioned ethnic groups reached their peak numbers in various historical periods: Ukrainians in 1926, Jews in 1939, Belarusians and Germans in 1989, Armenians in 2002, and Kazakhs in 2010. Thus, by 2021, the number of Ukrainians in comparison with their maximum number in 1926 had decreased eight times, the number of Belarusians in comparison with their number in 1989 five times, the Germans four times, and so on (Figure 3).
The number of the main ethnic minorities in Russia (reaching the number of over 1 million people) according to the population censuses of 1926–2021 (within 1991 borders; the darker color shows the year of reaching the maximum number).
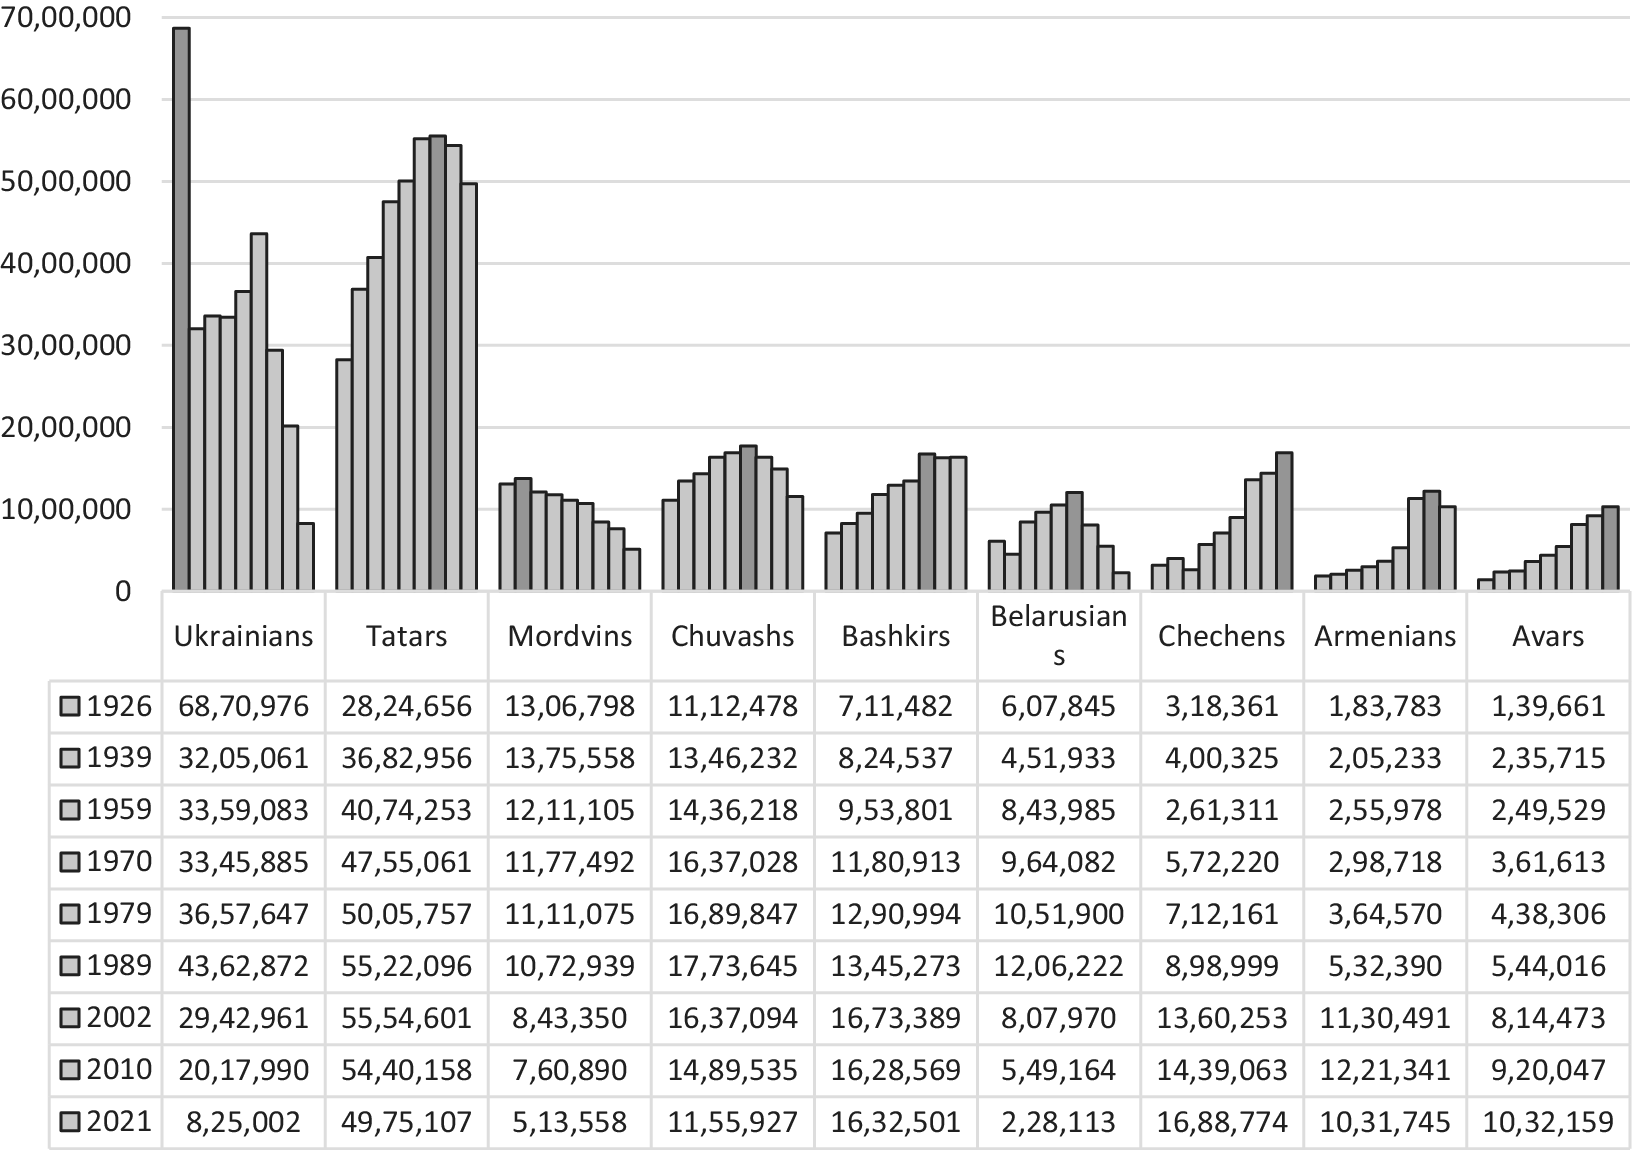
Figure 3. Long description
The chart features a vertical y-axis representing population counts from 0 to 7,000,000 and an x-axis listing nine ethnic groups. Each group has a cluster of nine bars corresponding to census years 1926, 1939, 1959, 1970, 1979, 1989, 2002, 2010, and 2021. Darker shaded bars indicate the peak population year for each group.
* Ukrainians: Start at a peak of 6,870,976 in 1926, followed by a sharp decline and a secondary rise to 4,362,872 in 1989, before dropping to 825,002 in 2021.
* Tatars: Show a steady increase from 2,824,656 in 1926 to a peak of 5,554,601 in 2002, with a slight decline to 4,975,107 by 2021.
* Mordvins: Peak early at 1,375,558 in 1939 and show a consistent downward trend to 513,558 in 2021.
* Chuvashs: Increase from 1,112,478 in 1926 to a peak of 1,773,645 in 1989, then decline to 1,155,927 in 2021.
* Bashkirs: Show a long-term growth trend from 711,482 in 1926 to a peak of 1,673,389 in 2002, remaining stable around 1.6 million through 2021.
* Belarusians: Rise from 607,845 in 1926 to a peak of 1,206,222 in 1989, followed by a significant drop to 228,113 in 2021.
* Chechens: Show rapid growth from 318,361 in 1926 to a peak of 1,688,774 in 2021.
* Armenians: Increase from 183,783 in 1926 to a peak of 1,221,341 in 2010, with a slight decrease to 1,031,745 in 2021.
* Avars: Demonstrate consistent growth from 139,661 in 1926 to a peak of 1,032,159 in 2021.
Ethno-demographic trends in Russia in the 2010s were, in the vast majority of cases, a continuation of the trends of the entire post-Soviet period. Out of the 29 largest ethnic groups with a population of over 200 thousand people according to the 2010 census, by 2021, the number of 14 ethnic groups had increased, and 15 had decreased (Figure 4). It is well known that the number of ethnic groups changes due to three factors: natural demographic, migration, and changes in identity. In Russian society, the dynamics of the size of ethnic groups have historically been determined more often by migration and assimilation factors than by demographic ones, and the 2010s were no exception.
Population dynamics of the largest peoples of Russia for the intercensal period 2010–2021, percent.

Figure 4. Long description
The Y axis represents the percentage change ranging from negative 80 to 100 with horizontal grid lines every 20 units. The X axis lists ethnic groups.
Groups with positive growth from left to right are
* Tajiks at 90 percent
* Uzbeks at 20 percent
* Ingush at 20 percent
* Tuvans at 18 percent
* Chechens at 17 percent
* Kumyks at 15 percent
* Avars at 12 percent
* Yakuts at 9 percent
* Dargins at 8 percent
* Lezgins at 6 percent
* Buryats at 6 percent
* Karachays at 5 percent
* Kabardins at 4 percent
* Russians at 2 percent
* Total population at 1 percent
* Bashkirs at 0 percent
Groups with negative growth from left to right are
* Ossetians at negative 3 percent
* Kazakhs at negative 4 percent
* Tatars at negative 9 percent
* Roma Gypsies at negative 13 percent
* Azerbaijanis at negative 15 percent
* Armenians at negative 16 percent
* Mari at negative 21 percent
* Chuvashs at negative 22 percent
* Udmurts at negative 26 percent
* Komi at negative 31 percent
* Mordvins at negative 33 percent
* Germans at negative 47 percent
* Belarusians at negative 58 percent
* Ukrainians at negative 59 percent
The highest growth in the 2010s was in Tajiks (90 percent) and Uzbeks (20 percent), whose numbers grew so significantly mainly due to the influx of migrants from Central Asian countries. The growth of “the Muslim” peoples of the North Caucasus (Ingush, 20 percent; Chechens, 17 percent; Kumyks, 15 percent; Avars, 12 percent; Dargins, 8 percent; Lezgins, 6 percent; Karachays, 5 percent; Kabardins, 4 percent) and three Siberian ethnic groups (Tuvans, 18 percent; Yakuts, 9 percent; and the Buryats, 6 percent) was also faster than the national average. The number of ethnic Russians increased by 2.1 percent (2.4 million people) and contributed to the country’s overall population growth, which amounted to 1.3 percent or 1.8 million people over the period 2010–2021. In other words, Russians as an ethnic majority increased, while ethnic minorities in aggregate decreased.
The leaders of depopulation can be found in ethnic groups perceived as “foreign” in Russian society (Ukrainians, 59 percent; Belarusians, 58 percent; Germans, 47 percent; Armenians, 6 percent; Azerbaijanis, 15 percent; Kazakhs, 4 percent), all Finno-Ugric peoples (Mordvins, 33 percent; Komi, 31 percent; Udmurts, 26 percent; Mari, 21 percent); two peoples of the Turkic group, the Chuvashs (22 percent) and the Tatars (9 percent); Ossetians (3 percent, the largest “Christian” ethnic group in the North Caucasus); and Roma (13 percent). The number of Bashkirs remained almost unchanged (Figure 4).
Let us consider now the reasons for this demographic trajectory. The 2010s were not marked by any large-scale migration movements to or from Russia, with the exception of migration from Ukraine following Russia’s covert aggression in 2014, and the influx of labor migrants from Central Asia, which saw an increase in Tajiks and Uzbeks. The influx of forced migrants from Ukraine in 2014–2015 should have led to an increase in the number of ethnic Ukrainians, but in practice, there was a 2.4-fold decrease. Sociological studies show that the reason for such phenomenally negative dynamics of Ukrainians was the anti-Ukrainian policy of the Russian state, which made the Ukrainian identity extremely “uncomfortable” even before the full-scale aggression in 2022 (Author Paper). Similar tendencies, though in a less obvious form, were also characteristic of Belarusians, Germans, and other “foreign” ethnic groups.
The only census statistics characterizing the natural-demographic situation among ethnic groups in modern Russia are data on the number of children born to women of different ethnicities. Of course, these data do not fully reflect the demographic dynamics, as we lack data on mortality rates, but in general, the distribution of fertility rates gives a basic idea of the demographic situation. So, let us look at the data on the average number of children born to women of the largest ethnic groups in Russia and compare it with the real demographic dynamics of these peoples. Figure 5 presents data on the number of children born to women aged 15 to 50, so that we can assess more contemporary fertility data, since women mostly of these ages gave birth between the 2000s and 2010s.
Number of children born to women of the largest ethnic groups in Russia aged 15–49 years, according to the 2021 census, per 1,000 women.

Figure 5. Long description
The y-axis represents the number of children born per 1,000 women, with increments of 500 from 0 to 3,000. The x-axis lists ethnic groups in descending order of birth rates.
Data points from left to right are as follows:
* Roma Gypsies: 2,407
* Tajiks: 2,010
* Avars: 1,775
* Kumyks: 1,759
* Dargins: 1,735
* Uzbeks: 1,733
* Tuvans: 1,689
* Lezgins: 1,658
* Chechens: 1,639
* Buryats: 1,604
* Komi: 1,599
* Azerbaijanis: 1,599
* Yakuts: 1,573
* Germans: 1,571
* Udmurts: 1,567
* Laktsy: 1,549
* Kazakhs: 1,517
* Mari: 1,485
* Karachays: 1,436
* Chuvashs: 1,434
* Ingush: 1,405
* Armenians: 1,395
* Kalmyks: 1,389
* Kabardins: 1,384
* Ukrainians: 1,347
* Bashkirs: 1,306
* Belarusians: 1,288
* Tatars: 1,264
* Total population: 1,249
* Mordvins: 1,234
* Russians: 1,198
* Ossetians: 1,172
As we can see, the birth rate among ethnic Russians was one of the lowest in the country; of the 31 largest ethnic groups, only Ossetians had a lower birth rate. A similar situation was recorded by all earlier censuses. That is, in the absence of the influence of the assimilation factor, the demographic situation of all ethnic minorities (except for Ossetians) should have been better than that of ethnic Russians in recent decades, but in practice, we see a different picture. For instance, Ukrainian and Belarusian women have higher birth rates than Russians by 12 and 8 percent, respectively, but their numbers have decreased fivefold in the post-Soviet period without any significant migration outflow, while the number of Russians has remained almost unchanged. Or, the birth rate among Roma is twice as high as among Russians, but the Roma population declined by 13 percent in the 2010s, while the Russian population increased by 2 percent. Paradoxically, but in general, among the peoples whose numbers were growing in the 2010s, the birth rate was 10 percent lower than among ethnic groups with declining numbers (1234 and 1369 children, respectively), because the first figure included ethnic Russians. This fact demonstrates that in ethno-demographic processes in Russia, the determining role is played not by demographic factors proper, but by the assimilation factor, which in turn depends to a large extent on the level of social comfort of certain identities and ethno-cultures.
Assimilation or “mimicry”Footnote 9 processes in Russian society are also largely determined by the size of cultural and racial differences between Russians as an ethnic majority and certain ethnic minorities. In other words, the high level of chauvinistic and racist attitudes in Russian society prevents the assimilation of peoples visually and culturally very different from Russians. Therefore, it is not by accident that the leaders in quantitative growth are the peoples of the North Caucasus and Siberia, whose anthropological differences with Russians are relatively strong. And, on the contrary, the ethnic groups that can relatively easily “mimic” Russians are the most rapidly declining. For example, the birth rate among Komi women is even slightly higher than among Yakuts (Figure 5), but during the 2010s, the number of Komi decreased by 31 percent, while the number of Yakuts increased by 9 percent (Figure 4).
An even greater role in the development of assimilation is played by the significant and rapid linguistic Russification of ethnic minorities. In fact, the process of switching from the national language, even within family communication (not to mention social communication) to Russian, is the main mechanism of ethnic identity change in favor of Russians (Smith Reference Smith and Gasimov2012). Figure 6 shows the correlation between the numerical dynamics of ethnic minorities in Russia and the level of their Russification (the number of people who call their mother tongue Russian rather than their national language). As we can see, the level of linguistic Russification determines ethnic dynamics to a much greater extent than the birth rate discussed above. The fastest depopulation rates are registered among the most Russified peoples — Germans, Belarusians, and Ukrainians. By contrast, the peoples of the North Caucasus, Tuvans, and Yakuts, who have the fastest growth rate, are characterized by the lowest degree of Russification.
Dependence of numerical dynamics and the level of linguistic Russification of ethnic minorities in Russia according to the 2010 and 2021 censuses (for each ethnic group, data for both axes are indicated in parentheses).

Figure 6. Long description
The x-axis represents the percentage of an ethnic group that indicated Russian as their native language in the 2010 census, ranging from 0 to 80 percent. The y-axis represents population dynamics from 2010 to 2021 in percent, ranging from negative 70 to positive 90. The data shows a negative correlation where groups with higher levels of linguistic Russification generally experienced greater population declines.
Data points are marked with black diamonds and numbered 1 through 28.
High-growth outliers include point 22 Tajiks at the top left with 90 percent growth.
Groups with low Russification and positive growth clustered near the y-axis include 11 Ingush, 24 Tuvans, 7 Chechens, 16 Kumyks, 2 Avars, 9 Dargins, 27 Uzbeks, 28 Yakuts, 17 Lezgins, 13 Karachays, and 12 Kabardins.
Groups with moderate Russification and slight growth or decline include 6 Buryats, 4 Bashkirs, 20 Ossetians, 23 Tatars, 21 Roma, 3 Azerbaijanis, 14 Kazakhs, 1 Armenians, 18 Mari, and 8 Chuvashs.
Groups with high Russification and significant population decline are located in the bottom right quadrant, including 19 Mordvins, 25 Udmurts, 15 Komi, 10 Germans, 26 Ukrainians, and 5 Belarusians. The latter two show the most extreme declines at approximately negative 59 percent.
For instance, the birth rate among Germans is 34 percent higher than among Ossetians, but in the 2010s the number of Germans decreased by 47 percent and Ossetians by only 3 percent, which is explained by the greater susceptibility of Germans to assimilation, the main mechanism of which is Russification (among Germans the share of people who named Russian as their native language in 2010 was 89 percent, and among Ossetians 7 percent). On average, in the 2010s, among numerically growing ethnic groups the share of residents whose native language was Russian was only 6 percent, and among depopulating peoples, 38 percent. Thus, both the Soviet and present-day Russian practice of displacing and marginalizing the national languages of ethnic minorities resulted in (and, I believe, aimed at) their assimilation.
Ethno-territorial trends in contemporary Russia. Despite the predominance of Russians in the population of the country as a whole, in the regional dimension their number varies from 97 percent in the Arkhangelsk Oblast to less than one percent in the Republic of Ingushetia. Of the 83 regions of Russia, Russians make up the absolute majority in 71. Accordingly, in 12 regions Russians are not the majority and these are all national republics (Tatarstan 40 percent, Bashkortostan 38 percent, Yakutia 35 percent, Chuvashia 32 percent, Karachay-Cherkessia 28 percent, Kalmykia 26 percent, Kabardino-Balkaria 20 percent, North Ossetia 19 percent, Tuva 10 percent, Dagestan 3 percent, and 1 percent each in Chechnya and Ingushetia).
The Russian ethnic core is primarily the regions of the historical formation of Russians as a people, located in the center and north of the European part of Russia. In more than half of the country’s regions (43 out of 83) Russians account for more than 90 percent of the population. In the vast majority of regions, the share of ethnic Russians has a steady upward trend. Thus, in the period 2002–2010, the relative number of Russians increased in 56 regions, decreased in 27, and during the period 2010–2021, in 59 and 24 regions, respectively. The most important trend that can be observed when analyzing the regional ratio of ethnic Russians to other ethnic groups is that their share tends to increase in those regions where they are the overwhelming majority, while decreasing in those where they are a minority. For instance, of the ten regions of the country where the share of Russians is the lowest, in nine of them this share is decreasing, and these are all the national republics of the North Caucasus, as well as Tuva and Yakutia.
The largest reduction in the relative number of Russians in the past decade was recorded in Tuva, 6 p.p. (that is, the share of Russians decreased from 16.3 to 10.3 percent); in Kalmykia, 4.6 p.p.; in Karachay-Cherkessia, 4 p.p.; and in Yakutia, 2.8 p.p. (Table 3). In such republics as Ingushetia, Chechnya, and Dagestan, the share of Russians, already minimal, also continues to decline. It is also noteworthy that in the “Russian” regions neighboring the North Caucasus republics the share of Russians is noticeably growing: in Krasnodar Krai by 4.1 p.p. and in Stavropol Krai by 2.1 p.p. This means that there is a process of ethnic separation in the south of Russia, ethnic Russians are leaving the republics of the North Caucasus en masse for the neighboring “Russian” regions.
Regions of Russia with the largest increase and decrease in the share of ethnic Russians according to the 2002, 2010, and 2021 censuses, percentage points
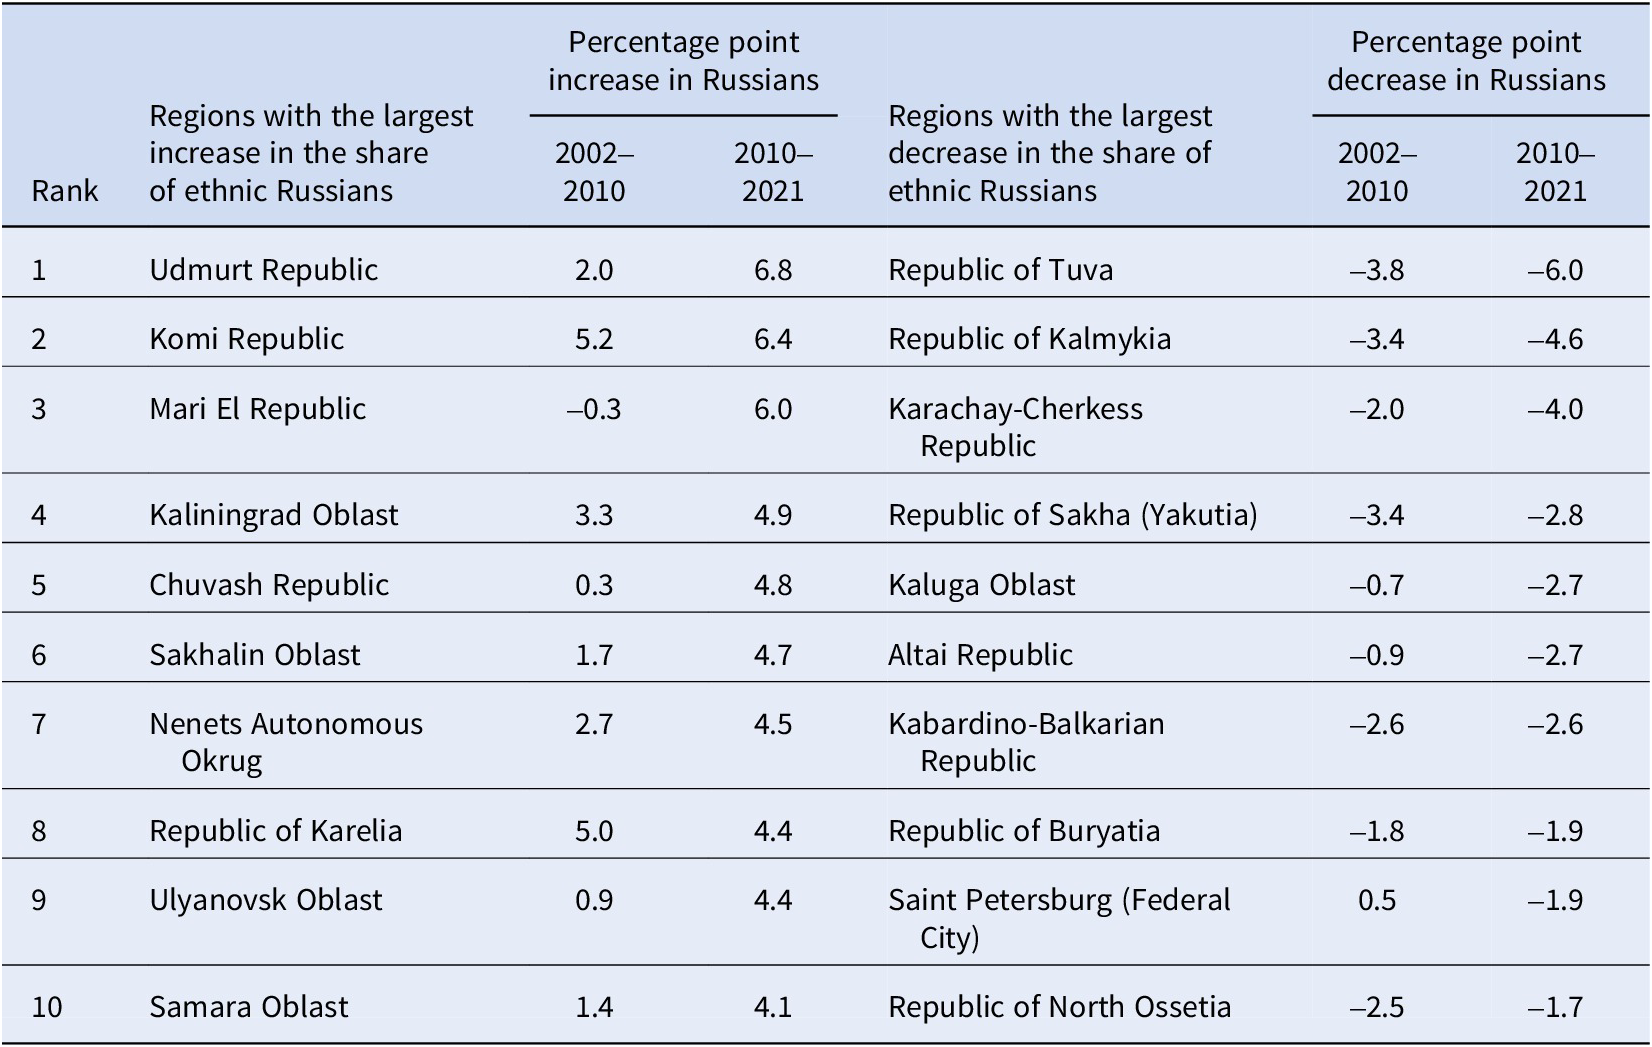
Table 3. Long description
The table consists of 10 ranked rows comparing two categories of regions based on percentage point changes in ethnic Russian populations.
Regions with the largest increase:
* Rank 1: Udmurt Republic. Increase of 2.0 in 2002 to 2010 and 6.8 in 2010 to 2021.
* Rank 2: Komi Republic. Increase of 5.2 in 2002 to 2010 and 6.4 in 2010 to 2021.
* Rank 3: Mari El Republic. Decrease of 0.3 in 2002 to 2010 and increase of 6.0 in 2010 to 2021.
* Rank 4: Kaliningrad Oblast. Increase of 3.3 in 2002 to 2010 and 4.9 in 2010 to 2021.
* Rank 5: Chuvash Republic. Increase of 0.3 in 2002 to 2010 and 4.8 in 2010 to 2021.
* Rank 6: Sakhalin Oblast. Increase of 1.7 in 2002 to 2010 and 4.7 in 2010 to 2021.
* Rank 7: Nenets Autonomous Okrug. Increase of 2.7 in 2002 to 2010 and 4.5 in 2010 to 2021.
* Rank 8: Republic of Karelia. Increase of 5.0 in 2002 to 2010 and 4.4 in 2010 to 2021.
* Rank 9: Ulyanovsk Oblast. Increase of 0.9 in 2002 to 2010 and 4.4 in 2010 to 2021.
* Rank 10: Samara Oblast. Increase of 1.4 in 2002 to 2010 and 4.1 in 2010 to 2021.
Regions with the largest decrease:
* Rank 1: Republic of Tuva. Decrease of 3.8 in 2002 to 2010 and 6.0 in 2010 to 2021.
* Rank 2: Republic of Kalmykia. Decrease of 3.4 in 2002 to 2010 and 4.6 in 2010 to 2021.
* Rank 3: Karachay-Cherkess Republic. Decrease of 2.0 in 2002 to 2010 and 4.0 in 2010 to 2021.
* Rank 4: Republic of Sakha (Yakutia). Decrease of 3.4 in 2002 to 2010 and 2.8 in 2010 to 2021.
* Rank 5: Kaluga Oblast. Decrease of 0.7 in 2002 to 2010 and 2.7 in 2010 to 2021.
* Rank 6: Altai Republic. Decrease of 0.9 in 2002 to 2010 and 2.7 in 2010 to 2021.
* Rank 7: Kabardino-Balkarian Republic. Decrease of 2.6 in 2002 to 2010 and 2.6 in 2010 to 2021.
* Rank 8: Republic of Buryatia. Decrease of 1.8 in 2002 to 2010 and 1.9 in 2010 to 2021.
* Rank 9: Saint Petersburg (Federal City). Increase of 0.5 in 2002 to 2010 and decrease of 1.9 in 2010 to 2021.
* Rank 10: Republic of North Ossetia. Decrease of 2.5 in 2002 to 2010 and 1.7 in 2010 to 2021.
However, the situation with the dynamics of Russians in “the national” regions is not straightforward, as the republics are also on the opposite pole of ethno-demographic trends. The largest increase in the share of ethnic Russians occurred in Finno-Ugric republics: in Udmurtia by 6.8 p.p., in Komi by 6.4 p.p. and in Mari El by 6 p.p. There is also active Russification in Chuvashia and Karelia, but also in “Russian” regions with significant ethnic minorities (Table 3). It is also important to note that while in the 1990s and 2000s the main assimilation “resource” for Russians were Ukrainians, Belarusians, Germans, and peoples of the Finno-Ugric group, in the 2010s we already observe the development of broad assimilation of Tatars and Chuvashs.
Let us now consider the situation in the national republics from the point of view of the number and dynamics of “titular” ethnic groups in them. Within the internationally recognized borders of the Russian Federation, it includes 21 republics, the situation in which is radically different. Thus, in 11 republics the share of “the titular” ethnic group exceeds half of the population: these are all republics in the North Caucasus (except for Adygea), Chuvashia, and Tatarstan in the Volga region, Tuva in Siberia, and Yakutia in the Far East, and in all these republics (except for Chuvashia) there is a steady increase in the share of autochthonous peoples (Figure 7). In the other ten republics, the situation is the opposite; the share of “titular” ethnic groups in them does not exceed 40 percent and in seven of them in the 2010s, it was decreasing (all five republics of Finno-Ugric peoples, as well as Adygea in the North Caucasus and Khakassia in Siberia), and it was increasing in only three (Altai, Buryatia, Bashkortostan).
Share of “titular” peoples in the population of the republics within the Russian Federation according to the censuses of 2002, 2010, and 2021.

Figure 7. Long description
The y-axis represents the percentage from 0 to 100 with horizontal grid lines at 25 percent intervals. The x-axis lists 21 republics. A legend at the bottom identifies three bars for each republic: dark blue for 2002, light blue for 2010, and olive green for 2021 recalculation.
From left to right, the data shows:
* Chechnya: 93.5, 95.3, 96.4.
* Ingushetia: 77.3, 94.1, 96.4.
* Dagestan: 94.3, 95.7, 95.7.
* Tuva: 77.0, 82.0, 88.4.
* Kabardino-Balkaria: 67.0, 70.1, 73.7.
* North Ossetia: 63.0, 65.1, 68.1.
* Karachay-Cherkessia: 57.2, 60.7, 65.2.
* Chuvashia: 67.7, 67.7, 62.8.
* Kalmykia: 53.3, 57.4, 62.7.
* Tatarstan: 52.9, 53.2, 53.5.
* Sakha Yakutia: 45.7, 49.9, 52.7.
* Mari El: 43.1, 43.9, 39.2.
* Mordovia: 32.1, 40.1, 38.6.
* Altai: 33.5, 34.7, 37.3.
* Buryatia: 28.1, 30.4, 32.7.
* Bashkortostan: 29.8, 29.5, 31.5.
* Adygea: 24.4, 25.8, 25.5.
* Udmurtia: 29.4, 28.0, 22.6.
* Komi: 25.3, 23.7, 20.1.
* Khakassia: 12.0, 12.1, 11.8.
* Karelia: 11.9, 9.3, 6.6.
The trend shows high and increasing titular populations in the North Caucasus and Tuva, while republics like Karelia and Komi show low and declining percentages.
Summarizing, we can say that the republics in which “the titular” peoples numerically prevail are becoming more and more ethnocentric in demographic terms, and the republics in which autochthonous ethnic groups already yield numerically to ethnic Russians are actively losing their indigenous peoples. In fact, the national character of such republics as Karelia, Khakassia, Komi, and Udmurtia is already nominal. The use of national languages in them is possible only in places of compact settlement, and even then, only at the household level, since the entire official sphere and education function in Russian. In recent years, in these republics, events that testify to the extremely deplorable state of indigenous languages and cultures have had a wide resonance. For example, in September 2019, near the parliament building of the Republic of Udmurtia in the city of Izhevsk, scientist and activist Albert Razin committed an act of self-immolation, trying to draw attention to the extinction of the Udmurt language by such a desperate act. Or, in October 2023, a scandal broke out at a meeting of the parliament of the Komi Republic, as the speaker did not allow a member of parliament to ask a question in the Komi language, belittling it, even though this language is official in the republic.
The media also regularly report on the persecution of cultural activists and researchers engaged in preserving ethnic minority languages and cultural heritage, suspecting them of separatism by the Russian security services. Back in Reference Stefan2017, Stefan pointed out: “The ‘unaccepted’ diversity is often persecuted. … Human and minority rights activists are sometimes accused of being ‘traitors,’ ‘extremists’ or of ‘inciting social hatred’ and are subsequently threatened with prosecution under the legislation against extremist activities” (33). Since then, the situation with minority rights, and more broadly with human rights, has deteriorated dramatically in Russia. Krouglov predicts that if Russia’s current policy is maintained “the functionality of minority languages will be gradually reduced to folklorisation, and this will have a negative impact on the development of those languages. Nevertheless, there has been some opposition to the teaching of Russian at the expense of other state and minority languages and other subjects in some regions, e.g. in Bashkortostan, Tatarstan, and the Republic of Sakha” (Krouglov Reference Krouglov2022, 425).
Based on the existing ethno-demographic realities and trends, as well as in connection with the authorities’ desire to suppress ethno-cultural diversity, Moscow may at any moment raise the issue of liquidating the national status of a number of republics, especially since the experience of the actual liquidation (unification with larger “Russian” regions) of six national autonomous districts in the 2000s is already available. Census data show that national regions are in fact the only effective mechanism for protecting indigenous peoples from complete assimilation. First, we should recall the sad experience of total Russification of ethnic groups that had entire regions of compact residence and were autochthons for these regions, but did not have the status of an ethnically based autonomy (Ukrainians, Belarusians, and so on).Footnote 10 Secondly, in all recent decades, the demographic situation among ethnic groups that have “their” republics was, as a rule, much better for these peoples inside the republics than outside them, in other regions of Russia. In the 2010s, 18 of the 20 largest ethnic groups had better numerical dynamics inside the republics than outside them. For example, the number of Tatars in Tatarstan increased by 6 percent, while outside it decreased by 17 percent; the number of Chechens in Chechnya increased by 21 percent, but in other regions only by 1 percent, and so on (Table 4).
Number and dynamics of the largest peoples with “their” republics within the Russian Federation, in these republics and outside them, according to the 2010 and 2021 censuses

Table 4. Long description
The table contains seven columns: Ethnic group, Republic, Census year, Size in the national republic, Size outside the national republic, Percentage change in the republic, and Percentage change outside the republic.
Key data points include:
* Tatars (Tatarstan): Increased from 2,015,793 to 2,142,925 in the republic (6 percent increase) but decreased by 17 percent outside.
* Chechens (Chechnya): Significant growth in the republic from 1,208,947 to 1,456,792 (21 percent increase) and a 1 percent increase outside.
* Bashkirs (Bashkortostan): Increased 7 percent in the republic to 1,287,334; decreased 19 percent outside.
* Chuvashs (Chuvashia): Decreased in both areas, falling 12 percent in the republic and 36 percent outside.
* Avars (Dagestan): Increased 13 percent in the republic to 970,725; decreased 5 percent outside.
* Ingush (Ingushetia): Highest growth in the republic at 27 percent (reaching 491,267) but a 23 percent decrease outside.
* Mordvins (Mordovia): Significant decline, falling 10 percent in the republic and 50 percent outside.
* Udmurts (Udmurtia): Decreased 23 percent in the republic and 37 percent outside.
* Tuvans (Tuva): Growth in both areas, 18 percent in the republic and 20 percent outside.
* Komi (Komi): Sharp decline of 31 percent in the republic and 32 percent outside.
Other groups listed include Dargins, Kumyks, Kabardins, Yakuts, Azerbaijanis, Ossetians, Lezgins, Buryats, Mari, and Karachays, showing a general trend of population concentration within national republics while populations outside those republics often declined.
Therefore, the above data show that the preservation of autochthonous peoples in Russia is almost exclusively possible only within the framework of national-territorial formations, apparently at the expense of administrative support for the languages and ethno-cultures of these peoples. Outside the republics (or in case they lose this status), total assimilation of many of them looks almost inevitable. The trend toward assimilation is especially clear when looking at long periods of time. For instance, if in 1939, 971 thousand Mordvins were living outside the Republic of Mordovia, in 1989 there were 760 thousand, and in 2021, only 211 thousand.
Since the ethno-demographic situation in the republics within the Russian Federation differs significantly, I assessed the ethno-demographic potential for the development of separatism in them. I proceed from the thesis put forward by Bleaney and Dimico that “in ethnically fractionalized countries minority groups are more likely to be regionally concentrated, implying pockets of local polarization; and … that minorities whose populations are geographically concentrated are more likely to be involved in rebellious activity” (2017, 374). Other researchers have come to a similar conclusion, such as Sorens (Reference Sorens and Denemark2010): “ethnic groups that are geographically concentrated or possess a ‘regional base’ tend to become embroiled in anti-state rebellion at a much higher rate than other ethnic groups.” To assess this potential, I used three indicators: the share of “the titular” ethnic group in the population of the republic, the dynamics of the number of “the titular” people, and the share of “the titular” people of the republic in the entire ethnic group’s population.Footnote 11 They allow us to distinguish four levels of ethno-demographic potential for the development of separatism:
-
— extremely low or the threat of losing the status of a national republic (the share of “the titular” people is less than 40 percent and declining);
-
— low (the share of “the titular” people is between 30 and 55 percent but growing, or the share of “the titular” people is relatively high but declining);
-
— medium (the proportion of indigenous peoples is between 50 and 75 percent and growing);
-
— high (the proportion of “titular” peoples is over 85 percent and growing).
I do not consider in detail other factors that also influence the scenarios of development of separatist aspirations in the republics (history of their relations with Moscow, economic potential, influence of external actors, and so on), as this is beyond the scope of this article and requires a special in-depth study. But for a basic overview of these republics, I provide some information about them in Table 5, and Figure 8 shows their geographical location.
Distribution of republics within the Russian Federation by level of ethno-demographic potential for separatism, 2021
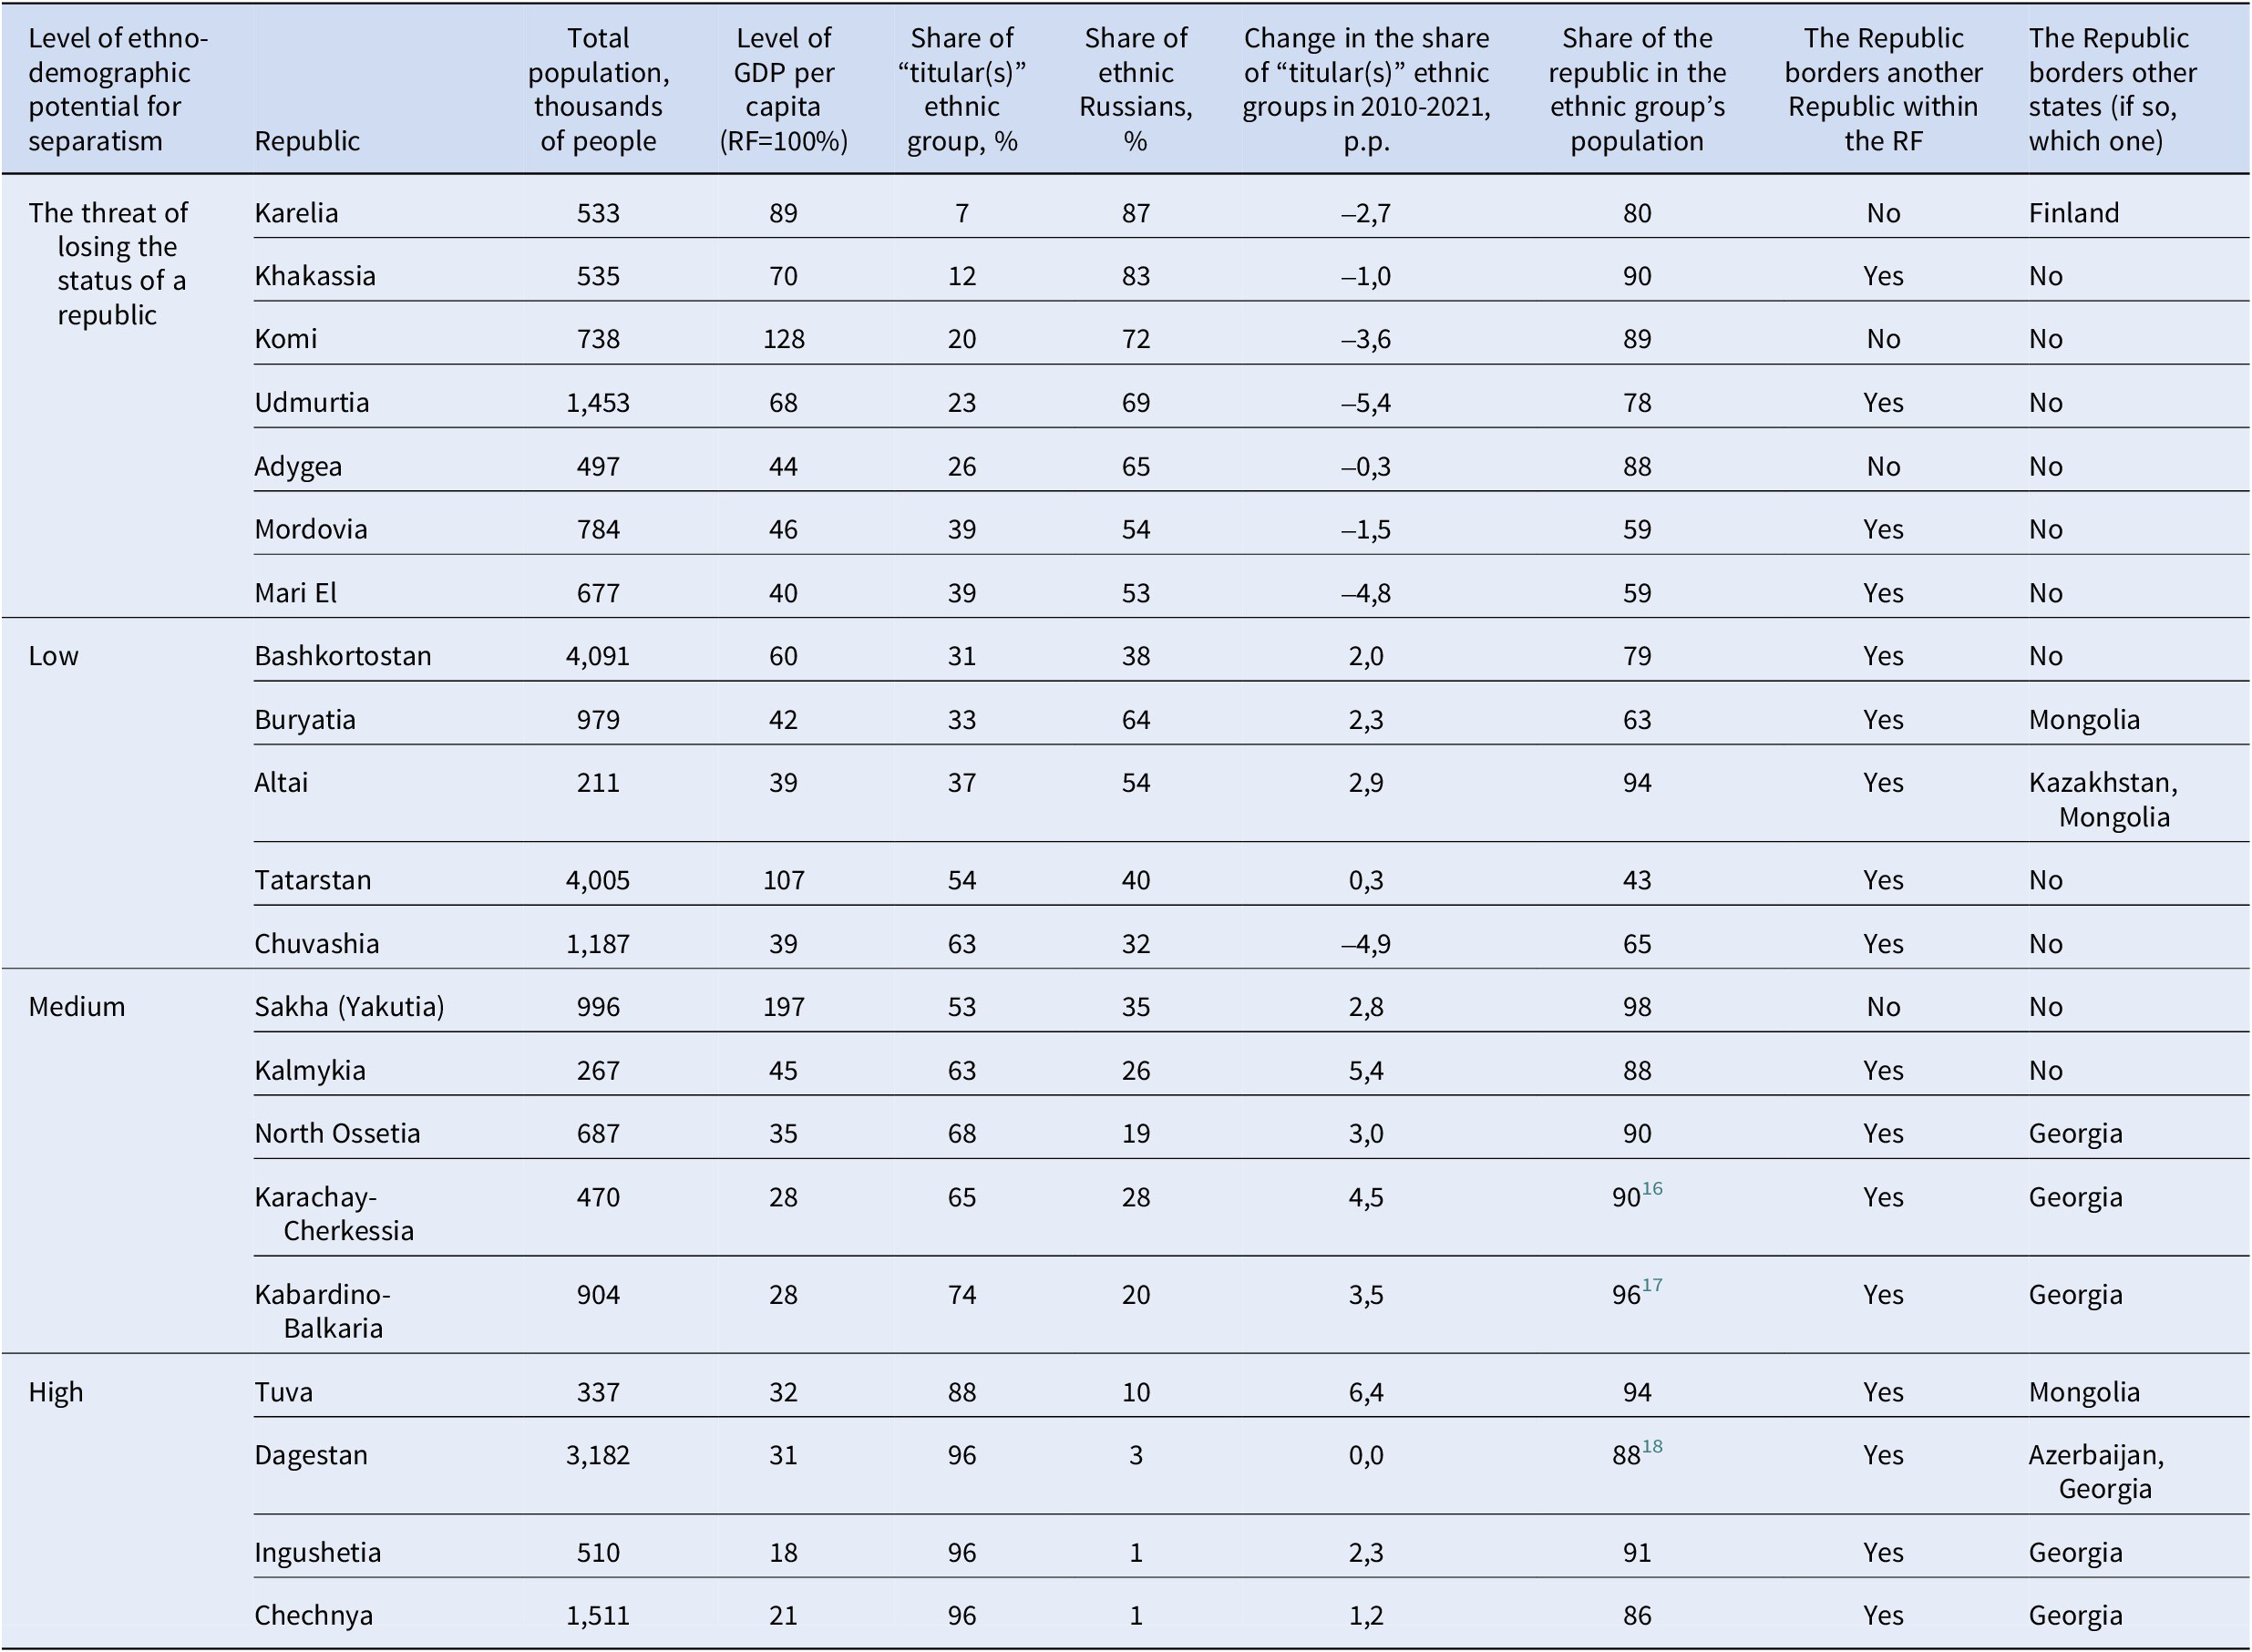
Table 5. Long description
The table contains 10 columns: Level of ethno-demographic potential for separatism, Republic, Total population in thousands, Level of G D P per capita (R F equals 100 percent), Share of titular ethnic group percent, Share of ethnic Russians percent, Change in titular share 2010 to 2021 in p.p., Share of the republic in the ethnic group population, Borders another R F Republic, and Borders other states.
1. The threat of losing the status of a republic:
- Karelia: 533k people, 89 percent G D P, 7 percent titular, 87 percent Russian, minus 2.7 p.p. change, borders Finland.
- Khakassia: 535k people, 70 percent G D P, 12 percent titular, 83 percent Russian, minus 1.0 p.p. change, borders another republic.
- Komi: 738k people, 128 percent G D P, 20 percent titular, 72 percent Russian, minus 3.6 p.p. change.
- Udmurtia: 1,453k people, 68 percent G D P, 23 percent titular, 69 percent Russian, minus 5.4 p.p. change, borders another republic.
- Adygea: 497k people, 44 percent G D P, 26 percent titular, 65 percent Russian, minus 0.3 p.p. change.
- Mordovia: 784k people, 46 percent G D P, 39 percent titular, 54 percent Russian, minus 1.5 p.p. change, borders another republic.
- Mari El: 677k people, 40 percent G D P, 39 percent titular, 53 percent Russian, minus 4.8 p.p. change, borders another republic.
2. Low Potential:
- Bashkortostan: 4,091k people, 60 percent G D P, 31 percent titular, 38 percent Russian, 2.0 p.p. change, borders another republic.
- Buryatia: 979k people, 42 percent G D P, 33 percent titular, 64 percent Russian, 2.3 p.p. change, borders Mongolia.
- Altai: 211k people, 39 percent G D P, 37 percent titular, 54 percent Russian, 2.9 p.p. change, borders Kazakhstan and Mongolia.
- Tatarstan: 4,005k people, 107 percent G D P, 54 percent titular, 40 percent Russian, 0.3 p.p. change, borders another republic.
- Chuvashia: 1,187k people, 39 percent G D P, 63 percent titular, 32 percent Russian, minus 4.9 p.p. change, borders another republic.
3. Medium Potential:
- Sakha (Yakutia): 996k people, 197 percent G D P, 53 percent titular, 35 percent Russian, 2.8 p.p. change.
- Kalmykia: 267k people, 45 percent G D P, 63 percent titular, 26 percent Russian, 5.4 p.p. change, borders another republic.
- North Ossetia: 687k people, 35 percent G D P, 68 percent titular, 19 percent Russian, 3.0 p.p. change, borders Georgia.
- Karachay-Cherkessia: 470k people, 28 percent G D P, 65 percent titular, 28 percent Russian, 4.5 p.p. change, borders Georgia.
- Kabardino-Balkaria: 904k people, 28 percent G D P, 74 percent titular, 20 percent Russian, 3.5 p.p. change, borders Georgia.
4. High Potential:
- Tuva: 337k people, 32 percent G D P, 88 percent titular, 10 percent Russian, 6.4 p.p. change, borders Mongolia.
- Dagestan: 3,182k people, 31 percent G D P, 96 percent titular, 3 percent Russian, 0.0 p.p. change, borders Azerbaijan and Georgia.
- Ingushetia: 510k people, 18 percent G D P, 96 percent titular, 1 percent Russian, 2.3 p.p. change, borders Georgia.
- Chechnya: 1,511k people, 21 percent G D P, 96 percent titular, 1 percent Russian, 1.2 p.p. change, borders Georgia.
Location of republics within the Russian Federation on the map.
Numbers indicate: 1 – Adygea, 2 – Altai, 3 – Bashkortostan, 4 – Buryatia, 5 – Dagestan, 6 – Ingushetia, 7 – Kabardino-Balkaria, 8 – Kalmykia, 9 – Karachay-Cherkessia, 10 – Karelia, 11 – Komi, 12 – Mari El, 13 – Mordovia, 14 – Sakha (Yakutia), 15 – North Ossetia, 16 – Tatarstan, 17 – Tuva, 18 – Udmurtia, 19 – Khakassia, 20 – Chechnya, 21 – Chuvashia.

Figure 8. Long description
The map displays the Russian Federation in light gray with specific republics highlighted in various colors and numbered 1 through 21.
* In the Northwest, Karelia 10 is highlighted in purple near the border with Finland.
* In the North, Komi 11 is highlighted in yellow.
* In the East, Sakha Yakutia 14 is the largest highlighted region, shown in green.
Three dashed circles group the remaining republics into regional clusters:
* Volga region: Located in the West, this cluster includes Mordovia 13, Chuvashia 21, Mari El 12, Tatarstan 16, Udmurtia 18, and Bashkortostan 3.
* North Caucasus region: Located in the Southwest between the Black and Caspian Seas, this cluster includes Adygea 1, Karachay-Cherkessia 9, Kabardino-Balkaria 7, North Ossetia 15, Ingushetia 6, Chechnya 20, Dagestan 5, and Kalmykia 8.
* South Siberian region: Located along the Southern border, this cluster includes Altai 2, Khakassia 19, Tuva 17, and Buryatia 4.
So, the analysis of statistics shows that in seven republics within the Russian Federation (these are all republics of the Finno-Ugric peoples: Karelia, Komi, Udmurtia, Mordovia, Mari El, as well as Khakassia and Adygea), there is extremely low ethno-demographic potential for separatism, because the number of “titular” peoples in them is inferior to the number of ethnic Russians, and the change in the ethnic structure indicates a tendency to Russification of indigenous peoples. Moreover, if current trends continue, by the middle of this century, many of these peoples may face total assimilation and, due to this, the loss of their republics’ status. They can be relatively easily merged by Moscow with neighboring “Russian” regions. Next, let us consider the republics according to the level of increase in their ethno-demographic potential for separatism in more detail for each of them.
Republics with low ethno-demographic potential for the development of separatism
Bashkortostan is the largest republic in terms of population (4.1 million), but since Bashkirs make up only 31 percent of its population, I assess the potential for separatism development in it as low. The share of “the titular” ethnic group in Bashkortostan tends to grow (+2 p.p. in the 2010s), but this growth is mainly determined by regular “rewritings” from census to census of Tatars to Bashkirs and vice versa (Gabdrafikov Reference Gabdrafikov2021), due to the presence of a large Tatar ethnic minority, which makes up 24 percent of the republic’s population. Thus, the two related, Turkic-speaking, predominantly Muslim ethnic groups together make up more than half of the total population, but the politicization of ethnicity and tensions between the republic’s leadership and the leaders of the Tatar minority (and potentially with neighboring Tatarstan) hardly allow for effective sovereignty of Bashkortostan. It should also be noted that ethnic Russians are the largest ethnic group in the republic, accounting for 38 percent of the population, and their share is also growing (+1.5 p.p. in the 2010s).
Tatarstan: Tatars are the largest ethnic minority in Russia, outnumbering the next-ranking Chechens by almost three times. In addition, unlike the vast majority of other republics, Tatarstan is one of Russia’s leading regions in terms of economic development. All this makes the Tatars and their national republic an example, a model for all other peoples of Russia that have their own autonomies. After the collapse of the USSR, in the 1990s, Tatarstan was a “locomotive” in building federal relations. That is why we can say that Tatars play the same role in the Russian Federation as Ukrainians did in the Soviet Union. The share of Tatars in the population of Tatarstan barely exceeds half (54 percent) and, although very slowly, it has been growing in recent decades (Figure 7). However, as Kolstø wrote back in 2000: “On the basis of most historical, geographical, and demographical conditions, however, it should have been impossible to form a separate state of Tatarstan” (216). From an ethno-demographic point of view, the main obstacle to Tatarstan’s independence is that the majority of Tatars (57 percent or 2.8 out of 5 million, Table 4) live outside its borders, primarily in neighboring regions. In other words, the borders of Tatarstan do not practically reflect the ethnic boundaries in the Volga region, which is a “time mine” laid by the Soviet authorities when drawing the borders back in the 1920s. In case separatism develops in Tatarstan and other Volga republics, the issue of borders will become acute, first of all, with neighboring Bashkortostan, where the number of Tatars (991 thousand) is only slightly less than the Bashkirs (1.287 million). However, as statistics on the regional distribution of Tatars show, their preservation as an ethnic group is possible only within the framework of national republics. The Tatar population is decreasing at the fastest rate in the places of its compact residence, precisely in the “Russian regions,” where it is subjected to strong assimilation processes caused by the cultural and educational policy of Moscow. For example, in the 2010s, the number of Tatars decreased by 20 percent in the Orenburg region and by 25 percent in the Chelyabinsk region, while in Bashkortostan by only 4 percent.
Chuvashia is significantly behind neighboring Tatarstan in terms of population (1.2 million people) and economic potential (39 percent of the Russian average GDP level). At the same time, the share of “the titular” people in the population of Chuvashia is the highest among all the republics of the Volga region, 63 percent, but it is rapidly decreasing (by 4.9 p.p. in the 2010s) in favor of Russians. That is, as statistics show, even the relatively high ethnic homogeneity of the republic does not prevent assimilation. But the number of these people outside Chuvashia is decreasing especially fast (-36 percent in the 2010s, see Table 4). Apparently, the Chuvash people’s greater susceptibility to assimilation, compared to other Turkic peoples, is due to the fact that, unlike Tatars and Bashkirs, most Chuvashs adhere to Russian Orthodoxy.
Altai Republic is a small (just over 200 thousand inhabitants), relatively poor, mountainous republic bordering Kazakhstan and Mongolia. Altaians are a small people of the Turkic language group, mostly practicing local shamanic cults. Together with the Kumandins (another autochthonous, related ethnic group), the Altai make up 37 percent of the republic’s inhabitants. The share of indigenous peoples tends to grow. In the 2010s, the increase amounted to 2.9 p.p. At the same time, ethnic Russians still numerically dominate in the region (54 percent) and are unlikely to be outnumbered by indigenous peoples until the middle of this century.
Buryatia is a large in territory but small in population (1 million) and poor (GDP 42 percent of the Russian average) republic in Eastern Siberia, bordering Mongolia and Tuva (a republic within the Russian Federation), which are closely related to the Buryats. Buryatia is strategically important because it has access to Lake Baikal, the world’s largest freshwater lake, and two railroads run through the republic, linking the European part of Russia with the Pacific coast. After the collapse of the USSR, the idea of restoring the concept of a single ethnic community, the Buryat-Mongols, became popular among the Buryats. This ethnonym was widely used in the first half of the 20th century, symbolizing the closeness, if not identity, of the two ethnic groups. Numerically, Buryats and related Soyots (peoples among whom Buddhism prevails) are a minority in the population of the republic (33 percent), with a tendency to increase the share of the indigenous peoples (+2.3 p.p.). However, they are almost two times inferior to Russians (64 percent). Also limiting potential aspirations of Buryats to sovereignty is the inconsistency of ethnic borders with the borders of the Republic of Buryatia; only 64 percent of all Buryats in Russia live there. Significant areas of compact residence of Buryats are located in the neighboring “Russian regions”; in the Irkutsk region (80 thousand) and in Zabaykalsky Krai (72 thousand), mainly in the Buryat autonomous districts that existed until 2008.
Republics with medium ethno-demographic potential for the development of separatism
Sakha (Yakutia): Yakuts are the largest indigenous people in the Asian part of Russia, and Sakha, more often called Yakutia, is the largest region of the country with an area of over 3 million km2, with huge mineral reserves, due to which Yakutia has the highest level of per capita GDP among all republics (twice as high as the Russian average), though this is not greatly reflected in the standard of living of the local population. The demographic potential of Yakutia is not large; its population is about 1 million people, among whom ethnic Yakuts make up 53 percent, with a steady trend of growth in the share (+2.8 p.p. in the 2010s). The number of ethnic Russians in the republic is declining, primarily as a result of migration. The fact that 98 percent of all Yakuts in Russia live within their national republic, which is the highest indicator among all republics, increases the ethno-demographic potential for the development of separatist aspirations. However, from the geographical point of view, Yakutia’s sovereignty is hindered by the absence of external borders with other states and other republics of the Russian Federation; Yakutia is separated from the nearest Buryatia by the territories of “Russian regions.”
Kalmykia is the least populous republic in the European part of Russia (less than 300 thousand inhabitants), located between the Volga and the North Caucasus regions. Kalmyks are the only autochthonous ethnic group in Europe that has traditionally practiced Buddhism, and differ significantly anthropologically from both Russians and neighboring peoples of the Caucasus, as Kalmyks are rather related to the peoples of southern Siberia and Mongols. Kalmyks constitute the majority of the republic’s population (63 percent), and their share is rapidly increasing (+5.4 p.p.), primarily due to the outflow of ethnic Russians from this poor region. Kalmyks have a high level of concentration within their republic — 88 percent of all Kalmyks in Russia live there. The memory of the total deportation of the Kalmyks (as well as many other peoples of the neighboring North Caucasus: Chechens, Ingush, Karachays, Balkars, and so on) in the 1940s, which is considered by many as an act of genocide, since up to half of the deported peoples died in the process of deportations and in the first years of life in new places, is also in favor of the development of separatist movement.
North Ossetia-Alania is a small republic with a population of just under 700 thousand people. It has historically been of strategic significance to Russia, as the most important road connecting Russia and the countries of the South Caucasus passes through it. Russia’s colonization of the Caucasus began in Ossetia, when, in the late-18th century, Russia founded the fortress of Vladikavkaz, the republic’s capital. From an ethno-demographic perspective, North Ossetia has become increasingly mono-ethnic in recent decades: Ossetians account for 68 percent of the population, and their share is growing (+3 p.p.), primarily due to the migration outflow of Russians. At the same time, the birth rate among Ossetians is the lowest of the major peoples of Russia (Figure 5), and, therefore, Ossetians are the only indigenous ethnic group in the North Caucasus that has entered the stage of depopulation (Figure 4). From a geopolitical and cultural point of view, the development of separatist sentiments among Ossetians, who are the only Christian indigenous people in the region, is hindered by their relations with neighboring, predominantly Muslim peoples and the unresolved conflict in Georgia. Thus, in the early 1990s, a conflict between Ossetians and Ingush over disputed territories broke out and has remained unregulated to this day; and in 2008, Russia invaded Georgia from North Ossetia, supporting by force the separatist government of South Ossetia and recognizing this part of Georgia as an independent state.
The Karachay-Cherkess and Kabardino-Balkarian republics are good examples of Russia’s colonial policy of creating internal conflicts between Indigenous peoples, which Moscow then “tries to resolve” in the role of an “external arbiter.” These two republics are the only bicomponent republics in Russia, that is, those in which two ethnic groups are declared as “titular” in their very names. However, the most interesting thing is that within each of these republics, Moscow united unrelated ethnic groups. Thus, the Kabardins, Circassians (in Russian, Cherkessy ), and Adygs are considered by many to be one people,Footnote 12 known in the world more commonly as Circassians, and mostly living today in Turkey and the Middle East after their expulsion from the North Caucasus into the Ottoman Empire in the 19th century. In turn, the Karachays are a related ethnic group to the Balkars, also considered by many as one people (both belong to the Turkic language group). In other words, from the point of view of the proximity of ethnic groups, it would be much more logical to create republics with the opposite composition: unite Kabardins with Circassians (and Adygs), and Karachays with Balkars. After the collapse of the USSR, the issue of the restructuring of the republics was regularly raised by the leaders of all four peoples, but it remained unresolved. The most recent national unrest between Kabardins and Balkars broke out in 2018. Thus, if Russia’s power in the Caucasus weakens, these two republics will almost certainly have to undergo a reorganization process. In terms of ethno-demographic trends, the two republics are similar: in Kabardino-Balkaria, “titular” peoples account for 74 percent (+3.5 p.p. over the 2010s); in Karachay-Cherkessia, 65 percent (+4.5 p.p.). Accordingly, the number of Russians is decreasing and in 2021 amounted to 20 percent and 28 percent.
Republics with high ethno-demographic potential for the development of separatism
Tuva formally became part of Russia only in 1944; before that, most of the world considered it part of China. The Tuvans are a rapidly growing people of the Turkic language group, with predominantly shamanic and Buddhist beliefs, closely related to the neighboring Altaians, Khakass, Buryat, and Mongols. Tuva is a mountainous republic located in the very center of Eurasia, sharing a border with Mongolia and other autonomous republics of southern Siberia. The majority of the republic’s population of almost 350 thousand people are Tuvans (88 percent), and their share is growing rapidly (+6.4 p.p.). Ninety-four percent of Russia’s Tuvans live in this republic. The share of ethnic Russians has decreased threefold since the late 1980s and now stands at 10 percent. The extremely poor socio-economic situation in Tuva may also play in favor of separatist sentiments: its per capita GDP is three times lower than the Russian average, and life expectancy is one of the lowest in the country, which is especially contrasting with neighboring Mongolia.
Dagestan is a unique republic, as there is no one predominant ethnic group; it is a peculiar federation of various peoples of the Caspian Caucasus. The largest of them are Avars (971 thousand), Dargins (529 thousand), Kumyks (504 thousand), and Lezgins (424 thousand). Almost all autochthonous groups predominantly profess Islam. Ethnic Russians account for only 3 percent or 104 thousand people, having decreased threefold in the post-Soviet period. Dagestan is one of the largest republics in terms of population, 3.2 million people, and the growth in the number of its people is one of the fastest in Russia (Figure 4). At the same time, Dagestan, like the other North Caucasus republics, is poor; per capita GDP is only 31 percent of the Russian average. An obvious obstacle to independence is Dagestan’s ethnic mosaicism, which Moscow can use to maintain its control over the region. At the same time, no significant inter-ethnic conflicts (even of the level of “identity wars” between Bashkirs and Tatars in Bashkortostan) have been observed in Dagestan in recent decades.
Ingushetia is the smallest in area, but the most densely populated republic in Russia, with a rapidly growing population (over 500 thousand inhabitants). In addition, Ingushetia is the poorest region in Russia, with GDP per capita almost six times lower than the Russian average. The Ingush are closely related to neighboring Chechens and are predominantly Muslim. The Ingush are also the fastest-growing Indigenous people in Russia (Figure 4), and their share in the republic’s population has reached 96 percent. The share of Russians is the lowest in the country and amounts to only 0.7 percent. The main impediment to the sovereignty of Ingushetia is unresolved territorial disputes with its neighbors (as in virtually the entire North Caucasus), especially acute relations with Ossetia, despite ethno-cultural closeness with Chechnya. For example, in 2018, Ingushetia witnessed mass protests caused by territorial concessions made by the republic’s leadership in favor of Chechnya.
Chechnya has the highest chances of gaining independence in the future of all the republics within Russia. From the ethno-demographic point of view, Chechnya is one of the largest in terms of population (over 1.5 million people, 4th place among the republics), but unlike, for instance, Tatarstan and Bashkortostan, the share of “the titular” people in Chechnya is 96 percent, and unlike Dagestan, Chechnya is monoethnic. The share of Russians is only 1 percent. In addition, Chechens are one of the fastest-growing peoples in Russia (17 percent growth in the 2010s) and are concentrated mainly in their republic (86 percent). In terms of other factors — political, historical, geographical, and cultural — Chechnya also has all the prerequisites for a relatively easy secession from Russia. Chechens have known almost two centuries of struggle against Russian imperialism: fierce resistance to the conquest in the 19th century, the deportation of Chechens and the liquidation of their republic in 1944, the two bloody wars of the 1990s and 2000s for independence; these are only the main milestones in Chechen relations with Russia. The regime of Ramzan Kadyrov established in Chechnya in its relations with Moscow also resembles medieval relations of nominal vassalage rather than relations between a federal constituent entity and the federal government (unlike the other Russian republics, whose autonomy has been virtually reduced to zero during Putin’s rule). Chechnya has effectively fallen out of the Russian legal framework. For example, Chechnya is the only region that has its own armed forces, which are only nominally part of the Russian forces, but in fact subordinate to Kadyrov personally. Russian public opinion largely no longer perceives Chechnya (and more broadly the entire North Caucasus) as part of Russia. In 2013, Lev Gudkov, head of the Levada Center, Russia’s main independent sociological service, noted that more than half of Russia’s citizens support Chechnya’s secession to a greater or lesser extent.Footnote 13
Conclusions
The current ratio of Russians as an ethnic majority to ethnic minorities is broadly in line with a long-term, roughly eighty-year balance, during which the Russian share of the country’s population was 80–83 percent. At the same time, the number of different peoples has fluctuated greatly, also due to state policies (genocides, deportations, assimilation). Thus, over the last hundred years, “the European” peoples (Ukrainians, Belarusians, Germans, and so on) and the peoples of the Finno-Ugric language group have suffered the most severe reduction. And in the last two decades, broad assimilation processes began to spread to the large Turkic peoples of the Volga region (Tatars and Chuvashs). By contrast, the greatest increase in the period after World War 2 is characteristic of the North Caucasian and Siberian peoples.
Ethno-demographic dynamics in Russia is largely determined by assimilation factors, including forced assimilation and “mimicry.” For instance, the analysis of the birth rate among the largest peoples of the country has shown that there is no correlation between the birth rate and the overall dynamics of ethnic groups, while the level of linguistic Russification determines the number of people to a much greater extent.
Ethno-territorial trends of the 2000s and 2010s show that Russia is experiencing a certain ethnic separation: “Russian” regions are becoming even more “Russian,” while the national republics of the North Caucasus and Siberia are getting more and more “non-Russian.” Many of these republics already have high ethno-demographic potential for secession from Russia (Chechnya, Ingushetia, Dagestan, Tuva). At the same time, a number of republics (primarily Finno-Ugric peoples) are threatened by further rapid depopulation of indigenous ethnic groups, which will sooner or later give Moscow the opportunity to abolish their national status.
The main obstacle to the independence of national republics is not even the presence of large ethnically Russian communities in many of them, but rather territorial disputes with their neighbors, because the borders of the republics, as a rule, do not correspond to ethnic boundaries. There is every reason to believe that this delimitation of borders back in the Soviet period was carried out by Moscow on purpose, to minimize the likelihood of secession.Footnote 14 It is precisely the fear of intensifying ethnic conflicts that prevents the development of separatist sentiments, especially in the Caucasus (O’Loughlin and Ó Tuathail Reference O’Loughlin and Tuathail2009). However, the vast majority of republics (17 out of 21) form three geographical areas within which they border each other: the North Caucasus, the Volga region, and South Siberia (Figure 8). Accordingly, a way out of the inevitable territorial disputes and conflicts in the event of Russia’s disintegration and the republics gaining sovereignty could be the creation of some kind of federations of indigenous peoples in these zones, following the model already relatively successfully implemented in Dagestan (the only “supranational national” republic). In the Volga region in the first half of the 20th century, there was already an idea of a kind of federation of peoples, the Idel-Ural State (Zaynutdinov, Reference Zaynutdinov2023). In such a scenario, the republics could guarantee the rights of ethnic minorities without raising the issue of changing each other’s borders.
It should also be taken into account that the entire population of the national republics is only about one sixth of the population of the Russian Federation (25 million out of 145), and the vast majority of the republics are economically backward: only three of them have a level of economic development higher than the Russian average (Yakutia, Komi, Tatarstan), and in 14 (out of 21) the level of per capita GDP is more than twice lower than the Russian average. In other words, the potential secession of national republics is complicated by the dependence of their budgets on Moscow. In any case, the increasing nationalist rhetoric, the systematic restriction of ethnic minority rights, and the disproportionate involvement of these minorities in Russia’s recent military campaigns stand in contradiction to the neo-imperialist project that the Putin regime seeks to build. Rather than reinforcing the cohesion of the state, these policies deepen internal fractures and heighten the risk of future fragmentation. As demonstrated earlier, current ethno-demographic trends only reinforce these centrifugal dynamics and may ultimately undermine the territorial integrity of the Russian Federation.
Disclosure
None.

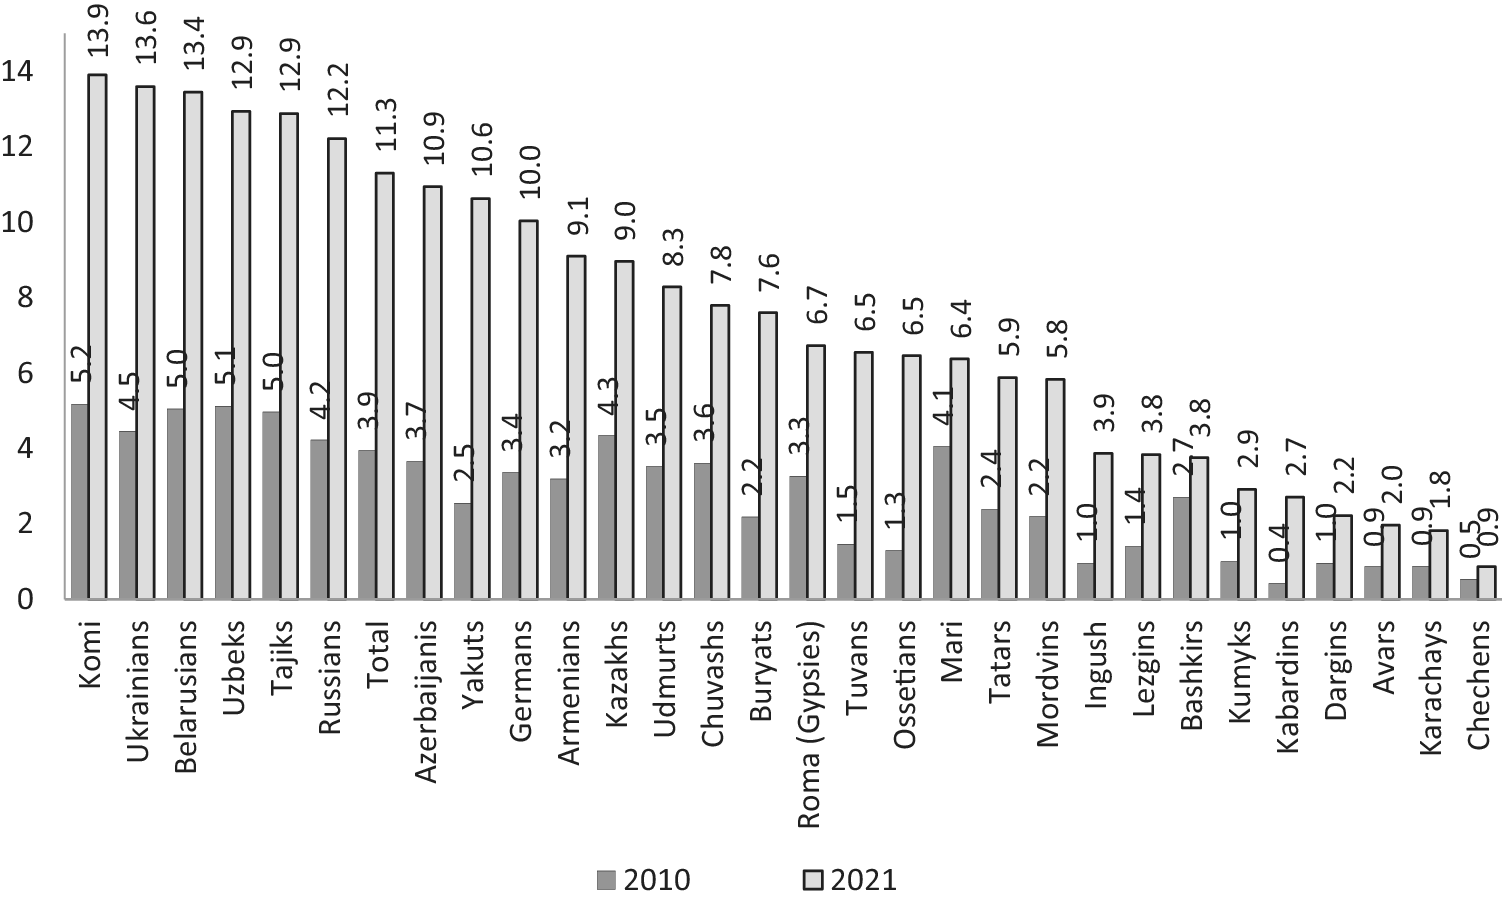
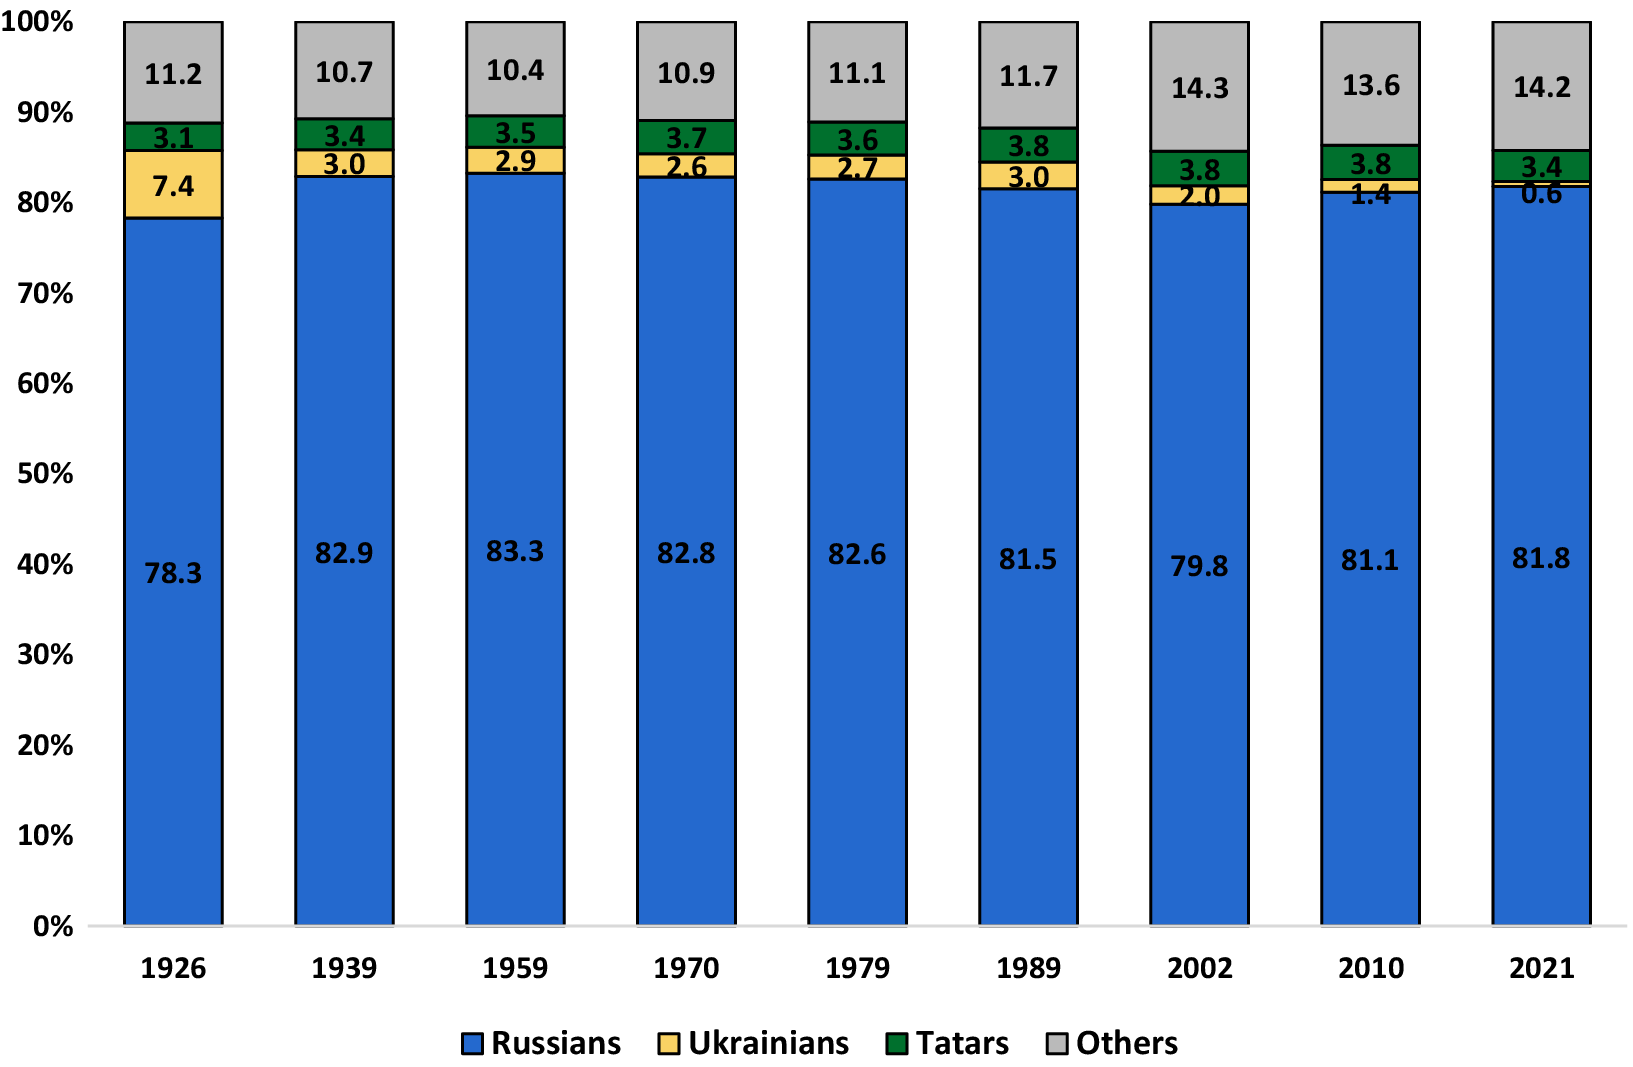
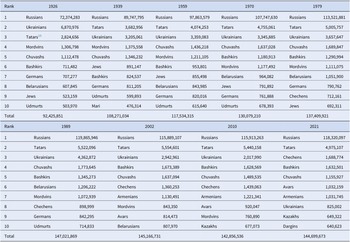
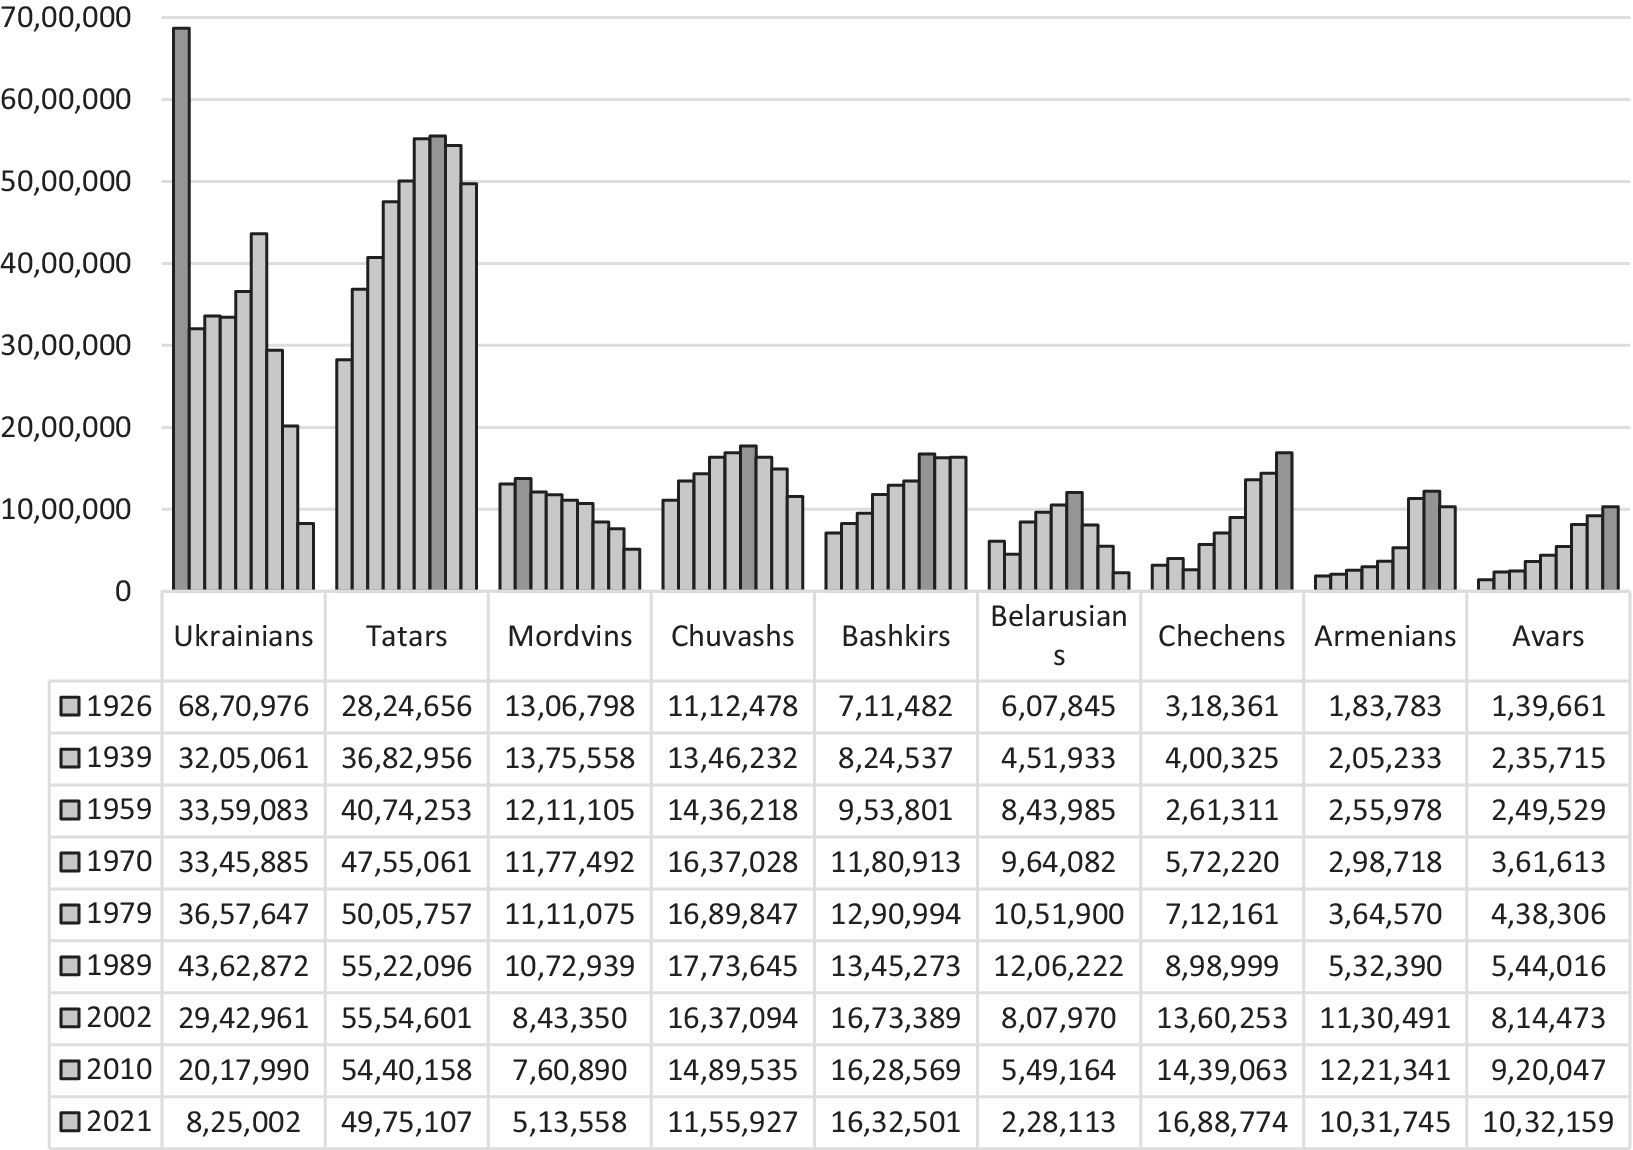
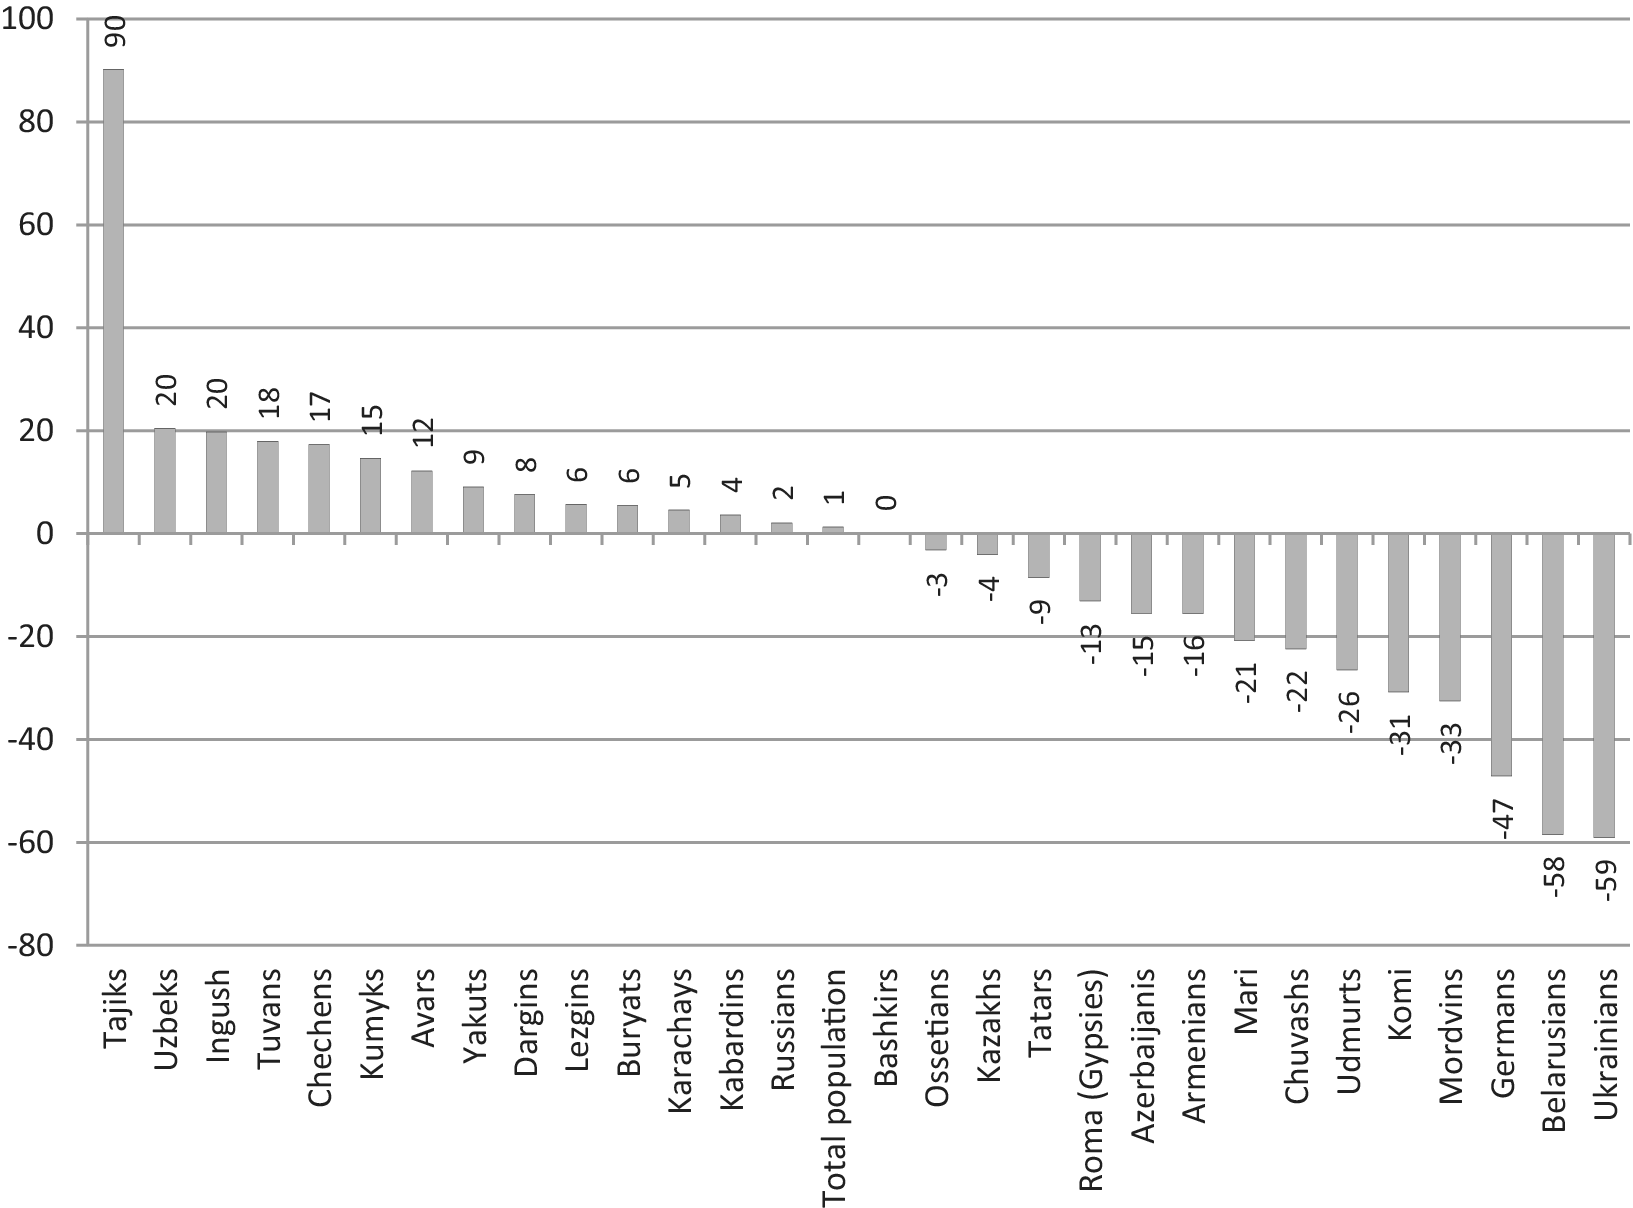
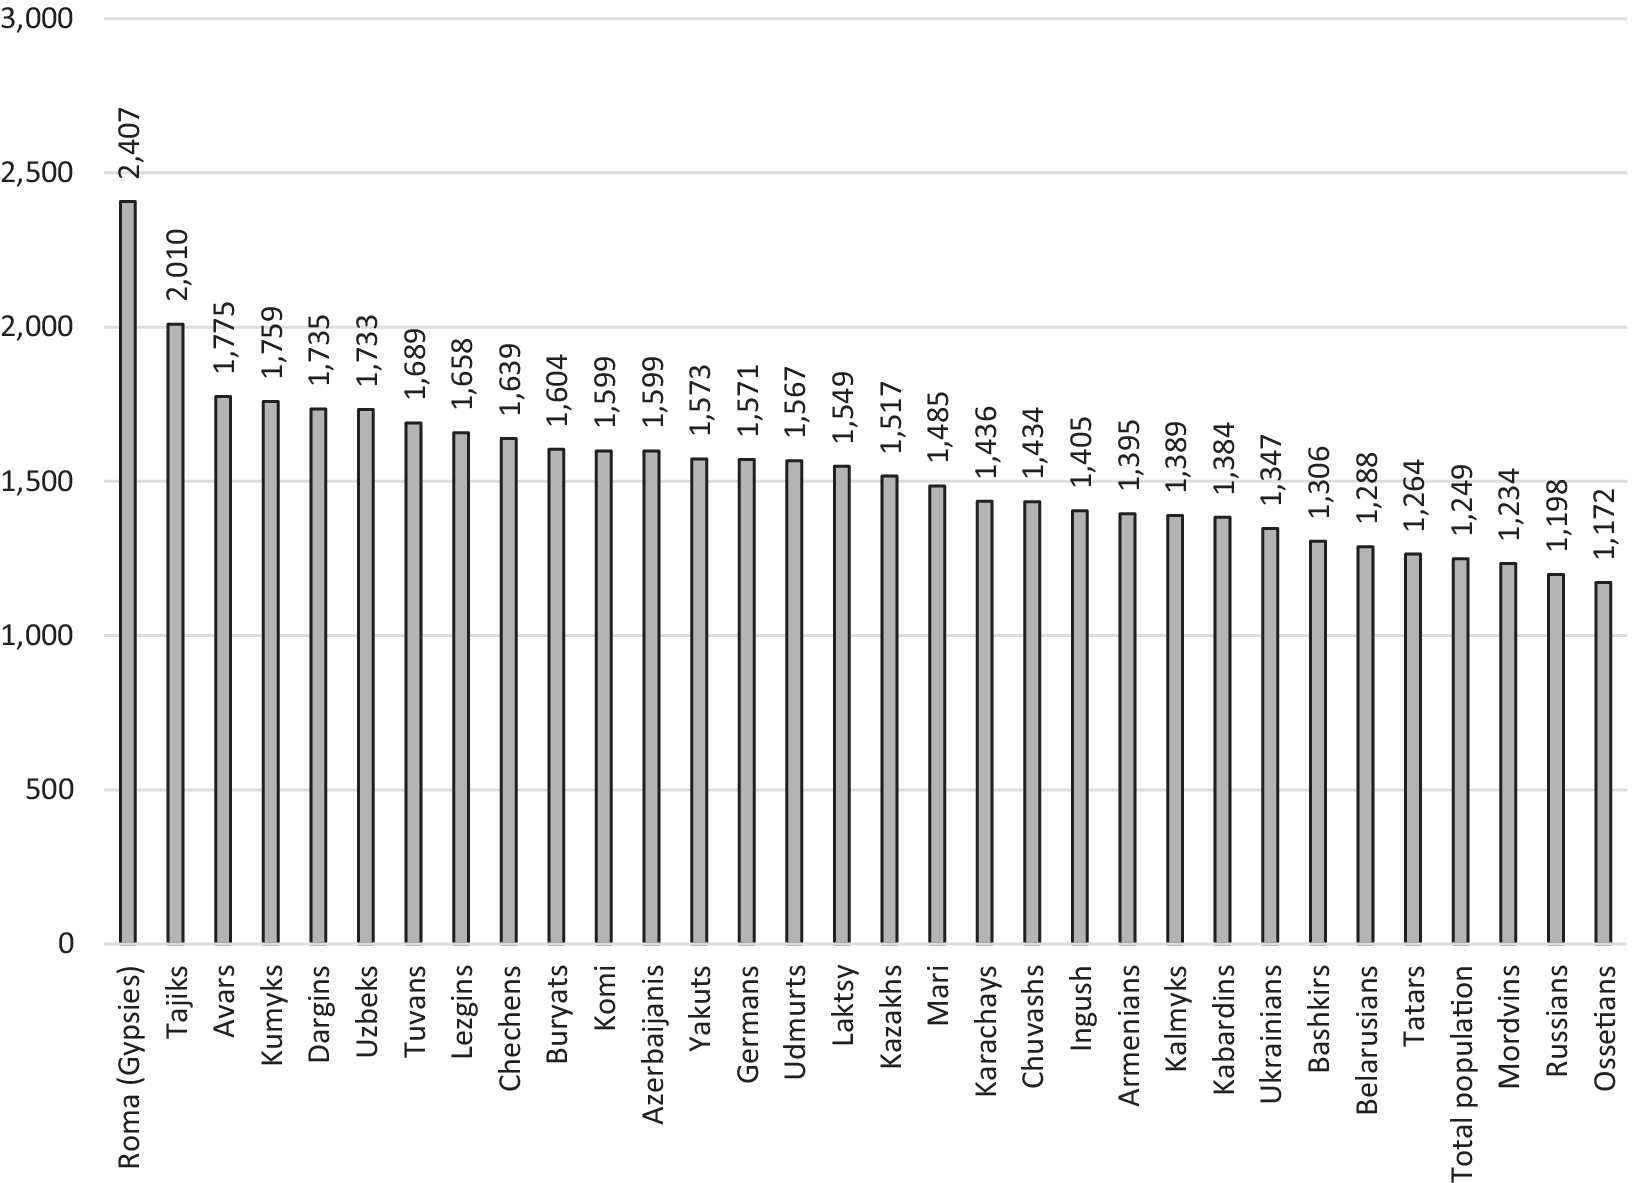
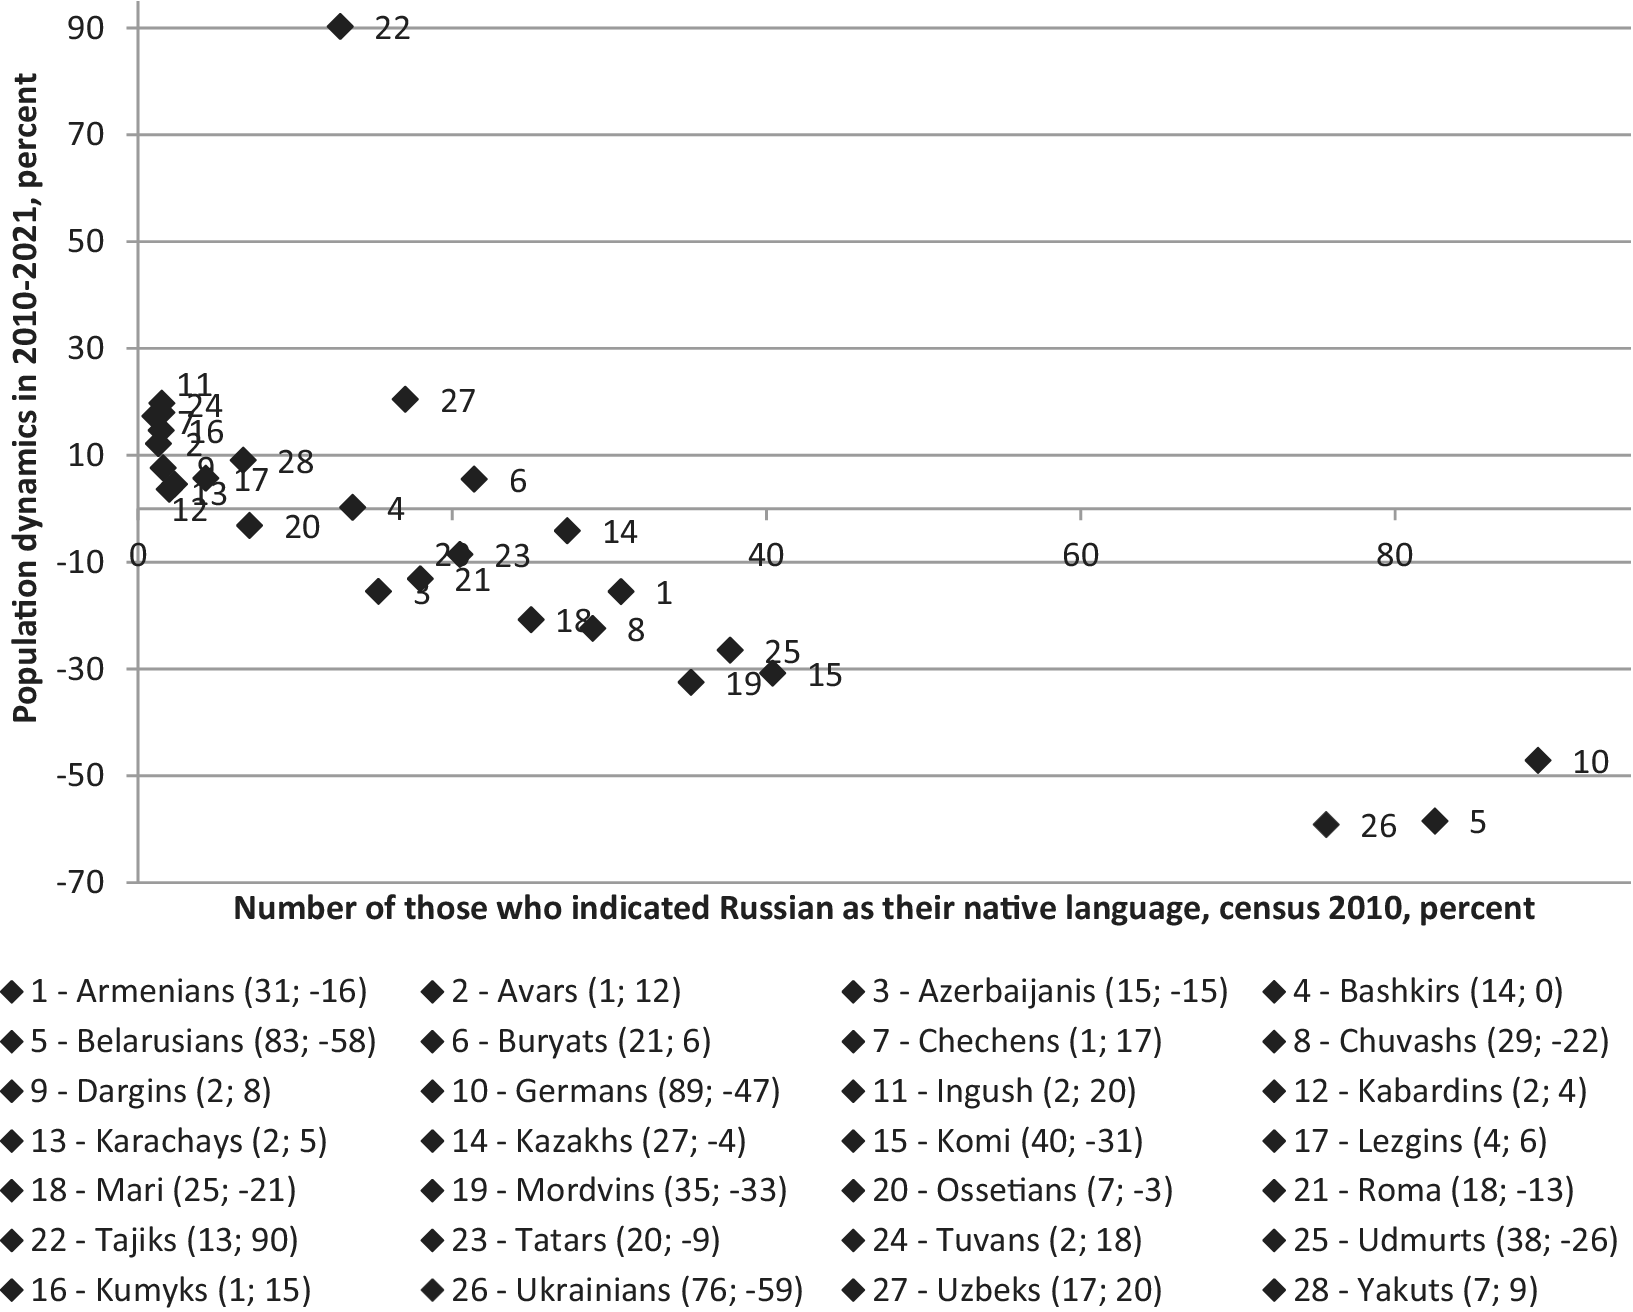
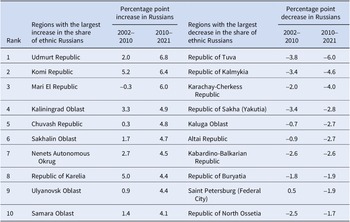
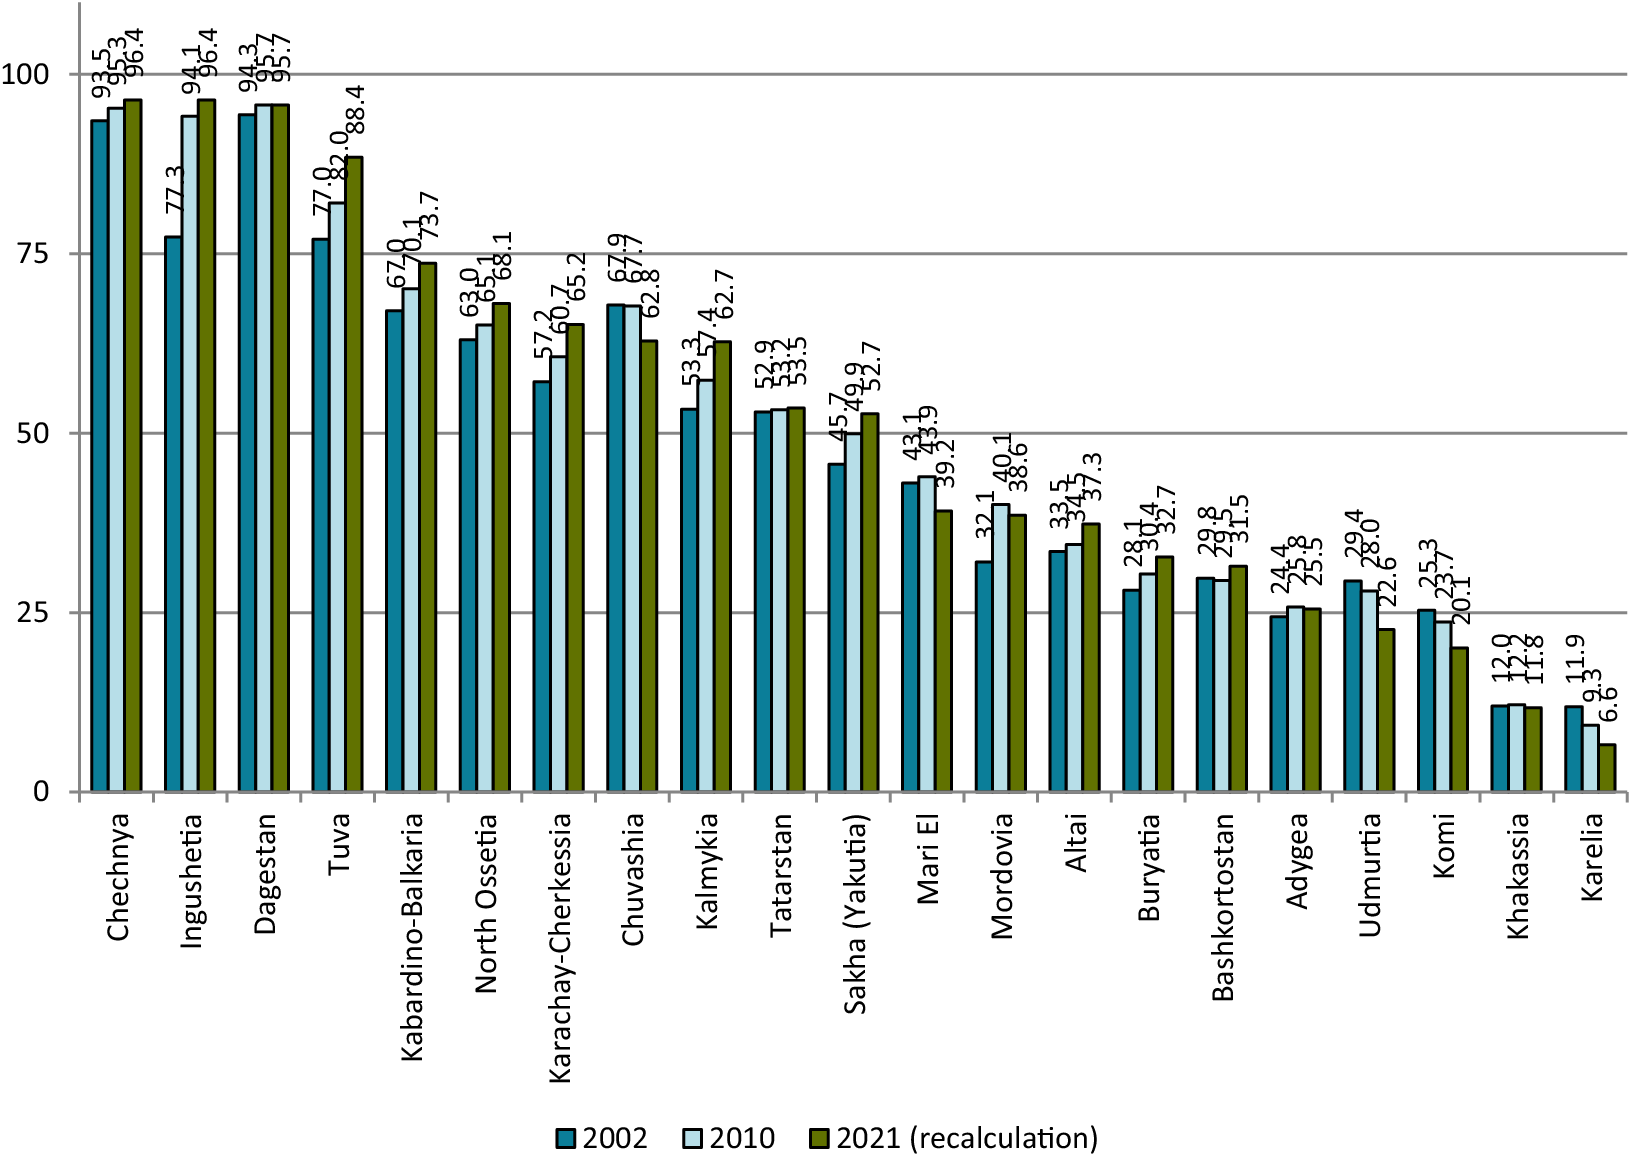

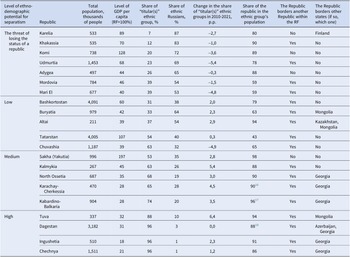


 Open access

