





Introduction
Post-traumatic stress disorder (PTSD) is a severe psychological disorder arising typically following exposure to traumatic events. Its core features are specific traumatic event-related recurrent experiences of memories, avoidance of trauma-related cues, negative alterations in cognition and mood, and hypervigilance (American Psychiatric Association, 2022). The lifetime prevalence of PTSD is ~6% worldwide, higher following severe traumas such as violent conflicts or sexual assaults (Koenen et al., Reference Koenen, Ratanatharathorn, Ng, McLaughlin, Bromet, Stein and Kessler2017). With the increasing global incidence of traumatic events, including the COVID-19 pandemic, social unrest, and climate change, the burden of PTSD in the civilian population has risen significantly (Schincariol et al., Reference Schincariol, Orrù, Otgaar, Sartori and Scarpazza2024). Despite its profound public health impact, the neurobiological mechanisms underlying PTSD remain incompletely understood.
Neuroimaging studies have helped throw light on PTSD-related brain alterations. Functional magnetic resonance imaging (fMRI) studies probing brain network topology in PTSD have shown a shift from a random or regular configuration to more small-world network properties, with increased centrality in the default mode network (DMN) and the salience network (Lei et al., Reference Lei, Li, Li, Chen, Huang, Lui and Gong2015), and abnormal connectivity patterns both within and between networks (Kearney & Lanius, Reference Kearney and Lanius2024; Zhang et al., Reference Zhang, Liu, Chen, Li, Duan, Xie and Chen2015; Zhu et al., Reference Zhu, Li, Yuan, Ren, Yuan, Meng and Zhang2019). Structural studies using diffusion tensor imaging (DTI) in PTSD have shown white matter microstructural anomalies such as higher white matter integrity in the inferior fronto-occipital fasciculus and inferior temporal gyrus (Ju et al., Reference Ju, Ou, Su, Averill, Liu, Wang and Abdallah2020), and lower fractional anisotropy in the uncinate fasciculus, cingulum bundle (O’Doherty et al., Reference O’Doherty, Ryder, Paquola, Tickell, Chan, Hermens and Lagopoulos2018), and tapetum region of the corpus callosum (Dennis et al., Reference Dennis, Disner, Fani, Salminen, Logue, Clarke and Morey2021). These findings suggest that PTSD neuropathology involves widespread neural network disruptions across regions and modalities, rather than focal variations (Akiki, Averill, & Abdallah, Reference Akiki, Averill and Abdallah2017; Zhang et al., Reference Zhang, Hu, Yu, Zhou, Sun, Qi and Zhu2025). However, single-modality techniques, structural or functional, have limited ability to characterize the interplay between brain structure and function (Mount & Monje, Reference Mount and Monje2017). Studies to date exploring multimodal approaches to characterizing and assessing PTSD (Abdallah et al., Reference Abdallah, Wrocklage, Averill, Akiki, Schweinsburg, Roy and Scott2017; Nkrumah et al., Reference Nkrumah, Demirakca, von Schröder, Zehirlioglu, Valencia, Grauduszus and Ende2024; Zhang et al., Reference Zhang, Wu, Zhu, He, Huang, Zhang and Zhang2016; Zhu et al., Reference Zhu, Suarez-Jimenez, Zilcha-Mano, Lazarov, Arnon, Lowell and Neria2021) have not integrated multimodal information to define the patterns of structure–function coupling (SFC) needed for a holistic understanding of brain information processing.
SFC analysis is a powerful tool for multimodal integration (Calhoun & Sui, Reference Calhoun and Sui2016) which can quantify how structural connectivity supports coordinated neural activity fluctuations, providing a coherent framework for describing multiscale brain reorganization (Baum et al., Reference Baum, Cui, Roalf, Ciric, Betzel, Larsen and Satterthwaite2020). It can be implemented in three main ways: the correlational, harmonic analysis, and modeling approaches (Fotiadis et al., Reference Fotiadis, Parkes, Davis, Satterthwaite, Shinohara and Bassett2024). The stability of this integrated architecture crucially underpins the organization and coordination of brain function, and perturbations in SFC have been identified in neurological and psychiatric disorders such as epilepsy (Zhang et al., Reference Zhang, Liao, Chen, Mantini, Ding, Xu and Lu2011), Parkinson’s disease (Zarkali et al., Reference Zarkali, McColgan, Leyland, Lees, Rees and Weil2021), bipolar disorder (Collin et al., Reference Collin, Scholtens, Kahn, Hillegers and van den Heuvel2017), and schizophrenia (Jiang et al., Reference Jiang, Duan, Li, Huang, Zhao, Li and Luo2021). SFC is also related to variations in cognitive flexibility (Medaglia et al., Reference Medaglia, Huang, Karuza, Kelkar, Thompson-Schill, Ribeiro and Bassett2018) and general intelligence (Feng et al., Reference Feng, Wang, Huang, Chen, Cheng and Shu2024). SFC is therefore a promising approach to identifying unique brain abnormalities in PTSD.
To understand the pathophysiology of SFC abnormalities, we must relate macroscopic imaging findings to microscopic biological features. The biological rationale for this multilevel integration is compelling: genes play a major role in shaping network connections (Arnatkeviciute et al., Reference Arnatkeviciute, Fulcher, Oldham, Tiego, Paquola, Gerring and Fornito2021), as do the complex neurotransmitter interactions of diverse neural cell types; we can therefore expect all these to influence the regional distribution of SFC (Allen & Lyons, Reference Allen and Lyons2018; Wang, Reference Wang2020; Zilles & Palomero-Gallagher, Reference Zilles and Palomero-Gallagher2017). Previous studies in PTSD have confirmed its genetic susceptibility (Duncan et al., Reference Duncan, Ratanatharathorn, Aiello, Almli, Amstadter, Ashley-Koch and Koenen2018), and linked its pathophysiology to mitochondrial dysfunction (Lushchak, Strilbytska, Koliada, & Storey, Reference Lushchak, Strilbytska, Koliada and Storey2023) and neurotransmitter dysregulation (Traina & Tuszynski, Reference Traina and Tuszynski2023). However, there remains a critical gap in our understanding of the relationship between structural–functional network alterations in PTSD and regional molecular architecture and gene expression profiles.
This study aims to fill this gap. As summarized in Figure 1, we studied 61 PTSD patients and 62 trauma-exposed non-PTSD controls (TENC) recruited from earthquake survivors. Based on structural connectivity networks (SCNs) and functional connectivity networks (FCN) derived from multimodal MRI data, we used Laplacian eigenmode mapping to identify distinctive SFC alterations in PTSD, then explored their associations with clinical characteristics, regional molecular architecture and transcriptional profiles. We tested three hypotheses: that SFC exhibits a hierarchical organization, with PTSD patients showing regional deviations in SFC relative to TENC; that these SFC alterations correlate significantly with symptom severity as assessed by standardized PTSD scales; and that these SFC alterations correlate with relevant biological factors, including colocalization and gene expression levels.
Study workflow. (a) Participant and scanning workflow: participants enrolled by survey had checklist assessment and clinical diagnosis; eligible subjects, classified as PTSD patients and trauma-exposed non-PTSD controls (TENC), went on to multimodal MRI scanning; MRI data preprocessing used containerized pipelines. (b) Connectivity and structure–function coupling (SFC) analysis: after 152-region parcellation, structural connectivity (SC) and functional connectivity (FC) matrices were constructed for each subject (sub 1, 2…n) from diffusion tensor imaging (DTI) and functional MRI (fMRI) data, respectively; then SFC was calculated by an eigenmode-mapping approach. (c) SFC annotation and analysis: various neurotransmitter, cell-type, and mitochondria maps were used to explore the spatial biological correlations of SFC; with gene lists from Allen Human Brain Atlas (AHBA), partial least squares regression (PLS) was used to identify SFC-related genes; enrichment analysis with Gene Ontology (GO), and Kyoto Encyclopedia of Genes and Genomes (KEGG) was used to identify relevant pathways.

Figure 1. Long description
The flowchart is divided into three sections labeled A, B, and C.
Panel A, Participant and scanning workflow, starts at the top with a Checklist plus Diagnosis icon. An arrow points down to two groups of people icons: P T S D, N equals 61, and T E N C, N equals 62. A downward arrow leads to a T 1 plus B O L D plus D T I Scanning icon. The final step at the bottom shows three brain scan cross-sections labeled Preprocessing.
Panel B, Connectivity and structure-function coupling analysis, begins with two brain imaging types on the left: D T I and f M R I. Arrows from both point to a central Atlas with 152 regions. From the Atlas, arrows point right to two sets of heatmaps: S C matrices and F C matrices, each labeled sub 1, sub 2, through sub n. A large arrow labeled Eigenmode mapping points from these matrices to a vertical bar chart representing S F C for each subject.
Panel C, S F C annotation and analysis, features a central brain model labeled Group difference. Above it, three biological maps labeled Cell type, Neurotransmitter, and Mitochondria are linked to S F C via a double-headed arrow labeled Spatial correlation. Below the brain model, a large matrix labeled A H B A with 152 regions and 15677 genes is linked via an arrow labeled P L S. This leads to a final step labeled Enrichment analysis, which points to a dot plot representing G O and K E G G pathways.
Methods
Figure 1a summarizes participant recruitment and testing, MR imaging and MRI data preprocessing. We describe these in turn.
Participant recruitment and testing
Participants were enrolled in January–August 2009 from survivors of the May 2008 earthquake in Sichuan Province of China. Subjects scoring ≥35 on screening with the PTSD Checklist (PCL) (Weathers et al., Reference Weathers, Litz, Herman, Huska and Keane1993) were assessed with the Clinician-Administered PTSD Scale (CAPS) (Blake et al., Reference Blake, Weathers, Nagy, Kaloupek, Gusman, Charney and Keane1995), before the Structured Clinical Interview for Diagnostic and Statistical Manual of Mental Disorders, Fourth Edition was used to confirm the PTSD diagnosis and exclude psychiatric comorbidities (First, Spitzer, Gibbon, & Williams, Reference First, Spitzer, Gibbon and Williams1994). Survivors without PTSD but with PCL scores <35 were considered as TENC. This cohort, exposed to a common traumatic event, provides a valuable real-world context for studying trauma-related brain changes with relatively little trauma heterogeneity. Details of inclusion/exclusion criteria and evaluation are given in Supplementary Methods 1. This study was approved by the Research Ethics Committee of the West China Hospital of Sichuan University, and all subjects provided written informed consent.
The demographic and clinical data were analyzed using SPSS (v. 26.0, www.spss.com, IBM Corp., USA), with independent-sample t test for age, education, time since trauma, and PCL scores, and χ2 test for sex; p < 0.05 was taken as statistically significant.
MRI data acquisition
Details of imaging acquisition are given in Supplementary Methods 2. In brief, high-resolution T1-weighted (T1w) images, resting-state blood oxygen level-dependent fMRI (rs-BOLD-fMRI) and DTI data were acquired using a 3 Tesla MRI scanner (EXCITE, General Electric, USA) with an eight-channel phased array head coil. Foam pads were used to reduce head motion and scanner noise, and participants were instructed to remain awake with their eyes closed during the scanning. The quality of all acquired images was evaluated by two experienced neuroradiologists.
MRI data preprocessing
Details of preprocessing are given in Supplementary Methods 3 and 4. In brief, images were first collated into Brain Imaging Data Structure format.
Functional (rs-BOLD-fMRI) data were preprocessed using fMRIPrep (v. 23.1.4, https://codeocean.com/capsule/3568017/tree) (Esteban et al., Reference Esteban, Markiewicz, Blair, Moodie, Isik, Erramuzpe and Gorgolewski2019) with the following steps (Supplementary Methods 3): intensity nonuniformity correction, fuse and conform, skull stripping, spatial normalization, brain tissue segmentation, surface reconstruction for T1w images and generating the BOLD reference mask, head-motion estimation, susceptibility distortion correction, alignment to T1w reference, resampling for BOLD data. Then XCP-D (v. 0.6.0rc6, https://github.com/PennLINC/xcp_d.git) (Mehta et al., Reference Mehta, Salo, Madison, Adebimpe, Bassett, Bertolero and Satterthwaite2023), was used for high-motion exclusion, regression of nuisance covariates, despiking, band-pass filtering (0.01–0.08 Hz), and smoothing with a Gaussian kernel (FWHM 6.0 mm).
DTI data were processed using QSIPrep (v. 0.19.1, https://github.com/PennLINC/qsiprep.git) (Cieslak et al., Reference Cieslak, Cook, He, Yeh, Dhollander, Adebimpe and Satterthwaite2021) in the following steps (Supplemental Methods 4): conform image and gradient orientation, group by distortion, denoising, distortion correction, head-motion correction, build subject B0 template, registration and normalization, and fiber reconstruction. These containerized pipelines automatically configure appropriate preprocessing workflows based on the data used (Gorgolewski et al., Reference Gorgolewski, Auer, Calhoun, Craddock, Das, Duff and Poldrack2016), providing a unified and robust platform for best practice.
Figure 1b summarizes the construction of the functional and structural networks, and analysis of structural–functional coupling. We describe these in turn.
FCN construction
The FCN for each subject was constructed from the preprocessed rs-BOLD-fMRI data. The whole brain was divided into 152 regions of interest (ROI), according to the Schaefer 100 atlas (Schaefer et al., Reference Schaefer, Kong, Gordon, Laumann, Zuo, Holmes and Yeo2018) supplemented with subcortical structures and cerebellum (King et al., Reference King, Hernandez-Castillo, Poldrack, Ivry and Diedrichsen2019; Najdenovska et al., Reference Najdenovska, Alemán-Gómez, Battistella, Descoteaux, Hagmann, Jacquemont and Bach Cuadra2018; Pauli, Nili, & Tyszka, Reference Pauli, Nili and Tyszka2018) (Supplemental Table S1), each forming a node of the matrix. These ROIs were assigned to functional modules: these were Yeo’s seven networks (Yeo et al., Reference Yeo, Krienen, Sepulcre, Sabuncu, Lashkari, Hollinshead and Buckner2011) (DMN, visual network [VN], frontoparietal control network [FPN], limbic network, dorsal attention network [DAN], ventral attention network [VAN], and sensorimotor network [SMN]), together with the subcortical area (SUB) and cerebellum region (CE). The averaged BOLD signals of all voxels within an ROI were defined as the value of that node; the Pearson correlation between all pairs of nodes were calculated (with Fisher’s Z-transformation to improve normality); and the normalized correlation coefficients were defined as the weights of FC (as their interpretation is controversial, negative FC were set to zero (Schwarz & McGonigle, Reference Schwarz and McGonigle2011; Smith et al., Reference Smith, Nichols, Vidaurre, Winkler, Behrens, Glasser and Miller2025b). This yielded a 152 × 152 whole-brain FC matrix for each subject.
SCN construction
The SCN for each subject was constructed from the preprocessed DTI data. After parcellation with the same atlas as for FC, the intensities of SC were defined as the number of streamlines between each pair of nodes, and each streamline was weighted to reduce fiber-tracking and region volume variability biases using the SIFT and invnodevol algorithms (R. E. Smith, Tournier, Calamante, & Connelly, Reference Smith, Tournier, Calamante and Connelly2025). We used a consistency-based threshold to reduce the effect of spurious connectivities by measuring the coefficient of variation (CV) across subjects (Roberts et al., Reference Roberts, Perry, Roberts, Mitchell and Breakspear2017), removing the top 25% of SC with the largest CV (Baum et al., Reference Baum, Cui, Roalf, Ciric, Betzel, Larsen and Satterthwaite2020). Reasoning that interregional physiological efficacies would not span a large range, we resampled the retained SC to a Gaussian distribution (mean 0.5, standard deviation 0.1) (Honey et al., Reference Honey, Sporns, Cammoun, Gigandet, Thiran, Meuli and Hagmann2009). This yielded a 152 × 152 whole-brain SC matrix for each subject. We performed a sensitivity analysis to evaluate the influence on our results of the specific choice of consistency-based thresholding and resampling preprocessing (Supplementary Figure S1).
SFC analysis
SFC calculation used an eigenmode-mapping approach of proven reliability and interpretability (Facca, Del Felice, & Bertoldo, Reference Facca, Del Felice and Bertoldo2024; Yang et al., Reference Yang, Zheng, Liu, Zheng, Zhen, Zheng and Tang2023). We performed Laplacian eigendecomposition on the normalized Laplacian matrix of each constructed SCN to obtain eigenvalue-eigenvector pairs, which were sorted in ascending order of eigenvalue. Following previous studies (Facca, Del Felice, & Bertoldo, Reference Facca, Del Felice and Bertoldo2024; Medaglia et al., Reference Medaglia, Huang, Karuza, Kelkar, Thompson-Schill, Ribeiro and Bassett2018), we used a weighted sum of the top 10 low-frequency eigenmodes for each node to predict the nodal FC profile in a multilinear regression. SFC for each node is then defined as the coefficient of determination (R2) between the fitted FC and the empirical FC. We performed a sensitivity analysis to evaluate the influence on our results of the specific eigenmode choice (Supplementary Figure S2).
To compare SFC between PTSD and TENC, we calculated the mean between-group SFC difference for each node to generate a mean-difference map. To test whether these group differences could occur by chance, we randomly reassigned all the values into two groups and rebuilt the mean-difference maps between these, repeated 10,000 times, with α = 0.05 for a two-tailed test. We used age, gender, and years of education as covariates to reduce confounding, and FDR correction (p < 0.05) for multiple comparisons. We also conducted correlation analyses between SFC across all ROIs in the PTSD group and the corresponding CAPS scores using Pearson partial correlation analysis, with age, gender, and years of education included as covariates. Statistical significance was set at p < 0.05 after FDR correction.
Figure 1c summarizes spatial correlation analysis and partial least squares (PLS) analysis of genetic data. We describe these in turn.
Colocalization of SFC patterns and brain tissue biological properties
To explore how the spatial patterns of SFC might be explained by the spatial distributions of underlying neurobiology, we performed spatial correlations between SFC and maps of a number of aspects of molecular, genetic, biochemical, and physiological architecture using JuSpace (v. 2.0, https://github.com/juryxy/JuSpace.git) (Dukart et al., Reference Dukart, Holiga, Rullmann, Lanzenberger, Hawkins, Mehta and Eickhoff2021), a toolbox allowing cross-modal spatial correlation of MRI-based measures with the distribution of biologically interpretable tissue properties. Details of the maps used are given in Supplemental Table S2. They include: neurotransmitter systems (dopamine, noradrenaline, serotonin, acetylcholine, glutamate, γ-aminobutyric acid (GABA), cannabinoid, and opioid) derived from positron emission tomography or single-photon emission computed tomography; cell-type maps for glia and neurons identified from single-nucleus RNA sequencing studies, extracting Allen Human Brain Atlas (AHBA) mRNA expression values for each cell-type marker gene (Lotter et al., Reference Lotter, Saberi, Hansen, Misic, Paquola, Barker and Dukart2024); cerebral blood flow profiles captured by arterial spin-labeling MRI (Holiga et al., Reference Holiga, Sambataro, Luzy, Greig, Sarkar, Renken and Dukart2018); and brain mitochondrial respiratory capacity (Mosharov et al., Reference Mosharov, Rosenberg, Monzel, Osto, Stiles, Rosoklija and Picard2025).
For each of these spatial correlation exercises, we calculated Spearman correlation coefficient between intergroup SFC alterations and the relevant map, computing exact permutation-based p values (with 10,000 permutations) with partial-volume-effect correction using T1 probabilities to test for significant difference from the null distribution. All analyses were corrected using FDR at p < 0.05. Preliminary correlation analyses revealed only a limited number of associations, consistent with the idea that the spatial distribution of molecular architecture represents stable organizational constraints rather than disease-specific drivers. We therefore further examined spatial correlations between the PTSD/TENC group-mean SFC and molecular maps using the same method.
Relation of cortical gene expression to SFC alterations
To investigate the transcriptional basis of regional SFC changes, we assessed their association with the gene expression map using PLS regression analysis (Abdi & Williams, Reference Abdi and Williams2013). Details are given in Supplemental Methods 5. In brief, brain-wide microarray expression data obtained from AHBA (https://human.brain-map.org) (Hawrylycz et al., Reference Hawrylycz, Lein, Guillozet-Bongaarts, Shen, Ng, Miller and Jones2012) by abagen (v. 0.1.4 + 15.gdc4a007; https://github.com/rmarkello/abagen) (Markello et al., Reference Markello, Arnatkeviciute, Poline, Fulcher, Fornito and Misic2021) were used to predict the between-group SFC differences. After verification, the second component of the PLS regression (PLS2), a linear combination of gene expression values most significantly correlated with regional SFC alterations, was used for further analysis. The spin test with 10,000 random rotations was performed to assess the significance of PLS2 to control for spatial autocorrelation (Burt et al., Reference Burt, Helmer, Shinn, Anticevic and Murray2020), then the PLS2 weight of each gene was evaluated for variability with 10,000 bootstrap replications, and a z-score used to rank each gene’s contribution to PLS2 was computed as the ratio of its PLS2 weight to bootstrap standard error. Only genes with FDR p < 0.05 were considered significant. This yielded two lists of genes: those with a significant positive correlation with regional SFC changes (PLS2+), and those with a significant negative correlation (PLS2-).
Enrichment analysis of SFC-associated genes
Enrichment analyses were performed for significantly SFC-correlated PLS2 genes using clusterProfiler (v. 4.16.0; https://git.bioconductor.org/packages/clusterProfiler) (Yu, Wang, Han, & He, Reference Yu, Wang, Han and He2012). Gene Ontology (GO) analysis helped determine biological functions, divided into molecular functions (MFs), biological processes (BP), and cellular components (CCs) (Thomas et al., Reference Thomas, Ebert, Muruganujan, Mushayahama, Albou and Mi2022). The Kyoto Encyclopedia of Genes and Genomes (KEGG) was used to discern relevant biological pathways (Kanehisa et al., Reference Kanehisa, Furumichi, Tanabe, Sato and Morishima2017). Given that PLS2+ and PLS2- genes have distinct biological implications, we performed separate GO and KEGG enrichment analyses for each gene set. We used a hypergeometric test to identify ontology terms that contained more genes overlapping with PLS2+ (or PLS2-) genes than expected by chance. The human genome provided by org.Hs.eg.db (v. 3.21.0; https://bioconductor.org/packages/org.Hs.eg.db/) served as the background gene set. Enrichment results were considered statistically significant at p < 0.05 with FDR correction.
Results
Demographic and clinical characteristics
These are detailed in Table 1. There were no significant differences in the sex (p = 0.596), age (p = 0.894), and education (p = 0.629) in patients with PTSD versus TENC. As expected from the group definitions, PTSD versus TENC had significantly higher PCL (p < 0.001). They also had significantly lower time since trauma (p < 0.001).
Demographic and clinical characteristics

Table 1. Long description
The table consists of five columns: Characteristic, P T S D (n equals 61), T E N C (n equals 62), Statistics, and p-value.
* Age in years: P T S D 43.4 (10.9), T E N C 43.2 (9.6), Statistics 0.13, p equals 0.894.
* Sex (Female/Male): P T S D 44/17, T E N C 42/20, Statistics 0.28, p equals 0.596.
* Education in years: P T S D 6.8 (3.4), T E N C 7.1 (3.3), Statistics negative 0.49, p equals 0.629.
* Time since trauma in months: P T S D 10.5 (2.0), T E N C 13.5 (0.9), Statistics negative 10.84, p is less than 0.001.
* P C L score: P T S D 51.5 (11.0), T E N C 25.8 (4.7), Statistics 16.80, p is less than 0.001.
* C A P S score: P T S D 60.3 (13.3), with no data provided for the T E N C group.
Note: Data is presented as n or mean with standard deviation. P C L stands for P T S D Checklist and C A P S stands for Clinician-Administered P T S D Scale.
Note: Data presented as n or mean (standard deviation). Abbreviations: CAPS, Clinician-Administered PTSD Scale; PCL, PTSD Checklist; PTSD, post-traumatic stress disorder; TENC, trauma-exposed non-PTSD controls. a By two sample t test; b by Chi-square test.
Network-specific divergence of SFC in PTSD
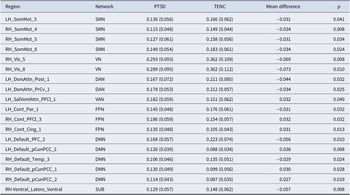
Across the whole brain, the SFC distribution varied considerably (overall range TENC: 0.087–0.485, PTSD: 0.106–0.479) (Figure 2a,b). At the network level, both groups showed notably high SFC in the cerebellum (mean [SD]: TENC: 0.433 [0.134], PTSD: 0.423 [0.121]) and VN (TENC: 0.285 [0.069], PTSD: 0.265 [0.069]), but lower values in the other networks; there were no significant between-group differences (Figure 2c and Supplementary Table S3). At the node level, patients with PTSD showed significantly altered SFC in 18 ROIs compared with TENC (all
$ {p}_{fdr} $
 < 0.05, Figure 2d,e, Table 2). At the node level, patients with PTSD showed significantly altered SFC in 18 ROIs compared with TENC (all
$ {p}_{fdr} $
< 0.05, Figure 2d,e, Table 2). At the node level, patients with PTSD showed significantly altered SFC in 18 ROIs compared with TENC (all
$ {p}_{fdr} $
 < 0.05, Figure 2d,e, Table 2): lower SFC compared with TENC at regions in the DAN, VN, SMN, and thalamus presumably reflects abnormalities in the attentional control and sensory integration systems; conversely, SFC was higher compared with TENC in the VAN; and the DMN and FPN, both transmodal networks, showed differentiated bidirectional alterations. This regional heterogeneity suggests that PTSD involves complex within-network functional reorganization.
Structure–function coupling distribution and group difference. (a) and (b) Map structure–function coupling (SFC) in trauma-exposed non-PTSD controls (TENC) and PTSD patients, respectively (see gray-scale key). (c) A boxplot of network-level SFC values in the PTSD (orange) and TENC (blue) groups; each data point represents a subject. (d) Maps the significant (p < 0.05, false discovery rate corrected) node-level group differences of SFC, both positive and negative (see color key). (e) These node-level differences grouped by network; symbol shape denotes the direction of group difference (see key); each data point represents a node, and nodes showing significant group differences are labeled. Abbreviations: CE, cerebellum region; DAN, dorsal attention network; DMN, default mode network; FPN, frontoparietal control network; LN, limbic network; SMN, sensorimotor network; SUB, subcortical area; VAN, ventral attention network; VN, visual network.

Figure 2. Long description
Panel A and B show brain maps for T E N C and P T S D groups. Both display S F C values ranging from 0.08 light blue to 0.5 dark purple. High coupling is concentrated in the posterior and cerebellar regions. Panel C is a boxplot with Hub Region on the x-axis and S F C on the y-axis from 0.0 to 0.6. It compares P T S D orange and T E N C blue across nine networks: V N, S M N, D A N, V A N, L N, F P N, D M N, S U B, and C E. The C E network shows the highest S F C values for both groups. Panel D maps node-level differences from negative 0.08 blue to positive 0.08 orange. Significant differences are visible in the frontal and parietal lobes. Panel E is a scatter plot of Hub Regions versus negative log 10 p-value adjusted. A red dashed line at p equals 0.05 marks the significance threshold. Points above this line are labeled by region and direction. Circles indicate P T S D less than T E N C, and diamonds indicate P T S D greater than T E N C. Significant nodes include R H underscore Vis underscore 5, R H underscore SomMot underscore 4, L H underscore Default underscore pCunPCC underscore 2, and R H underscore Cont underscore Cing underscore 1.
Significant node-level between-group differences in structure–function coupling

Table 2. Long description
The table consists of 6 columns and 18 data rows. The columns are: Region, Network, P T S D (mean and standard deviation), T E N C (mean and standard deviation), Mean difference, and p-value.
Key data points include:
* S M N Network: Four regions (L H SomMot 3, R H SomMot 4, 5, and 8) show negative mean differences ranging from -0.031 to -0.034, with p-values between 0.008 and 0.041.
* V N Network: R H Vis 5 and R H Vis 8 show the largest negative mean differences of -0.069 and -0.073 respectively, both with p-values ≤ 0.010.
* D A N Network: L H DorsAttn Post 1 and PrCv 1 show negative mean differences of -0.044 and -0.034.
* V A N Network: L H SalVentAttn P F C l 1 shows a positive mean difference of 0.032 (p = 0.049).
* F P N Network: Three regions show mixed results; L H Cont Par 1 is negative (-0.031), while R H Cont P F C l 3 and Cing 1 are positive (0.032 and 0.031).
* D M N Network: Five regions are listed. L H Default P F C 2 and R H Default Temp 3 have negative differences (-0.056 and -0.029). L H Default pCunP C C 2, R H Default pCunP C C 1, and R H Default pCunP C C 2 have positive differences ranging from 0.027 to 0.038.
* S U B Network: R H Ventral Latero Ventral shows a negative mean difference of -0.057 (p = 0.008).
All p-values are less than 0.05, indicating statistical significance after false discovery rate correction.
Note: False discovery rate correction (p < 0.05) applied for correction of multiple comparisons. Abbreviations: DAN, dorsal attention network; DMN, default mode network; FPN, frontoparietal control network; PTSD, post-traumatic stress disorder; SMN, sensorimotor network; SUB, subcortical area; TENC, trauma-exposed non-PTSD controls; VAN, ventral attention network.
Using partial correlation, in the PTSD group CAPS scores were correlated with nodal SFC of 3 of the 18 regions which showed significant between-group differences in Table 2: positive correlation for RH_SomMot_5 (r = 0.275, p = 0.032) and LH_DorsAttn_PrCv_1 (r = 0.324, p = 0.011), and negative correlation for LH_SalVentAttn_PFCl_1 (r = −0.268, p = 0.037) (Figure 3a–c). There were also associations between regional SFC and CAPS scores in other ROIs that did not show significant between-group differences, including regions in the DMN and SUB (Supplementary Figure S3). However, none of these findings survived FDR correction, and must therefore be regarded as exploratory.
Partial correlation and spatial colocalization analysis. (a–c) Scatterplots showing associations (not significant after FDR correction) in PTSD patients between the Clinician-Administered PTSD Scale score (CAPS) and structure–function coupling (SFC) at three nodes: positive correlation for (a) LH_DorsAttn_PrCv_1 (part of DAN) and (c) RH_SomMot_5 (part of SMN), and negative correlation for (b) LH_SalVentAttn_PFCl_1 (part of VAN). Each data point represents a patient. (d) The spatial correlations (see color key) of the SFC distribution of PTSD patients (first columns), trauma-exposed non-PTSD controls (TENC) (second columns) and the PTSD-TENC group difference (third columns) with various neurotransmitter, cell-type, and mitochondria maps, as labeled (* p < 0.05, ** p < 0.01, *** p < 0.001, false discovery rate corrected).

Figure 3. Long description
Panel A is a scatterplot with red data points showing a positive linear trend between L H underscore Dors Attn underscore Pr Cv underscore 1 S F C on the x-axis and C A P S on the y-axis, with r equals 0.324 and p equals 0.011. Panel B shows a negative linear trend with blue data points for L H underscore Sal Vent Attn underscore P F C l underscore 1 S F C, with r equals negative 0.268 and p equals 0.037. Panel C shows a positive linear trend with red data points for R H underscore Som Mot underscore 5 S F C, with r equals 0.275 and p equals 0.032. Panel D is a large heatmap divided into two main vertical sections. Each section has three columns labeled P T S D, T E N C, and Dif. The color scale ranges from blue (negative 1) to orange (1). The left section lists neurotransmitter receptors and transporters such as 5 H T 1 a, 5 H T 2 a, C B 1, G A B A a, and m Glu R 5. The right section lists cell types and mitochondria markers including Glia-Astro, Glia-Micro, mitochondria-Complex 1-N A D H, and various excitatory (Ex) and inhibitory (In) neuron subtypes. Asterisks indicate significance levels: one asterisk for p less than 0.05, two for p less than 0.01, and three for p less than 0.001. Most correlations in the P T S D and T E N C columns are negative (blue), while the Dif column shows mostly neutral or slightly positive correlations.
SFC correlations with brain tissue biological properties
The SFC maps were negatively correlated with the spatial distribution maps of various molecular structures (all
$ {p}_{fdr} $
 < 0.05 for both groups), including glutamate, serotonin, acetylcholine, noradrenaline, cannabinoid, GABA, metabolism, excitatory/inhibitory neurons, glia, and mitochondria maps in both PTSD and TENC (Figure 3d, first and second columns, respectively). In the between-group SFC difference map (Figure 3d, third columns), the only significant correlations were two inhibitory neuron maps (In4: rho = −0.31,
$ {p}_{fdr} $
< 0.05 for both groups), including glutamate, serotonin, acetylcholine, noradrenaline, cannabinoid, GABA, metabolism, excitatory/inhibitory neurons, glia, and mitochondria maps in both PTSD and TENC (Figure 3d, first and second columns, respectively). In the between-group SFC difference map (Figure 3d, third columns), the only significant correlations were two inhibitory neuron maps (In4: rho = −0.31,
$ {p}_{fdr} $
 = 0.014; In7: rho = −0.27,
$ {p}_{fdr} $
= 0.014; In7: rho = −0.27,
$ {p}_{fdr} $
 = 0.035).
SFC associations with gene expression
In the PLS regression analysis, PLS2 explained 19% of the variance (
$ {p}_{spin} $
 = 0.006) in SFC, and the map of the PLS2 weight reflects a broadly anterior-to-posterior gradient of gene expression (Figure 4a). PLS2-weighted gene expression was positively correlated with intergroup SFC differences (r = 0.44,
$ {p}_{spin} $
= 0.006) in SFC, and the map of the PLS2 weight reflects a broadly anterior-to-posterior gradient of gene expression (Figure 4a). PLS2-weighted gene expression was positively correlated with intergroup SFC differences (r = 0.44,
$ {p}_{spin} $
 = 0.004, Figure 4b). Ranking the normalized PLS2 weights using univariate z-tests, and dividing into genes showing positive (PLS2+) and negative (PLS2-) correlations, we identified 1277 PLS2+ (z > 2.68) and 1073 PLS2- (z < −2.68) genes significantly related to intergroup SFC changes (all
$ {p}_{fdr} $
= 0.004, Figure 4b). Ranking the normalized PLS2 weights using univariate z-tests, and dividing into genes showing positive (PLS2+) and negative (PLS2-) correlations, we identified 1277 PLS2+ (z > 2.68) and 1073 PLS2- (z < −2.68) genes significantly related to intergroup SFC changes (all
$ {p}_{fdr} $
 < 0.05, Figure 4c). PLS2+ genes are overexpressed in regions where SFC is higher in PTSD versus TENC, while PLS2- genes are underexpressed in those regions.
Transcriptional correlation analysis. (a) Maps the weighted gene expression (see color key) of the second component of the partial least squares regression (PLS2) scores. (b) A scatterplot (with histograms on the x- and y-axes) showing the positive correlation between average node-level intergroup differences of structure–function coupling (SFC) and PLS2 scores (p = 0.004, spin test corrected). (c) The ranked PLS2 gene weights (p < 0.05, false discovery rate corrected), both positive and negative (see color key). The top five genes of each direction are listed. (d) and (E) The enrichment of PLS2- and PLS2+ genes significantly (p < 0.05, false discovery rate corrected) associated with SFC alterations in PTSD versus TENC; gene functions are as labeled, classified (see color key) into molecular functions (MFs), biological processes (BPs), cellular components (CC), and Kyoto Encyclopedia of Genes and Genomes (KEGG); count given in the coded circles.

Figure 4. Long description
Panel A shows four cortical views and two subcortical views of a brain mapping P L S 2 scores. The color scale ranges from negative 0.24 in blue to positive 0.24 in orange. Panel B is a scatterplot with P L S 2 scores on the x-axis and Inter-group Differences of S F C on the y-axis. A linear regression line shows a positive correlation with r equals 0.44 and p equals 0.004. Marginal histograms are located on the top and right edges. Panel C is a table of ranked P L S 2 gene weights. The top five positive genes in orange are Z B B X, N U M B, F O S L 2, O L F M 4, and I N S M 1. The top five negative genes in blue are S R D 5 A 3, Y W H A Q, T A N C 1, C A M K 2 N 2, and C R E G 1. Panels D and E are horizontal bar charts for P L S 2 plus and P L S 2 minus gene enrichment. The x-axis represents negative log 10 p-adjust. Categories are color-coded: B P in red, C C in yellow, M F in blue, and K E G G in green. Circles next to each bar contain the gene count. In Panel D, the highest enrichment is for small G T P ase-mediated signal transduction. In Panel E, the highest enrichment is for synaptic membrane and postsynaptic membrane.
Gene enrichment associations with SFC
PLS2- genes associated with SFC differences were most enriched for BP in regulation of neuron projection and nervous system development, for CC in synaptic and postsynaptic membrane, and for MF in extracellular ligand-gated monoatomic ion channel activity and amyloid-beta binding. Conversely, PLS2+ genes were primarily enriched for BP related to small GTPase-mediated signal transduction and temperature homeostasis, for CC involving adherens junctions and collagen-containing extracellular matrix, and for MF associated with nucleoside-triphosphatase regulator activity and GTPase regulator activity. KEGG analysis revealed significant enrichment in pathways of neurodegeneration-multiple diseases and retrograde endocannabinoid signaling pathway for PLS2- genes, and in neuroactive ligand signaling and axon guidance pathway for PLS2+ genes (Figure 4d,e and Supplemental Table S4).
Discussion
Using a multimodal imaging fusion method based on Laplace eigendecomposition, we characterized for the first time abnormal patterns of whole-brain-scale SFC in PTSD patients, and revealed their relationship to multidimensional brain biology. The participant cohort used in this study has been previously described in several publications focusing on identifying imaging biomarkers of PTSD subjects, although in a single-modal fashion (Lei et al., Reference Lei, Li, Li, Chen, Huang, Lui and Gong2015; Li et al., Reference Li, Huang, Li, Du, Li, Bi and Gong2016; Li et al., Reference Li, Lei, Li, Huang, Suo, Xiao and Gong2016, Reference Li, Xu, Chen, Suo, Fu, Wang and Gong2021). While these studies provided insights into specific aspects of PTSD neuropathology, they were inherently limited by their single-modal experimental design. Going beyond this, the present work investigates potential PTSD biomarkers from a new perspective by combining structural and functional images to identify changes in SFC, and then linking these to the underlying molecular architecture. This new analysis yields a deeper understanding of the pathogenesis and molecular mechanisms of PTSD. We have shown that PTSD patients have region-specific alterations in SFC across multiple brain regions, some of which are significantly correlated with the severity of PTSD; the regional distribution pattern of SFC is associated with the spatial distribution of biological properties of brain tissue; and genes associated with altered SFC in PTSD are enriched in various BPs related to neural development and neural signaling. These findings provide insights into the structural and functional interactions and network wiring rules of PTSD and offer potential biomarkers for diagnostic and therapeutic research.
The integrated measure SFC contains more information than the sum of its structural and functional components, and so variations in SFC may arise from diverse neurobiological mechanisms, the interpretation of which depends on the disease context and clinical circumstances. Rather than being directly mapped onto a single mechanism, increases or decreases in SFC are better understood as a manifestation of rebalancing between structural constraints and functional demands within brain networks (Fotiadis et al., Reference Fotiadis, Parkes, Davis, Satterthwaite, Shinohara and Bassett2024). To define their complex interdependencies we used the eigendecomposition approach, which models functional signals as a diffusion process on the underlying structural network (Abdelnour, Voss, & Raj, Reference Abdelnour, Voss and Raj2014). In predicting FC through eigenmode mapping of SC, we simulate how neural activity propagates to form the observed functional patterns. This physics framework, grounded in topology, enhances the neurobiological interpretability of SFC (Abdelnour et al., Reference Abdelnour, Dayan, Devinsky, Thesen and Raj2018). As in earlier studies using this approach (Facca, Del Felice, & Bertoldo, Reference Facca, Del Felice and Bertoldo2024; Wang, Owen, Mukherjee, & Raj, Reference Wang, Owen, Mukherjee and Raj2017), a small number of eigenmodes sufficed for accurate FC reconstruction, which improves sensitivity to subtle changes, and simplifies investigation of structure–function relationships in disease (Lu et al., Reference Lu, Wang, Murai, Wu, Liang and Zhang2025).
We found heterogeneous whole-brain SFC distribution aligning with established hierarchies (Baum et al., Reference Baum, Cui, Roalf, Ciric, Betzel, Larsen and Satterthwaite2020; Vázquez-Rodríguez et al., Reference Vázquez-Rodríguez, Suárez, Markello, Shafiei, Paquola, Hagmann and Misic2019): the gradient of gradual SFC decoupling from unimodal (VN, SMN, and SUBs) to transmodal regions (DMN, FPN, and VAN) reflects decreasing functional specialization from modality-specific processing to cognitive flexibility (Preti & Van De Ville, Reference Preti and Van De Ville2019). Areas with relatively high SFC, including the cerebellum, have high heritability (Gu, Jamison, Sabuncu, & Kuceyeski, Reference Gu, Jamison, Sabuncu and Kuceyeski2021). Consequently, high SFC not only reflects structure-constrained variation in dynamics (Fernandez-Iriondo et al., Reference Fernandez-Iriondo, Jimenez-Marin, Diez, Bonifazi, Swinnen, Muñoz and Cortes2021), but also underpins stability across individuals and generations.
Group comparisons revealed multiple regional SFC alterations. Among the higher-order networks, both DMN and FPN showed extensive SFC changes, consistent with their known roles in PTSD (Alexandra Kredlow et al., Reference Alexandra Kredlow, Fenster, Laurent, Ressler and Phelps2022; Bao et al., Reference Bao, Gao, Cao, Li, Liu, Liang and Huang2021; Patriat, Birn, Keding, & Herringa, Reference Patriat, Birn, Keding and Herringa2016). DMN abnormalities overlapped with earlier findings from graph theory in the same cohort (Lei et al., Reference Lei, Li, Li, Chen, Huang, Lui and Gong2015), while SFC alterations in right FPN may be related to excessive threat attention bias in PTSD (Berg et al., Reference Berg, Ma, Rueter, Kaczkurkin, Burton, DeYoung and Lissek2021), a further manifestation of dysregulated fear and threat control. PTSD also showed lower SFC in the right visual regions and thalamus. The thalamus is thought to modulate activity across fear-processing regions during high-threat states (Venkataraman & Dias, Reference Venkataraman and Dias2023), and amygdala–thalamus connectivity is correlated with PTSD severity (Ben-Zion et al., Reference Ben-Zion, Zeevi, Keynan, Admon, Kozlovski, Sharon and Hendler2020). Threatening visual signals are transmitted to the amygdala via the superior colliculus and occipital lobe (Koller, Rafal, Platt, & Mitchell, Reference Koller, Rafal, Platt and Mitchell2019), and this circuit takes part in fear learning (Wei et al., Reference Wei, Liu, Zhang, Liu, Tang, He and Wang2015). Notably, variability in threat-visual circuitry connectivity partially underlies susceptibility to PTSD (Harnett et al., Reference Harnett, Fleming, Clancy, Ressler and Rosso2025), and intervention in high visuospatial demand tasks following trauma can alleviate intrusive painful memories (Iyadurai et al., Reference Iyadurai, Blackwell, Meiser-Stedman, Watson, Bonsall, Geddes and Holmes2018), so treatment targeting visual neural circuits shows promise. In addition, PTSD patients with lower VAN connectivity show clinically significant attentional impairment (Esterman et al., Reference Esterman, Stumps, Jagger-Rickels, Rothlein, DeGutis, Fortenbaugh and McGlinchey2020). In connectome gradient analysis, PTSD patients show higher system segregation in SMN and lower participation coefficients in DAN, correlating with global gradient variance and CAPS scores (He et al., Reference He, Zhu, Wang, Zhou and Zhang2025). The observed alterations in SFC within these network regions suggest corresponding functional abnormalities.
It is of course difficult to establish causation in cross-sectional studies. Due to statistical power limitations, the associations between regional SFC and clinical measures across the SMN, VAN, DAN, DMN, and SUB did not survive correction for multiple comparisons. Nevertheless, these findings also provide valuable insights into the potential contribution of SFC alterations to the neural mechanisms underlying PTSD. On the one hand, network configuration abnormalities reflected by SFC may underlie core PTSD symptomatology (Lanius et al., Reference Lanius, Frewen, Tursich, Jetly and McKinnon2015; Nicholson et al., Reference Nicholson, Harricharan, Densmore, Neufeld, Ros, McKinnon and Lanius2020). For instance, functional alterations in the DMN have been associated with excessive self-referential processing, which may facilitate the intrusive recollection of traumatic memories, manifesting as flashbacks and reexperiencing symptoms (Lanius, Terpou, & McKinnon, Reference Lanius, Terpou and McKinnon2020). Similarly, dysregulated modulation of attention-related networks may lead to attentional rigidity, potentially accounting for threat hypersensitivity and hypervigilance observed in PTSD patients (Koch et al., Reference Koch, van Zuiden, Nawijn, Frijling, Veltman and Olff2016). On the other hand, these findings also suggest that PTSD exhibits clinical heterogeneity that can obscure group-level effects and the directionality of associations (Ben-Zion et al., Reference Ben-Zion, Spiller, Keynan, Admon, Levy, Liberzon and Harpaz-Rotem2023; Jiang et al., Reference Jiang, Ferraro, Zhao, Wu, Lin, Chen and Li2024), highlighting the need for future studies with larger samples to identify potential biological subtypes of PTSD. In any case, more information on these regions may improve our understanding of PTSD severity trajectories.
Spatial colocalization analysis demonstrated broad negative correlations between SFC and various aspects of brain tissue biology: specifically, regions enriched for neurons, glia, neurotransmitter systems, and metabolic activity show lower SFC. This may reflect the greater functional flexibility enabled by complex microcircuitry and higher metabolic demands (Chen et al., Reference Chen, Sun, Lei, Li, Liao, Meng and Li2023; Luppi et al., Reference Luppi, Mediano, Rosas, Holland, Fryer, O’Brien and Stamatakis2022). PTSD pathophysiology involves various substrates: recent high-throughput single-cell sequencing studies implicate dysregulation in inhibitory neurons, endothelial cells, and microglia across multiple neurotransmitter pathways (Hwang et al., Reference Hwang, Skarica, Xu, Coudriet, Lee, Lin and Girgenti2025). Interestingly, in our study, spatial SFC–neurobiological correlations were highly consistent between PTSD and TENC, with only weak correlations with intergroup SFC differences. Cortical chemoarchitecture shares key organizational traits with functional and structural brain anatomy (Hänisch et al., Reference Hänisch, Hansen, Bernhardt, Eickhoff, Dukart, Misic and Valk2023), and a recent study attributed cortical SFC variability to the overlapping distributions of various neurotransmitter systems (L. Jiang et al., Reference Jiang, Genon, Ye, Zhu, Wang, He and Xu2025). Our results may therefore shed new light on the biological substrate of SFC spatial heterogeneity: intrinsic cellular and molecular architecture provides a fundamental constraint framework for the distribution of SFC, persistent regardless of disease status. They also support the idea that the variability in the relationship between white matter structure and neural activity constitutes an inherent property of brain networks (Fotiadis et al., Reference Fotiadis, Parkes, Davis, Satterthwaite, Shinohara and Bassett2024).
Finally, gene association analysis revealed significant correlations between PTSD-related SFC alterations and PLS2 gene co-expression patterns. Brain genes showed differential expression across regions characterized by varying SFC profiles. PLS2- genes were predominantly enriched in terms related to neuronal synapses, neurodegenerative disease pathways, and ion channel activity. Proper development and regulation of neuron are essential for constructing accurate neural circuits (Tau & Peterson, Reference Tau and Peterson2010). The widespread lower SFC observed in PTSD may be associated with dysregulation of synaptic regulatory genes, potentially contributing to anatomical–functional decoupling, while alterations in ion channel activity further disrupt synaptic information transmission. These findings resonate with recent large-scale transcriptomic analyses of postmortem brain tissue from PTSD patients, which identified downregulation in a co-regulated set of genes marking interneuron function (Girgenti et al., Reference Girgenti, Wang, Ji, Cruz, Stein and Duman2021), raising the possibility that SFC-associated gene patterns may reflect pathological synaptic dysfunction in PTSD. Abnormalities in the endocannabinoid signaling pathway, which have been reported in PTSD patients, may promote the retention of aversive emotional memories (Hill et al., Reference Hill, Bierer, Makotkine, Golier, Galea, McEwen and Yehuda2013). Furthermore, enrichment in amyloid-beta-binding functions suggests the involvement of molecules participating in neurotoxicity and protein aggregation, offering a potential link to chronic neurodegenerative mechanisms underlying PTSD (Kritikos et al., Reference Kritikos, Diminich, Meliker, Mielke, Bennett, Finch and Luft2023). By contrast, PLS2+ genes showed enrichment patterns suggestive of compensatory signaling mechanisms in PTSD. As key regulators of cytoskeletal dynamics, GTPase-related proteins directly participate in synaptic structural and functional plasticity (Hedrick et al., Reference Hedrick, Harward, Hall, Murakoshi, McNamara and Yasuda2016). Neuroplasticity enables the brain to reorganize and adapt, enhancing resilience to trauma and adversity (Udeh-Momoh et al., Reference Udeh-Momoh, Migeot, Blackmon, Mielke, Melloni, Cox and Ibanez2025). It is known that genetic variants can increase trauma vulnerability, and that a supportive environment can mitigate this effect (Clukay et al., Reference Clukay, Dajani, Hadfield, Quinlan, Panter-Brick and Mulligan2019). Collectively, these findings suggest that transcriptional profiles, being more plastic and responsive to environmental and pathological processes, better capture abnormalities in brain organization, and may be responsible for SFC alterations. However, it is important to note that the enriched pathways identified here are relatively broad and that the interpretations remain speculative at this stage. Therefore, our findings provide exploratory transcriptomic correlates of SFC alterations that suggest candidate molecular pathways that may interact with trauma-related pathophysiology and warrant further mechanistic investigation.
This study has some limitations. First, the cross-sectional design precluded determination of whether the SFC alterations represent trait-like or state-like effects, and their dynamic evolution throughout PTSD progression. Second, given the heterogeneity in trauma exposures and individual baselines, the generalizability of findings from our relatively limited sample size requires verification, ideally combining longitudinal follow-up with individual deep phenotyping. Third, in our sensitivity analyses (Supplementary Figures S1, S2) the choice of parameters in constructing SFC has a non-negligible influence on the analytical outcomes, no doubt largely due to necessary trade-offs in the methodological pipelines, familiar from other studies (Botvinik-Nezer et al., Reference Botvinik-Nezer, Holzmeister, Camerer, Dreber, Huber, Johannesson and Schonberg2020; Schilling et al., Reference Schilling, Rheault, Petit, Hansen, Nath, Yeh and Descoteaux2021; Zhou et al., Reference Zhou, Wu, Zeng, Qi, Ferraro, Xu and Becker2022). The sensitivity analyses also make an indirect argument for the brain network perspective (Osmanlıoğlu, Alappatt, Parker, & Verma, Reference Osmanlıoğlu, Alappatt, Parker and Verma2020): unimodal cortical regions are generally quite sensitive to parameter selection, while ROIs distributed in transmodal association cortices are more robust. This makes sense in terms of the hierarchical organization of brain networks: neural activity in primary sensory areas is more tightly coupled to local anatomical structures, while higher-order association cortices support functional integration through distributed networks, thus depending more on global properties. In the absence of a definitive methodological consensus, we adopted parameter ranges used in similar studies (Baum et al., Reference Baum, Cui, Roalf, Ciric, Betzel, Larsen and Satterthwaite2020; Facca, Del Felice, & Bertoldo, Reference Facca, Del Felice and Bertoldo2024; Honey et al., Reference Honey, Sporns, Cammoun, Gigandet, Thiran, Meuli and Hagmann2009). Future research should systematically evaluate the potential effects of methodological variability on SFC estimation. Fourth, the spatial neurobiological maps and AHBA gene expression data originated from distinct healthy cohorts, which constrains interpretation of their correlations with SFC. Future analyses would benefit from multimodal data acquisition within the same participant population. Fifth, while spatial colocalization and gene association analyses provide valuable insights into neurobiology and brain organization in neuroimaging contexts, inferences remain at a correlative, noncausal level. Precise regulatory mechanisms necessitate further validation using animal models and molecular studies.
Conclusion
This study explored SFC deviations associated with PTSD. We found that PTSD, compared to TENC, is characterized by extensive alterations in SFC across multiple brain networks, including SMN, VN, DMN, DAN, VAN, FPN, and thalamus, and that the aberrant SFC patterns are associated with specific molecular and transcriptomic profiles. By integrating macroscale in vivo imaging with microscale biological substrates, our results advance the understanding of SFC in the psychopathology of PTSD and may help to establish targeted diagnosis and treatment measures.
Supplementary material
The supplementary material for this article can be found at http://doi.org/10.1017/S0033291726104838.
Data availability statement
The data supporting the findings of this study are available on reasonable request from the corresponding author.
Acknowledgments
The study was supported by the National Natural Science Foundation of China (B.G., grant no. 82572325); the Fujian Provincial Health Technology Project (B.G., 2023QNB020); and the Fujian Provincial Natural Science Foundation of China (B.G., 2024D034). The authors thank all the participants in this study.
Competing interests
All authors declare no conflict of interest.




 Open access

