


1. Introduction
Glacier fluctuations, i.e. changes in length, area, volume and mass, represent an integration of changes in the energy balance and, as such, are well recognized as high-confidence indicators of climate change (Reference Bojinski, Verstraete, Peterson, Richter, Simmons and ZempBojinski and others, 2014). Past, current and future glacier changes impact global sea level (e.g. Reference Raper and BraithwaiteRaper and Braithwaite, 2006; Reference MeierMeier and others, 2007; Reference GardnerGardner and others, 2013; Radić and others, 2014; Reference Marzeion, Cogley, Richter and ParkesMarzeion and others, 2014), the regional water cycle (e.g. Reference FountainFountain, 1996; Reference Kaser, Großhauser and MarzeionKaser and others, 2010; Reference Weber, Braun, Mauser and PraschWeber and others, 2010; Reference HussHuss, 2011; Reference Bliss, Hock and RadićBliss and others, 2014) and local hazard situations (e.g. Reference Kääb, Wessels, Haeberli, Huggel, Kargel and KhalsaKääb and others, 2003; Reference Bajracharya and MoolBajracharya and Mool, 2009; Haeberli and others, 2015). In the Fifth Assessment Report of the Intergovernmental Panel on Climate Change (Reference Vaughan and StockerVaughan and others, 2013) glacier mass budgets for 2003–09 were reconciled in order to obtain an estimate of the glacier contribution to sea level. This was achieved by combining traditional observations with satellite altimetry and gravimetry as a way of filling regional gaps and obtaining global coverage (Reference GardnerGardner and others, 2013). However, the analysis was possible only during a short time period; additional datasets are needed to detect climatic trends and to compare current change rates with earlier ones. In this study we present a joint analysis of data compiled by the World Glacier Monitoring Service (WGMS, 2008a, and references therein) and its National Correspondents in order to provide the scientific community with an in-depth summary of changes in glacier length, volume and mass. For this purpose we apply the observational dataset in its full richness for a comprehensive assessment of decadal glacier changes at global and regional levels. Results from different methods are not merged (as in Reference GardnerGardner and others, 2013), rather they are treated separately in order to demonstrate and discuss both the strengths and limitations of the respective datasets. We conclude with a brief outlook on future tasks for the internationally coordinated glacier monitoring network aimed at best serving the scientific community.
2. Datasets and Methods
2.1. Background, data compilation and dissemination
Internationally coordinated glacier monitoring began in 1894 and the periodic publication of compiled information on glacier fluctuations started 1 year later (Reference ForelForel, 1895). In the beginning, glacier monitoring focused mainly on glacier fluctuations, particularly on the collection and publication of front variation data (commonly referred to as length changes), and after the late 1940s the focus was on glacier-wide mass-balance measurements (Reference Haeberli, Haeberli, Hoelzle and SuterHaeberli, 1998). Beginning with the introduction of the ‘Fluctuations of Glaciers’ series in the late 1960s (PSFG, 1967; WGMS, 2012, and volumes in between), standardized data on changes in glacier length, area, volume and mass have been published at pentadal intervals. Since the late 1980s, glacier fluctuation data have been organized in a relational database and made available in electronic form (Reference Hoelzle, Trindler, Haeberli, Hoelzle and SuterHoelzle and Trindler, 1998). In the 1990s, an international glacier monitoring strategy was conceived to provide quantitative, comprehensive and easily understandable information relating to questions about process understanding, change detection, model validation and environmental impacts with an interdisciplinary knowledge transfer to the scientific community as well as to policymakers, the media and the public (Reference Haeberli, Haeberli, Hoelzle and SuterHaeberli, 1998; Reference Haeberli, Cihlar and BarryHaeberli and others, 2000). Based on this strategy, the monitoring of glaciers has been internationally coordinated within the framework of the Global Terrestrial Network for Glaciers (http://www.gtn-g.org) under the Global Climate Observing System in support of the United Nations Framework Convention on Climate Change (Reference Bojinski, Verstraete, Peterson, Richter, Simmons and ZempBojinski and others, 2014).
For data compilation, the WGMS and its predecessor organizations have been organizing periodical calls-for-data through an international scientific collaboration network with National Correspondents for, currently, 36 countries and thousands of contributing observers around the world. With the most recent data report (WGMS, 2012), the global dataset was extended substantially by adding the latest observations from the measurement period 2005–10 and by supplementing earlier periods (WGMS 2008b, and earlier issues) with additional records from the literature (Fig. 1). The corresponding increase in mass-balance data from glaciological and geodetic methods is shown in Figure 1a, while the gain in front variation from observation and reconstruction records is seen in Figure 1b. The full dataset is available from the WGMS website and can be explored using a map-based browser (http://www.wgms.ch).
Number of glacier fluctuation records over time. (a) Temporal coverage of available mass-balance records is shown for the geodetic method above, and for the glaciological method below, the time axis. The latest increase in data availability is indicated in pale blue and corresponds to the additional data coverage at the time of publication of WGMS (2012) compared to WGMS (2008a,b, and earlier issues) in dark blue. (b) The temporal coverage of available front variation records from observations (above) and reconstructions (below). Again, the latest increase in compiled data is indicated in pale blue. In both plots, multi-annual observations are accounted for in each year of the survey period. Source: glacier fluctuation data from WGMS (2012, and earlier issues).

A look at the entire data samples in Figure 1 (joint area in dark and pale blue) reveals that the glaciological sample has been increasing whereas the geodetic and the two front variation samples have been decreasing over the past 25 years. The increase found in the glaciological sample reflects the successful efforts of the observers to continue and extend their monitoring programmes as well as of the WGMS to compile these results through its collaboration network. The decline in the geodetic sample has to do with the normal post-processing character of geodetic surveys. Another reason is the stronger reluctance with regard to data sharing; it appears that the cost to the relevant research community in terms of the extra effort required to submit data (beyond a journal publication of the main results) is considerable compared with the benefit gained from increased visibility through data sharing. As a consequence, the recent increase in the dataset (pale blue) mainly derives from an extensive literature research. In the case of the observational front variation sample, the decrease is reported to be caused mainly by the abandonment of in situ programmes without remote-sensing compensation.
2.2. Glaciological mass-balance data
The glaciological method (cf. Reference CogleyCogley and others, 2011), based primarily on stake and pit measurements, provides mass-budget estimates with pioneer point observation extending back to the late 19th century (Reference MercantonMercanton, 1916; Reference Chen and FunkChen and Funk, 1990; Reference Müller and KappenbergerMüller and Kappenberger, 1991; Reference Vincent, Kappenberger, Valla, Bauder, Funk and Le MeurVincent and others, 2004; Reference Huss and BauderHuss and Bauder, 2009). Since the 1940s, accumulation and ablation of snow, firn and ice have been measured in situ and integrated within glacier-wide averages of mass changes in metres of water equivalent (m w.e.). The method requires intensive fieldwork but provides reference information on seasonal and annual components of the surface balance, long-term interannual variability, the equilibrium-line altitude (ELA) and accumulation–area ratios (AAR) from a few hundred glaciers. Furthermore, mass balance and AAR can be used to calculate the committed loss in glacier area as (1 − AAR)/AAR0, where AAR0 is the balanced-budget value of AAR calculated from the linear regression against mass balance (cf. Reference Mernild, Lipscomb, Bahr, Radić and ZempMernild and others, 2013). Mass-balance results are reported, citing the dates when the survey period began and when the winter season and the survey period ended. Winter, summer and annual balances typically refer to the sum of accumulation and ablation over the winter season, the summer season and the hydrological year, respectively (cf. Reference CogleyCogley and others, 2011).
The glaciological method provides quantitative results at high temporal resolution, which are essential for understanding climate–glacier processes and for allowing the spatial and temporal variability of the glacier mass balance to be captured, even with only a small sample of observation points. It is recommended to periodically validate and calibrate annual glaciological mass-balance series with decadal geodetic balances in order to detect and remove systematic biases.
For climate change assessments, ongoing mass-balance series with >30 observation years are of special value and, hence, labelled as ‘reference’ glaciers (Reference Zemp, Hoelzle and HaeberliZemp and others, 2009). The glaciological dataset currently contains 37 glaciers that fulfil these criteria. A list of these ‘reference’ glaciers as well as related principal investigators and sponsoring agencies is given in WGMS (2013).
2.3. Geodetic mass-balance data
The geodetic method (cf. Reference CogleyCogley and others, 2011) provides overall glacier volume changes over a longer time period by repeat mapping from ground, air- or spaceborne surveys and subsequent differencing of glacier surface elevations. Geodetic surveys are currently available for ∼450 glaciers. The geodetic method includes all components of the surface, internal and basal balances and can be used for a comparison with the glaciological (surface-only) mass budgets of the same glacier (Reference ZempZemp and others, 2013) and for extending the glaciological sample in space and time (Reference CogleyCogley, 2009). For the conversion of geodetic results to glaciological mass-balance units (m w.e.), a glacier-wide average density of 850 ± 60 kg m−3 is commonly applied (cf. Reference HussHuss, 2013). The results of the glaciological and the geodetic methods provide conventional balances which incorporate climatic forcing and changes in glacier hypsometry and represent the glacier contribution to runoff (cf. Reference CogleyCogley and others, 2011).
Within the international glacier monitoring strategy, the strength of the geodetic method is that it provides decadal values that take the entire glacier into account, i.e. including inaccessible regions. In combination with sound uncertainty estimates, its results are, hence, essential for validating and calibrating glaciological data series. Reanalysis of glacier mass-balance series needs to be carried out over common survey periods and after careful homogenization and uncertainty assessment of both the glaciological and the geodetic observations (cf. Reference ZempZemp and others, 2013). Such reanalysis exercises have been applied successfully at several glaciers (e.g. Reference Thibert, Blanc, Vincent and EckertThibert and others 2008; Reference Huss, Bauder and FunkHuss and others, 2009; Reference ZempZemp and others 2010; Reference FischerFischer 2011; Reference Prinz, Fischer, Nicholson and KaserPrinz and others 2011; Reference Andreassen, Kjøllmoen, Rasmussen, Melvold and NordliAndreassen and others 2012), and need to become a standard procedure for every monitoring programme (Reference ZempZemp and others, 2013). In addition, the geodetic method can provide thickness and volume change information for large glacier samples covering entire mountain ranges (e.g. Reference Paul and HaeberliPaul and Haeberli, 2008).
2.4. Front variation data (length changes)
Direct observations of glacier front positions extend back into the 19th century (WGMS, 2008a). This data sample has been extended in space based on remotely sensed length change observations (e.g. Reference Cook, Fox, Vaughan and FerrignoCook and others, 2005; Reference Gordon, Haynes and HubbardGordon and others, 2008; Reference Citterio, Paul, Ahlstrøm, Jepsen and WeidickCitterio and others, 2009) and continued back in time by front variations reconstructed from clearly dated historical documents (Reference Zemp, Zumbühl, Nussbaumer, Masiokas, Espizua and PitteZemp and others, 2011, and references therein). Overall, the database contains ∼42 000 observations which allow the front variations of ∼2000 glaciers to be illustrated and quantified back into the 19th century. Additional reconstruction series from ∼30 glaciers in the European Alps, Scandinavia and the southern Andes extend as far back as the Little Ice Age (LIA) period, i.e. to the 16th century (Reference Zemp, Zumbühl, Nussbaumer, Masiokas, Espizua and PitteZemp and others, 2011).
Within the international monitoring strategy, glacier front variation series are a key element for assessing the regional representativeness of the few glaciological measurement programmes both in space and in time. In addition, glacier front variation observations in combination with numerical modelling provide insight into climate–glacier processes and glacier dynamics (e.g. Reference Hoelzle, Haeberli, Dischl and PeschkeHoelzle and others, 2003; Reference OerlemansOerlemans, 2005; Reference Lüthi, Bauder and FunkLüthi and others, 2010; Reference Leclercq, Oerlemans and CogleyLeclercq and others, 2011).
2.5. Spatial and temporal regionalization
For regional analysis and comparison of the above data it is convenient to group glaciers by proximity. We refer to the 19 glacier regions as defined by Radić and Hock (2010) and used in some other recent studies (e.g. Reference PfefferPfeffer and others, 2014). For global studies of mass balance, these glacier regions seem to be appropriate because of their manageable number and their geographical extent, which is close to the spatial correlation distance of glacier mass-balance variability in most regions (several hundred kilometres; cf. Reference Letréguilly and ReynaudLetréguilly and Reynaud, 1990; Reference Cogley and AdamsCogley and Adams, 1998). Where necessary, these regions are divided into further sub-regions. Per region, all data records are aggregated at the annual time resolution in order to give consideration to the corresponding observational peculiarities, i.e. for multi-annual survey periods, the annual change rate is calculated and assigned to each year of the survey period. For quantitative comparisons over time and between regions, decadal arithmetic mean mass balances are calculated in order to reduce the influence of meteorological extremes and of density conversion issues (cf. Reference HussHuss, 2013; Reference ZempZemp and others, 2013). Global values are calculated as arithmetic means of the regional averages to avoid a bias in favour of regions with large observation densities (e.g. in regions CEU, SCA, SJM; cf. Table 2 and Fig. 2 for abbreviations). This approach is suitable for assessing the temporal variability of glacier mass balance. For calculations of glacier sea-level contributions (cf. Section 4.4), regional averages of glacier mass balance are weighted with the corresponding regional glacier areas.
Distribution of glacier area and fluctuation records in 19 regions. The pie charts show the regional glacier area (excluding the ice sheets in Greenland and Antarctica) and the fraction covered by available observations. The dots show the location of continued (red) and interrupted (black cross) series with respect to the latest data report covering the observation period 2005/06–2009/10. The 19 regions moving from northwest to southeast are: 1. Alaska (ALA); 2. Western North America (WNA); 3. Arctic Canada North (ACN); 4. Arctic Canada South (ACS); 5. Greenland (GRL); 6. Iceland (ISL); 7. Svalbard and Jan Mayen (SJM); 8. Scandinavia (SCA); 9. Russian Arctic (RUA); 10. Asia North (ASN); 11. Central Europe (CEU); 12. Caucasus and Middle East (CAU); 13. Asia Central (ASC); 14. Asia South East (ASE); 15. Asia South West (ASW); 16. Low Latitudes (TRP); 17. Southern Andes (SAN); 18. New Zealand (NZL); 19. Antarctica and Sub Antarctic Islands (ANT). Sources: regional glacier area totals from Reference ArendtArendt and others (2012), glacier fluctuation data from WGMS (2012, and earlier issues), and country boundaries from Environmental Systems Research Institute (ESRI)’s Digital Chart of the World.

The full set of observational and reconstructed series was used for the qualitative analysis of advancing and retreating glacier fronts. For multi-annual records, annual change rates are accounted for in every year of the observation period. For the regional averaging, glaciers with extreme annual advance and retreat values (i.e. values > three standard deviations of the full sample) were omitted to reduce the influence of calving and surging glaciers. This reduced the full front variation sample from 2000 to 1900 glaciers (i.e. −5%) and from 42 000 to 38 800 observations (i.e. −8%). When conducting quantitative analysis of glacier front variations, additional consideration must be given to climate sensitivity and topographic effects on glacier reaction and response times (Reference Jóhannesson, Raymond and WaddingtonJóhannesson and others, 1989; Reference OerlemansOerlemans, 2001).
3. Results
3.1. Global distribution of glacier fluctuation records
Approximately 47 000 observations from 2300 glaciers are available worldwide, some of them going back as far as the 16th century (Table 1). Glacier front variation data make up the largest proportion with respect to the number of glaciers and observations, with 78% and 89%, respectively. This dataset consists mainly of annual observations of frontal position changes supplemented by some thousands of multi-annual and decadal length change observations. These direct observations go back as far as the 19th century. Reconstructions based on historical documents, geomorphological evidence and archaeological findings allow the temporal coverage of glaciers in the European Alps, Scandinavia and the Southern Andes to be extended into the LIA (e.g. Reference ZumbühlZumbühl, 1980; Reference Masiokas, Rivera, Espizua, Villalba, Delgado and AravenaMasiokas and others, 2009; Reference Nussbaumer, Nesje and ZumbühlNussbaumer and others, 2011; Reference Purdie, Anderson, Chinn, Owens, Mackintosh and LawsonPurdie and others, 2014). Glacier mass-balance time series are derived from both glaciological and geodetic surveys. The glaciological dataset provides glacier-wide results of 260 glaciers with >4150 annual observations over the past seven decades, often including seasonal balances, mass-balance distribution with elevation, ELA, AAR and the corresponding point measurements. Thickness and volume change data are available for 444 glaciers with 1100 observations. These geodetic data come with decadal resolution and extend back into the mid-19th century.
Information on glacier fluctuation datasets. The total number of observations is given together with the spatial and temporal coverage of the four analysed datasets: front variations (FV) from direct observations (obs) and reconstructions (rec); mass balance (MB) from glaciological (glac) and geodetic (geod) methods. For 590 glaciers with no area information available, the average glacier area of the corresponding observation sample was used for estimating the total area covered
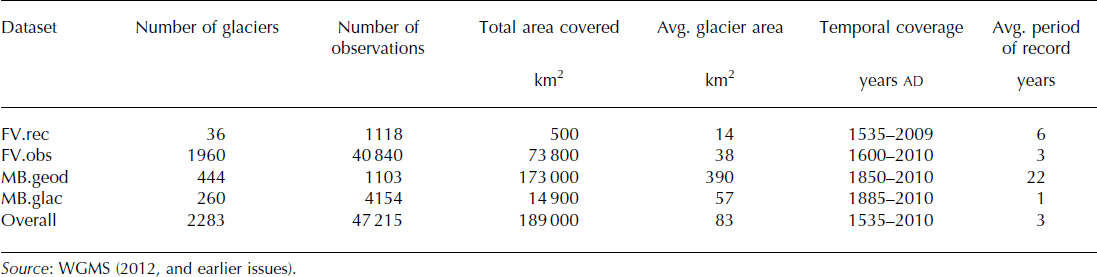
Quantitative information on glacier fluctuations is available from glaciers covering about one-quarter of the current total glacier area (cf. Table 1 and Reference ArendtArendt and others, 2012). Good regional coverage is found in Central Europe, Scandinavia, Iceland, Western North America, New Zealand and the Southern Andes where fluctuation observations have been reported for glaciers covering about half or more of the respective area. Comparatively limited information is available from glaciers around the Greenland and Antarctic ice sheets, Arctic Canada (apart from the large ice caps), Asia and the Low Latitudes (Fig. 2). The amount of information available is much smaller when analysing the coverage from observations carried out in the 21st century (cf. WGMS, 2008a, table 4.1 and figs 4.6 and 4.7; Reference Zemp, Hoelzle and HaeberliZemp and others, 2009). A large number of observation series have been discontinued, especially in North America and Asia. The loss of in situ front variation programmes could be compensated for to some extent by the use of remote-sensing data (Reference Hall, Bayr, Schöner, Bindschadler and ChienHall and others, 2003; Reference Machguth and HussMachguth and Huss, 2014). However, corresponding studies over larger areas have not yet been carried out or reported in a systematic way. In Europe (i.e. CEU, ISL, SCA), glacier monitoring is well established with long-term and ongoing observation series well distributed over the glacier coverage. In spite of the somewhat reduced coverage in the 21st century, the situation in South America is also encouraging, where most countries have set up glacier monitoring programmes that, though relatively few in number, are ongoing in nature (cf. Reference Masiokas, Rivera, Espizua, Villalba, Delgado and AravenaMasiokas and others, 2009; Reference RabatelRabatel and others, 2013).
3.2. Changes in glacier mass and volume
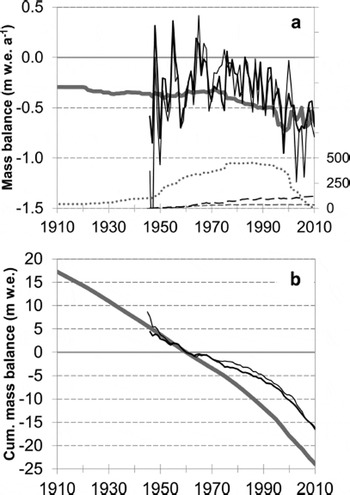
The development in global glacier mass balance since the mid-19th century is depicted in Figure 3 which shows the annual average balances for the glaciological and the geodetic datasets together with the corresponding sample sizes. The difference in survey periods between the glaciological and the geodetic data becomes manifest in the variability of the two graphs: a smooth line with step changes towards more negative balances for the geodetic sample and a strong variability with a negative trend for the glaciological observations. For the glaciological balance, the global mean annual value of the early 21st-century observations (2001–10) is the most negative of all decades, with −0.54 m w.e. a−1. The series shows strong annual variability (standard deviation 1951–2010: 0.25 m w.e. a−1), with negative averages around −0.40 m w.e. a−1 in the 1940s–60s, somewhat reduced mass losses in the 1970s and 1980s of about −0.20 m w.e. a−1, followed by the recent increase in mass loss with −0.47 m w.e. a−1 in the 1990s. Note that the large annual variability around 1950 is due to the very small sample size (i.e. n < 5 and n < 10 before 1955 and 1960, respectively). Due to the smaller sample size, the ‘reference’ glacier curve shows a slightly larger variability but basically follows the development of the full glaciological sample. The global decadal means from the geodetic method show a steady increase in mass loss from the mid-19th to the early 21st century, with only minor mass changes during the 1960s and 1970s. The last decade (2001–10) is clearly the most negative, with a mean annual mass loss of −0.81 m w.e. a−1. Overall, the geodetic results are more negative than the glaciological ones (cf. discussion in Section 4.2). The annual variability (standard deviation 1951–2010: 0.12 m w.e. a−1) is much smaller than the glaciological one, and the increase in the last two decades comes with a stepwise drop in sample size.
Global average of observed mass balances from 1910 to 2010. (a) Annual averages of geodetic (grey) and glaciological (black) balances (dense lines; left y-axis) are shown together with the corresponding number of observed glaciers (dotted and dashed lines for geodetic and glaciological samples, respectively; right y-axis). (b) Cumulative annual averages relative to 1960. In both plots, glaciological balances are given for the full sample (thick black lines) and for the 37 ‘reference’ glaciers (with >30 ongoing observations; thin black lines). The thickness of the (grey) line for the geodetic balances corresponds to the uncertainty of the density conversion (±60 kg m−3). Source: WGMS (2012, and earlier issues).
Regional glacier mass balances derived from both the glaciological and the geodetic methods, including corresponding sample sizes, are shown in Figure 4, and decadal results are summarized in Table 2. Analysing the available observations in the 19 regions, the first decade of the 21st century exhibits the most negative mass balances in the majority of regions with available data, followed by the final decade of the 20th century. For the glaciological sample, the observation period 2001–10 is the most negative decade in nine regions (ASC, ASN, CEU, GRL, ISL, SCA, WNA; in ACN and SJM when ignoring the first decade with limited data coverage), the second most negative after the 1990s in four regions (ALA, ASW, CAU, SAN), and equally negative as the two preceding periods in the Low Latitudes (TRP). Five regions have no (ACS, ANT, ASE, RUA) or too-limited (NZL) observations for such a comparison. A tendency towards increasing mass loss over the past few decades is apparent in most regions (CAN, ALA, ASN, CAU, CEU, GRL, ISL, WNA), while in some there are negative mass loss rates but no clear trend (ASC, SAN, SJM, TRP). A common feature of most regions with long-term data coverage is the reduced mass loss between the 1960s and the 1980s. This feature is even more pronounced in Scandinavia where coastal glaciers were able to gain mass from the 1970s to the 1990s while the glaciers further inland continued to lose mass. In the geodetic sample, the early 21st century is the most negative decade in eight regions (ALA, ANT, ASE, ASW, CAU, CEU, SAN, TRP) and second most negative in one region (WNA). In Scandinavia and Svalbard as well as in Asia North, the geodetic results show few variations but slightly higher mass losses in the early to mid-20th century. The remaining regions have only one dataset (GRL) or no data (ACN, ACS, ASC, ISL, NZL, RUA) reported for the last decade.
Mass-balance details for selected regions from 1930 to 2010. Annual averages of geodetic balances (grey) and of glaciological annual (black) balances. The thickness of the (grey) line for the geodetic balances corresponds to the uncertainty of the density conversion (60 kg m−3). In addition, the number of observation series are given for geodetic (grey dotted) and glaciological annual (black dashed) balances (right y-axis). The regions ACS, ANT, NZL and RUA are not shown because of limited data coverage. Data source: WGMS (2012, and earlier issues).

Regional mass-balance results 1851–2010. The decadal averages (mm w.e.) of both geodetic and glaciological balances are given for all 19 regions, for the global average (of all regions) and for the 37 ‘reference’ glaciers (with >30 continued observations). Negative values smaller than −250 and −500 mm w.e. are highlighted in orange and red, respectively. Positive values greater than 250 and 500 mm w.e. are highlighted in pale and dark blue, respectively. Decadal values based on >100 annual observations are marked in bold

In Figure 5, anomalies of glaciological annual and seasonal balances are plotted to provide insight into the components of the annual mass changes. In the majority of regions, the annual balances are highly correlated with summer balances (ALA, CAN, WNA, SJM, ISL, CEU, ASC, CAU). In two regions (SAN, SCA), the correlation with winter balances is even higher. An exception is Asia North, where the correlations between annual and both seasonal balances are low (maybe because the seasonal balances in fact are net ablation and net accumulation; cf. Reference CogleyCogley and others, 2011). Generally, glaciers with high mass turnover (e.g. seen in ALA, WNA, SCA) also have a high sensitivity of mass balance to temperature and precipitation changes compared to those with low mass turnover (e.g. seen in ACN, ASC; Reference Oerlemans and FortuinOerlemans and Fortuin, 1992). The trend towards increased mass loss over the past few decades is clearly driven by enhanced summer melt in Alaska, Arctic Canada North, Central Europe, Iceland and Western North America. Winter balances seem to be of secondary importance and show no common trend; there are regions with no trend (e.g. CEU, ACN) and regions with a tendency towards increasing (e.g. ALA, WNA) or decreasing (e.g. ASC, CAU) winter balances over the past few decades.
Seasonal mass-balance anomalies for selected regions from 1950 to 2010. Annual averages of glaciological annual (black), winter (blue) and summer (red) balance anomalies are shown. For each region, the anomalies are calculated as annual deviations from the arithmetic mean balances of years with seasonal data. Sample Pearson correlation coefficients (r) are given for winter (B w) and annual (B a) as well as for summer (B s) and annual (B a) balance samples. The sample size of the seasonal balances is generally smaller than the annual glaciological sample as given in Figure 4. The regions ACS, ANT, ASE, ASW, GRL, NZL, RUA and TRP are not shown due to a lack of data. Data source: WGMS (2012, and earlier issues).

An especially interesting case is Scandinavia, where there is a clear trend toward increased summer balance partly compensated for by increased winter balance. This compensation effect, however, only becomes visible at a sub-regional scale: in southern Norway, the coastal glaciers were able to gain mass and readvance, culminating during the 1990s, whereas the more continental glaciers further inland showed only minor mass gains and continued their retreat (Reference Andreassen, Elvehøy, Kjøllmoen, Engeset and HaakensenAndreassen and others, 2005). Similarly, a look at sub-regional scales is required to explain the mass-balance results in North America (ALA, WNA). First, the strong continental influences across the Cordillera are obliterated by a bias in the observational sample towards maritime glaciers in the west of the Cordillera where mass turnover can be very high. Secondly, there is a strong north–south bifurcation of winter mass balances in relation to Pacific Decadal Oscillations (cf. Reference Demuth and BonardiDemuth and others, 2008, and references therein). Such a regime shift in 1976 has biased the storm tracks northward, thereby increasing winter balances in Alaska while starving the glaciers in the Southern Cordillera (WNA). In Central Asia, the few available seasonal balance series indicate a decrease in both summer balance and winter balance which would correspond to a reduced mass turnover. A more detailed analysis, however, shows that this effect stems mainly from the discontinuation of the former Soviet series in the 1990s and the ensuing sample bias in favour of the continued series of the Tien Shan (i.e. Ürümqi Glacier No. 1 in China and Ts. Tuyuksuyskiy in Kazakhstan).
3.3. Changes in glacier length (front variation)
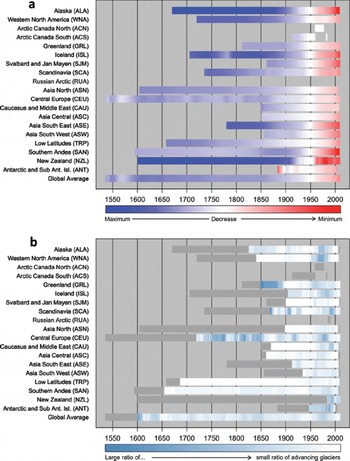
The global compilation of front variation data, as qualitatively summarized in Figure 6, shows that glacier retreat has been dominant for the past two centuries, with LIA maximum extents reached (in some regions several times) between the mid-16th and the late 19th centuries. The qualitative summary of cumulative mean annual front variations (Fig. 6a) reveals a distinct trend toward global centennial glacier retreat, with the early 21st century marking the historical minimum extent in all regions (except NZL and ANT, where few observations are available) at least for the time period of documented front variations. For New Zealand and the Antarctic, a larger variability stands out but can be explained by the small quantitative front variation sample which is limited to a few records. Intermittent periods of glacier readvance, such as those in the Alps around the 1920s and 1970s or in Scandinavia in the 1990s, are hardly visible in Figure 6a because they do not even come close to achieving LIA maximum extents. Figure 6b provides a better overview of these readvance periods by highlighting the years with a larger ratio of advancing glaciers. In this figure, the ratio of advancing glaciers in the sample is indicated qualitatively by colours ranging from white for years with no reported advances to dark blue for years with a large ratio of advancing glaciers. It becomes evident that glacier readvance periods are found at the regional and decadal scale but are restricted to a fraction of the observed samples (90% of the years have values <36%). In the European Alps, the annual ratio of advancing glaciers ranged in the observed sample between 32% and 70% in the 1965–85 period. In Scandinavia it ranged between 42% and 66% in the 1990s. Due to different reaction and response times, individual glaciers did not show the readvance in the same years and some glaciers did not readvance at all. Globally synchronous periods with a large ratio of advancing glaciers are found before 1850 (30% in the 1830s and 1840s) and around 1975 (37% in the 1970s). By contrast, the 1930s, 1940s and the beginning of the 21st century stand out as the period with very low ratios in all regions (with decadal averages of 10% or lower). The observations from the Low Latitudes (TRP) show a continuous retreat since the late 17th century with no readvance period in the (limited) sample until the early 20th century. Periods with very small data samples tend to show extreme ratios which are not plausible. As a consequence, years with a small sample size (n < 6) are masked in dark grey.
Global front variation observations from 1535 to 2010. (a) Qualitative summary of cumulative mean annual front variations. The colours range from dark blue for maximum extents (+2.5 km) to dark red for minimum extents (–1.6 km) relative to the extent in 1950 as a common reference (i.e. 0 km in white). (b) Qualitative summary of the ratio of advancing glaciers. The colours range from white for years with no reported advances to dark blue for years with a large ratio of advancing glaciers (192 of 3138 records >50%). Periods with very small data samples (n < 6) are masked in dark grey. The figure is based on all available front variation observations and reconstructions, excluding absolute annual front variations larger than 210 m a−1 to reduce effects of calving and surging glaciers. Source: WGMS (2012, and earlier issues).
4. Discussion
4.1. Global centennial glacier retreat and mass loss
The retreat of glaciers from their LIA (and Holocene) moraines and trimlines can be observed in the field as well as on aerial and satellite images for tens of thousands of glaciers around the world (e.g. Reference GroveGrove, 2004; Reference Svoboda and PaulSvoboda and Paul, 2009; Reference Davies and GlasserDavies and Glasser, 2012; Reference Kargel, Leonard, Bishop, Kääb and RaupKargel and others, 2014). Large collections of historical and modern photographs (NSIDC, 2009, updated 2015) document this change in a qualitative manner. The dataset presented here allows these changes to be quantified at samples ranging from a few hundred to a few thousand glaciers with observation series. There is a global trend to centennial glacier retreat from LIA maximum positions, with typical cumulative values of several hundred to a few thousand metres. In various mountain ranges, glaciers with decadal response times have shown intermittent readvances which, however, were short and thus much less extensive when compared to the overall frontal retreat. The most recent readvance phases were reported from Scandinavia and New Zealand in the 1990s (Reference Andreassen, Elvehøy, Kjøllmoen, Engeset and HaakensenAndreassen and others, 2005; Reference Chinn, Winkler, Salinger and HaakensenChinn and others, 2005; Reference Purdie, Anderson, Chinn, Owens, Mackintosh and LawsonPurdie and others, 2014) or from (mainly surge-type glaciers in) the Karakoram at the beginning of the 21st century (Reference HewittHewitt, 2007; Reference Rankl, Kienholz and BraunRankl and others, 2014).
Early (geodetic) mass-balance measurements indicate moderate decadal ice losses of a few dm w.e. a−1 in the second half of the 19th and at the beginning of the 20th century, followed by increased ice losses around 0.4 m w.e. a−1 in the 1940s and 1950s (Table 2). Larger data samples (from both methods) with better global coverage document adequately the period of moderate ice loss which followed between the mid-1960s and mid-1980s, as well as the subsequent acceleration in ice loss to >0.5 m w.e. a−1 in the first decade of the 21st century. Looking at individual fluctuation series, a high variability and sometimes opposite behaviour of neighbouring glaciers are found which can be explained by differences in glacier hypsometry and aspect and thus accumulation conditions (Reference Kuhn, Markl, Kaser, Nickus, Obleitner and SchneiderKuhn and others, 1985), or debris cover (Reference Nakawo, Raymond and FountainNakawo and others, 2000; Reference Scherler, Bookhagen and StreckerScherler and others, 2011), or differences in resulting response time (Reference Jóhannesson, Raymond and WaddingtonJóhannesson and others, 1989; Pelto and Hedlund, 2001). In some cases local differences are also due to ice dynamics rather than climate forcing (e.g. for glaciers dominated by calving (cf. Reference Benn, Warren and MottramBenn and others, 2007) or surging (cf. Reference Lingle and FatlandLingle and Fatland, 2003; Reference Yde and PaascheYde and Paasche, 2010; Reference NuthNuth and others, 2013) processes). The present observational dataset thus confirms the findings from earlier scientific studies (e.g. Reference Dyurgerov and MeierDyurgerov and Meier, 2005; Reference Kaser, Cogley, Dyurgerov, Meier and OhmuraKaser and others, 2006; WGMS, 2008a; Reference CogleyCogley, 2009; Reference Zemp, Hoelzle and HaeberliZemp and others, 2009; Reference GardnerGardner and others, 2013). At the same time, the observational evidence is in strong contrast to statements repeatedly made in the grey literature claiming that (1) glacier retreat or mass loss could not be substantively evidenced globally (e.g. Reference CrichtonCrichton, 2004; Reference Easterbrook, Ollier and CarterEasterbrook and others, 2013) or that (2) glaciers are globally not retreating but advancing (e.g. Reference FelixFelix, 1999, Reference Felix2014). In both cases, conclusions are drawn from small and biased data samples, ignoring the large amount of qualitative and quantitative information available on glacier fluctuations from all around the world.
4.2. Differences in glacier mass budgets between samples and methods
At a global level, the mass budgets from the geodetic sample tend to be more negative than the glaciological results (Fig. 3). Several studies have already detected similar differences and raised the question of whether this is because of differences in observation methods (Reference Lang and PatzeltLang and Patzelt, 1971; Reference KrimmelKrimmel, 1999; Reference Østrem and HaakensenØstrem and Haakensen, 1999; Reference Cox and MarchCox and March, 2004) or a bias in the glacier sample (e.g. Reference Kaser, Cogley, Dyurgerov, Meier and OhmuraKaser and others, 2006). Earlier studies showed that the glaciological dataset is subject to issues related to moving sample size. However, the temporal variability and the absolute cumulative values of the global glaciological sample agree well with corresponding values of the subset of ‘reference’ glaciers with >30 years of continued observation (cf. Reference Zemp, Hoelzle and HaeberliZemp and others, 2009). Also, looking at differences in observation methods in individual regions, the overall trends from the glaciological and geodetic methods agree well (ASC, ASE, ASN, ASW, ISL, SCA, SJM, WNA). The larger biases seem to stem from differing glacier samples at a regional level as discussed below.
In Alaska, the results from the large geodetic sample follow the general trend of the glaciological sample but are clearly more negative. Here the positive bias of the glaciological method can be explained, at least partly, by the inclusion of (several) retreating tidewater glaciers contained in the geodetic record. The glaciological record basically includes only (the advancing) Taku Glacier, also found in the geodetic record. In the Caucasus and Middle East region (CAU) the poor fit in the last two decades is caused by the very small geodetic sample size, and an unfortunate mixture of the moderately negative values from the Caucasus glaciers with the strongly negative values from Alamkouh Glacier, Iran. In the Southern Andes, the glaciological curve is dominated by the very small glaciers Echaurren Norte and Piloto Este in the central Andes, and by Martial Este in Tierra del Fuego, whereas the geodetic results reflect the changes in the huge Northern and Southern Patagonia Icefields with their large outlet glaciers. In other regions, the samples are simply too small for a sound comparison (ACS, ANT, GRL, NZL, RUA).
Sometimes generic differences between the geodetic and glaciological methods are used to explain the different results. For example, the density conversion remains a critical issue when converting volume changes into mass changes (Reference HussHuss, 2013). This conversion reduces the absolute values of the geodetic method but, at least in the present study, the reduction is too small to explain the differences. This can be seen in Figures 3 and 4 where the thickness of the (grey) line for the geodetic balances corresponds to ±60 kg m−3. Another generic difference is internal accumulation which can be important for polythermal and cold glaciers. Internal accumulation is usually not captured by the glaciological method (Reference ZempZemp and others 2013), i.e. one could expect a negative bias of the glaciological results in such regions (e.g. ACN, ASN, SJM). However, this is only indicated in four out of eleven decades in total, with common data in these four regions. In summary, the differences between geodetic and glaciological balances are due to differences in the corresponding samples and, hence, not due to generic differences between the two methods. These findings are in line with studies by Reference CogleyCogley (2009) and Reference ZempZemp and others (2013) which analyse glaciological and geodetic mass-balance results from common survey periods. After considering measurement uncertainties, both studies find no significant generic difference between the two methods.
4.3. Historically unprecedented early 21st-century decline
When comparing decadal mean values of available mass-balance data, it becomes evident that the first decade of the 21st century exhibits the most negative mass balances since the beginning of observational records (with glaciological and geodetic balances of −0.5 and −0.8 m w.e. a−1, respectively), followed by the last decade of the 20th century (with balances around −0.5 m w.e. a−1; cf. Table 2). This also holds true for most of the regions with available data. The few exceptions of regions with good data samples and without a clear tendency to more negative balance in the past two decades are Northern Asia, Scandinavia and Svalbard. In these regions, the Arctic amplification (cf. Reference Serreze and BarrySerreze and Barry, 2011) apparently has not affected the observed glaciers, possibly due to their cold or polythermal regime (Reference DowdeswellDowdeswell and others, 1997; Reference Hagen, Kohler, Melvold and WintherHagen and others, 2003). For extending this picture globally and back in time, we can include the length change dataset but have to consider that the frontal variation of a glacier is an indirect, delayed and filtered response to climatic changes of the past (Reference Jóhannesson, Raymond and WaddingtonJóhannesson and others, 1989). As a consequence, a direct and quantitative comparison of length change rates is not straightforward but requires analytical or numerical models that consider climate sensitivity as well as reaction and response times of each individual glacier. Such reconstructed decadal change rates are available from studies by Reference Hoelzle, Haeberli, Dischl and PeschkeHoelzle and others (2003; between −0.1 and −0.3 m w.e. a−1 since the mid-19th century), Reference Haeberli and HolzhauserHaeberli and Holzhauser (2003; −0.4 m w.e. a−1 for the 20th century and between +0.5 and −0.5 m w.e. a−1 for the past 2000 years) and Reference Leclercq, Oerlemans and CogleyLeclercq and others (2011; −0.2 and −0.3 m w.e. a−1 for the periods 1800–2005 and 1850–2005, respectively). They all indicate that current mass loss rates are indeed without precedent, at least for the observational time period and probably also for recorded history (Reference Haeberli and HolzhauserHaeberli and Holzhauser, 2003; Reference Holzhauser, Magny and ZumbühlHolzhauser and others, 2005; Reference Luckman, Demuth, Munro and YoungLuckman, 2006; Reference JomelliJomelli and others, 2011; Reference Le RoyLe Roy and others, 2015). Only Reference Marzeion, Jarosch and HoferMarzeion and others (2012) report modelled mass loss rates higher in the 1930s than in the early 21st century (especially in the regions GRL, RUA, ACN and ACS). However, they state that this result may be biased by marine-terminating glaciers, as their model is not able to distinguish mass loss from ice afloat or grounded/land-based.
4.4. Glaciological interpretation of glacier changes
The worldwide retreat of glaciers is probably the most prominent icon of global climate change. The causality of global warming and melting ice is obvious and well understood, at least in principle, by the general public. In detail, the link between regional climatic forcing and glacier front variation is complicated by topographic factors (e.g. glacier hypsometry, slope, aspect) and resulting reaction and response times (cf. Reference Jóhannesson, Raymond and WaddingtonJóhannesson and others, 1989), which can result in completely different reactions of neighbouring glaciers (Reference Kuhn, Markl, Kaser, Nickus, Obleitner and SchneiderKuhn and others, 1985). In this regard it is noteworthy that the global glacier sample shows a largely homogeneous retreat both at the centennial timescale and also over the past few decades. This homogeneous change in a sample covering a wide range of response times is also strong evidence that these changes are not the results of random variability but of globally consistent climatic forcing (cf. Reference Reichert, Bengtsson and OerlemansReichert and others, 2002; Reference RoeRoe, 2011). In more detail, a quantitative link of glacier length changes to climatic conditions is possible through glacier mass- and energy-balance modelling in consideration of glacier dynamics (e.g. Reference OerlemansOerlemans, 2001, and references therein; Reference Leclercq and OerlemansLeclercq and Oerlemans, 2012).
The geodetic method allows glacier mass changes to be documented at decadal timescales, while the glaciological method provides quantitative insights at annual and seasonal resolution. The measurements indicate that centennial glacier retreat, at least since the mid-20th century, has been driven mainly by summer balance (in most regions dominated by ablation processes), with winter balances (in most regions dominated by accumulation processes) contributing mostly to intermittent decadal periods of glacier mass gain (Fig. 5) and readvances. The balanced mass budgets exhibited in the 1970s were followed by accelerated mass losses in many regions, becoming more homogeneous at the global scale in the past few decades. During the first decade of the 21st century, glaciers lost almost 0.7 m w.e. a−1 of ice, when averaging the results of glaciological and geodetic observations. By simply weighting the regional averages with corresponding regional glacier areas, this results in an annual global contribution of almost 500 Gt a−1 to runoff, or of 1.37 mm a−1 to mean sea-level rise. Corresponding mean annual values for the 1970s/80s/90s are 150/160/390 Gt a−1 or 0.42/0.43/1.08 mm a−1, giving a cumulated contribution of 33 mm to mean sea-level rise over the past four decades. The latter values are slightly higher than earlier studies using similar glaciological and geodetic datasets but different ways of averaging (e.g. Reference Kaser, Cogley, Dyurgerov, Meier and OhmuraKaser and others, 2006; Reference CogleyCogley, 2009). The corresponding annual contributions to sea-level rise for the 6 year period 2004–09 were 360 Gt a−1 (260 Gt a−1 when excluding GRL and ANT) or 0.98 mm a−1. This is 37% (23% when excluding GRL and ANT) higher than estimates based mainly on satellite gravimetry and altimetry by Reference GardnerGardner and others (2013). Hence, further research is needed in order to assess the influence of different data samples and observation techniques on regional and global estimates of glacier mass budgets.
The above estimates can be extended by the committed mass loss due to strong imbalance, especially of large glaciers, which are the primary contributors to sea-level change. For this purpose, mass balance and AAR are used to calculate the committed loss in glacier area as (1 - AAR)/AAR0 (cf. Reference Mernild, Lipscomb, Bahr, Radić and ZempMernild and others, 2013). Figure 7 provides an estimate of the committed change in glacier area under a constant climate (i.e. average conditions of period 2001–10), based on the ratio between the decadal average AAR and the balanced-budget AAR0. The available observations indicate a further area loss between 25% and 65% in ten regions. Accounting for regional and global undersampling errors, Reference Mernild, Lipscomb, Bahr, Radić and ZempMernild and others (2013) estimated an additional contribution to global mean sea-level rise of 0.16 ± 0.07 m even without further global warming. This committed ice loss will occur on decade-to-century timescales depending on the glacier’s response time (Reference Jóhannesson, Raymond and WaddingtonJóhannesson and others, 1989). Remaining key challenges in these estimates are the representativeness of available observation series for the glaciers and regions where the large ice volumes are stored (e.g. Reference Zemp, Hoelzle and HaeberliZemp and others, 2009; Reference HussHuss, 2012), as well as the question of how much of the meltwater will reach the ocean (e.g. Reference Haeberli and LinsbauerHaeberli and Linsbauer, 2013; Reference Loriaux and CasassaLoriaux and Casassa, 2013; Reference Neckel, Kropácek, Bolch and HochschildNeckel and others, 2014).
Committed glacier area loss based on AAR observations from 2001 to 2010. This indicator is based on the ratio between the decadal average AAR and the balanced budget AAR0 and provides an estimate of the committed loss in surface area under sustained climatic conditions as in the period 2001–10. Regions with <20 observations are indicated by pale colours. There are no AAR observations of the corresponding period available for ACS, ASE and RUA. Data source: WGMS (2012, and earlier issues).

Glacier mass balances stemming from both the glaciological and geodetic methods provide conventional balances which incorporate both climatic forcing and changes in glacier hypsometry and represent glacier contribution to runoff. For climate–glacier investigations over longer time periods, the reference-surface balance might be a more relevant quantity (cf. Reference Elsberg, Harrison, Echelmeyer and KrimmelElsberg and others, 2001; Reference PaulPaul, 2010; Reference Huss, Hock, Bauder and FunkHuss and others, 2012). Attributing glacier mass budgets to anthropogenic forcing requires the application of numerical modelling. Recently, Reference Marzeion, Cogley, Richter and ParkesMarzeion and others (2014) showed that glacier mass changes in the late 19th and the first half of the 20th century can be explained satisfactorily by natural variability, whereas the ice loss of the past few decades requires that anthropogenic forcing be included.
4.5. The need for a comprehensive uncertainty assessment
A basic requirement of any change study is the definition and delineation of the glacier boundaries and an assessment of uncertainties related to debris covers, dead ice bodies, adjacent perennial snowfields and the bergschrund. In addition, glaciological and geodetic balances are subject to systematic and random errors as well as to generic differences that need to be accounted for in a direct comparison. For the glaciological method, the three main error sources are the field measurements (at point locations), the spatial extrapolation of these results to the entire glacier, and the change in glacier hypsometry (Reference ZempZemp and others, 2013). For the geodetic method, the various sources of potential errors can be generally categorized into sighting and plotting processes. They are usually assessed by means of statistical approaches using the population of digital elevation model (DEM) differences over non-glacier terrain (Reference Berthier, Arnaud, Baratoux, Vincent and RémyBerthier and others, 2004; Reference Rolstad, Haug and DenbyRolstad and others, 2009; Reference Nuth and KääbNuth and Kääb, 2011; Reference ZempZemp and others, 2013). The correct interpolation of data voids in the resulting difference grids (Reference KääbKääb, 2008) is still a matter to be dealt with, while issues of co-registration (Reference Nuth and KääbNuth and Kääb, 2011) and cell size differences (Reference PaulPaul, 2008) seem to be basically solved (Reference Gardelle, Berthier and ArnaudGardelle and others, 2012a). In addition, generic differences and related uncertainties with respect to time systems, density conversions, as well as internal and basal balances need to be considered (Reference ZempZemp and others, 2013).
In applications, the assessment of uncertainties is challenged by the lack of observational error estimates and by the small size of the glacier samples, which in addition are subject to shifting population effects. Thus these global and regional glacier change assessments have had to rely so far on basic uncertainty assumptions and some statistical considerations. As a consequence, the resulting error bars or confidence envelopes are often unrealistically small or large (cf. Reference CogleyCogley, 2009). In the first case, the small error bars can be challenged easily by including or excluding long-term data records (e.g. from tidewater glaciers) contradicting the general trend. In the second case, the error bars are set so conservatively that the annual or pentadal averaged mass budgets become insignificantly different from zero in spite of the observational fact that glaciers are losing volume and retreating.
Future research is urgently required to address the uncertainty assessment of glacier changes in a more comprehensive way, making use of the recent progress in understanding observational uncertainties (e.g. Reference ZempZemp and others, 2013, and references therein) and by improving current approaches for the extrapolation from the observational sample to the total glacier coverage (e.g. Reference Paul and HaeberliPaul and Haeberli, 2008; Reference CogleyCogley, 2009). To this end, the latest (almost) globally available DEMs allow geodetic volume changes of individual glaciers to be computed over entire mountain ranges (e.g. Reference Berthier, Schiefer, Clarke, Menounos and RémyBerthier and others, 2010, Reference Berthier2014; Reference Gardelle, Berthier and ArnaudGardelle and others, 2012b; Reference Fischer, Huss and HoelzleFischer and others, 2014). Such studies allow approaches to be developed and tested for extrapolating the results from local observation series with high temporal resolution to the entire glacier population in consideration of the regional climate variability and the local glacier hypsometry (e.g. Reference Paul and HaeberliPaul and Haeberli, 2008; Reference HussHuss, 2012).
5. Conclusions and Outlook
More than a century of internationally coordinated glacier monitoring efforts have resulted in a comprehensive collection of data on worldwide glacier fluctuations. This dataset is not perfect but nevertheless constitutes a unique treasure for the scientific analysis of glacier changes. Direct glaciological measurements are available only for a few hundred glaciers but they provide rich insights into the annual variability and seasonal components of glacier mass changes. The volume changes from the geodetic method come at lower temporal resolution but allow the glaciological sample to be extended in both space and time. A large number of datasets from recent studies using DEM differencing is expected to be provided soon to the database. Observations of front variations provide indirect and more qualitative information on glacier changes. They help to complete the global picture in regard to ongoing trends and can be exploited in a quantitative way using numerical modelling. With records dating back into the LIA, they represent a key element for understanding the changes that occurred in past centuries.
The globally observed mass loss rates of the early 21st century that are revealed via the glaciological and geodetic methods are unmatched in the time period of observational records, or even of recorded history. The observed rate from the glaciological mass balances is significantly more negative than the average for the second half of the 20th century (−0.54 m w.e. a−1 vs −0.33 m w.e. a−1). The value derived from the geodetic method is four, three and two times larger than the averages of the periods 1851–1900, 1901–50 and 1951–2000, respectively. At a regional level, the picture is more variable but clearly shows the excessive mass loss observed in the two most recent decades from 1991 to 2010. The increased mass loss over the past few decades is driven mainly by summer balances which are dominated in most regions by ablation processes. Winter balances seem to be of secondary importance and show no common trend. As a consequence of both the extended period of mass loss and the delayed dynamic reaction, glaciers in many regions are in strong imbalance with current climatic conditions and, hence, destined to further substantial ice loss. The observed retreat of glacier tongues from LIA moraines and trimlines together with the available (partly annual) front variation measurements over the past century provide clear evidence that the existing observation network covers the global and regional range of changes very well, at least in a qualitative way. However, a quantitative assessment of glacier change rates and the determination of related uncertainties require a better understanding of the representativeness of the observational network for the entire glacier cover in each region.
With a view to climate change scenarios for the end of this century and corresponding studies related to the modelling of future glacier changes (Reference Church and StockerChurch and others, 2013, and references therein), we must anticipate further glacier loss far beyond historical precedent. It is the duty of the internationally coordinated glacier monitoring community to document these changes. Related key tasks will be to: (1) continue and extend the long-term glaciological measurement programmes, (2) provide the corresponding results at the optimal level (e.g. including seasonal components, balance distribution with elevation; cf. Reference BraithwaiteBraithwaite, 2009) for further process understanding and model calibration, (3) intensify the compilation of geodetic data in order to assess glacier volume changes over entire mountain ranges, (4) extend the dataset of glacier front variations from observations and reconstructions both in space and back in time making use of existing remote-sensing data, (5) better understand and openly discuss the uncertainties of in situ, air- and spaceborne methods as well as their representativeness for an individual glacier and the entire glacier coverage, and last but not least (6) make all data freely available through the designated world data centers and services.
Author Contribution Statement
M. Zemp designed, wrote and revised the manuscript. M. Zemp, H. Frey, and F. Denzinger analysed the data and designed the map, figures and tables. All co-authors contributed to the discussion and writing of the manuscript. The WGMS staff members compiled all data during periodical calls-for-data that are coordinated by the National Correspondents within their countries.
Acknowledgements
We thank the thousands of observers and their sponsoring agencies (as listed in our data reports, i.e. WGMS (2012, 2013), and earlier issues) from around the globe for long-term collaboration and willingness to share glacier observations. All data were compiled and made freely available by the World Glacier Monitoring Service (and its predecessor organizations). We thank two anonymous reviewers for constructive comments, and Susan Braun-Clarke for carefully polishing the English. M. Zemp, H. Frey, I. Gärtner-Roer and S.U. Nussbaumer acknowledge financial support by the Swiss GCOS Office at the Federal Office of Meteorology and Climatology MeteoSwiss, and F. Paul by the European Space Agency project Glaciers_cci (4000109873/14/I-NB). This is NRCan/ESS Contribution No. 20150094.
Appendix: List of WGMS National Correspondents since 2012
Ahlstrøm A.P.,1 Anderson B.,2 Arenillas M.,3 Bajracharya S.,4 Baroni C.,5 Bidlake W.R.,6 Braun L.N.,7 Cáceres B.,8 Casassa G.,9 Ceballos J.L.,10 Cobos G.,11 Dávila L.R.,12 Delgado Granados H.,13 Demberel O.,14 Demuth M.N.,15 Espizua L.,16 Fischer A.,17 Fujita K.,18 Gadek B.,19 Ghazanfar A.,20 Hagen J.O.,21 Hoelzle M.,22 Holmlund P.,23 Karimi N.,24 Li Z.,25 Martínez De Pisón E.,3 Pelto M.,26 Pitte P.,27 Popovnin V.V.,28 Portocarrero C.A.,29 Prinz R.,30 Ramirez J.,31 Rudell A.,32 Sangewar C.V.,33 Severskiy I.,34 Sigurðsson O.,35 Soruco A.,36 Tielidze L.,37 Usubaliev R.,38 Van Ommen T.,39 Vincent C.,40 Yakovlev A.41
-
1 National Correspondent for Greenland (GL), Geological Survey of Denmark and Greenland, Copenhagen, Denmark
-
2 National Correspondent for New Zealand (NZ), Victoria University of Wellington, Wellington, New Zealand
-
3 Former National Correspondent for Spain (ES), Ingeniería 75, S.A., Madrid, Spain
-
4 National Correspondent for Nepal (NP), International Centre for Integrated Mountain Development, Kathmandu, Nepal
-
5 National Correspondent for Italy (IT), University of Pisa, Pisa, Italy
-
6 Former National Correspondent for the United States of America (US), US Geological Survey, Tacoma, WA, USA
-
7 National Correspondent for Germany (DE), Bavarian Academy of Sciences, Munich, Germany
-
8 National Correspondent for Ecuador (EC), Instituto Nacional de Meteorología e Hidrología, Quito, Ecuador
-
9 National Correspondent for Chile (CL) & Antarctica (AQ), Universidad de Magallanes, Punta Arenas, Chile
-
10 National Correspondent for Colombia (CO), Instituto de Hidrología, Meteorología y Estudios Ambientales, Bogotá, Colombia
-
11 National Correspondent for Spain (ES) & Antarctica (AQ), Universidad Politécnica de Valencia, Valencia, Spain
-
12 National Correspondent for Peru (PE), Unidad de Glaciología y Recursos Hídricos, Huaraz, Peru
-
13 National Correspondent for México (MX), Universidad Nacional Autónoma de México, México D.F., México
-
14 National Correspondent for Mongolia (MN), Khovd University, Khovsd aimag, Mongolia
-
15 National Correspondent for Canada (CA), Natural Resources Canada, Ottawa, Canada
-
16 Former National Correspondent for Argentina (AR) & Antarctica (AQ), Instituto Argentino de Nivología, Glaciología y Ciencias Ambientales, Mendoza, Argentina
-
17 National Correspondent for Austria (AT), Österreichische Akademie der Wissenschaften, Innsbruck, Austria
-
18 National Correspondent for Japan (JP), Nagoya University, Nagoya, Japan
-
19 National Correspondent for Poland (PL), University of Silesia, Sosnowiec, Poland
-
20 National Correspondent for Pakistan (PK), Global Change Impact Studies Center, Islamabad, Pakistan
-
21 National Correspondent for Norway (NO), University of Oslo, Oslo, Norway
-
22 National Correspondent for Switzerland (CH), University of Fribourg, Fribourg, Switzerland
-
23 National Correspondent for Sweden (SE), University of Stockholm, Stockholm, Sweden
-
24 National Correspondent for Iran (IR), Ministry of Energy, Tehran, Iran
-
25 National Correspondent for China (CN), Cold and Arid Regions Environmental and Engineering Research Institute, Lanzhou, China
-
26 National Correspondent for the United States of America (US), Nichols College, Dudley, MA, USA
-
27 National Correspondent for Argentina (AR) & Antarctica (AQ), Instituto Argentino de Nivología, Glaciología y Ciencias Ambientales, Mendoza, Argentina
-
28 National Correspondent for Russia (RU), Moscow State University, Moscow, Russia
-
29 Former National Correspondent for Peru (PE), Unidad de Glaciología y Recursos Hídricos, Huaraz, Peru
-
30 National Correspondent for Kenya (KE), Tanzania (TZ) & Uganda (UG), University of Innsbruck, Innsbruck, Austria
-
31 Former National Correspondent for Colombia (CO), Instituto Colombiano de Geología y Minería, Bogotá, Colombia
-
32 Former National Correspondent for Australia (AU), Antarctica (AQ) & Indonesia (ID), Australian Antarctic Division, Victoria, Australia
-
33 National Correspondent for India (IN), Geological Survey of India, Lucknow, India
-
34 National Correspondent for Kazakhstan (KZ), Institute of Geography, Almaty, Kazakhstan
-
35 National Correspondent for Iceland (IS), Icelandic Meteorological Office, Reykjavík, Iceland
-
36 National Correspondent for Bolivia (BO), Universidad Mayor de San Andres, La Paz, Bolivia
-
37 National Correspondent for Georgia (GE), Ivane Javakhishivili Tbilisi State University, Tbilisi, Georgia
-
38 National Correspondent for Kyrgyzstan (KG), Central Asian Institute of Applied Geosciences, Bishkek, Kyrgyzstan
-
39 National Correspondent for Australia (AU) & Antarctica (AQ), Australian Antarctic Division, Tasmania, Australia
-
40 National Correspondent for France (FR), Laboratory of Glaciology and Environmental Geophysics, Saint-Martin-d’Hères, France
-
41 National Correspondent for Uzbekistan (UZ), Center of Hydrometeorological Service, Tashkent, Uzbekistan


 Open access

