


Introduction
Global insect monitoring programmes require standard sampling methods so that data and results can be compared between distant times and places. Because butterfly species assemblages (Lepidoptera: Papilionoidea) reflect changes in abundance, diversity, and species composition of key taxa (e.g., Bazelet and Samways Reference Bazelet and Samways2012; Syaripuddin et al. Reference Syaripuddin, Sing and Wilson2015), butterflies are often used as an indicator taxon in biodiversity monitoring, both in temperate and tropical regions (e.g., Brereton et al. Reference Brereton, Roy, Middlebrook and Warren2011; Luk et al. Reference Luk, Basset, Kongnoo, Hau and Bonebrake2019; Van Swaay and Warren Reference Van Swaay and Warren2012). Transect counts of butterflies, also known as Pollard walks (e.g., Basset et al. Reference Basset, Eastwood, Sam, Lohman, Novotny, Treuer, Miller, Weiblen, Pierce, Bunyavejchewin, Sakchoowong, Kongnoo and Osorio-Arenas2013; Habel et al. Reference Habel, Ulrich, Eberle and Schmitt2022), have long been used as a standard approach to quantify butterfly abundance and diversity, especially in temperate regions. However, this method is less effective in tropical forests, where biodiversity is concentrated, because of difficulties in observing the distinct and diverse canopy butterfly community (Basset Reference Basset2003; De Vries Reference De Vries1988). Furthermore, canopy and understory species assemblages respond differently to human disturbance (Whitworth et al. Reference Whitworth, Villacampa, Brown, Huarcaya, Downie and MacLeod2016), so that sampling only understory species may provide an incomplete picture of overall community trends. An alternative method for quantitative sampling of tropical forest butterflies has therefore become widespread, namely the use of bait traps (Freitas et al. Reference Freitas, Agra, Pereira, Oliveira, Bandini, Alves, Batista, Marini-Filho, Mattos and Uehara-Prado2014; Hughes et al. Reference Hughes, Daily and Ehrlich1998; Rydon Reference Rydon1964; Van Swaay et al. Reference Van Swaay, Regan, Ling, Bozhinovska, Fernandez, Marini-Filho, Huertas, Phon, Kőrösi, Meerman, Pe’er, Uehara-Prado, Sáfián, Sam, Shuey, Taron, Terblanche and Underhill2015).
Two widely used types of bait for sampling tropical butterflies are fruit and carrion, and it is well known that each bait samples a somewhat different, although overlapping, part of the butterfly community (Álvarez et al. Reference Álvarez, Clavijo-Giraldo, Uribe, Pyrcz, Iserhard, Freitas and Marín2022; Checa et al. Reference Checa, Donoso, Rodriguez, Levy, Warren and Willmott2019; Hamer et al. Reference Hamer, Hill, Benedick, Mustaffa, Chey and Maryati2006; Whitworth Reference Whitworth, Huarcaya, Mercado, Braunholtz and MacLeod2018). These different species assemblages are associated with differing feeding behaviour and life histories: most butterflies attracted to fruit-baited traps are forest species that naturally obtain sugars from rotting fruit instead of flower nectar (Freitas et al. Reference Freitas, Agra, Pereira, Oliveira, Bandini, Alves, Batista, Marini-Filho, Mattos and Uehara-Prado2014). Butterflies typically captured in carrion-baited traps are those often seen feeding naturally on animal carcasses, scat, or bird droppings, a feeding behaviour that likely provides similar nutrients to puddling in damp soil (Hall and Willmott Reference Hall and Willmott2000). Preferences for fruit over nectar and carrion over puddling seem to be phylogenetically conserved and may be related in part to microhabitat, with, in our experience, forest-interior (vs edge) species favouring the former in each case (Checa et al. Reference Checa, Donoso, Rodriguez, Levy, Warren and Willmott2019; Hall and Willmott Reference Hall and Willmott2000; Whitworth et al. Reference Whitworth, Huarcaya, Mercado, Braunholtz and MacLeod2018). As a result, butterfly species consistently sampled by fruit and carrion baits can be thought of as partly overlapping guilds or functional groups, which might potentially respond differently to disturbance and environmental change.
The most widely used bait for butterfly monitoring is fermented banana (DeVries Reference De Vries1988; Freitas et al. Reference Freitas, Agra, Pereira, Oliveira, Bandini, Alves, Batista, Marini-Filho, Mattos and Uehara-Prado2014; Hughes et al. Reference Hughes, Daily and Ehrlich1998; Van Swaay et al. Reference Van Swaay, Regan, Ling, Bozhinovska, Fernandez, Marini-Filho, Huertas, Phon, Kőrösi, Meerman, Pe’er, Uehara-Prado, Sáfián, Sam, Shuey, Taron, Terblanche and Underhill2015), because it is a relatively effective bait that is available worldwide at low cost. Carrion baits, in contrast, are used less widely, and no single bait source has been proposed or adopted as a standard. Most studies have used either fish- or shrimp-based baits (e.g., Álvarez et al. Reference Álvarez, Clavijo-Giraldo, Uribe, Pyrcz, Iserhard, Freitas and Marín2022; Checa et al. Reference Checa, Barragán, Rodríguez and Christman2009; Checa et al. Reference Checa, Donoso, Rodriguez, Levy, Warren and Willmott2019; Hall and Willmott Reference Hall and Willmott2000) or carnivorous mammal excrement (e.g., Pyrcz et al. Reference Pyrcz, Wojtusiak and Garlacz2009; we include this bait type under carrion because of the similar fauna that is attracted, pers. obs. KRW/JPWH), but it is not clear whether different carrion baits have an impact on the abundance, diversity, and taxonomic composition of resulting samples. For example, Freitas et al. (Reference Freitas, Agra, Pereira, Oliveira, Bandini, Alves, Batista, Marini-Filho, Mattos and Uehara-Prado2014) noted that ‘Although this bait [carrion] is especially good to be used in short-term and maximized inventories, it is not recommended in comparative studies due to the difficulty to find the same kind of fish for bait standardization and unpredictability throughout rotting processes for each fish species’. Whitworth et al. (Reference Whitworth, Huarcaya, Mercado, Braunholtz and MacLeod2018) subsequently suggested that a study of possible differences among carrion baits would indeed be useful to help develop monitoring programmes, but to date most researchers likely choose a carrion bait based on availability or anecdotal information. With rapidly mounting evidence of long-term changes in insect communities from temperate regions, but little data to reveal trends in overwhelmingly more diverse tropical faunas, the need for monitoring of insect groups over large spatial and temporal scales has become imperative (Cardoso and Leather Reference Cardoso and Leather2019; Didham et al. Reference Didham2020; Forister et al. Reference Forister2010; Hallmann et al. Reference Hallmann2017; Sánchez-Bayo and Wyckhuys Reference Sánchez-Bayo and Wyckhuys2019). With the recent launch of butterfly monitoring programmes in tropical countries such as Brazil (Instituto Chico Mendes de Conservação de Biodiversidade 2025; Santos et al. Reference Santos, Marini-Filho, Freitas and Uehara-Prado2016) and Ecuador (Checa et al. Reference Checa, Nogales, Salazar, Bustos, Ojeda, Bustos and Willmott2022), among others, deciding on a standard methodology is critical.
For these reasons and because existing data suggest that the use of carrion baits, in addition to fruit baits and standardised net sampling, more efficiently samples tropical communities for global butterfly monitoring (Checa et al. Reference Checa, Donoso, Rodriguez, Levy, Warren and Willmott2019), we aimed to assess the relative performance of a range of carrion baits to help guide the choice of carrion bait for butterfly monitoring initiatives. We therefore carried out an experiment explicitly designed to compare the abundance, diversity, and composition of the species assemblages sampled by three different carrion baits and compared these with the species assemblage sampled with the standard banana bait.
Materials and methods
Study area and butterfly sampling
This study took place in the Mashpi-Tayra Biodiversity Reserve (N 0°9.97′, W 78°52.69′) on the western slopes of the Andes in Ecuador, in the southern Chocó biogeographic region. The reserve includes 2700 hectares of premontane tropical rainforest from 580 to 1400 m above sea level. We established 16 trapping stations spaced approximately 70 m apart along a transect on a ridge at an elevation of 900–1000 m. Each trapping station was equipped with two Van Someren-Rydon bait traps, one in the understory (∼1 m from the forest floor) and the other in the canopy (15–25 m). Traps were baited each morning from 07:00 h to 08:00 h and checked in the afternoon, with bait replenished daily to reduce the effects of weather and other insect consumers on the bait quality. We documented every individual butterfly (Papilionoidea) captured in the traps, recording the bait, trap station number, date, and forest stratum (SI.1. Raw specimen collection data; SI.2 and SI.3 contain the data partitioned by understory and canopy, respectively). Where possible, we identified individuals to species in the field. For species with sufficient vouchers and where field identification was reliable, we marked individuals on a wing with a felt-tip pen and released them. Photographs of all individuals were taken, either at the laboratory for collected specimens or in the field, after marking but prior to release (SI.4. Photos of butterfly records). Identification of all individuals was verified by review of photographs at the conclusion of the experiment. Authors of taxonomic names are provided in Lamas (Reference Lamas2004), Willmott and Hall (Reference Willmott and Hall2004), Hall and Willmott (Reference Hall and Willmott2009) and Dias et al. (Reference Dias, Janzen, Hallwachs, Chacón, Willmott, Ortiz-Acevedo, Mielke and Casagrande2018).
Experimental treatments
We tested three types of carrion bait: shrimp (Crustacea) because of its proven effectiveness (e.g., Checa et al. Reference Checa, Barragán, Rodríguez and Christman2009; Hamer et al. Reference Hamer, Hill, Benedick, Mustaffa, Chey and Maryati2006); a sea fish, snapper (Lutjanus sp.), because it is commercially available throughout tropical regions; and a freshwater fish, tilapia (Oreochromis sp.), because, as a farmed fish, it is also widely available and often affordable across the tropics. For broader comparison with previous studies, we also included standard banana bait without added sugar. Baits were prepared by dicing carrion or mashing banana and allowing them to ferment for 1–8 days depending on bait type (see SI.5 bait recipes).
Response variables
We focused on three key attributes of a community, namely total abundance of individuals trapped, species diversity, and species composition. We quantified butterfly abundance as the number of individuals recorded under a given sampling effort, which was equal across all bait treatments. We pooled records of all sampled Papilionoidea (Nymphalidae, Riodinidae, Lycaenidae, Hesperiidae, and Pieridae) in our abundance analyses, regardless of whether they were identified to species level. In the Supplementary Information (SI.6., Extended methods and results), we examine in more detail abundance differences between baits across butterfly families. Recaptured individuals were excluded if found on the same bait and included if found on a different bait.
We quantified species diversity as Hill numbers, qD, or the effective number of species (Chao et al. Reference Chao, Chiu and Jost2014; Hill Reference Hill1973; Jost Reference Jost2010). Hill numbers provide an intuitive and comprehensive measure of species diversity by reflecting both the number of species (richness) and their relative abundances (evenness), weighing the number of species in relation to their relative abundances. For the special case in which relative abundances do not contribute to the diversity measure, the Hill number of order q = 0 (0D), where rare and common species contribute equally to the computed effective number of species, diversity is simply the number of species in the sample, or species richness. The Hill number of order q = 1 (1D), in contrast, weighs the number of species exactly by their relative abundances, while the Hill number of order q = 2 (2D) weighs the more abundant species more heavily. We follow Chao et al. (Reference Chao, Chiu and Jost2014) in just reporting the first three q orders (q = 0, 1, and 2), since larger orders tend to change the resulting effective number of species very little. Hill numbers have the advantage of reaching their maximum value for a given species richness when all species are equally abundant (i.e., evenness is maximum; Jost Reference Jost2010) and doubling when two assemblages with the same number of species but none shared between them are pooled together (Jost Reference Jost2006). These intuitive notions of how diversity increases or decreases are not consistently reflected by most otherwise popular diversity ‘indices’, such as Shannon’s or Simpson’s (Chao et al. Reference Chao, Chiu and Jost2014; Jost Reference Jost2006).
We assessed similarity in species composition between bait treatments by quantifying compositional similarity between samples with the CqN family of measures (Chao et al. Reference Chao, Chazdon, Colwell and Shen2005; Reference Chao, Chazdon, Colwell and Shen2006; Jost et al. Reference Jost, Chao, Chazdon, Magurran and McGill2011), which are mathematically related to Hill numbers. These are measures of compositional overlap between multiple species assemblages, where the order q in CqN determines (as in Hill numbers) the degree to which the relative abundance of each species contributes to the measure’s computation, and N is the number of assemblages compared. These measures take values between 0 and 1: 0 when the compared assemblages share no species at all and 1 when all compared assemblages share all their species and, if relative abundances are considered, all species in all assemblages occur in the exact same relative abundances. The CqN family of measures are direct measures of compositional overlap in the sense that, when only two assemblages are compared and all species are equally weighted (as in the case of two equally sized species lists without abundance information), the overlap is quantified simply as the proportion of shared species. In fact, when only two assemblages are compared, this family of measures reduces to the well-known Sørensen (C02), Horn (C12) and Morisita–Horn (C22) similarity ‘indices’, which are the measures that we use here to compare bait treatments in a pairwise manner.
Importantly, because qD and CqN measures of diversity and compositional similarity of order q = 2 give greater weight to the best-represented species in the sample (i.e., the most abundant), while uncommon species (such as singletons or doubletons) are often not truly low in abundance but instead poorly sampled or accidental ‘by-catches’, we will interpret 2D and C2N as measures of the diversity and similarity of ‘dominant species’ (i.e., those whose relative abundance is high in the sample), respectively.
Finally, for analyses of species diversity and compositional similarity, we limited our analyses to records from three butterfly families with well-resolved taxonomy: Nymphalidae, Riodinidae, and Lycaenidae. Nevertheless, even these families contain some known cryptic species complexes (such as the Hermeuptychia Forster, 1964, species complex in the Nymphalidae), so we also excluded such species. Despite recording a large number of Hesperiidae, we excluded this family from the species diversity and composition analyses because the taxonomy of many Neotropical species is still poorly resolved, with many examples of cryptic or undescribed species (e.g., Bertrand et al. Reference Bertrand, Janzen, Hallwachs, Burns, Gibson, Shokralla and Hajibabaei2014; Burns et al. Reference Burns, Janzen, Hajibabaei, Hallwachs and Hebert2008; Hebert et al. Reference Hebert, Penton, Burns, Janzen and Hallwachs2004; Zhang et al. Reference Zhang, Cong and Grishin2023). Finally, we excluded the family Pieridae since it was represented by only a single species, and it is not regarded as a typical member of the bait-attracted butterfly community.
Sampling design and control of potentially confounding factors
Butterfly sampling was carried out over fourteen 8-day sampling events, separated by 1–4 weeks, between January and September 2017. Each sampling event involved four replicate trapping stations per bait type deployed simultaneously (i.e., 8 traps per bait × 8 days = 64 trap-days per bait per sampling event). This design yielded a total sampling effort of 896 trap-days per bait and 3584 trap-days across all baits. We made a deliberate attempt to experimentally control the effects of other factors that, besides our factor of interest (bait type), could potentially influence our estimates of abundance, diversity, and species composition. In particular, the four bait types were distributed alternately among trapping stations along the transect each day and were rotated the following day so that each trapping station had each bait type for two non-consecutive days per sampling event. A comprehensive list of all potentially confounding factors, along with the corresponding control strategies (experimental or statistical), is provided in SI.9.
Data analyses – abundance
We defined one abundance observation unit as the count of butterflies recorded during each 8-day sampling event and treated ‘sampling event’ as a blocking factor, with one abundance observation per bait within each block. With this strategy, we not only achieved replication of abundance records, but, more importantly, we separated the variation in abundance that can be ascribed to bait (our factor of interest) from the temporal variation between sampling events. As a result, we were able to assess whether the observed differences in abundance between baits were consistent across sampling events. To quantify the mean differences in abundance between baits and to test whether these differences were not a product of random sampling, we modelled abundance observations with a generalised linear mixed-effects approach (GLMMs). Abundance per sampling event (per bait) was modelled as a response, while bait and sampling event were incorporated as predictors (bait as a fixed effect and sampling event as a random effect). We modelled sampling error with a negative binomial distribution, which allows for the mean and spread parameters to be estimated separately, and it fit the data better than a Poisson model (AIC difference between Poisson and negative binomial models = 4.1). Furthermore, the negative binomial model showed no signs of overdispersion (overdispersion factor = 1.17, c 2 = 58.59, df = 50, p = 0.19) and no obvious patterns in residual plots (SI.6. Section 2.2.2). All statistical inferences reported in the Results section were based on this negative-binomial model. GLMM fitting was carried out with the glmmTMB R package (v1.1.5, Brooks et al. Reference Brooks, Kristensen, Van Benthem, Magnusson, Berg, Nielsen, Skaug, Mächler and Bolker2017) and model validation with the DHARMa package (v.0.4.6, Hartig Reference Hartig2022).
Data analyses – species diversity
We visually inspected observed accumulation curves of individuals and species over the course of the study and estimated rarefaction/extrapolation curves for each bait, following Chao and Jost (Reference Chao and Jost2012) and Chao et al. (Reference Chao, Chiu and Jost2014). These curves allowed us to compare diversity estimates obtained with each bait after standardising them by either sample size or sample coverage (see further details in SI.6), because diversity estimates standardised by sample coverage preserve the ratio between diversities estimated for pairs of communities (Chao and Jost Reference Chao and Jost2012). To choose an optimal sample coverage for standardisation, we followed the guidelines suggested by Chao et al. (Reference Chao, Chiu and Jost2014, p. 60) with a minor modification explained in the Supplementary Information (SI.6.). Estimation of rarefaction/extrapolation curves and standardised Hill numbers were carried out with the R package iNEXT (v.3.0.0, Hsieh et al. Reference Hsieh, Ma and Chao2016; Hsieh et al. Reference Hsieh, Ma and Chao2022).
Data analyses – species composition
Observed values of compositional similarity tend to underestimate the true similarity between samples due to a substantial probability of unseen shared species in small or limited sample sizes, particularly when low-abundance species are prevalent in these samples. To reduce this bias, we followed Chao et al. (Reference Chao, Chazdon, Colwell and Shen2005, Reference Chao, Chazdon, Colwell and Shen2006) in incorporating the probability of unseen shared species in the estimation of CqN similarity measures, implemented in the R package SpadeR v. 0.1.1 (Chao et al. Reference Chao, Ma, Hsieh and Chiu2016). To assess the degree to which the species composition of the butterfly assemblages sampled with our various bait treatments is similar, we looked at the overlap of the confidence bands estimated for our bias-corrected estimates. All statistical analyses were carried out in R v.4.5.0 (SI.10, SI.11, SI.12, Analyses R scripts).
Results
Abundance
We recorded 1557 butterflies (992 understory and 565 canopy), corresponding to 1377 distinct individuals (909 understory and 468 canopy) and 180 recaptures (83 understory and 97 canopy). A total of 1492 records were used for the abundance analyses for the entire community after excluding recaptures on the same bait. Overall, carrion baits recorded substantially more butterflies than banana bait, with shrimp recording 521 butterflies, sea fish 414, freshwater fish 409, and banana 148 (Figure 1A), and our statistical modelling confirmed that this pattern is consistent across sampling events. Specifically, the three carrion baits on average recorded between 2 and 4.8 times more butterflies per sampling event than the banana bait. Moreover, among carrion baits, there is a small but statistically significant difference in the abundance recorded with shrimp relative to the two fish baits: shrimp recorded up to 1.7 times more butterflies per sampling event than the two fish baits, which did not differ between them (Figure 1B; z-tests of pairwise contrasts between baits showed that all contrasts between carrion baits and the banana bait were highly significant: p < 2e–16. Contrasts between shrimp and both fish baits were also significant – shrimp–sea fish: p = 0.014; shrimp–freshwater fish: p = 0.009, whereas the contrast between the two fish baits was not significant: p = 0.887. Full details in SI.6. Section 2.2.3). These patterns observed in the full dataset were also consistent within each family (SI.6., Section 2.3). Analysing the data by stratum (canopy vs understory) revealed mostly qualitatively similar patterns, with the three carrion baits recording several times more individuals than banana in each stratum. One notable difference was that the number of individuals recorded on carrion baits was much more similar in the canopy than in the understory, mostly as a result of the family Hesperiidae. This family was recorded most often on shrimp, and 170 of the 177 individuals were recorded in the understory, resulting in greater abundance for shrimp than for other carrion baits in the understory (SI.7, SI.8).
(A) Total butterfly abundance recorded with each bait during the 112 days of this study. (B) Mean number of butterflies per sampling event ±95% confidence limits (dark grey dot ± error bars), as predicted by the best GLMM explaining the data: a negative-binomial model fitted to the ‘butterfly counts per sampling event’ as a response, with ‘bait’ as a fixed effect and ‘sampling event’ as a random effect. The pale grey data points correspond to the observed number of butterflies per sampling event. Each sampling event consisted of eight consecutive sampling days, using eight traps per bait.

Species diversity
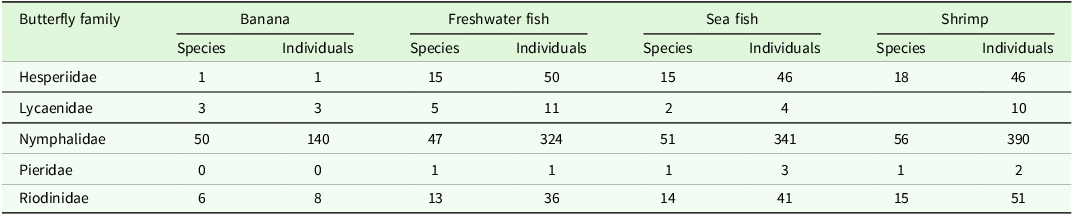
For the three included butterfly families with reliably identified species (Nymphalidae, Riodinidae, and Lycaenidae), we recorded a total of 113 species (sample size = 1267 individuals). Baits which sampled more individuals also sampled more species in these three families (shrimp: 425 individuals of 71 species; sea-fish: 363 individuals of 65 species; freshwater fish: 340 individuals of 61 species; and banana: 139 individuals of 53 species). The raw data show marked differences in the effectiveness of baits across taxonomic groups, with all baits performing well or very well for Nymphalidae, but carrion baits recording substantially more species and individuals of Lycaenidae, Riodinidae, and especially Hesperiidae than banana bait (for example, only 1 out of 177 Hesperiidae individuals was captured on banana; see Table 1). The overlap in species recorded on different baits is shown graphically in Figure 2.
Number of species/individuals in each butterfly family recorded on four different baits

Total numbers of species recorded on different individual baits and combinations of baits during the study, for 107 confidently identified species in the families Nymphalidae, Riodinidae and Lycaenidae. Six species were omitted since they occurred in bait combinations not represented in the figure (banana + shrimp, 3 species; freshwater_fish + sea_fish, 3 species).

The observed rate of species accumulation over time is similar across all bait types, whereas the accumulation rate observed in relation to the number of individuals sampled is slightly steeper for banana (Figure 3A). This result translates to steeper rarefaction/extrapolation curves for banana than for carrion baits, whether based on sample size (Figure 3B) or sample coverage (SI.6, Section 3.3.2). Nevertheless, the confidence bands around these curves overlap across most of their estimated range (i.e., the apparent differences cannot be regarded as statistically significant). The only noteworthy exception is the rarefaction/extrapolation curve for 2D (the diversity of ‘dominant’ species) for freshwater fish, which is lower and statistically significantly different from those estimated for any other bait, regardless of sample size or coverage.
(A) Accumulation of individuals and species over the course of the study. (B) Sample-size-based rarefaction/extrapolation curves of species diversity (Hill numbers). The observed (effective) number of species for each bait is indicated by the points where each curve switches from a solid line (rarefaction) to a dashed line (extrapolation). (C) Species diversity estimates standardised to an optimal sample coverage of 0.915.

In fact, when standardised to an optimal sample coverage of 0.915, species richness (0D) estimates for all carrion baits are broadly similar, with large uncertainty bars for banana. In contrast, differences begin to emerge when species’ relative abundances are considered. For instance, in the case of 1D, the effective number of species estimated for shrimp and sea-fish is similar, and both are intermediate between freshwater fish and banana, though not statistically distinct from either. In this case, 1D looks unexpectedly higher for banana than for all carrion baits, but the difference is only statistically significant when compared with freshwater fish. Similar but more pronounced patterns are observed for the diversity of ‘dominant’ species (2D), where the estimate for freshwater fish is clearly lower and statistically significantly different from that of any other bait (Figure 3C).
Species composition
The similarity in species composition sampled with different baits depended on two factors: the extent to which species’ relative abundances were considered (i.e., the order q of the CqN similarity measure) and the type of comparison (either between pairs of carrion baits or between one carrion bait and the fruit bait). Ignoring species abundances (C02), the overlap in species sampled by any pair of baits was similar, albeit with large uncertainty around similarity estimates (Figure 4, left panel). When species abundances are accounted for, as with C12, the expected similarity in species composition between samples obtained with any carrion bait is very high (approximately 0.92), while the similarity between samples obtained with any carrion bait and the fruit bait is only 0.6–0.7. Moreover, when only ‘dominant’ species contribute to the similarity measure, as with C22, the species composition of samples obtained with any carrion bait is expected to be virtually identical (confidence intervals for all pairwise comparisons between carrion baits include 1.0), while the composition of samples obtained with the fruit bait is expected to be only approximately 0.5 (i.e., the community sampled by banana is substantially different to that sampled by any of the carrion baits). When data were partitioned by stratum, differences in species composition between carrion baits and banana were much more pronounced for ‘dominant’ species (q = 2) in the understory (a similarity of 0.3) than in the canopy (a similarity of 0.8) (SI.7, SI.8).
Similarity in species composition between pairs of bait samples, quantified by the CqN family of measures. Point estimates ± error bars show bias-corrected estimates± 95% confidence limits following Chao et al. (Reference Chao, Chazdon, Colwell and Shen2005, Reference Chao, Chazdon, Colwell and Shen2006). The first three pairwise comparisons from left to right in each panel correspond to all possible pairs of carrion baits; the last three comparisons in each panel correspond to pairs between one carrion bait and the banana bait (Shr: shrimp, Sea: sea fish, Fre: freshwater fish, Ban: banana).

Discussion
Our study addressed two questions of critical importance for the planning and implementation of long-term, large-scale butterfly monitoring programmes. Firstly, we examined how the source material for carrion baits (shrimp, sea-fish, or freshwater fish) affects estimates of butterfly abundance, diversity, and species composition. Secondly, we investigated the implications of adding a carrion bait to the widely adopted standard fruit bait in sampling tropical butterfly communities. While the first question remains largely unexplored in previous literature (Freitas et al. Reference Freitas, Agra, Pereira, Oliveira, Bandini, Alves, Batista, Marini-Filho, Mattos and Uehara-Prado2014; Whitworth Reference Whitworth, Huarcaya, Mercado, Braunholtz and MacLeod2018), the second one has been the subject of some prior studies (e.g., Álvarez et al. Reference Álvarez, Clavijo-Giraldo, Uribe, Pyrcz, Iserhard, Freitas and Marín2022; Checa et al. Reference Checa, Donoso, Rodriguez, Levy, Warren and Willmott2019; Whitworth Reference Whitworth, Huarcaya, Mercado, Braunholtz and MacLeod2018). Despite some differences between the individual carrion baits tested, we found that they are sufficiently similar that datasets can be compared across bait types, especially where species composition is the focus of the study. Our data also strongly support the value of employing both carrion and fruit baits in trapping studies, if they are feasible.
Is the source of carrion important for sampling butterfly communities?
The primary motivation for this study was the lack of published data on the effectiveness of possible sources of carrion as a standard bait for sampling tropical butterfly communities. In general, our results suggest that, if the main focus is on species composition, the choice of carrion source may not be critical. Regardless of the carrion bait chosen, the sampled species composition was remarkably similar (Figure 4); shrimp, sea-fish, and freshwater fish consistently sampled the same set of species in nearly identical proportions. However, for individual abundance and species diversity, the type of carrion bait had more effect. In our experiment, while the marine- and freshwater fish yielded similar numbers of individuals, the shrimp bait consistently sampled slightly more individuals during most sampling events. The reasons for this are unclear, but if the result is found to apply broadly across butterfly faunas, then the emission of more attractive volatile compounds from shrimp, or those that may be detected from a greater distance, might be one explanation. Whether such a putative preference in butterflies for particular volatile compounds reflects nutritional differences among baits obviously also remains unknown. Furthermore, even though species composition between carrion baits was almost identical and species richness estimates (0D) for any carrion bait are roughly the same, baits may differ in their ability to consistently sample the same effective numbers of species (1D and 2D). For example, our findings indicate that the sample recorded by freshwater fish may contain a smaller number of ‘dominant’ species, those consistently recorded with higher probabilities, than shrimp or sea-fish (Figures 3B and 2D).
Whenever possible, therefore, we recommend selecting a marine-sourced fish or crustacean due to its apparent efficiency in recording more individuals and species in short sampling events. Nevertheless, the primary goal of most monitoring programmes is likely to be the detection of long-term trends, and thus consistently using the same type of bait should be the priority. To sustain monitoring in the long term, bait effectiveness should therefore be balanced with availability and cost. Finally, bait type should always be documented and reported, and, where necessary, studies such as this one can be conducted to quantify differences between baits and thus ‘calibrate’ data to enable comparisons across different sampling regimes.
Use of both carrion and fruit baits for comprehensive sampling of tropical butterfly communities
The selection between carrion and fruit baits for sampling tropical butterfly communities has sometimes been framed as an either/or choice (e.g., Freitas et al. Reference Freitas, Agra, Pereira, Oliveira, Bandini, Alves, Batista, Marini-Filho, Mattos and Uehara-Prado2014). However, our findings, along with those of others (Álvarez et al. Reference Álvarez, Clavijo-Giraldo, Uribe, Pyrcz, Iserhard, Freitas and Marín2022; Checa et al. Reference Checa, Donoso, Rodriguez, Levy, Warren and Willmott2019; Hamer et al. Reference Hamer, Hill, Benedick, Mustaffa, Chey and Maryati2006; Whitworth Reference Whitworth, Huarcaya, Mercado, Braunholtz and MacLeod2018), suggest that the most effective strategy is the simultaneous use of both carrion and fruit baits. These comparative studies consistently demonstrate that samples obtained with these two bait types often differ substantially in individual abundance, species diversity, and especially species composition. In our study, carrion baits sampled 2 to 4.8 times more individuals than fruit bait in each 8-day sampling event (Figure 1); however, the species assemblage sampled with carrion baits is only about half as similar to that obtained with the fruit bait (Figure 4), and thus we regard these two behaviours as representing distinct feeding guilds rather than one (e.g., Freitas et al. Reference Freitas, Agra, Pereira, Oliveira, Bandini, Alves, Batista, Marini-Filho, Mattos and Uehara-Prado2014; Uehara-Prado et al. Reference Uehara-Prado, Brown and Freitas2007). In particular, although carrion and fruit baits may be similar in the species diversity they ultimately capture in the Nymphalidae, carrion is overwhelmingly more attractive to Hesperiidae, Riodinidae and Lycaenidae (see Table 1), groups that comprise about two-thirds of Neotropical butterfly species (Lamas Reference Lamas2004).
These differences in attraction raise questions about how to interpret diversity estimates from rarefaction and extrapolation. In our case, while rarefaction/extrapolation curves based on individuals sampled appear steeper for the fruit-bait (Figure 3B), the confidence intervals around these estimates are wide and overlap across most of the estimated range. Therefore, the apparent differences are not statistically significant and should not be overemphasised. In fact, they are somewhat unexpected, as the low frequency of Riodinidae and Lycaenidae in fruit-baited traps suggests that this bait type should typically be associated with lower diversity estimates (note that Hesperiidae were excluded from these analyses because of uncertainties about species identity). Supporting this, further sampling at our study site in the years following this bait experiment has yielded 372 individuals on the fruit bait—a sample size comparable to that obtained with carrion baits during the experiment—with a total observed richness of 63 species, in the lowest part of the predicted range of the sample-based extrapolation curve and similar to the species numbers recorded with carrion baits during the experiment (Table 1; Figure 3B, q = 0).
Further insight comes from species accumulation curves we simulated by randomly sampling individuals per sampling event from the full empirically observed bait-specific assemblages (SI 4.3.3.4). These simulations showed that species accumulation trajectories drawn from the same species pool can vary widely and occasionally resemble the pattern observed in our study. However, there is no consistent separation between the fruit and carrion baits—particularly with shrimp and sea-fish—suggesting that the apparent differences may reflect sampling variance rather than systematic bias. It is important to note, however, that while species accumulation models used to reconstruct rarefaction/extrapolation curves assume that individuals are sampled with equal probability regardless of species identity, this assumption is inevitably violated in field conditions, where factors such as weather, seasonality, and microhabitat influence which species are sampled next. Nonetheless, our simulations suggest that diversity estimates—when interpreted with their associated uncertainty—remain robust.
The species assemblage sampled in our study was dominated by Nymphalidae. As noted above, the diversity of species in this family sampled by carrion and fruit baits was similar, and it seems likely that all nymphalid species in our study area could eventually be sampled by both baits, albeit not in the same relative abundances. Within Nymphalidae, there are apparent differences in the extent to which different groups respond to the two types of bait, with certain genera (e.g., Archaeoprepona Fruhstorfer, 1915), tribes (e.g., Coeini) and subfamilies (e.g., Satyrinae) showing a preference for fruit and the remainder for carrion (including most of the ‘fruit-feeding’ Charaxinae). Conversely, we also recorded some individuals of Heliconiinae and Limenitidinae on fruit, groups that are typically excluded from studies of fruit-feeding nymphalids (Freitas et al. Reference Freitas, Agra, Pereira, Oliveira, Bandini, Alves, Batista, Marini-Filho, Mattos and Uehara-Prado2014). These differences in preference across lineages, coupled with differences in flight height, are presumably responsible for the variation in compositional similarity between assemblages recorded on carrion and fruit baits in the understory and canopy in our study. We also note that butterflies attracted to carrion traps are overwhelmingly male, compared with more even proportions of both sexes on fruit baits. This effect may be seen as advantageous in likely reducing potential impacts of monitoring programmes on local populations by limiting the number of females removed from the population. These differences in bait attractiveness across butterfly taxa (even within subfamilies such as Charaxinae) and sex, together with the fact that carrion- and fruit-attracted assemblages can respond differently to forest stratum, habitat variation, and ecological disturbance (Checa et al. Reference Checa, Donoso, Rodriguez, Levy, Warren and Willmott2019; Hamer et al. Reference Hamer, Hill, Benedick, Mustaffa, Chey and Maryati2006; Whitworth Reference Whitworth, Huarcaya, Mercado, Braunholtz and MacLeod2018), also support the simultaneous use of both carrion and fruit baits, because it provides a more thorough understanding of the entire butterfly community. Furthermore, although our nine-month sampling period is insufficient to test for seasonal effects, at least some of the differences in relative abundance among baits across sampling events (Figure 3B, SI.6 Fig. S2) may be due to seasonal variation in bait preference (e.g., Torres et al. Reference Torres, Osorio-Beristain, Mariano and Legal2009). Use of multiple bait types can help reduce and examine the influence of such effects. We acknowledge that use of carrion baits involves some logistical considerations, but we believe that the results merit the extra effort. We use plastic containers such as soda bottles designed to withstand high internal pressure to avoid leakage; take particular care in dispensing bait and placing it in traps; clean any spilled bait; and are vigilant when removing butterflies for stinging Hymenoptera that are often attracted to such baits.
Differential investment in sampling effort with carrion and fruit baits
In the context of butterfly trapping studies, we find it useful to distinguish between ‘sampling effort’ and ‘sample size’ because separating these concepts has implications for the design of butterfly sampling schemes and the subsequent data analysis. ‘Sampling effort’ is determined by the combination of the number of bait traps in operation at any given time and the duration they remain active. Thus, assuming (hypothetically) no daily variation in species sampling, we would expect that using two traps for one day (24 hours) would yield a sample equivalent to using one trap for two days (48 hours). ‘Sample size’, in contrast, refers to the number of individuals recorded with a given sampling effort (in this context, ‘sample size’ is also a raw measure of individual abundance). It is evident then that even when keeping sampling effort constant, the sample sizes obtained with that effort can vary, and this is often the case when carrion and fruit baits are used simultaneously in the same location.
Our results (and those of others; Álvarez et al. Reference Álvarez, Clavijo-Giraldo, Uribe, Pyrcz, Iserhard, Freitas and Marín2022; Checa et al. Reference Checa, Donoso, Rodriguez, Levy, Warren and Willmott2019; Hamer et al. Reference Hamer, Hill, Benedick, Mustaffa, Chey and Maryati2006; Whitworth Reference Whitworth, Huarcaya, Mercado, Braunholtz and MacLeod2018) clearly show that the sample size obtained with a given sampling effort can be very sensitive to the choice of bait, be it fruit or carrion baits (Figure 1). When maintaining the same sampling effort, either bait may sample substantially more individuals than the other, depending on ecological circumstances (Hamer et al. Reference Hamer, Hill, Benedick, Mustaffa, Chey and Maryati2006) or geographic location (e.g., Álvarez et al. Reference Álvarez, Clavijo-Giraldo, Uribe, Pyrcz, Iserhard, Freitas and Marín2022; Checa et al. Reference Checa, Donoso, Rodriguez, Levy, Warren and Willmott2019; Whitworth et al. Reference Whitworth, Huarcaya, Mercado, Braunholtz and MacLeod2018). Since methods that capture individuals at a faster rate also accumulate species more rapidly, approaching the asymptote of the species accumulation curve for those techniques requires less sampling effort than for techniques accumulating individuals and species at a slower pace. This is clear in our results, where all samples collected with carrion baits accumulated individuals and species considerably faster than fruit baits (Figure 3A).
The crucial implication here is that the optimal sampling effort can differ dramatically between carrion and banana baits at a specific site. In our study area, for instance, it is evident that using the fruit bait (banana) would require additional traps and/or sampling days to produce samples that provide estimates of species diversity and compositional similarity with levels of precision comparable to those obtained with the carrion baits (Figures 3B, 3C and 4). The question then becomes: how can we calculate the optimal sampling effort for a given study or monitoring site? As proposed by Chao and Jost (Reference Chao and Jost2012) and further elaborated by Chao et al. (Reference Chao, Kubota, Zelený, Chiu, Li, Kusumoto, Yasuhara, Thorn, Wei, Costello and Colwell2020), we consider the statistic ‘sample coverage’, or the expected proportion of individuals in the entire community that belongs to the species detected in the sample, to be a valuable criterion. With sufficient preliminary data gathered at a site, researchers can assess how sample coverage increases with sampling effort. From this, one can estimate the expected sampling effort required to achieve a satisfactory sample coverage (e.g., >0.9) using a particular bait type. It is highly likely that the optimal sampling effort needed to obtain reliable estimates of species diversity and compositional similarity will be found to differ between carrion and fruit baits in any study region.
Our study highlights the importance of considering differential sampling effort with carrion and fruit baits tailored to the unique characteristics of each monitoring location and the specific goals of the study. This nuanced approach acknowledges that fixed sampling efforts may not yield comparable outcomes across all locations. In regions where one bait type outperforms another in its ability to accumulate individuals, it may be tempting to omit the use of the less effective bait. Nevertheless, as discussed above, to provide a broader taxonomic spectrum of species sampled and a more complete understanding of butterfly community ecology, using both bait types is highly preferable. Furthermore, while it is becoming increasingly clear that in the western Amazon and Andes the most effective bait for monitoring is carrion, we advocate (e.g., Checa et al. Reference Checa, Nogales, Salazar, Bustos, Ojeda, Bustos and Willmott2022) for also sampling with fruit bait to provide data that can be compared to those from other monitoring programmes on a global scale. Reciprocally, we encourage existing monitoring programmes that currently only use fruit bait to consider incorporating carrion bait to facilitate comparisons with monitoring efforts in western South America, a region containing a quarter or more of the world’s butterfly species.
Supplementary material
The supplementary material for this article can be found at https://doi.org/10.1017/S0266467426100510.
Acknowledgements
This study was made possible through the invaluable support and contribution of the Mashpi Lodge administration and its dedicated personnel, particularly the outstanding team at the Life Center and the biology team, including Augusto Vásquez, Darwin Chalá, Andrea Tapia, and Mateo Roldán. Their support in facilitating this study and their continued collaboration within the Mashpi Butterfly Monitoring Program have been instrumental. We also wish to acknowledge the valuable contribution of Sofía Nogales, Sebastian Mena, and Karina Torres in training the field personnel from Mashpi Lodge and the Mashpi-Tayra Biodiversity Reserve. Our gratitude extends to the Ecuadorian Ministry of Environment, notably Diego Morillo, for processing and granting the research and collection permit (Framework Contract MAE-DNB-CM-2016-0045), and to the Instituto Nacional de Biodiversidad—INABIO (our current research permit is MAATE-DBI-CM-2023-0298), with special thanks to Santiago Villamarín and Diego Inclán for supporting this research.
Financial support
This research was supported in part by a USA National Science Foundation grant, DEB-1342705.
Competing interests
The authors declare none.


 Open access