


1. Introduction
1.1. Background and motivation
Understanding the star formation history (SFH) of galaxies is fundamental to unravelling the processes that shape their formation and evolution. Reconstructing a galaxy’s SFH enables us to trace when its stars formed, how its chemical composition evolved, and how various internal mechanisms and external influences drove its growth. Such insights are crucial for addressing broader questions in astrophysics, from galaxy formation and assembly to the role of environment and feedback processes in shaping cosmic structures.
Over the past few decades, significant advancements have been made in the reconstruction of SFHs for both nearby and distant galaxies. This progress has been driven not only by an increase in the quality and quantity of observational data but also by improvements in numerical techniques used to compare these data with stellar population synthesis models. Surveys across a wide range of redshifts have provided an unprecedented view of galaxies’ star formation and chemical enrichment histories. However, challenges remain, particularly due to intrinsic spectral degeneracies that make it difficult to disentangle the effects of stellar ages, metallicities, and dust attenuation. These complexities, combined with observational uncertainties, continue to pose significant hurdles to accurately reconstructing SFHs.
A promising breakthrough in this area has come with the advent of high-resolution integral field spectroscopy (IFS). IFS surveys, such as PHANGS (Physics at High Angular Resolution in Nearby Galaxies) (Emsellem et al. Reference Emsellem2022), have revolutionised our ability to study nearby galaxies in exceptional detail, resolving structures down to 100-pc scales. These observations provide spatially resolved spectra, capturing both stellar populations and interstellar medium properties across entire galaxies. One of the key instruments enabling this is Multi Unit Spectroscopic Explorer (MUSE), a powerful optical integral field spectrograph on the Very Large Telescope (VLT), which delivers high spatial and spectral resolution across a wide field of view. While this leap in resolution and detail offers the potential to overcome previous limitations, it also introduces new challenges – particularly in managing the vast amounts of data and the complexity and diversity of the spectral features that must be modelled. This is even more important now that the number of galaxies for which such data will become available is rapidly increasing with the advent of surveys such as Multiphase Astrophysics to Unveil the Virgo Environment (MAUVE) (Watts et al. Reference Watts2024) and Generalising Edge-on galaxies and their Chemical bimodalities, Kinematics, and Outflows out to Solar environments (GECKOS) (van de Sande et al. Reference van de Sande2022).
Traditional techniques for extracting galaxy parameters, such as least-squares fitting or Bayesian minimisation, such as Bayesian Analysis of Galaxies for Physical Inference and Parameter EStimation (BAGPIPES) (Carnall et al. Reference Carnall, McLure, Dunlop and Davé2018), Penalized Pixel-Fitting (pPXF) (Cappellari & Emsellem Reference Cappellari and Emsellem2004), have played a crucial role in this field. These methods involve fitting observed spectra with theoretical or empirical models to derive key parameters, such as stellar age and metallicity. However, they are often computationally intensive and difficult to scale to the large datasets now being generated by modern surveys. This computational burden and the time-intensive nature of these methods limit their applicability to larger and more complex datasets.
Excitingly, the advent of Machine Learning (ML) represents a promising avenue to solve some of the technical challenges faced by this field. Recent advances in ML have positioned it as a powerful alternative to conventional techniques. ML models, particularly Convolutional Neural Networks (CNNs), have shown significant promise in astronomical applications such as galaxy classification (Pasquet et al. Reference Pasquet, Bertin, Treyer, Arnouts and Fouchez2019) and redshift estimation (Lovell et al. Reference Lovell, Acquaviva, Thomas, Iyer and Gawiser2019). In the domain of spectral analysis, approaches like StarNet (Fabbro et al. Reference Fabbro, Venn, O’Briain, Bialek, Kielty, Jahandar and Monty2018) have demonstrated their ability to outperform traditional methods, offering faster and more accurate parameter estimation while reducing computational overhead. Additionally, ML models minimize manual intervention, making them highly suitable for automating the analysis of next-generation astronomical surveys.
In this paper, we present the first, proof-of-concept, realisation of GalProTE, a Machine Learning model leveraging Transformer Encoder architecture to extract stellar population information from integral-field-spectroscopic data. The primary driver for GalProTE is to develop an efficient and reliable tool to analyse resolved observations of nearby galaxies and simultaneously combine input from different stellar population models to encapsulate the diversity of galactic properties, and better understand biases and limitation of current, most standard, approaches. As such, this paper provides a first high-level introduction to the general philosophy and architecture of GalProTE and an example of first application to real observations.
Indeed, to validate the results of our proposed model, we utilize pPXF, a state-of-the-art and widely adopted method known for its robustness in spectral fitting. By comparing with this well-established approach, we ensure a solid foundation for consistent and reliable parameter estimation. This allows us to illustrate how ML can not only complement traditional methods but also surpass them in terms of speed and scalability. Our goal in this work is not to create a speed-up version of pPXF, but to provide a ML based framework that builds on strengths of pPXF (making it possible a fair comparison between the two) while addressing its limitations, particularly in handling the large-scale datasets produced by modern surveys.
1.2. The overview of proposed method: GalProTE
Traditional methods for extracting galactic parameters, such as spectral fitting with empirical or theoretical templates, are computationally intensive and time-consuming, particularly when applied to large-scale surveys. To address this limitation, we propose a deep learning-based approach for estimating age, metallicity, and dust attenuation from galaxy spectra. Our model, GalProTE, is trained on the Extended Medium-resolution Isaac Newton Telescope Library of Empirical Spectra (E-MILES) simple stellar population (SSP) model spectra (Vazdekis et al. Reference Vazdekis, Koleva, Ricciardelli, Röck and Falcón-Barroso2016), which includes a comprehensive range of stellar ages and metallicities. We aim to train and test the ML model with a diverse and realistic dataset, by generating combination templates from E-MILES spectra with varying dust attenuation and noise levels.
Overview of the proposed deep learning model. GalProTE accepts a normalised spectrum as input, which is processed through four independent parallel blocks. Each block employs a self-attention mechanism to emphasize distinct regions of the spectrum and convolutional layers to extract features. The transformer within each block encodes these features, which are then passed to two fully connected layers. One layer predicts the age-metallicity grid for the input spectrum, while the other predicts the dust attenuation. Using these predictions, a reconstructed spectrum is generated for comparison with the input spectrum.

The synthetic dataset used to train and test the model contains 111936 spectral templates, spanning ages from 30.0 MYr to 14.0 GYr and metallicities, [M/H] from −2.27 to 0.4, both sampled logarithmically, covering the wavelength range from 4750 to 7100 Å with a resolution of 2.48 Å. Dust attenuation ranges from $A_v =$
0 to 1.5 magnitudes, in steps of 0.1, using the attenuation curve from O’Donnell (Reference O’Donnell1994). The constraints on the chosen age and wavelength ranges are determined by the limitations of the data and the scope of this work. Specifically, the lower age limit of 30.0 MYr reflects the inherent restriction of the E-MILES synthetic stellar population models used for training. Similarly, the lower and upper wavelength limits of 4750 and 7100 Å, respectively, are dictated by the spectral coverage of the PHANGS-MUSE survey (Emsellem et al. Reference Emsellem2022), which serves as the observational benchmark for this study. The model architecture, illustrated in Figure 1, leverages parallel attention-based transformer encoders (Vaswani et al. Reference Vaswani, Shazeer, Parmar, Uszkoreit, Jones and Gomez2017) with varying kernel sizes to capture spectral features at multiple scales, improving predictions of stellar population properties. It outputs a fine
$A_v =$
0 to 1.5 magnitudes, in steps of 0.1, using the attenuation curve from O’Donnell (Reference O’Donnell1994). The constraints on the chosen age and wavelength ranges are determined by the limitations of the data and the scope of this work. Specifically, the lower age limit of 30.0 MYr reflects the inherent restriction of the E-MILES synthetic stellar population models used for training. Similarly, the lower and upper wavelength limits of 4750 and 7100 Å, respectively, are dictated by the spectral coverage of the PHANGS-MUSE survey (Emsellem et al. Reference Emsellem2022), which serves as the observational benchmark for this study. The model architecture, illustrated in Figure 1, leverages parallel attention-based transformer encoders (Vaswani et al. Reference Vaswani, Shazeer, Parmar, Uszkoreit, Jones and Gomez2017) with varying kernel sizes to capture spectral features at multiple scales, improving predictions of stellar population properties. It outputs a fine $12 \times 53$
grid of metallicity and age predictions (from here on referred as predicted grid), along with a dust attenuation value for each input spectrum.
$12 \times 53$
grid of metallicity and age predictions (from here on referred as predicted grid), along with a dust attenuation value for each input spectrum.
To evaluate the model’s performance, we tested it on a synthetic dataset and two face-on galaxies from the PHANGS-MUSE survey: NGC4254 and NGC5068. The choice and number of galaxies were not critical, as the primary goal was to assess the model’s ability to generate comparable results efficiently. While these two galaxies exhibit sufficient variation in age, metallicity, dust attenuation, SNR, and velocity gradients, any galaxies from the PHANGS-MUSE survey could have been selected for this purpose. While testing these two galaxies, the model demonstrated remarkable computational efficiency, achieving a speedup of over 2750 times compared to pPXF. Moreover, the comparison of the resulting maps revealed strong consistency between the GalProTE-generated maps and the pPXF-generated maps, validating the model’s accuracy.
The remainder of this paper is structured as follows. Section 2 describes the preparation of the synthetic dataset used for training and evaluation, including the application of dust extinction and the generation of composite templates. Section 3 details the methodology behind GalProTE, covering grid processing, noise modeling, emission line masking, the architecture design, and training procedures. Section 4 presents the results, including performance on synthetic data, spectral residual analysis, and comparison with pPXF maps from PHANGS-MUSE observations. In Section 5, we discuss the advantages of GalProTE over traditional methods, along with current limitations and possible future enhancements. Finally, Section 6 provides a summary of our findings and conclusions.
2. Dataset preparation
This work utilises the Medium-resolution Isaac Newton Telescope Library of Empirical Spectra (E-MILES) as the training dataset. The E-MILES dataset is a comprehensive library of empirical stellar spectra covering a broad range of stellar parameters (Sánchez-Blázquez et al. Reference Sánchez-Blázquez2006). It has been extensively used in stellar population synthesis to create models that simulate the integrated light of galaxies. Previous studies have focused on deriving the fundamental properties of stellar populations in galaxies, such as age, metallicity, and initial mass function (Vazdekis et al. Reference Vazdekis, Sánchez-Blázquez, Falcón-Barroso, Cenarro, Beasley, Cardiel, Gorgas and Peletier2010; Falcón-Barroso et al. Reference Falcón-Barroso, Sánchez-Blázquez, Vazdekis, Ricciardelli, Cardiel, Cenarro, Gorgas and Peletier2011). These studies have demonstrated the utility of the MILES/E-MILES library in improving the accuracy of spectral fitting and population synthesis models.
Each spectrum in the E-MILES dataset represents an SSP at a given age and metallicity, generated using stellar population synthesis models. These models incorporate the BaSTI (Bag of Stellar Tracks and Isochrones) stellar evolution tracks and assume a Chabrier Initial Mass Function (IMF) (Chabrier Reference Chabrier2001), which describes the distribution of stellar masses at birth. In this work, we use the precomputed E-MILES templates directly – BaSTI is not used for on-the-fly spectrum generation, but underpins the evolutionary assumptions embedded in the library. Key assumptions inherited from E-MILES include the BaSTI prescriptions, the fixed Chabrier IMF, and the native spectral resolution of the models.
The E-MILES dataset covers a range of 12 metallicities and 53 ages, resulting in a total of 636 $(12 \times 53)$
templates, which provide a fine resolution for modelling purposes. These 636 original templates are used as a base to generate a much bigger dataset. The specific log of metallicity [M/H], (from here on Z) and age values in GYr in the E-MILES dataset are:
$(12 \times 53)$
templates, which provide a fine resolution for modelling purposes. These 636 original templates are used as a base to generate a much bigger dataset. The specific log of metallicity [M/H], (from here on Z) and age values in GYr in the E-MILES dataset are:
Z = [−2.27, −1.79, −1.49, −1.26, −0.96, −0.66, −0.35, −0.25, 0.06, 0.15, 0.26, 0.4]
Ages = [0.03, 0.04, 0.05, 0.06, 0.07, 0.08, 0.09, 0.1, 0.15, 0.2, 0.25, 0.3, 0.35, 0.4, 0.45, 0.5, 0.6, 0.7, 0.8, 0.9, 1.0, 1.25, 1.5, 1.75, 2.0, 2.25, 2.5, 2.75, 3.0, 3.25, 3.5, 3.75, 4.0, 4.5, 5.0, 5.5, 6.0, 6.5, 7.0, 7.5, 8.0, 8.5, 9.0, 9.5, 10.0, 10.5, 11.0, 11.5, 12.0, 12.5, 13.0, 13.5, 14.0]
Our immediate focus is a detailed comparison with, and future application to MUSE observations, hence performance of GalProTE is evaluated on the data of galaxies from PHANGS-MUSE survey. To correct for the instrumental effects of the MUSE on the E-MILES templates, we assume the Line Spread Function (LSF) using Equation (8) from Bacon et al. (Reference Bacon2017).
 \begin{equation}\text{LSF}_{\text{MUSE}}(\lambda) = 5.866 \times 10^{-8} \lambda^2 - 9.187 \times 10^{-4} \lambda + 6.040\end{equation}
The difference between LSF of MUSE, and E-MILES (with LSF of 2.5) was used to calculate Sigmas of Gaussian filters to be applied.
 \begin{equation}\sigma(\lambda) = \left( \frac{\sqrt{\max(\text{LSF}_{\text{MUSE}}(\lambda)^2 - \text{LSF}_{\text{E-MILES}}(\lambda)^2, 0)}}{2.355} \right)\end{equation}
These filters were applied to the templates, which were then interpolated onto a standardised wavelength range from 4749.37 to 7100.49 Å, with a sampling interval of 2.48 Å, resulting in 948 samples per spectrum.
2.1. Addition of extinction
Each spectrum within the E-MILES dataset represents a unique stellar population with a single age and metallicity, and assumes zero dust extinction. To accurately model the observed spectral characteristics of galaxies, we need to account for the effects introduced by interstellar dust. We selected a range of dust attenuation values $A_v$
from 0.0 to 1.5 in 16 increments of 0.1, based on the extinction law proposed by O’Donnell (Reference O’Donnell1994) which refines the earlier prescription by Cardelli, Clayton, & Mathis (Reference Cardelli, Clayton and Mathis1989) to better capture behaviour at optical wavelengths. This law is applied with a fixed total-to-selective extinction ratio of
$A_v$
from 0.0 to 1.5 in 16 increments of 0.1, based on the extinction law proposed by O’Donnell (Reference O’Donnell1994) which refines the earlier prescription by Cardelli, Clayton, & Mathis (Reference Cardelli, Clayton and Mathis1989) to better capture behaviour at optical wavelengths. This law is applied with a fixed total-to-selective extinction ratio of $R_V = 3.1$
, a standard value for the diffuse interstellar medium. This approach models extinction as a wavelength-dependent effect using a uniform dust law and fixed
$R_V = 3.1$
, a standard value for the diffuse interstellar medium. This approach models extinction as a wavelength-dependent effect using a uniform dust law and fixed $R_V$
, which simplifies the complex and spatially variable nature of dust in real galaxies. While this may not fully capture local variations in grain composition or geometry, it provides a practical and widely adopted approximation that is suitable for this proof-of-concept model.
$R_V$
, which simplifies the complex and spatially variable nature of dust in real galaxies. While this may not fully capture local variations in grain composition or geometry, it provides a practical and widely adopted approximation that is suitable for this proof-of-concept model.
The $A_v$
range from 0.0 to 1.5 aligns with the typical observational conditions for moderately inclined nearby galaxies. By incorporating these 16 extinction levels, we generated 636 single-population templates per extinction level. This ensures robust coverage across a range of extinction scenarios encountered in most astronomical observations. For more extreme scenarios, such as edge-on galaxies or higher-redshift dusty systems, higher
$A_v$
range from 0.0 to 1.5 aligns with the typical observational conditions for moderately inclined nearby galaxies. By incorporating these 16 extinction levels, we generated 636 single-population templates per extinction level. This ensures robust coverage across a range of extinction scenarios encountered in most astronomical observations. For more extreme scenarios, such as edge-on galaxies or higher-redshift dusty systems, higher $A_v$
values might be necessary. Such conditions fall outside the range for which GalProTE is trained and validated, and could result in abnormal features in the machine learning (ML) results. This will be subject to future work to expand our approach and make it applicable to a wider range of objects.
$A_v$
values might be necessary. Such conditions fall outside the range for which GalProTE is trained and validated, and could result in abnormal features in the machine learning (ML) results. This will be subject to future work to expand our approach and make it applicable to a wider range of objects.
2.2. Generation of combination templates
After incorporating various extinction levels, we generated combination templates of multiple populations to better represent the spectral diversity observed in real galactic data. However, the underlying assumption in generating these combinations is that diverse stellar populations represented within a single template share a common extinction level. This is, of course, simplistic but the same approach is used by pPXF, allowing a more consistent comparison. Thus, templates corresponding to the same extinction value were combined in varying numbers, from 1 (single population) up to 5 templates/populations per extinction value. By supporting up to five population combinations per template, we achieve a balance between capturing spectral complexity and managing computational demands. Each combination consisted of randomly selected templates from the 636 original templates belonging to the same extinction level, with random weights assigned to each template. The sum of these weights was normalised to 1. Each weight represented the relative contribution of the respective template to the composite spectrum, ensuring a realistic representation of the spectral mixtures observed in complex stellar populations.
Using the 636 E-MILES templates, a total of 404496 combinations can be generated when considering just two stellar populations with one set of weights. When weight variations are included, the number of possible combinations becomes theoretically infinite. However, the objective was not to explore every possible combination but to train GalProTE to effectively recognize and decompose multiple stellar populations in real spectra. To strike a balance between diversity and computational feasibility, total templates per combination set were limited to 1272, which is twice the number of original templates per extinction level (636 $\times$
2). This selection ensures a sufficiently diverse dataset for training while keeping computational and time demands manageable. As more powerful GPUs becomes available for training, these combination templates can be increased to generate a larger synthetic dataset and further improve the model’s training potential.
$\times$
2). This selection ensures a sufficiently diverse dataset for training while keeping computational and time demands manageable. As more powerful GPUs becomes available for training, these combination templates can be increased to generate a larger synthetic dataset and further improve the model’s training potential.
Each original template was replicated two additional times, resulting in three original copies per extinction level. This was done to ensure GalProTE learns features in their purest form. Random noise added before training (Section 3.2) can obscure features, but replication reduces the chance that noise will affect the same features in all three copies, preserving feature integrity.
The process of combining templates was randomized, including both the selection of templates and their corresponding weights, to ensure GalProTE was exposed to a broad range of spectral features. This approach enabled the model to learn how to decompose spectra into distinct stellar populations, forming a robust foundation for advanced spectral analysis of galaxies. Table 1 summarizes the composition of Original (plus two replications) and combined templates for each extinction level, resulting in 6996 templates per level across 16 extinction levels. The final dataset, consisting of 111936 templates (6996 $\times$
16) along with their corresponding weight grids, was used as a training, validation, and test dataset for GalProTE.
$\times$
16) along with their corresponding weight grids, was used as a training, validation, and test dataset for GalProTE.
Breakdown of single and combination templates for each value of $A_v$
.
$A_v$
.

3. Methodology
3.1. Processing of grids
The model shown in Figure 1, is designed to predict an age-metallicity grid and an $A_v$
value for the input spectrum. The training set consists of anywhere between 1 to 5 populations per template, resulting in 1–5 non-zero weights on a
$A_v$
value for the input spectrum. The training set consists of anywhere between 1 to 5 populations per template, resulting in 1–5 non-zero weights on a $12 \times 53$
grid. However, grids derived from actual galactic spectra are rarely this sparse, as even single populations appear as tight clusters of neighbouring populations on the age-metallicity grid. To enhance the realism of the generated population grids and better reflect the clustering observed in actual galactic data, we implemented a two-step process to generate the final training grids.
$12 \times 53$
grid. However, grids derived from actual galactic spectra are rarely this sparse, as even single populations appear as tight clusters of neighbouring populations on the age-metallicity grid. To enhance the realism of the generated population grids and better reflect the clustering observed in actual galactic data, we implemented a two-step process to generate the final training grids.
First, the weights drawn for the grid were scaled to incorporate realistic priors based on observations of nearby galaxies (Neumann et al. Reference Neumann2021). Specifically, weights across metallicity values were linearly scaled such that the lowest metallicity value of $-2.27$
was scaled by a factor of 0.7, while the highest metallicity value of
$-2.27$
was scaled by a factor of 0.7, while the highest metallicity value of $0.4$
was scaled by a factor of 1.4. Linear interpolation was applied to assign scaling factors to intermediate metallicity values, ensuring a smooth transition across the grid. This adjustment introduced a bias toward higher metallicity values, which are more prevalent in galaxies like those in the PHANGS-MUSE sample, while maintaining representation of lower-metallicity solutions. The adjusted weights were then normalized to ensure that the total weight of the grid was equal to one.
$0.4$
was scaled by a factor of 1.4. Linear interpolation was applied to assign scaling factors to intermediate metallicity values, ensuring a smooth transition across the grid. This adjustment introduced a bias toward higher metallicity values, which are more prevalent in galaxies like those in the PHANGS-MUSE sample, while maintaining representation of lower-metallicity solutions. The adjusted weights were then normalized to ensure that the total weight of the grid was equal to one.
Second, the normalized grids were smoothed to reflect the clustering of populations typically observed in real galactic data. A Gaussian filter with dimensions of $3 \times 3$
and a sigma value of 0.7 bins was applied to the grids. This filter transformed individual grid points into clusters of nine neighbouring populations while preserving the dominance of the original bin in the cluster. The Gaussian kernel was normalized to ensure that the combined weight of the resulting population cluster remained consistent with the original weight. This smoothing process created more realistic distributions of stellar populations while retaining the priors introduced in the first step.
$3 \times 3$
and a sigma value of 0.7 bins was applied to the grids. This filter transformed individual grid points into clusters of nine neighbouring populations while preserving the dominance of the original bin in the cluster. The Gaussian kernel was normalized to ensure that the combined weight of the resulting population cluster remained consistent with the original weight. This smoothing process created more realistic distributions of stellar populations while retaining the priors introduced in the first step.
Average of Age-Z grids for the entire dataset, before and after the processing.
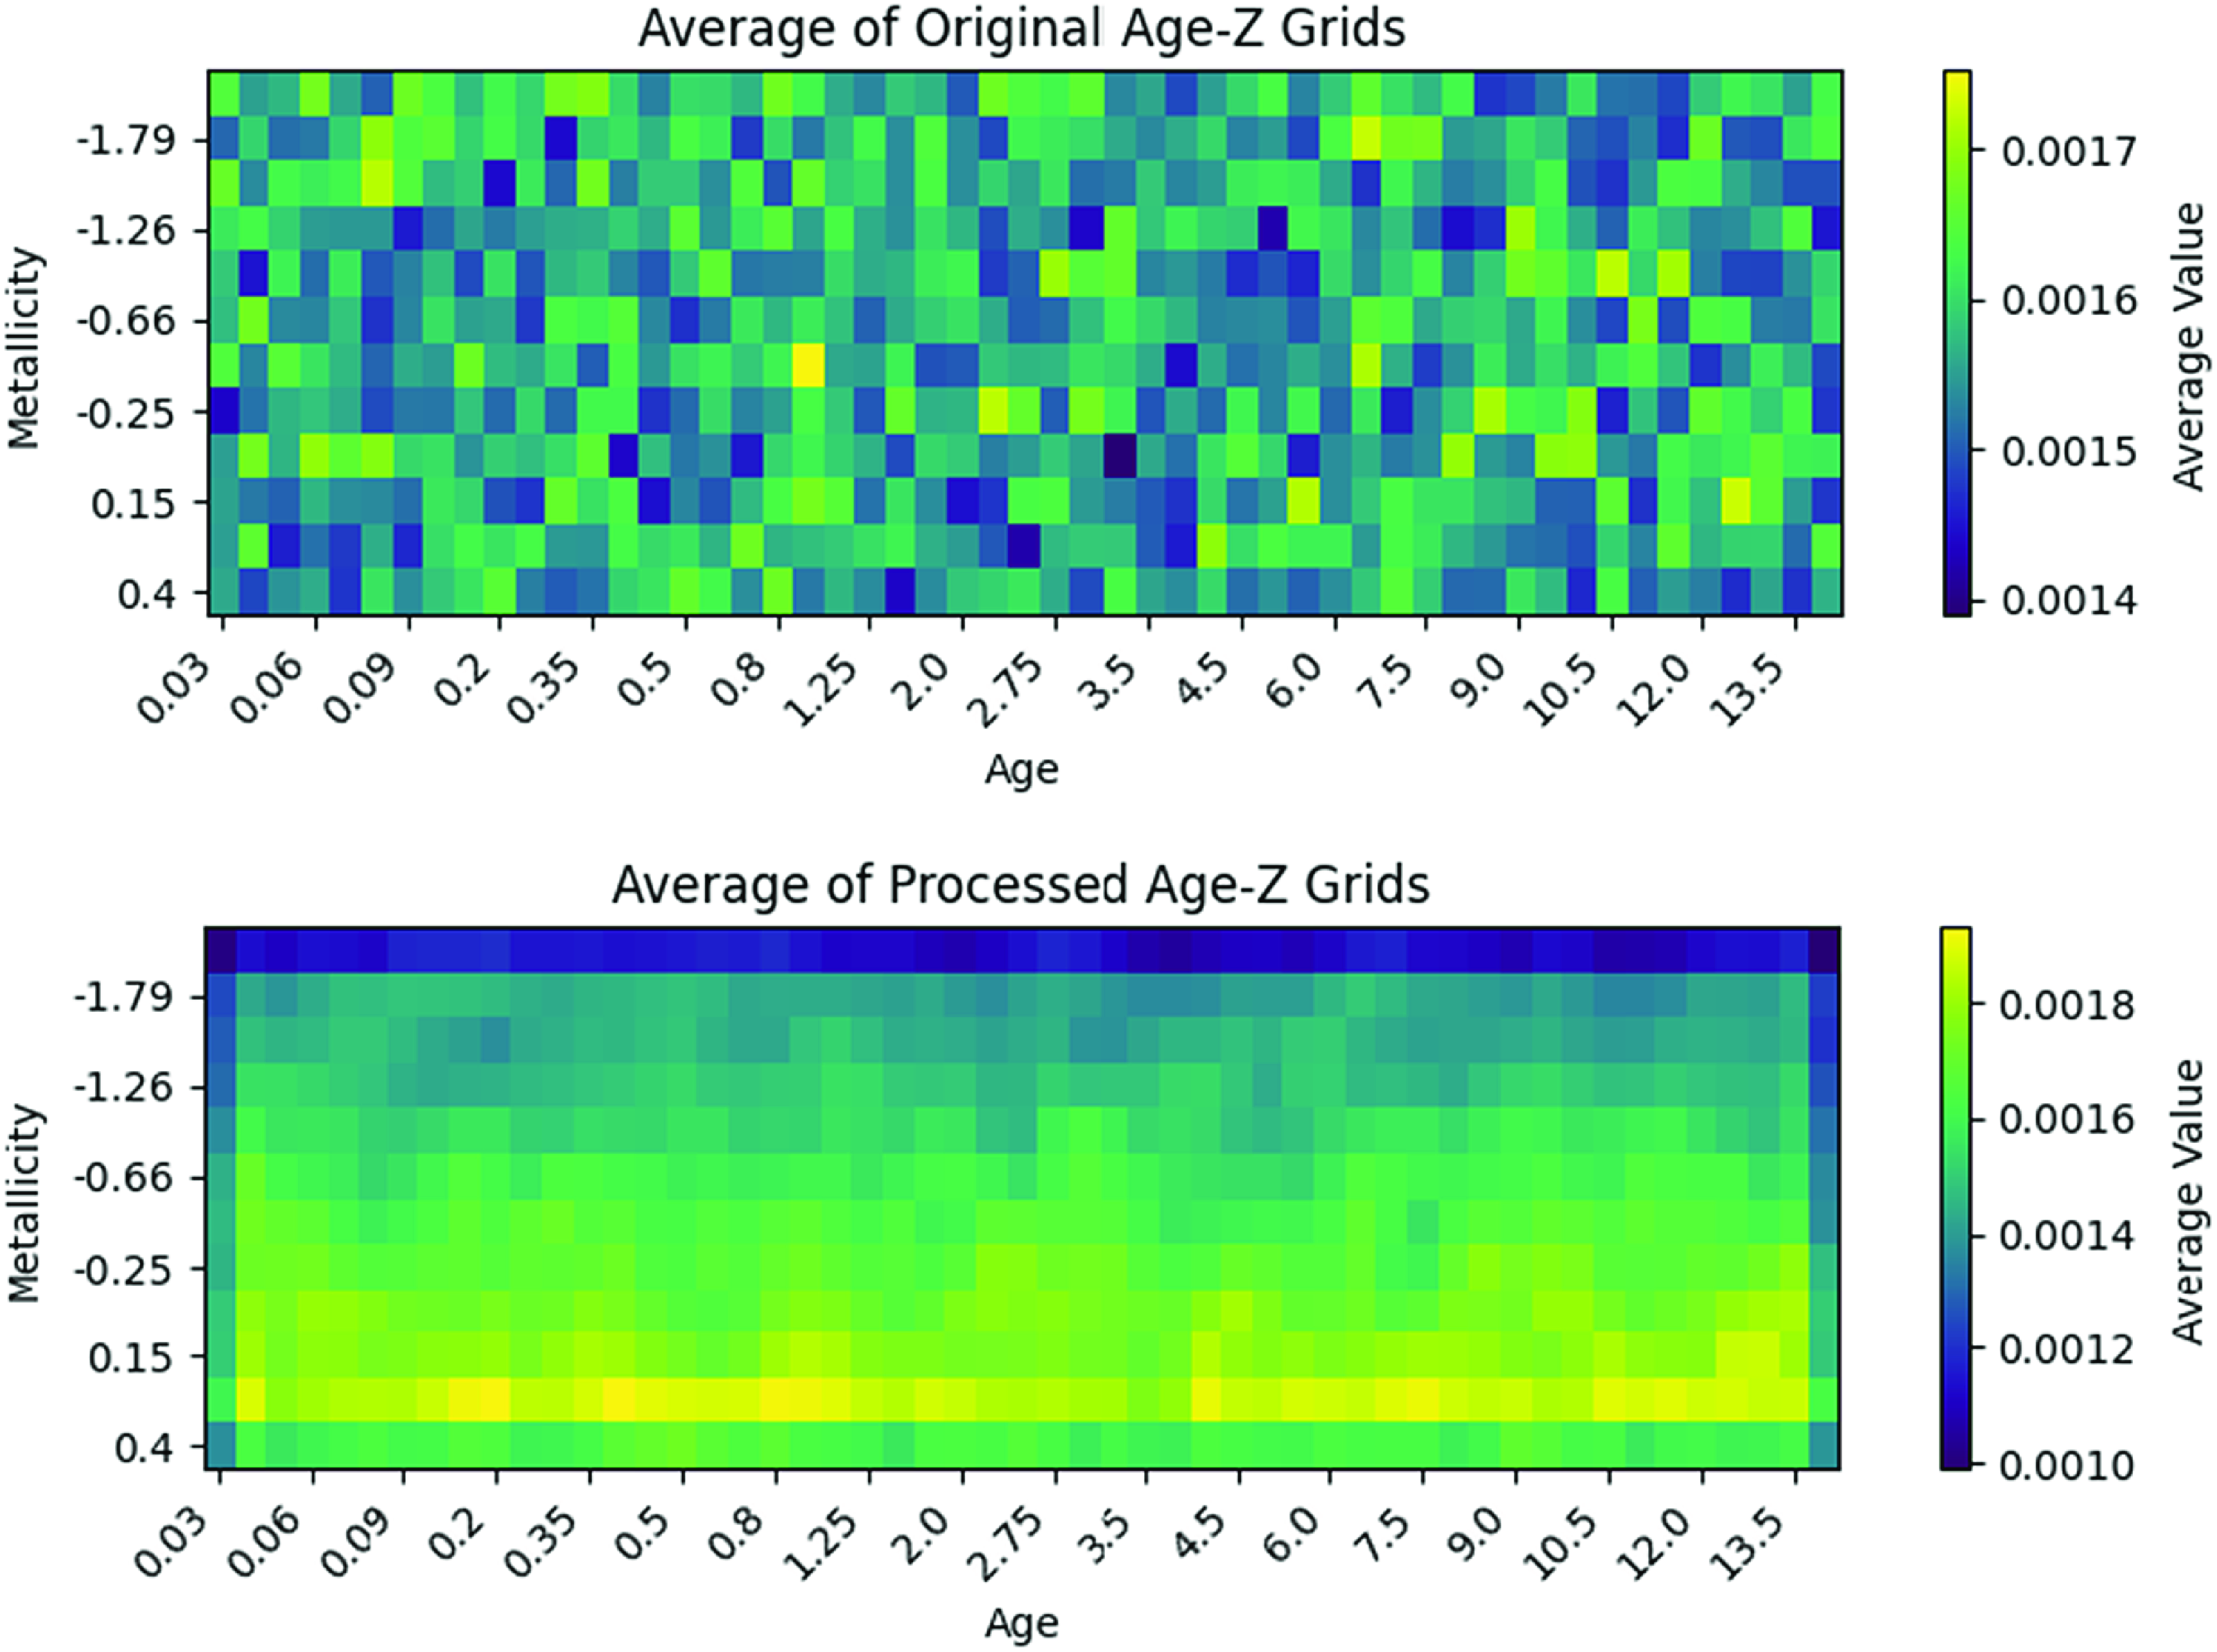
Figure 2 displays the average of the original and adjusted grids across the entire dataset in the age-metallicity plane. The adjustments shift the prior distribution to emphasize metal-rich solutions, aligning with the observed characteristics of nearby galaxies such as those in the PHANGS-MUSE sample. Importantly, the adjustments do not exclude metal-poor solutions but reduce their relative weight to reflect their lower prevalence in these galaxies. The adjusted grids maintain continuity across age values while appropriately representing more metal-rich solutions, which dominate the sample. This approach ensures that the model incorporates prior knowledge while retaining flexibility to explore the full range of parameter space.
Finally, the template spectra associated with each grid were recalculated based on the adjusted and smoothed grid weights and the associated extinction values $A_v$
. This recalculation ensured that the spectra accurately represented the modified distributions of stellar populations.
$A_v$
. This recalculation ensured that the spectra accurately represented the modified distributions of stellar populations.
3.2. Addition of noise to spectra
To enable GalProTE to recognise spectral features both in their pure form and as affected by varying levels of noise, we introduced noise to the spectra in the dataset in a structured manner. Each template (single or combination) spectrum was first normalised by dividing it by its median flux value. Noise was then added to the template spectra, while the respective grids were kept unchanged. This approach was justified by the need to simulate realistic observational conditions. Typically, spectra are binned together to maximise the signal-to-noise ratio (SNR) and bring it to a level of 30–35 (Pessa et al. Reference Pessa2023), corresponding to a noise level of approximately 3.3%. Additionally, there are residuals from skylines subtraction, such as the oxygen line at 6300 Å, which are not included in E-MILES template spectra. By incorporating noise and simulating the effects of median filtering of bright sky subtraction, we aimed to replicate real observational conditions, allowing the model to learn to handle and account for these variations.
For the first phase of noise addition, the entire dataset was randomly shuffled and divided into three equal sets to be treated differently:
-
• The first set had no noise added to preserve features.
-
• The second set was added with a Gaussian noise of 2%.
-
• The third set had 4% Gaussian noise added to it.
To prevent GalProTE from learning to rely solely on specific and prominent features during training, a second phase of noise was added with an aim to significantly alter random features. This noise addition involved two types of modifications to the spectra:
-
• High Noise Patches: Randomly selected patches of spectra were subjected to Gaussian noise of up to 25%, simulating the presence of residuals of skylines subtraction, or other filters applied during pre-processing.
-
• Masked Patches: Randomly selected patches of spectra were replaced with the median value of the respective patch, imitating the masked data often encountered in real observations.
The total number of random patches added to each spectrum ranged from 15 to 25. Each patch was randomly decided to be either a high noise patch or a masked patch. The location and width of each patch were also randomly chosen, varying between 3 and 15 spectral bins, which corresponds to a width of 7.44 to 37.2 Å. For noisy patches, Gaussian noise with a random std deviation between 0 and 25%, but zero mean was applied to ensure that the noise addition did not introduce any systematic bias into the dataset. This combination of noise addition techniques helped the model to generalise effectively across a diverse range of noisy and incomplete data scenarios.
3.3. Masking of emission lines
The addition of high-noise patches to the training data helps mitigate the impact of residuals from skyline filtering/subtraction, which shift their position based on redshift correction. While the E-MILES templates model stellar populations, real galaxy spectra also contain nebular emission lines that are not included in these templates. Hence, to avoid incorrect results, it is essential to mask these regions of the spectra during the fitting process. Table 2 describes the regions that have been masked from the spectra. The masking process involves completely removing these bands from the spectra and stitching the remaining parts together to avoid any discontinuities. A total of 72 samples are masked from the original spectra with 948 samples, resulting in a reduced sample size of 876 samples per spectra.
Masked spectral regions to exclude major emission lines.

3.4. GalProTE architecture
The model architecture is designed to determine the age-metallicity grid and dust attenuation of galaxies or galactic regions by processing their spectral data. The architecture leverages techniques such as self-attention encoders and multiscale feature extraction to handle the complexity and diversity of galactic spectra. Figure 3 shows the core structure of a single block used in the model. Four such blocks operate in parallel with different kernel sizes, and their outputs are concatenated before being passed to two fully connected layers for Age-Z grid and dust attenuation predictions. The following sections provide a detailed overview of the key components and processing steps involved, highlighting how each part contributes to the overall prediction task.
Block diagram of the model’s data flow from input to the Encoder’s output. The self-attention mechanism extracts context from input spectrum, which is then added back to the input spectrum, followed by convolution, batch normalisation, and ReLU activation. After average pooling, data passes through the Transformer Encoder layer with three attention heads, producing the block output.

3.4.1. Self-attention mechanism
GalProTE employs a self-attention mechanism to compute context vectors that highlight relevant features in galactic spectra for predicting age, metallicity, and dust attenuation parameters. The self-attention mechanism enables the model to weigh different parts of the input spectrum and capture important patterns at various wavelengths, which are crucial for the prediction of astrophysical parameters.
The computation for context vectors proceeds as follows:
-
• Projections: The input galactic spectrum is passed through linear layers, which learn to project the spectrum into three different representations: Query (Q), Key (K), and Value (V). These projections are learned parameters, meaning that during training, the model adjusts these linear layers to capture relevant spectral features that are important for distinguishing between different parameters.
-
• Normalisation: After the projections, each of the Q, K, and V representations undergoes layer normalisation. This helps stabilise the learning process by ensuring consistent feature distributions across batches of spectra.
-
• Attention Scores: The model computes attention scores by taking the dot product between the Query (Q) and Transpose of Key ${(K^T)}$
vectors. This measures the similarity between different parts of the spectrum, helping the model identify relationships between certain wavelength regions. These scores are scaled by the square root of the hidden dimension
${\sqrt{d_K}}$
to avoid excessively large values.
${(K^T)}$
vectors. This measures the similarity between different parts of the spectrum, helping the model identify relationships between certain wavelength regions. These scores are scaled by the square root of the hidden dimension
${\sqrt{d_K}}$
to avoid excessively large values. -
• Attention Weights: The attention scores are passed through a softmax function to produce attention weights. These weights reflect the importance of each part of the input spectrum. The higher the weight for a particular wavelength region, the more influence that region has on the output of the respective block.
-
• Context: The attention weights are used to compute context vectors by applying them to the corresponding Value representations. This operation allows the model to focus on the most relevant parts of the input spectrum. These learned Context Vectors effectively summarize this relevant information, which is later used by the model.


Mean context vectors learned by the 4 parallel blocks of model with different kernel sizes, where each block emphasises features of different sizes. These contexts are added to the input spectra, before features are extracted to predict age, metallicity and dust attenuation.

The calculations explained above can be formalized for the 4 blocks as
 \begin{equation}\text{Context}_j = \text{softmax}\left(\frac{Q_j K_j^T}{\sqrt{d_K}}\right) V_j\end{equation}
Where:
-
- j represents the block number of GalProTE.
-
-
$ d_K $
is the dimension of the Key vector (876, same as length of input spectrum). -
-
${Context}_j $
is the learned context vector for block j.


The projections Q, K, and V represent learned embeddings of the input spectrum, enabling the model to identify key spectral features associated with various stellar population parameters. Through backpropagation in the training process, these projections are iteratively refined to improve the accuracy of parameter predictions. For instance, certain spectral regions may have a stronger influence on age estimation, while others may be more indicative of metallicity. The overall spectral shape is particularly important for determining dust attenuation. The extent of these regions can vary, and the self-attention mechanism within each block allows the model to dynamically focus on specific regions/features (with different size) of the spectrum, assigning higher attention weights to areas most relevant for accurate prediction.
Figure 4 shows the average context vector learned by the four blocks of GalProTE for the test dataset. The kernel size in each block determines the scale of features learned. For the kernel size of 11, the model captures high-frequency details, enhancing small, intricate features in the spectra. In contrast, the kernel size of 61 applies a smoother context, focusing on the overall spectral shape. By adding the respective context vector to the input spectra in each block, the model highlights distinct characteristics, which are then processed to extract features.
3.4.2. Parallel processing using different kernels
The Context Vector learned by the attention mechanism (Equation 3) of each block is added to the spectra for further processing. These processing steps comprise of convolutional layers for feature extraction, batch normalisation for stabilisation, rectified linear unit (ReLU) activation for non-linearity, and average pooling to reduce spatial dimensions. Importantly, each block incorporates its own transformer encoder layer that utilises kernel-specific feature extraction based on learned context vector.
 \begin{equation}\text{Context_Spec}_j = \text{Context}_j + \text{Input_Spectrum}\end{equation}
where $ \text{Context}_j $
is the context vector for block j, as computed in Equation (3), and
$ \text{Context}_j $
is the context vector for block j, as computed in Equation (3), and $ \text{Context_Spec}_j $
is the contextualised spectrum which is fed as input to the Convolution layer for block j.
$ \text{Context_Spec}_j $
is the contextualised spectrum which is fed as input to the Convolution layer for block j.
 \begin{equation}{X}_j = \text{ReLU}\left(\text{BatchNorm}\left(\text{Conv}(\text{Context_Spec}_j, W_j, b_j)\right)\right)\end{equation}
where $ \text{Conv} $
denotes the convolution operation with kernel size (11, 21, 31, or 61) specific to corresponding block j. And
$ \text{Conv} $
denotes the convolution operation with kernel size (11, 21, 31, or 61) specific to corresponding block j. And $ W_j $
and
$ W_j $
and $ b_j $
represent the weights and biases of the convolutional layer for block j, respectively.
$ b_j $
represent the weights and biases of the convolutional layer for block j, respectively.
 \begin{equation}{X}_j = \text{AveragePool}({X}_j)\end{equation}
 \begin{equation}\text{Output}_j = \text{Encoder}\left({X}_j\right)\end{equation}
where $ \text{Encoder} $
represent the sequential Transformer Encoder applied to
$ \text{Encoder} $
represent the sequential Transformer Encoder applied to $ {X}_j$
, with 3 heads in the Encoder layer.
$ {X}_j$
, with 3 heads in the Encoder layer.
The outputs from the four convolutional blocks are concatenated and then passed through two separate fully connected layers: one for predicting the metallicity–age grid and another for estimating dust attenuation ( $A_v$
). While the feature extraction backbone is shared between both tasks, each task has a dedicated fully connected layer for its final prediction. The metallicity–age output encodes the fractional contribution of different stellar populations, producing a detailed
$A_v$
). While the feature extraction backbone is shared between both tasks, each task has a dedicated fully connected layer for its final prediction. The metallicity–age output encodes the fractional contribution of different stellar populations, producing a detailed $12 \times 53$
grid. For dust attenuation, GalProTE outputs a
$12 \times 53$
grid. For dust attenuation, GalProTE outputs a $1 \times 16$
array representing class probabilities for
$1 \times 16$
array representing class probabilities for $A_v$
values ranging from 0.0 to 1.5 in 0.1 increments, with the highest probability value selected as the final prediction.
$A_v$
values ranging from 0.0 to 1.5 in 0.1 increments, with the highest probability value selected as the final prediction.
To ensure robustness and generalizability, we evaluated several architectural variants during model development, including Transformer-only, CNN-only, and ResNet-based designs. While Transformer-only models achieved good accuracy on noise-free synthetic spectra, they consistently underperformed on real observational data, particularly when moderate noise was present. The inclusion of CNN layers, with varying kernel sizes, proved essential for extracting robust local features under such conditions. These locally extracted features, when combined with the transformer’s strength in modelling global dependencies, led to superior performance across both synthetic and real datasets. This hybrid design forms the foundation of GalProTE’s architecture and underpins its effectiveness in realistic, noisy environments.
3.4.3. Grid clipping
To enhance the accuracy and reliability of the predicted Age-Z grids, we implement a clipping mechanism that removes weights contributing less than 5% relative to the highest weight in each predicted grid. Noise in the spectra translates into noise on the predicted grid. The clipping of the predicted grid mitigates uncertainties and noise by filtering out the least significant weights. The cutoff threshold can be adjusted to filter out populations from the grid to any desired extent. However, through testing, a 5% threshold of the maximum weight in the respective grid was identified as the best cutoff based on the MSE of spectral fits. The weights below the 5% threshold are clipped to zero by the model, reducing the impact of noise in the spectra without suppressing the populations with weights above 5%. The remaining weights after clipping are normalised to ensure that the sum of weights across each grid equals one.
3.5. Training, validation, and testing
The process of training, validation, and testing GalProTE involves leveraging the dataset with pre-processing steps such as smoothing and weight shifting (Section 3.1), addition of noise (Section 3.2), and masking (Section 3.3), with the aim that the model generalises well to real-world galactic spectra. The entire dataset, consisting of 111936 synthetic spectra with various noise levels, is used for training, validation, and testing. These three sets have the same underlying noiseless base of 111936 spectra, but each set is constructed using independently generated random noise, ensuring that the input spectra are distinct across the training, validation, and test sets. This approach enables consistent ground-truth labels while allowing the model to generalise across different noise conditions.
During the training phase, the model iteratively processes batches of data, updating its parameters and attention weights to minimise the defined loss function. After each epoch, the model’s performance is validated using the validation set. To prevent over-fitting, we employ early stopping on grid MSE loss with a patience of 3 epochs. This means that if the model’s performance on the validation set does not improve for three consecutive epochs, the training process is halted. This avoids over-training and the model retains its generalisation capability.
Once the training is complete, the final model is evaluated on the test set to assess its performance. The total time required for training, validating, and testing the model, along with generating the evaluation plots, is around 12 and a half hours using an NVIDIA GeForce RTX 4090 GPU with 24 GB of memory, with a power rating of 450W. The results of testing the model are discussed in detail in Section 4.
3.5.1. Loss function
The loss function plays a critical role in guiding the model’s learning process. For GalProTE, a custom loss function combines mean squared error (MSE) with weighted correlation losses for age and metallicity to direct the model’s learning. MSE Loss penalises the difference between predicted and target grids, ensuring that the predicted weights on the grid are close to the target weights. Weighted Correlation Loss preserves structural correlation within grids by computing Metallicity Correlation and Age Correlation between the predicted and target grids. Correlation Loss is calculated as $(1 - \text{correlation})$
for both metallicity and age. MSE loss is also employed for the dust attenuation values. This approach, using MSE for individual value accuracy and correlation losses to maintain structural relationships, ensures that the model learns to predict the age-metallicity grids, and dust attenuation values as closely as possible while preserving the inherent correlation.
$(1 - \text{correlation})$
for both metallicity and age. MSE loss is also employed for the dust attenuation values. This approach, using MSE for individual value accuracy and correlation losses to maintain structural relationships, ensures that the model learns to predict the age-metallicity grids, and dust attenuation values as closely as possible while preserving the inherent correlation.
4. Results and analysis
In this section, we discuss the results of the GalProTE and analyse the outcomes. Testing GalProTE with the synthetic E-MILES test set provides valuable insights into the model’s training and any potential biases. However, the actual performance of the model can only be assessed when evaluated on real galactic data. As such, in the second part of this section, we will test our model on two galaxies extracted from the PHANGS-MUSE sample: NGC4254 and NGC5068. These face-on galaxies have been chosen to test different ranges of metallicities, star formation rates and noise levels.
This work primarily focuses on fitting the light-weighted spectra to derive stellar ages and metallicities from the predicted grids. The light-weighted spectra are obtained by normalizing the observed spectra using their respective median flux. For the selected range of E-MILES spectra, the median flux is centred at 5886 Å for the synthetic data. However, due to the noise in the galactic spectra, the wavelength corresponding to the median flux varies slightly, typically falling within the range of 5876–5896 Å for NGC4254 and NGC5068.
A test spectrum with 0% Gaussian noise, high-noise patches, and masked patches. The first subplot compares the noisy input spectrum with the predicted spectrum. Some of the high noise patches are shown using brown rectangles, whereas green ellipses show some of the masked patches in the input spectra. The second subplot shows the residuals between the input and predicted spectra. The third subplot displays the grid predicted by the model, with the mean age and metallicity bin marked. The fourth subplot presents the grid of the original noise-free input spectrum. The residuals are primarily concentrated in high-noise and masked patches, with some impact from the mismatch of 0.1 in Av. Overall, the predicted grid and the reconstructed spectra demonstrate promising accuracy.

4.1. Performance on synthetic test dataset
To evaluate the performance of GalProTE, we conducted extensive tests using the synthetic test dataset. This test set consists of the same 111936 synthetic spectra (Section 2) which were used for training and validating the model (Section 3), but has its own noise profile (random Gaussian noise of various levels, random high-noise, and masked patches at random locations), which makes it different from the training and validation sets. This subsection presents the results for grid predictions, leading to age, metallicity predictions, as well as the prediction of dust attenuation on the test set. We employ histograms, confusion matrices and MSE distributions to assess the model’s effectiveness.
Figures 5, 6, and 7 illustrate how GalProTE performs on test spectra with varying levels of Gaussian noise (0%, 2%, and 4%), as well as high-noise patches and masked regions. The top subplot in each figure shows the input spectrum alongside the predicted spectrum, demonstrating the model’s ability to reconstruct the spectra. While the predicted spectra generally align well with the inputs, the residuals reveal areas of discrepancy, often concentrated in high-noise regions and masked patches.
A test spectrum with 2% Gaussian noise, high-noise patches, and masked patches. The predicted mean metallicity aligns closely with the original metallicity on the grid, while the predicted age shows some error. The model tends to struggle for higher age values. However, the most dominant population on the predicted grid (bright yellow) is notably closer to the original mean age.

A test spectrum with 4% Gaussian noise, high-noise patches, and masked patches. This example poses a significant challenge due to the high level of Gaussian noise and the close proximity of the four populations on the original grid. Despite these, the predicted mean values remain close to the original means, and the spectral fit demonstrates reasonable quality, showcasing the model’s robustness under adverse conditions.

Figure 7 presents a challenging case of a high noise spectrum, where the 4 populations (shown in the original grid at the bottom) are close to each other. The model struggles to distinguish between these populations in the predicted grid. The input spectrum’s grid suggests a mean metallicity of [M/H]=0.174 and log(Age)=9.43, while the predicted grid points to a lower metallicity of [M/H]=0.084 and a slightly older log(Age)=9.55. These variations likely result from the model’s attempt to balance the noisy input with the features it learned during training, potentially smoothing out some of the higher metallicity contributions. Similarly, while the original dust attenuation value is 1.5 mag, GalProTE predicts a slightly lower value of 1.3 mag, possibly due to the model’s sensitivity to noise and its handling of masked regions in the input spectrum. For the mean age and metallicity predictions, the model’s performance is very reasonable, even in this challenging case of high noise spectrum and closely spaced populations.
The average inference time for GalProTE is approximately 4 ms per spectrum, which includes predicting the best-fitting grid, retrieving the associated synthetic spectrum, and computing residuals. This excludes post-processing tasks such as 2D map generation and plots for comparison. For example, the spectral fitting for NGC4254 (64985 spectra) and NGC5068 (37690 spectra) was completed in just 245 and 148 sec, respectively. This makes GalProTE well suited for real-time or large-scale analysis.
4.1.1. Ages
The histogram in Figure 8 shows the distribution of original and predicted mean ages across the entire test set. For this analysis, the mean age of the populations represented in the templates is used. The overall agreement between the original and predicted age distributions highlights GalProTE’s effectiveness in capturing the age characteristics. The difference between the mean age of the original dataset and the predictions is 0.21 GYr. The confusion matrix for predictions has a prominent diagonal dominance, indicating that the model accurately predicts most ages, with minimal confusion between different age bins. However, the model shows limited performance for the age bins on the higher end in the test set, consistently underestimating these values. Conversely, there are overestimates for the lowest age bin of 0.03 GYr. These misclassifications are largely attributed to the training set imbalance, where the mean ages of templates follow a Gaussian-like distribution. Because of this imbalance, the model tends to be biased towards predicting ages towards the centre of this distribution.
Histogram on the top and confusion matrix on the bottom for the original and the predicted mean ages.

4.1.2. Metallicities
The histogram in Figure 9 displays the distribution of original and predicted mean metallicities. The close match between the distributions indicates the model’s proficiency in identifying metallicity levels in the synthetic data. The bias towards higher metallicities introduced in the training and testing data (Section 3.1) is also prominent, and is more obvious in metallicities predicted by GalProTE. The error between mean metallicity of original dataset and the predictions is only 0.04. The confusion matrix for mean metallicity predictions shows misclassifications for the lowest (−2.27) and highest (0.4) metallicity bins. For other metallicities, a concentration along the diagonal highlights the model’s accuracy in classifying the bulk of the metallicity values.
Histogram on the top and confusion matrix on the bottom for the original and the predicted mean metallicities.

4.1.3. Dust attenuation
Figure 10 presents a histogram comparing the distribution of original and predicted dust attenuation values. The original labels show a flat distribution for dust attenuation as the dataset contains an equal number of examples for each attenuation value, unlike age and metallicity where the distribution is Gaussian because of the random combination of templates. The error between the mean extinction of the original dataset and the predictions is 0.01 mag, indicating a negligible bias. However, the performance of GalProTE in estimating the attenuation is somewhat less optimal when compared to ages and metallicities. The histogram reveals a tendency for the model to favour certain $A_v$
predictions over others. Despite this, the confusion matrix indicates that when the model misclassifies the dust attenuation values, the errors are generally small, with predictions remaining close to the actual values.
$A_v$
predictions over others. Despite this, the confusion matrix indicates that when the model misclassifies the dust attenuation values, the errors are generally small, with predictions remaining close to the actual values.
Histogram on the top and confusion matrix on the bottom for the original and the predicted dust attenuation.

4.2. Spectral errors
4.2.1 Mean squared error on the test set
For each predicted grid in the test set, we generate the predicted spectrum integrating the E-MILES templates using the corresponding predicted weights within the grid. We then calculate the Percentage MSE between the predicted spectrum and the input spectrum. The input spectra have been subjected to varying noise levels, while the predicted spectra are derived from the pure E-MILES templates without any added noise. Figure 11 illustrates the distribution of MSE across the entire test set, which ranges from 0% to 3%, with a mean of 0.27% and standard deviation of 0.10. This figure also shows the relationship between MSE and the resulting errors (original – predicted) in age, metallicity and dust attenuation. The error in age has a mean of 0.02 dex with a standard deviation of 0.25 and is not shown as a function of MSE error. The error in $A_v$
has a mean of 0.01, with a standard deviation of 0.16 and also does not correlate with the MSE error. However, the error in Z indicates that GalProTE tends to over-predict metallicities as MSE increases. The histogram of Z error distribution reflects this as a mean error (bias) of -0.12 with a standard deviation of 0.27.
$A_v$
has a mean of 0.01, with a standard deviation of 0.16 and also does not correlate with the MSE error. However, the error in Z indicates that GalProTE tends to over-predict metallicities as MSE increases. The histogram of Z error distribution reflects this as a mean error (bias) of -0.12 with a standard deviation of 0.27.
Errors in age (dex), dust attenuation ( $A_v$
) and metallicity ([M/H]) predictions plotted against the % MSE of the test set.
$A_v$
) and metallicity ([M/H]) predictions plotted against the % MSE of the test set.

4.2.2. Point-to-point spectral errors
In order to assess the performance of GalProTE in predicting spectra, we evaluated its predictions against both synthetic and PHANGS-MUSE data (NGC4254 and NGC5068). The next section presents a comparison between galactic maps generated by this model and those produced by pPXF. Before delving into this comparison, it is crucial to establish confidence in the quality of the spectral fits generated by the model for the test and the galactic spectra. By comparing the predicted spectra with the actual input spectra, we measured point-to-point discrepancies/residuals and assessed the model’s precision. These residuals provide valuable insights into the model’s ability to accurately capture the nuances of spectral features across the test dataset, as well as complex observational data.
The point-to-point errors were calculated with both input and predicted spectra normalised to a median flux value of 1. For the synthetic test set, which consists of 111936 templates with 876 samples per template (totalling over 98 million points), the mean point-to-point error between input spectra and fitted spectra is -0.02%, with a standard deviation of 5.2%, as shown in Figure 12. This indicates that GalProTE’s predictions are, on average, extremely close to the actual values, with minimal deviations. The error distribution in the test set is centred around zero, suggesting that the model effectively captures the underlying features of the spectra used during training. The low standard deviation further supports the model’s robustness, as most predictions deviate only slightly from the actual spectra.
Histograms of the residuals between the input and the predicted spectra.

In the case of NGC4254, the mean point-to-point error is also -0.02%, with a standard deviation of 4.3%. The consistently low mean error indicates a good overall fit for this galaxy. The reduced standard deviation compared to the test set suggests that GalProTE performs consistently well on this real galactic data. The histogram of errors for NGC4254 shows that the majority of errors are clustered around 0, demonstrating the model’s capability to generalise well from synthetic data to real observational data.
For NGC5068, the mean point-to-point error is 0.28%, with a standard deviation of 5.3%. The mean error is slightly higher than that of the NGC4254, because of relatively poor SNR and the velocity gradient. The standard deviation is comparable to that of test set, suggesting consistent performance. Overall, GalProTE achieves high accuracy and robustness, with mean residuals below 0.3% and standard deviations near 5% across both synthetic and observational data. Slightly higher errors in NGC5068 reflect the added complexity of real observations, yet the model maintains consistent performance, validating its ability to generalise from synthetic to real spectra and support efficient galactic analysis.
4.3. Comparison with pPXF maps from PHANGS-MUSE
This section provides the comparison between the maps generated by GalProTE and those produced by pPXF as part of the PHANGS pipeline (see Emsellem et al. Reference Emsellem2022), using MUSE data cubes for two galaxies from the PHANGS-MUSE survey. For this comparison, we focus exclusively on light-weighted (LW) spectra for both galaxies, in the range of 4750–7100 Å. The spectra were pre-processed to correct for redshift (assuming a single redshift per galaxy) and to filter out bright lines using median filters. Additionally, major emission lines were masked as described in Section 3.3.
There are several key distinctions between the two methods being compared. pPXF in the PHANGS-MUSE pipeline is run twice: the first iteration determines extinction, which is then fixed in the second iteration for extracting stellar properties. A multiplicative polynomial is applied in this step to correct residual systematics in flux calibration and does not employ regularization. In contrast, our approach does not include such a polynomial correction and uses a single iteration for extracting all three stellar properties. Additionally, the age-metallicity grid used by pPXF ( $6 \times 13$
) is of lower resolution than our model’s grid (
$6 \times 13$
) is of lower resolution than our model’s grid ( $12 \times 53$
) (see Section 2). For further details on pPXF’s configuration in PHANGS-MUSE, see Emsellem et al. (Reference Emsellem2022).
$12 \times 53$
) (see Section 2). For further details on pPXF’s configuration in PHANGS-MUSE, see Emsellem et al. (Reference Emsellem2022).
4.3.1. Ages
From the age maps of both NGC4254 and NGC5068 (Figures 13a and 14a), it is clear that the proposed approach results in a smoother, less noisy, and higher local dynamic range of stellar population distribution compared to PHANGS-MUSE. The probability distribution function (PDF) for the GalProTE is narrower, indicating tighter constraints on the predicted ages, and some systematic bias leaning away from lowest and highest ages in the training data. Despite the differences in structure, the mean ages between the two methods are consistent, with mean differences of 0.04 and 0.09 dex. The standard deviations of predicted age maps are 0.29 dex for NGC4254 and 0.37 dex for NGC5068, both lower than their respective pPXF maps.
Age maps and running difference for NGC4254.

Age maps and running difference for NGC5068.

The difference maps between the two methods exhibit noticeable structure, suggesting that at least part of the discrepancy arises from how pPXF and GalProTE handle different spectral features. This trend becomes more apparent when examining the running difference between the two age maps (Figures 13b and 14b), where the largest deviations occur for ages that significantly diverge from the average population age. For both galaxies, GalProTE tends to underestimate older ages and overestimate younger ages, biasing the predictions toward the mean age in the training data.
4.3.2. Metallicities
For both galaxies, the metallicity maps generated by GalProTE display more pronounced structure compared to pPXF (Figures 15a and 16a). This suggests that the proposed model is more affected by the spatial variations within the galaxies compared to PHANGS-MUSE. While the overall mean metallicity are consistent within 0.09 dex for NGC4254 and 0.06 dex for NGC5068, there are distinct differences in how the methods allocate metallicity across the maps.
Metallicity maps and running difference for NGC4254.

Metallicity maps and running difference for NGC5068.

As already seen in the case of stellar ages, when it comes to metallicities GalProTE overestimates stellar metallicities with respect to pPXF for values below the average value observed in the target galaxy, and underestimates its value for higher metallicities (see Figures 15b and 16b)
Interestingly, it appears that GalProTE assign the normalisation offsets in the data due to issues with sky subtractions to metallicity, contrary to what was observed in the case of pPXF, where normalisation issues between MUSE pointings mainly affect the extinction estimates. This distribution of residuals, combined with the structural differences in the maps, highlights how the proposed approach responds differently to the spectral features of the galaxies.
4.3.3. Dust attenuation
The dust attenuation ( $A_v$
) maps for NGC4254 and NGC5068 exhibit both similarities and key differences (Figures 17a and 18a). In both galaxies, GalProTE successfully captures the overall dust structure. However, for NGC4254, the difference histogram reveals a mean dust attenuation error of -0.13 mag, with the residuals from the sky background subtraction contributing significantly to this error. Removing the outliers (as shown by the blue shaded area) improves the mean difference to -0.05 mag, with a reduced standard deviation of 0.22 mag. The differences between the two methods in this case highlight how the proposed approach is more sensitive to poor SNR and sky residuals, which particularly affect the dust attenuation predictions.
$A_v$
) maps for NGC4254 and NGC5068 exhibit both similarities and key differences (Figures 17a and 18a). In both galaxies, GalProTE successfully captures the overall dust structure. However, for NGC4254, the difference histogram reveals a mean dust attenuation error of -0.13 mag, with the residuals from the sky background subtraction contributing significantly to this error. Removing the outliers (as shown by the blue shaded area) improves the mean difference to -0.05 mag, with a reduced standard deviation of 0.22 mag. The differences between the two methods in this case highlight how the proposed approach is more sensitive to poor SNR and sky residuals, which particularly affect the dust attenuation predictions.
Dust attenuation maps and running difference for NGC4254.

Dust attenuation maps and running difference for NGC5068.

For NGC5068, the sky residual’s impact on the dust attenuation maps is notably smaller compared to NGC4254. However, the GalProTE predicted dust attenuation map exhibits a significant offset with a mean error of -0.21 mag. This offset is most prominent in regions of the galaxy with poor SNR. Excluding the outliers from these low-SNR regions leads to substantial improvements in both the mean and standard deviation of the difference profile. Despite the presence of outliers towards the galaxy’s edges, the overall dust structures remain quite similar between the two approaches, reflecting the model’s robustness in dealing with extinction, even in regions where data quality is less reliable.
As in the case of stellar metallicities, some of the systematic differences observed in the maps generated by pPXF and GalProTE can be attributed to the inherent effects of sky subtraction and filtering in the mosaic data. The residuals from sky subtraction in the reduction process of PHANGS-MUSE (Pessa et al. Reference Pessa2023), and the median filtering of bright lines for GalProTE can introduce subtle artefacts and variations that are processed differently by each method. These discrepancies can lead to distinct differences in the resulting maps. While pPXF applies corrections that may suppress or amplify specific features, GalProTE may interpret and propagate these residuals differently, leading to the systematic variations observed between the maps.
5. Discussion
5.1. Advantages over traditional methods
This approach offers significant speed advantages over traditional methods. Using GalProTE, the spectral fits for NGC4254 (with 64985 spectral bins) and NGC5068 (with 37690 spectral bins) were completed in just 245 and 148 sec, respectively. In contrast, pPXF takes up to 11 s to fit a single spectrum (Woo et al. Reference Woo, Walters, Archinuk, Faber, Ellison, Teimoorinia and Iyer2024). With GalProTE, more than 250 spectral fits are generated per second, equating to less than 4 ms per fit. This represents a performance boost of over 2750 times compared to traditional methods. Such a dramatic improvement in efficiency not only accelerates galactic studies but also enables the analysis of much larger datasets that were previously too time-consuming to handle.
Although GPUs like the NVIDIA RTX 4090 consume significantly more power than CPUs, their extreme speed advantage makes them far more energy-efficient for large-scale spectral fitting. The RTX 4090, with a power draw of 450W, processes 250 spectra per second, resulting in an energy consumption of 1.8W per spectrum. In contrast, pPXF running on a single core of an Intel i9-13900K (which consumes 10.5W per core) processes just 0.09 spectra per second, requiring 117W per spectrum.
When applied to the NGC4254 dataset, this translates to a total energy consumption of 117kW (or 30.6Wh) for GalProTE versus 7.6MW (or 2085Wh) for pPXF – a staggering 68-fold improvement in energy efficiency. Even under conservative estimates, this efficiency gain makes GalProTE not only a computationally superior choice but also a significantly more sustainable one, reducing both computational cost and environmental impact in large-scale astronomical analyses.
5.2. Limitations and potential improvements
The model’s reliance on synthetic E-MILES data presents a limitation, as synthetic data, even with added noise, cannot fully capture the complexities and nuances of real astronomical observations. Additionally, the model’s performance is constrained by the rest-frame wavelength range of 4749.37–7100.49 Å, limiting its applicability to data outside this range. Another challenge lies in the imbalance within the training dataset, which leads to a Gaussian-like distribution of mean age and metallicity. This imbalance causes GalProTE to over-predict lower values and under-predict higher values. Future work will address these issues by creating a more balanced training dataset and implementing strategies such as adaptive loss functions or re-weighted sampling to mitigate biases at parameter boundaries.
GalProTE is optimized for PHANGS-MUSE data, necessitating adjustments for use with other instruments and surveys. With fine-tuning, it can accommodate different spectral resolutions and metallicity distributions across surveys. Additionally, while the current model predicts a 2D age-metallicity grid with a separate dust attenuation value, extending it to a fully integrated 3D age-metallicity-extinction grid could improve the interpretation of mixed stellar populations with varying dust attenuation.
The decision to test face-on galaxies was intentional, as their simpler velocity structures minimize the impact of kinematics on spectral fitting. This allowed us to refine the model’s ability to extract stellar population properties efficiently. However, GalProTE does not account for velocity dispersion or kinematic broadening, which could introduce biases in systems with strong velocity gradients. Future improvements may explore incorporating kinematic priors or leveraging ML-based velocity modelling techniques to extend the model’s applicability to more dynamically complex galaxies.
In this study, we adopted the Chabrier IMF, which is widely used in modern extragalactic research and offers a balanced representation of stellar populations compared to the more top-heavy Salpeter and bottom-lighter Kroupa IMFs. While suitable for a proof-of-concept model, we acknowledge that the choice of IMF (as well as isochrones) can influence spectral features and inferred properties. A systematic investigation of how GalProTE’s predictions respond to different IMF assumptions could be explored in future work.
It may also be possible to explore more advanced generative approaches such as diffusion models (Chen et al. Reference Chen2023), which have demonstrated strong performance on time-series data under noisy conditions. Although current applications of diffusion models primarily target anomaly detection and imputation tasks, investigating their potential for structured grid prediction in spectral analysis could yield additional robustness and modelling flexibility.
Integrating deep learning techniques into astronomical research significantly improves analysis efficiency, enabling more detailed insights into galaxy formation and evolution. This approach fosters collaboration between data scientists and astronomers, driving innovation in methodologies and contributing to significant scientific discoveries. GalProTE not only serves as a practical tool for current research but also lays the groundwork for future advancements.
6. Summary
This study presents GalProTE, a cutting-edge deep learning model designed to revolutionize galactic spectral analysis by providing rapid, accurate estimates of stellar age, metallicity, and dust attenuation. Leveraging an expanded E-MILES dataset with 111936 varied templates, GalProTE is trained to disentangle complex spectral features, incorporating multiple dust attenuation and noise levels to enhance robustness. Its architecture, built on four parallel attention-based encoders with multi-scale kernels, efficiently predicts a high-resolution $12 \times 53$
metallicity-age grid – significantly finer than the grids typically used in spectral fitting tools – setting a new benchmark in spectral analysis. Performance evaluation on both synthetic and real galactic spectra demonstrates very good accuracy, with spectral fit residuals averaging below 0.3% and a standard deviation of around 5%. However, its true breakthrough lies in computational efficiency: GalProTE accelerates spectral fitting from 11 sec per spectrum with pPXF to under 4 ms – a staggering speed-up of over 2750 times. Beyond speed, it is also 68 times more power-efficient, significantly reducing the computational footprint for large-scale astronomical surveys. While currently optimized for PHANGS-MUSE data, GalProTE’s adaptable framework allows fine-tuning for different instruments, spectral resolutions, and observational conditions, ensuring its versatility across future surveys. By combining state-of-the-art deep learning, computational sustainability, and large-scale scalability, GalProTE offers a transformative approach to mapping galactic properties, paving the way for faster, more efficient, and environmentally conscious astronomical research.
$12 \times 53$
metallicity-age grid – significantly finer than the grids typically used in spectral fitting tools – setting a new benchmark in spectral analysis. Performance evaluation on both synthetic and real galactic spectra demonstrates very good accuracy, with spectral fit residuals averaging below 0.3% and a standard deviation of around 5%. However, its true breakthrough lies in computational efficiency: GalProTE accelerates spectral fitting from 11 sec per spectrum with pPXF to under 4 ms – a staggering speed-up of over 2750 times. Beyond speed, it is also 68 times more power-efficient, significantly reducing the computational footprint for large-scale astronomical surveys. While currently optimized for PHANGS-MUSE data, GalProTE’s adaptable framework allows fine-tuning for different instruments, spectral resolutions, and observational conditions, ensuring its versatility across future surveys. By combining state-of-the-art deep learning, computational sustainability, and large-scale scalability, GalProTE offers a transformative approach to mapping galactic properties, paving the way for faster, more efficient, and environmentally conscious astronomical research.
Acknowledgements
We would like to extend our sincere thanks to the PHANGS-MUSE team for generously sharing the spectral data and maps for NGC4254 and NGC5068. Their contribution enabled the detailed analysis and validation of GalProTE’s performance. Luca Cortese and Adam B. Watts acknowledge support from the Australian Research Council Discovery Project funding scheme (DP210100337).
Appendix A. Alternative Approach for Dust Attenuation
In this appendix, we present dust maps for the galaxies NGC4254 and NGC5068 generated using an alternative approach. While GalProTE utilised an ML model to predict dust attenuation values along with age and metallicity from the input spectra, the alternative method focused solely on predicting age and metallicity. Based on the predicted Age-Z grid, a total of 16 variants of the predicted spectrum, ranging from $A_v$
values of 0 to 1.5 with an interval of 0.1 were generated. These variants were compared with the input spectrum, and the
$A_v$
values of 0 to 1.5 with an interval of 0.1 were generated. These variants were compared with the input spectrum, and the $A_v$
corresponding to the variant with the lowest mean square error (MSE) was selected as the final dust attenuation value, and used to construct the dust maps. This approach relied on the accuracy of Age-Z grid for
$A_v$
corresponding to the variant with the lowest mean square error (MSE) was selected as the final dust attenuation value, and used to construct the dust maps. This approach relied on the accuracy of Age-Z grid for $A_v$
estimation.
$A_v$
estimation.
Figures A1a and A2a illustrate the dust attenuation maps for NGC4254 and NGC5068 respectively, derived using this alternative approach. While these predicted maps exhibit a Gaussian-like distribution, the difference plots show a higher negative mean (-0.21 and -0.28 mag) compared to the ML-predicted dust attenuation (-0.13 and -0.21 mag). This shows that the alternative approach over-estimates the dust attenuation. Another key distinction lies in the performance within low signal-to-noise ratio (SNR) regions, where manual fitting of dust attenuation is closer to the pPXF results compared to the ML predictions, as evidenced by the absence of side lobes in the predicted $A_v$
histograms of this approach. The manual fitting method, however, increases computation time, achieving approximately 60 fits per second, compared to the 250 fits per second achieved by the ML approach. The lower mean difference of the ML dust attenuation maps and faster computation makes them our preferred choice.
$A_v$
histograms of this approach. The manual fitting method, however, increases computation time, achieving approximately 60 fits per second, compared to the 250 fits per second achieved by the ML approach. The lower mean difference of the ML dust attenuation maps and faster computation makes them our preferred choice.
Alternative approach: Dust attenuation maps of NGC4254.

Alternative approach: Dust attenuation maps of NGC5068.


 Open access