


Introduction
A growing number of cities in the United States of America (U.S.) has been developing action plans and strategies to fully decarbonize urban transportation (Kerry Reference Kerry2021). One central pillar of the strategic approaches towards more sustainable modes of transportation is the widespread adoption of zero-emission vehicles (ZEVs), including plug-in full battery electric vehicles (BEVs). Consequently, U.S. cities have defined targets for BEVs adoption pathways that are accompanied by various policy instruments, which are supposed to propel the diffusion of BEVs (Bui et al. Reference Bui, Slowik and Lutsey2021). Generally, policy instruments for BEV transitions can be categorized according to its type and purpose into three broader categories: Economic instruments aim to stimulate demand by affecting primarily the total cost of ownership of BEVs (e.g., purchase subsidy or reduced registration tax); Regulatory instruments aim to support market and user-centric conditions (e.g., implementing CO2 emissions standards or free access to high-occupancy vehicle lanes); Informational instruments aim to improve awareness of electric vehicle technologies in the society (e.g., vehicle dealer education) (Whitehead et al. Reference Whitehead, Plötz, Jochem, Sprei, Dütschke and Vickerman2021). Since the introduction of BEVs, policy instruments at the federal, U.S. state and city-related levels have been introduced. Such instruments vary in type, purpose and scope, as different policy levels bring forth different policy instruments (Slowik and Lutsey Reference Slowik and Lutsey2017, Reference Slowik and Lutsey2019; Coffman et al. Reference Coffman, Bernstein and Wee2017). Research in the past indicates that a comprehensive bundle of BEV policy instruments related to U.S. states, cities and utilities are most likely to promote the diffusion of BEVs in the urban (Bui et al. Reference Bui, Slowik and Lutsey2021; Slowik and Lutsey Reference Slowik and Lutsey2017). Those results resonate with the broader discussion about policy mixes, which are combinations of multiple policy instruments, to achieve policy objectives (Rogge and Reichardt Reference Rogge and Reichardt2016). While the positive impact of economic instruments in the shape of rebates received upon purchase of BEVs could be widely confirmed (Clinton and Steinberg Reference Clinton and Steinberg2019; Jenn et al. Reference Jenn, Springel and Gopal2018), the interplay of different BEV policy instruments across U.S. state, city und utility-related policy levels and its resulting effect on BEV uptake remains unclear (Hardman Reference Hardman2019; Wee et al. Reference Wee, Coffman and La Croix2018). Such a research perspective could offer important insights on the composition of BEV policy bundles and its impact on BEVs diffusion at the local level. For the European context, Held and Gerrits (Reference Held and Gerrits2019, Reference Held and Gerrits2025) show that a bundle of BEV policies featuring both push and pull policy instruments and that cover national and local, context-specific levels is more likely to promote the adoption of BEVs.
In this article, we will address the limitations mentioned by investigating combinations of policy instruments at U.S. state, city and utility-related policy levels that contribute successfully to the adoption of BEVs in selected U.S. cities. In contrast to existing research on BEV policies in the U.S. context, our research model focuses on the interplay of various economic and regulatory policy instruments that are implemented at different policy levels. This may contribute to a timely and context-sensitive evaluation of policy instruments that are promoting BEV transitions in U.S. cities. For doing so, we apply Qualitative Comparative Analysis (QCA), as it was done earlier in this journal (see: van Druenen Reference Van Druenen2022; Sager and Thomann Reference Sager and Thomann2017). As a case-based research method, QCA is utilized to identify configurations of BEV policy instruments that lead to urban BEV uptake.
Our research is guided by the following research question: Which configurations of different policy instruments at various policy levels promote the diffusion of BEVs in selected cities in the U.S.?
The article is structured as follows: We firstly will present a literature review by pointing out shortcomings of existing research. Secondly, our theoretical perspective and the selection of conditions is explained. Thirdly, methodological implications are outlined. Fourthly, a description of how the data was coded and analyzed is followed by the analysis. Finally, we conclude the article with both a summary and a discussion of the results.
Literature review
We conducted a thorough literature review to reveal the limited explanatory power of existing studies about synergies between U.S. state, city and utility-driven policies towards BEV diffusion in U.S. cities. Essentially, we found that only a few studies deploy case-related research approaches of U.S. cities including multiple policy levels and various policy instruments: Ajanovic and Haas (Reference Ajanovic and Haas2016) investigate BEV policy instruments in three major U.S. cities among others. Their findings clearly emphasize the interplay of monetary and non-monetary policy instruments across U.S. state and city policy levels for promoting the diffusion of BEVs.
Adepetu et al. (Reference Adepetu, Keshav and Arya2016) deploy an agent-based ecosystem model based on data covering U.S. state and city-based policies of California and San Francisco. The approach is focusing on BEV ownership costs but lacks a spatial variation and includes only a limited number of BEV policy instruments. By investigating 36 major U.S. cities, Clark-Sutton et al. (Reference Clark-Sutton, Siddiki, Carley, Wanner, Rupp and Graham2016) rank the cities according to presence of U.S. state, city and utility-related policy instruments. The authors emphasize city and utility-related incentives for BEV diffusion. Breetz and Salon (Reference Breetz and Salon2018) investigate the impact of policy instruments on total cost of ownership (TCO) of selected BEV models in different U.S. cities. Results underscore the heterogeneity in BEV policy instruments, ownership cost and its impact on BEV diffusion across major U.S. cities (see also: Woody et al. (Reference Woody, Adderly, Bohra and Keoleian2024)). Beyond that, there is a small number of studies covering monetary and non-monetary policy instruments at the U.S. state and city policy levels. Most of the studies found HOV lane access to have a positive impact on BEV diffusion at the state level (Lutsey et al. Reference Lutsey, Slowik and Jin2016; Sheldon and DeShazo Reference Sheldon and DeShazo2017; Jenn et al. Reference Jenn, Springel and Gopal2018; Narassimhan and Johnson Reference Narassimhan and Johnson2018; Jenn et al. Reference Jenn, Lee, Hardman and Tal2020). Beyond HOV lane access, some studies focused on the effect of free or discounted parking for BEV users (Lutsey et al. Reference Lutsey, Slowik and Jin2016; Wolbertus et al. Reference Wolbertus, Kroesen, van den Hoed and Chorus2018; Wee et al. Reference Wee, Coffman and La Croix2018). The effect on BEV diffusion of time of use (TOU) rates offered to BEV users by utilities was investigated by Wee et al. (Reference Wee, Coffman and La Croix2018) without confirming a positive impact on BEV diffusion. The authors included TOU rates as an aggregated variable to make it correspond with a U.S. state level analysis.
Consequently, our review of existing studies on BEV policies confirms that given research lacks results on the impact of comprehensive policy mixes on BEV transitions in U.S. cities. This is because of two main shortcomings: Firstly, most studies investigate the impact of policy instruments, which are implemented at the U.S. state or aggregated policy level. In this regard, studies primarily consider economic policy instruments, such as one-time subsidies received upon purchase, income tax credits or purchase tax exemptions (Austmann Reference Austmann2021; Clinton and Steinberg Reference Clinton and Steinberg2019; Hardman Reference Hardman, Chandan, Tal and Turrentine2017). As indicated by a later strand of literature, recurring monetary and non-monetary policy instruments, such as parking privileges, HOV lane access, road charge exemptions, charging infrastructure development or energy cost savings, that are implemented at the local level, are supposed to contribute to the uptake of BEVs likewise (Hardman Reference Hardman2019; Slowik and Lutsey Reference Slowik and Lutsey2017, Reference Slowik and Lutsey2019; Coffman et al. Reference Coffman, Bernstein and Wee2017). Those policy instruments address behavioral aspects of BEV usage in specific urban contexts (Aasness and Odeck Reference Aasness and Odeck2023). Existing research on BEV policy mixes in the European and Chinese context underscore this aspect (Held and Gerrits Reference Held and Gerrits2025; Zhao et al. Reference Zhao, Li, Jiao, Mao, Sun and Liu2024). Secondly, existing research falls short of covering variation in local conditions of BEV usage. As transport systems, socio-political characteristics, consumer preferences and travel behavior among other things vary widely across cities, the success of policy mixes depends on its conjunction with contextualized conditions (Hardman Reference Hardman2019). Spatial variation matters, as BEV policy instruments that worked in one local context, naturally won´t support BEV diffusion in a different one (Bui et al. Reference Bui, Slowik and Lutsey2021; Egnér and Trosvik Reference Egnér and Trosvik2018).
Our study is addressing the limitations mentioned by introducing several unprecedented aspects. Firstly, our research on policy mixes covers recurring monetary and non-monetary policy instruments that are related to the local policy level. For doing so, we integrate policy instruments by U.S. cities and city-related utilities, which address behavioral aspects of BEV transitions and aim to incentivize BEV usage in a particular urban context. Secondly, we created a novel data set, which covers U.S. state, city and utility-related policy levels. The data set covers BEV policy incentives at the U.S. state and city level, BEV registration numbers as well as place-specific ownership costs for a BEV and a gasoline-driven vehicle. Thirdly, different cities in the U.S. have implemented similar BEV policy mixes by achieving diverging results (Bui et al. Reference Bui, Slowik and Lutsey2021, Reference Bui, Slowik and Lutsey2020). Accordingly, findings underscore the multi-level nature and contextuality of our data sample. Evaluating the outcome of the policies implemented thus requires a research approach that is sensitive to within- and cross-case variation. Our study applies Qualitative Comparative Analysis (QCA) to compare combinations of BEV policies at different levels that may contribute to BEV adoption in U.S. cities. As a case-based research method, QCA is sensitive to interaction of policy instruments in conjunction with local contexts (Ragin Reference Ragin2000).
In the next section, our research approach and method will be introduced.
Method
Fuzzy-set qualitative comparative analysis
As a case-based research method, QCA treats cases as being composed by configurations of conditions that co-occur with an outcome (Gerrits and Verweij Reference Gerrits and Verweij2018; Ragin Reference Ragin2014; Rihoux and Ragin Reference Rihoux and Ragin2009). For our research aim, cities in the U.S. are considered as cases. Different BEV policy incentives implemented at different U.S. state, city and utility-related policy levels are conditions, which co-occur with an outcome. QCA captures similarities across cases through systematic comparison while being sensitive to idiosyncrasies of single cases (Ragin Reference Ragin2000).
As mentioned earlier, similar combinations of state, city and utility-related policies did not result in similar BEV adoption rates in different U.S. cities (Bui et al. Reference Bui, Slowik and Lutsey2021; Slowik and Lutsey Reference Slowik and Lutsey2019). Accordingly, QCA treats social reality in reference to three constitutive assumptions: Firstly, as cases are configurations of conditions, the phenomenon of interest is likely to be produced through a conjunction of the conditions considered. Here, QCA diverges from approaches that aim to identify the effect of single variables on the outcome (Mahoney Reference Mahoney2010). Secondly, the assumption of similar configurations of conditions leading to different results (multifinality), or different configurations of conditions produce similar results (equifinality) enables to reveal different causal pathways being linked to an outcome (Rihoux and Ragin Reference Rihoux and Ragin2009). Thirdly, causal pathways being identified to produce an outcome are causally asymmetric. Thus, a causal pathway for the outcome cannot simply be mirrored to make a statement about the non-outcome (Mello Reference Mello2021; Schneider and Wagemann Reference Schneider and Wagemann2012). The three aspects mentioned form the methodological underpinnings of QCA to investigate complex causality (Byrne et al. Reference Byrne, Ragin and Ragin2010). Our configurational understanding of policy incentives emphasizes that interacting policy conditions, combined with contextualized dynamics, lead to unidirectional outcomes (cf.: Mello Reference Mello2021; Gerrits and Verweij Reference Gerrits and Verweij2018, Reference Gerrits and Verweij2013; Gerrits Reference Gerrits2012; Byrne Reference Byrne2005). As past research reveals, governing sustainability transitions in urban transportation systems depends on emergent and co-evolving processes that are driven by various actors at multiple levels (i.e., federal and state-related departments for transport, city authorities, energy utility companies, car manufacturers, BEV users etc.) (Austmann Reference Austmann2021; Mattioli et al. Reference Mattioli, Roberts, Steinberger and Brown2020). Thus, we aim to improve understanding about complex causalities of policies implemented on multiple policy levels.
QCA has different variants. For our research, we deploy fuzzy-set QCA (fsQCA). The fuzzy-set variant enables to capture differences in the degree of set membership of the cases considered (Schneider and Wagemann Reference Schneider and Wagemann2012). Originally, QCA worked with crisp-sets that allowed only for strict dichotomization, where 1 indicated full presence and 0 full absence of a condition. Held and Gerrits (Reference Held and Gerrits2019) applied the crisp-set variant of QCA to the evaluation of BEV policy mixes across national and local policy levels in the European context. In contrast, fsQCA enables researchers to capture graded set membership as any possible score between 0 and 1. Consequently, cases are allowed to have partial set membership. The possibility to establish difference-in-degree between cases adds precision to the transfer of empirical information to set membership. FsQCA thus combines qualitative and quantitative dimensions (Mello Reference Mello2021; Gerrits and Verweij Reference Gerrits and Verweij2018; Schneider and Wagemann Reference Schneider and Wagemann2012).Footnote 1 Using empirical information to assign set membership scores to the cases considered is called calibration (Schneider and Wagemann Reference Schneider and Wagemann2012). The calibration procedure is an essential aspect of any QCA and will be described in detail in section “Calibration of data into fuzzy-sets”.
Research model
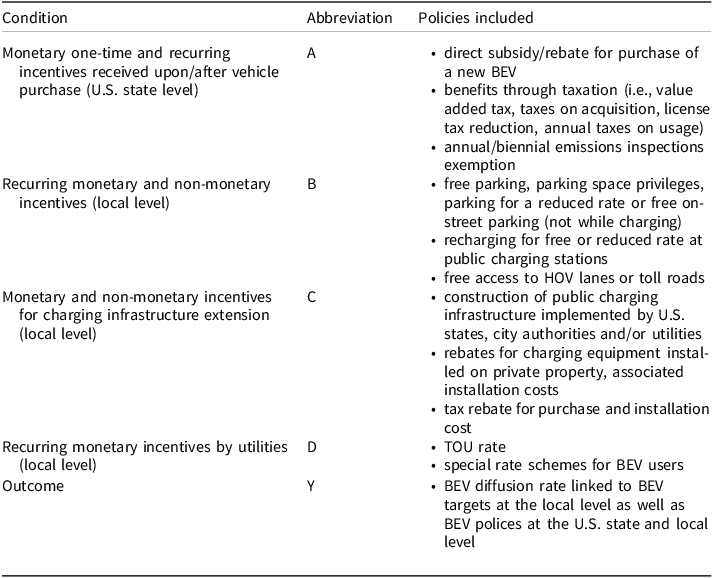
The selection and definition of conditions is a central task when utilizing fsQCA (Mello Reference Mello2021; Gerrits and Verweij Reference Gerrits and Verweij2018). By doing so, we conceptually follow Held and Gerrits (Reference Held and Gerrits2019). Accordingly, our research model consists of the outcome condition that is covering the BEV diffusion rate linked to BEV targets at the local level (abbr.: Y) and the main conditions, which are: monetary one-time and recurring incentives received upon/after vehicle purchase (abbr.: A), recurring monetary and non-monetary incentives at the local level (abbr.: B), local monetary and non-monetary incentives for charging infrastructure extension (abbr.: C) and recurring monetary incentives by local utilities (abbr.: D).
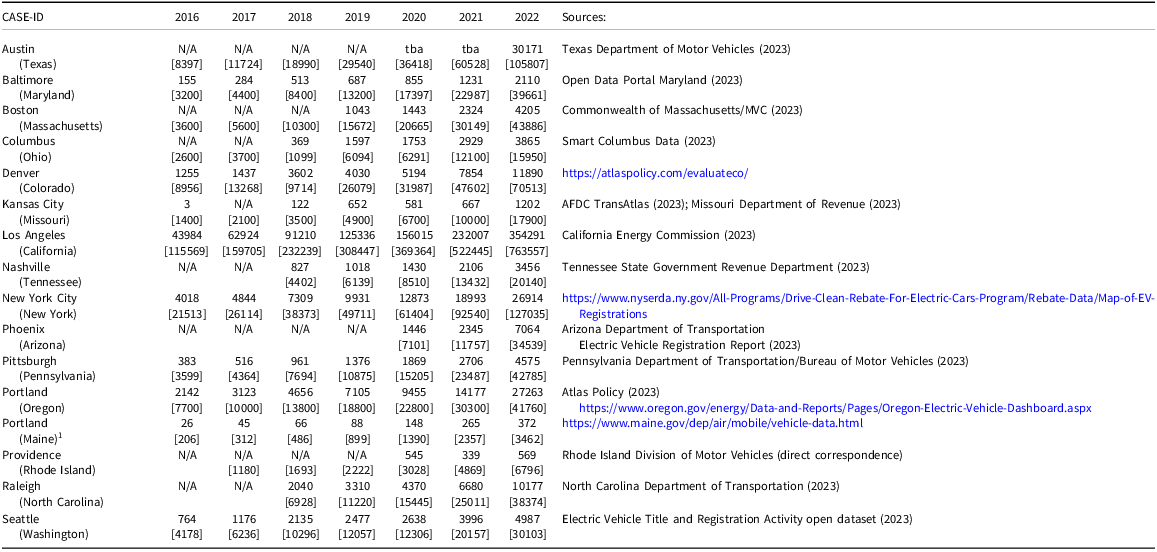
Outcome condition Y covers past or future policy targets in each case. Among the U.S. cities selected, it allows for an assessment whether BEV policy targets could be met or are likely to be met in the near future. We calculated BEV diffusion rates linked to BEV targets for each case of our sample. For doing so, historical data on BEV registration numbers at the local level between 2016 and 2022 are used and put in relation to the associated policy targets to make a statement about the progress of BEV diffusion in each case so far.Footnote 2 We decided to use registration figures instead of sales data, as eligibility for BEV incentives is based on the location of vehicle registration (Wee et al. Reference Wee, Coffman and La Croix2018).
Following our literature review (see: section “Literature review”), we include monetary as well as non-monetary policy instruments across U.S. state, city and utility policy levels (Bui et al. Reference Bui, Slowik and Lutsey2021; Wee et al. Reference Wee, Coffman and La Croix2018). Based on recent research results, we selected those incentives that are expected to be most relevant for BEV diffusion. As a result, our research modelFootnote 3 is composed of a total of four conditions:
Firstly, we include all monetary incentives that are present at the level of U.S. states and target high up-front costs of BEVs. As mentioned earlier, the positive effect of monetary incentives on BEV diffusion has been previously established (Clinton and Steinberg Reference Clinton and Steinberg2019; Jenn et al. Reference Jenn, Springel and Gopal2018). However, studies estimating the effect of monetary incentives are utilizing aggregated data and thus neglect effects on the cost effectiveness of BEV at the city level. Local factors including taxes, fees, electricity and gasoline costs as well as costs for insurance affect ownership costs of BEV and its conventional counterpart (Woody et al. Reference Woody, Adderly, Bohra and Keoleian2024; Hardman Reference Hardman2019). Following Woody et al. (Reference Woody, Adderly, Bohra and Keoleian2024), we offer an alternative approach for assessing the effect of monetary incentives by comparing the total cost of ownership (TCO) for BEV and its conventional counterparts across U.S. cities (see also: Held and Gerrits (Reference Held and Gerrits2019)). By calculating TCO for a representative BEV and internal combustion engine vehicle (ICEV) pair for each U.S. city investigated, the effect of all monetary incentives on TCO for a BEV relative to the TCO of a conventional car can be estimated. Thus, a comparison of TCO of a representative BEV-ICEV pair for assessing the effect of U.S. state-related monetary incentives constitutes condition A.
Secondly, recurring monetary and non-monetary incentives at the local level are supposed to influence behavioral patterns as well as transport conditions and thus may affect the adoption of BEVs (Hardman Reference Hardman2019). Such incentives aim to target the flexibility and convenience of BEV usage and thus provide recurring benefits. Consequently, condition B covers free parking (not while charging), parking space privileges, recharging for free or a reduced rate at public charging stations, free access to HOV lanes or toll roads.
Thirdly, the provision of a well-developed and user-oriented charging infrastructure is essential for supporting BEV adoption in U.S. cities (Slowik and Lutsey Reference Slowik and Lutsey2019; Hardman Reference Hardman2019). Next to the provision of publicly accessible charging infrastructure by U.S. states, city authorities and utilities, there are monetary incentives for the installation of charging points on private property. Mostly, such monetary incentives are implemented by U.S. states and utilities at the local level and vary in scope and availability (Bui et al. Reference Bui, Slowik and Lutsey2021, Reference Bui, Slowik and Lutsey2020; Jenn et al. Reference Jenn, Springel and Gopal2018). A complementary non-monetary incentive is the introduction of streamlined electric vehicle service equipment (EVSE) permitting processes. A streamlined process generally enables BEV users a faster procedure for receiving approvals for home charger installations (LaMonaca and Ryan Reference LaMonaca and Ryan2022). Depending on the city authority in charge, a streamlined permitting procedure may take a few days or just one day (Slowik and Lutsey Reference Slowik and Lutsey2019, Reference Slowik and Lutsey2017). As a result, condition C covers monetary as well as non-monetary incentives for the provision and installation of private charging facilities on private property.
Fourthly, utilitiesFootnote 4 implemented monetary incentives in the shape of time-of-use (TOU) rates and special rates for BEV users. TOU rates offer electricity to varying prices over predetermined periods of the day. By applying a TOU rate scheme, electricity costs are higher during the day when electricity demand is peaking and lower during the off-peak hours, from midnight to 5 a.m. for instance, when demand is lower. TOU rate schemes can also vary by weekends or seasons (Hall and Lutsey Reference Hall and Lutsey2017). Special rates for electricity provision are exclusively designed for BEV users (Bui et al. Reference Bui, Slowik and Lutsey2021). TOU rate schemes and special rates offered by utilities are supposed to create incentives to adopt a BEV because of the lower electricity costs during off-peak hours. Studies in the past aimed for investigating the effect of TOU rate schemes and special rates on BEV diffusion by creating ambiguous results (Wee et al. Reference Wee, Coffman and La Croix2018; Clark-Sutton et al. Reference Clark-Sutton, Siddiki, Carley, Wanner, Rupp and Graham2016). Consequently, TOU rate and special rate schemes as utility-related monetary incentives are relevant for further research and thus mark a valid choice for being part of our research model. Condition D thus covers TOU rate and special rate schemes for BEV users provided by utilities.
Table 1 provides an overview of the conditions included in our model.
Overview of the conditions included in the model
Please note that within the time span of data collection, public charging infrastructure was promoted by U.S. states, city authorities and utilities for the U.S. cities covered. Data covering condition B, recurring monetary and non-monetary incentives at the local level, were collected for the identical timeframe. As a result, our research approach meets requirements of time congruency. We only considered policies that had been implemented not later than the beginning of 2017 and had remained active for at least three consecutive years. Consequently, contradictory causal relations (presence of B without condition C) can be ruled out.
Our research model deploys a fsQCA (Ragin Reference Ragin2000). Methodologically, fsQCA allows for a fine-grained differentiation of set relations that together form configurations of the conditions covered by our research model. Methodological details of our approach will be outlined in the next section.
Data collection and calibration of data
Case sample and empirical data
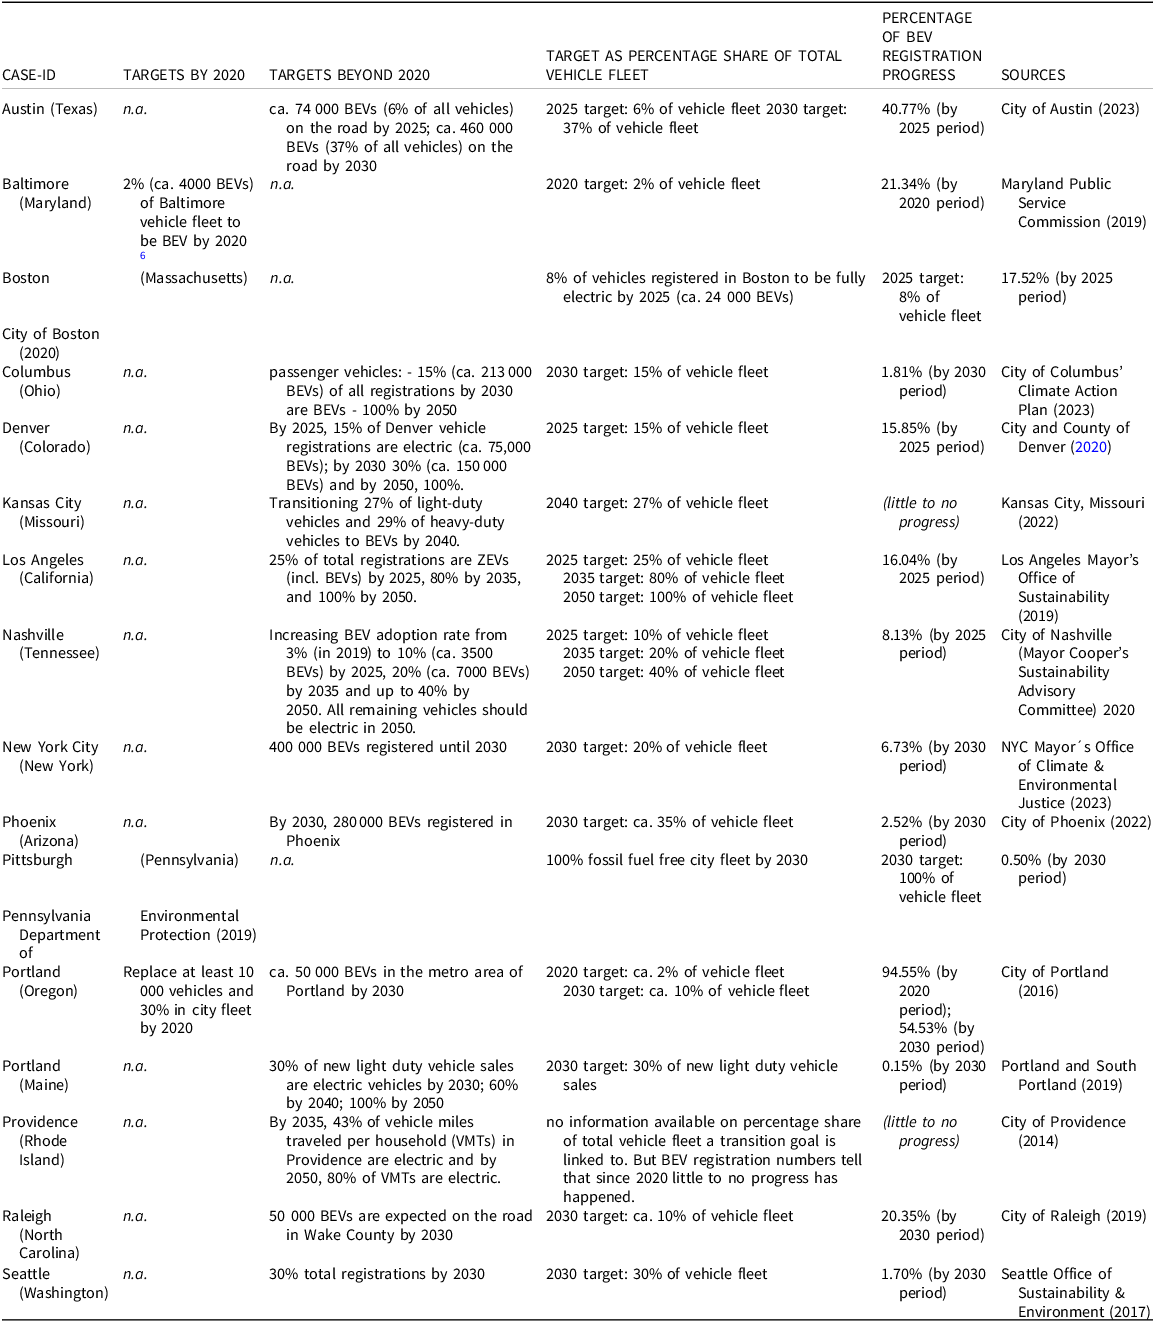
The composition of our case sample was guided by good-practice standards of QCA (Ragin Reference Ragin2014; Schneider and Wagemann Reference Schneider and Wagemann2012). For selecting the cases, we are focusing on cities in different states in the U.S. As a result, a minimum degree of homogeneity is guaranteed. We follow Ebbinghaus (Reference Ebbinghaus2005) by utilizing a deliberate case selection due to political contingency. As the implementation of policies to promote BEV depends on political willingness, practical feasibility and economic factors, the number and scope of BEV policies across U.S. states and thus cities are varied. A fact that can also be observed in diverging BEV diffusion rate across U.S. states and cities (Bui et al. Reference Bui, Slowik and Lutsey2020; Jenn et al. Reference Jenn, Springel and Gopal2018; Lutsey et al. Reference Lutsey, Slowik and Jin2016). Potential cases that feature no or very little policy actions towards BEV diffusion were left out, as the effect of policy configurations to be observed is expected to be low or non-existing. Consequently, the case selection strategy was guided by the most similar/different outcome (MSDO) selection strategy (Berg-Schlosser and Meur Reference Berg-Schlosser, Meur, Rihoux and Ragin2009). This strategy is based on the method of difference. As similar cases are compared, differences in the outcome condition can be explained by investigating differences among the conditions. As such, the strategy is a purposeful selection of cases (Mello Reference Mello2021). By applying the MSDO technique, our case selection strategy allows for a formalized procedure to select cases in accordance with QCA´s performance. We applied the method of difference by investigating policy targets to allow for case comparability. Policy targets are pivotal for making a qualitative statement about the progress of the BEV diffusion rate. Likewise, BEV policy targets are case-specific, as some targets are more ambitious than others (Bui et al. Reference Bui, Slowik and Lutsey2021). Thus, the aim of our approach was to select cases that have defined similarly ambitious BEV policy targets. The scope of comparability could essentially be defined by grouping cases with targets for BEV diffusion that do not differ extremely. For doing so, we calculated the relative percentage share of the total vehicle fleet of passenger cars a BEV policy target is linked to. Calculations were done for BEV policy targets adhered to different time periods (e.g., 2020, 2025) individually. Closest periods defined that describe the time limit a BEV target is attached to were selected. For an overview of the percentage shares, please see Table 2. We formed four groups for BEV policy targets linked to a 2020, 2025, 2030 and 2040 period. In a next step, minimum and maximum values as well as the mean value for each of the BEV policy target group were calculated. Juxtaposing BEV policy targets of potential cases in that way allowed us to make a statement about how meaningful the case sample composition is. Ultimately, most BEV policy targets are linked to a 2030 period. Potential cases have BEV policy targets defined with a mean value of 31.9% share of the total vehicle fleet with a minimum value of 10% and a maximum value of 100%. The 2025 period is the second most prominent period. The group has a mean value of 12.8% share of the total vehicle fleet with a minimum value of 6% and a maximum value of 25%. The 2020 period is covered by two cases. Both have a relative share of 2% of the total vehicle fleet. The 2040 period is linked to only one case and entails a 27% share of the total vehicle fleet. In the end, our approach allowed us to utilize the MSDO selection strategy by selecting cases that are comparable. As cities in the U.S. have heterogenous BEV policy targets defined, cases with different targets can be grouped that do not diverge extremely. In that sense, our approach complies with the heterogeneity and spatial variation of the data considered. QCA as a case-based research approach is sensitive to the heterogeneity of cases as well as cross-case variation (Pagliarin and Gerrits Reference Pagliarin and Gerrits2020; Schneider and Wagemann Reference Schneider and Wagemann2012; Harvey Reference Harvey, Ragin and Byrne2010). Another important factor for the selection procedure was data availability. As outlined by earlier studies, data covering the local level were not available or reliable in many cases (Jenn et al. Reference Jenn, Springel and Gopal2018; Wee et al. Reference Wee, Coffman and La Croix2018). Finally, the case sample is composed of a total of 16 U.S. cities.
Overview of case sample, BEV policy targets and targets as percentage share of total vehicle fleetFootnote 5

Data was gathered by referring to multiple sources (Held et al. Reference Held, Gerrits, Gianoli, Gebremeskel and Guttman2026). Initial information about BEV policies implemented by U.S. states, city authorities and utilities were provided by publications of The International Council on Clean Transportation (ICCT) covering the uptake of BEV in U.S. cities (Bui et al. Reference Bui, Slowik and Lutsey2021, Reference Bui, Slowik and Lutsey2020; Slowik and Lutsey Reference Slowik and Lutsey2019; Lutsey et al. Reference Lutsey, Slowik and Jin2016; Slowik and Lutsey Reference Slowik and Lutsey2017). Further data could be accessed by using the alternative fuels data center (AFDC) provided by the U.S. Department of Energy’s Vehicle Technologies Office (2024). The AFDC is a comprehensive data base for federal and U.S. state laws and incentives for BEV. It also provides an overview of present and historic incentives implemented by U.S. states, utilities and city authorities. In many cases, addition information were requested by contacting city authorities and utilities directly. Data concerning BEV registrations at the U.S. state and local level for the time span considered could be gathered by contacting departments of transportation, respectively departments of motor vehicles, as well as departments of revenues multiple times. For doing so, the “Freedom of information Act” was used in most cases (for instance, see: Maryland Office of the Attorney General 2024). Information about past and future BEV targets at the U.S. state and local level could be lifted from official policy papers and electric mobility action plans. In some cases, correspondence with city-related agencies for transportation was necessary to obtain information about the scope and time span of BEV targets. Data concerning monetary one-time and recurring incentives received upon and after BEV purchase were mainly lifted from the AFDC and U.S. state-related departments and agencies. Specific data for calculating TCO for the BEV-ICEV pair, such as local gasoline and electricity prices could be obtained from the U.S. Energy Information Administration (EIA) (2024) and the U.S. Bureau of Labor Statistics (2024). Data for recurring monetary and non-monetary incentives at the local level were gathered by referring to the AFDC, publications by the ICCT and primary sources in the shape of official policy papers and action plans provided by city authorities. Also, city-related departments and agencies as well as utilities were contacted directly to obtain information.Footnote 7 Table 2 provides an overview of the cases selected including BEV targets at the local level.
Calibration of data into fuzzy-sets
Calibration is the conversion of quantitative and qualitative data from a case into fuzzy-sets of conditions. For doing so, set-membership scores are used. Two rounds of calibration were necessary for the data collected. That was because the first calibration round led to no membership scores across the five conditions for a considerable number of cases.
For all the conditions covered by our research model, fuzzy-set scales were defined. Outcome condition Y covers BEV diffusion rates linked to BEV targets in the 16 U.S. cities covered. For assigning membership scores, local BEV targets and the historical development of BEV registration numbers at the local level were used to calculate the progress in each case for either the past period of 2020 or the year 2022 indicating an interim assessment of the 2025, 2030 and 2040 policy target periods. For doing so, the 2022 BEV registration data was divided by the nearest BEV target at the local level (e.g., 2025, 2030 or 2040). In two cases, 2020 BEV registration data could be used and were divided by 2020 targets. Consequently, we used a 4-scale fuzzy-set to make a statement about the progress in BEV diffusion. For cases with BEV targets by a 2020 period, a membership score of 1 is assigned when more than 90%, 0.67 when more than 75%, 0.33 when more than 50%, and 0 when more than 20% of the original target could be reached. For cases with BEV targets by a 2025, 2030 or 2040 period, a different scheme for assigning membership scores was applied. The outcome condition for cases with BEV targets by 2025 are calibrated as follows: a membership score of 1.0 is assigned when more than 50%, 0.67 when more than 15%, 0.33 when more than 10%, and 0.0 when less than 10% of the original target could be reached so far. For cases with BEV targets by a 2030 period and beyond, the calibration scheme is as follows: cases are assigned 1.0 when more than 15%, 0.67 when more than 5%, 0.33 when more than 2.5%, and 0.0 when less than 2.5% of the original target could be reached so far. Please see Table 2 for an overview of the BEV diffusion progress for each case.
The calibration of condition A depends on the calculation and comparison of the TCO of the comparable BEV-ICEV pair. As outlined earlier, we consider monetary one-time and recurring incentives received upon and after purchase of a BEV. Also, local parameters, such as taxes, fees, electricity and gasoline costs as well as costs for insurance and depreciation, are regarded. Only monetary one-time and recurring incentives were considered that were introduced not later than the beginning of 2017 and had remained active for at least three consecutive years. We paired the BEV Tesla Model 3 with the gasoline-driven Toyota Camry LE. The Toyota Camry LE is the version with the lowest CO2 emissions and basic feature options. The Tesla Model 3 with the most basic features regarding performance and price was selected. Data on car prices and technical specifications necessary for TCO calculations refer to the 2017 models. TCO summarize all present and future costs and revenues of an investment. As mentioned earlier, it thus allows to make a more realistic statement of the economic value of an investment generated in contrast to the simplistic consideration of the purchase price (Woody et al. Reference Woody, Adderly, Bohra and Keoleian2024; Breetz and Salon Reference Breetz and Salon2018). The TCO of each vehicle for the three EV-ICEV pairs selected were calculated using the following formula:
 $$TCO = Pc + \;Tr\; - TCR\; + \mathop \sum \nolimits_{i = 0}^i {{\left( {Fc + Tc + I + MR} \right)}}{{{{\left( {1 + d} \right)}^i}}}\; - \;{{\left( {RV} \right)}}{{{{\left( {1 + d} \right)}^i}}}$$
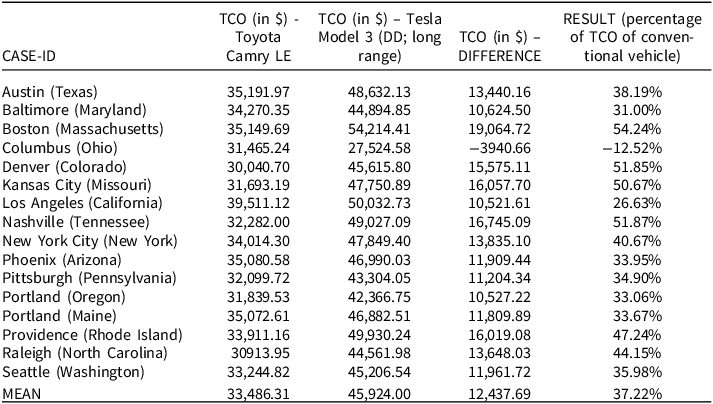
where Pc is a car´s purchase price, Tr is the sum of other taxes on acquisition, TCR are subsidies received upon purchase, Fc is the present value of gasoline or electricity costs, Tc is the present value of annual circulation taxes, I is annual insurance costs, MR is annual maintenance and repair costs, R is the resale value of the vehicle, d is the discount rate and i is the ownership period. Average yearly gasoline and electricity retail prices (including taxes) could be used for cases Baltimore (Maryland), Boston (Massachusetts), Los Angeles (California), New York City (New York), Phoenix (Arizona) and Seattle (Washington). For all other cases, average yearly retail prices at the U.S. state level were utilized. Data about annual insurance, maintenance and repair costs as well as resale values of the vehicle pair considered could be accessed by the “cost to own” calculation tool. It is provided by the automotive information service platform Edmunds (2023). The tool entails a U.S. wide data basis and is sensitive to place-specific data, which can be deployed by using zip-codes of U.S. cities. Ownership is estimated to be five years with 15 000 miles driven per year. For the discount rate d, historical data between 2017 and 2021 was lifted from economic data provided by the Federal Reserve Bank of St. Louis (2024). For each year, the annual average discount rate was used.Footnote 8 For assessing the effect of monetary one-time and recurring incentives received upon and after vehicle purchase on TCO of the BEV-ICEV pair in a representative way, the TCO difference was calculated as the percentage share of the TCO for the conventional car model for each case considered. The results are interpreted to demonstrate the effect of monetary one-time and recurring incentives on the TCO for the BEV. According to our calculations, TCO for the BEV are on average 40.95% higher than the TCO for its ICEV counterpart among the cases considered.Footnote 9
Consecutively, we performed a cluster analysisFootnote 10 using the Tosmana software for grouping cases with similar results (Cronqvist Reference Cronqvist2019). The cluster analysis resulted in three thresholds: 15.74%, 44.00% and 72.26% with a median of 38.19%. As a result, cases with a weaker effect of monetary one-time and recurring incentives on the TCO of BEVs are assigned to the groups defined by the thresholds with the highest values. The following calibration was utilized: cases with a result higher than 72.25% are assigned a set membership score of 0.0; cases with a result higher than 43.99% are assigned a set membership score of 0.33; cases with a result higher than 15.73% are assigned a set membership score of 0.67; cases with a result lower than 15.74% are assigned 1.0
Thirdly, calibration of condition B depends on the number of recurring (non-)monetary incentives being implemented at the local level. The calibration scheme is as follows: cases with not a single recurring incentive are assigned a set membership score of 0.0; cases with one recurring incentive are assigned a set membership score of 0.33; cases with two recurring incentives are assigned a set membership score of 0.67; cases with three or more recurring incentives are assigned a set membership score of 1.00.
Fourthly, condition C was calibrated in accordance with local action done to promote private charging facilities on private property in a BEV user-centric way: cases with not a single incentive implemented are assigned a set membership score of 0.0; cases that only offer streamlined EVSE permitting processes receive a set membership score of 0.33; cases with only financial incentives by U.S. state or/and local utility implemented are assigned a set membership score of 0.67; cases that offer both streamlined EVSE permitting and financial incentives by U.S. state or/and local utility receive a set membership score of 1.0.
Fifthly, calibration of condition D depends on the TOU rate and special rate schemes for BEV users provided by utilities. The calibration scheme is as follows: cases with no TOU or special rate available are assigned a set membership score of 0.0; cases with a regular TOU rate scheme receive a set membership score of 0.33; cases with a flat TOU rate scheme for BEV users are assigned a set membership score of 0.67; cases with flexible TOU rate schemes that give BEV users more flexibility in selecting a proper scheme receive a set membership score of 1.0.
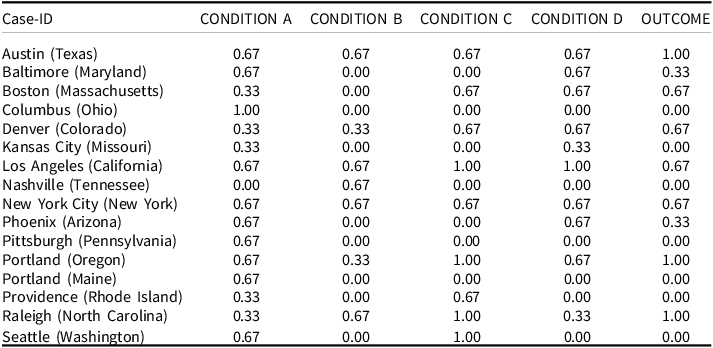
Table 3 provides an overview of the calibrated cases and the raw data matrix.
Raw data matrix
Analysis and interpretation of results
Data analysis
In the following section, the analytical procedure of the fsQCA conducted will be elaborated. For doing so, individual conditions and combinations of conditions will be tested for their necessity and/or sufficiency in contributing to progress in BEV diffusion in U.S. cities and thus a positive outcome.Footnote 11 For performing a fsQCA, we followed standards of good practice (Gerrits and Verweij Reference Gerrits and Verweij2018; Schneider and Wagemann Reference Schneider and Wagemann2010; Ragin Reference Ragin2000). Parameters for assessing the quality of our fsQCA were calculated by using the QCA package for R by Dusa (Reference Dusa2019).
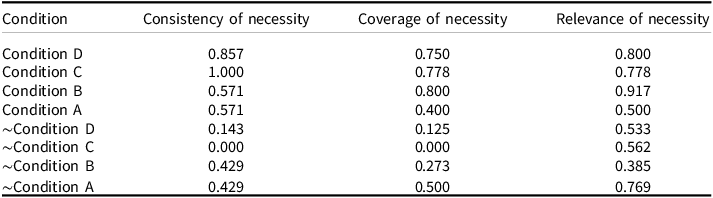
The first step is the analysis of necessity of single conditions. By doing so, those conditions are identified that are necessary for the outcome to occur. Putting it differently, a condition is necessary if, whenever present, the outcome condition is also present (Ragin Reference Ragin2014). For our research model, we analyzed if conditions A, B, C and D are necessary for a successful progress in urban BEV diffusion to happen. There are three parameters that must be considered when testing for necessity: consistency, coverage and Relevance of Necessity (RoN) (Mello Reference Mello2021).Footnote 12 Consistency is the primary parameter. The formal benchmark for set-theoretic consistency holds that conditions have to pass at least a 0.9 level to be considered a necessary condition. In addition to this, parameters coverage and RoN should pass at least a 0.5 level for not invalidating a high consistency level (Schneider and Wagemann Reference Schneider and Wagemann2012). As depicted in Table 4, results of the necessity test reveal high consistency levels for conditions C (1.0) and D (0.857). The latter has a consistency score lower than 0.9 and thus is formally not a necessary condition. For condition C, both coverage and RoN are 0.778. The valid consistency score thus is backed. Consequently, conditions C is necessary for a positive outcome to be present. It means that for progress in urban BEV diffusion to happen, a quick permitting procedure for home charger installations and monetary incentives for the installation of charging points on private property by city authorities or utilities are necessary.
Analysis of necessity
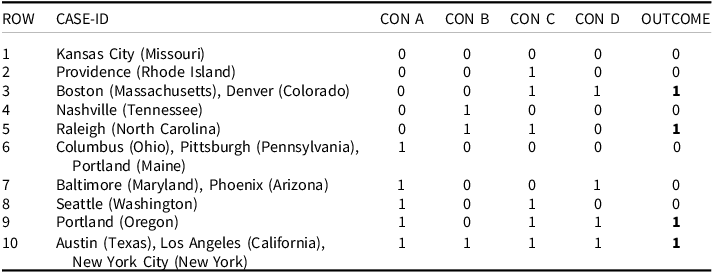
In a second step, the analysis of sufficiency is performed. For doing so, a so-called truth table is constructed. It lists all logically possible combinations or configurations of conditions, which produce the outcome (24). The truth table shows configurations of conditions that are sufficient for the outcome to occur (Schneider and Wagemann Reference Schneider and Wagemann2012). Similar to the test for necessity, sufficient configurations of conditions must meet standards of consistency and coverage. The parameters are calculated for each truth table row and measure the strength of each configuration of conditions and the outcome. Following Mello (Reference Mello2021), the formal threshold for consistency of a configuration of conditions is at least 0.75. Regarding coverage, a minimum score of 0.5 serves as a rule of thumb (ibid.: p. 127 ff.). Table 5 provides an overview of the resulting truth table. Each row highlights a qualitatively different configuration of the four BEV policy conditions covered. There are four configurations that are sufficient for the outcome to occur. Configurations with row numbers 3, 5, 9 and 10 are covered by a total of eight cases, which are attributing to successful progress in urban BEV diffusion. There are six logical remainders. In QCA, logical remainders indicate logically possible configurations of conditions that lack empirical cases and can be detected by investigating rows without cases in them (Schneider and Wagemann Reference Schneider and Wagemann2012). A lack of empirical information is called “limited diversity”. According to good practice procedures in QCA, the problem of limited diversity is moderate in the case of our analysis (Schneider and Wagemann Reference Schneider and Wagemann2010).
Truth table
In a consecutive step, the truth table was processed according to the procedure of logical or Boolean minimization. It covers the formal analysis of the policy configurations in the truth table by applying the Quine–McCluskey algorithm (Mello Reference Mello2021). For doing so, configurations of conditions are linked by three Boolean operators: Boolean AND (·), Boolean OR (+) and Boolean NOT (∼).Footnote 13 The logical minimization process aims to detect simplest possible logical expression that is related to an occurring outcome. It results in the so-called conservative solutionFootnote 14 for the various sufficiency statements entailed in a truth table. It represents the solution formula of our fsQCA and needs to be interpreted (Schneider and Wagemann Reference Schneider and Wagemann2012). As a result, there are three so-called prime implicants that co-occur with the presence of the outcome Y (Boolean operators used):
 $$ \sim ABC \sim D + \sim BCD + ACD \to Y$$
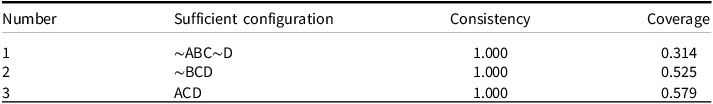
The analysis reveals three alternative sufficient configurations of BEV policy conditions that lead to successful progress in BEV diffusion in cities in the U.S. Table 6 reveals the parameters of fit for the three sufficient configurations. All three configurations have a consistency score of 1.0 confirming a high fit between the empirical evidence and the assumed set-theoretic relationship (Mello Reference Mello2021).Footnote 15 When we perceive the coverage parameter though, it becomes obvious that configuration ∼ABC∼D has a coverage score of only 0.314. It is covered by just one case, namely Raleigh (North Carolina). It makes that one case to be an odd one among the cases related to a positive outcome. Consequently, we decided not to consider configuration ∼ABC∼D for an interpretation and instead focus on configurations ∼BCD and ACD. Both configurations have coverage scores above 0.5 as indicated by 0.525 for ∼BCD and 0.579 for ACD.Footnote 16 As a result, there are three alternative sufficient configurations of BEV policy conditions that co-occur with the outcome.
Consistency and coverage for the sufficient conditions identified

Our findings confirm the assumption of equifinality as outlined in section “Method”. There are different configurations of BEV policies that in conjunction with contextualized dynamics are propelling progress in BEV diffusion in U.S. cities. There is no condition that can produce the outcome on its own i.e., no condition is necessary and sufficient for the outcome to be present. When we perceive configuration ∼BCD for instance, it becomes obvious that condition ∼B is insufficient on its own, but is needed to form a sufficient conjunction with C and D. It thus is insufficient, but a necessary part of a conjunctural condition which is itself unnecessary but sufficient for the outcome (Y). Condition ∼B is a so-called INUS condition (Mackie Reference Mackie1980).Footnote 17 The same holds true for the conditions of configuration ACD.
Interpretation of results
In a final step, the conservative solution consisting of two configurations must be interpreted by referring to the cases covered in our analysis. Starting with configuration ∼BCD, which is covered by a total of three cases. The absence of recurring monetary and non-monetary incentives at the local level may seem counterintuitive and at odds with existing research. Jenn et al. (Reference Jenn, Springel and Gopal2018)Footnote 18 for instance confirm a positive impact of HOV lane access on BEV adoption. Though, a closer look reveals that in cases Portland (Oregon) and Denver (Colorado), BEV users at least can recharge their BEV at city owned and public charging stations free of charge (Chargehub 2023). In Denver (Colorado), the charging for free incentive is part of a broader strategy to bolster charging infrastructure availability. Equity considerations are a main pillar of the strategic approach and aim to diminish burdens of charging costs that lower-income BEV owners face, as relying on public charging stations mainly (City and County of Denver 2020). There are no recurring monetary and non-monetary incentives in the case of Boston (Massachusetts). Please note that the presence of condition B being absent results mainly from the calibration scheme applied to condition B (see: section “Calibration of data into fuzzy-sets”).
Condition C, a quick permitting procedure for home charger installations and monetary incentives for the installation of charging points on private property, is necessary for successful progress in urban BEV adoption but only in conjunction with conditions ∼B and D, respectively A and D. Cases Boston (Massachusetts), Denver (Colorado) and Portland (Oregon) reveal how partnership across policy levels and city-related actors support the extension of charging infrastructure in a user-centric fashion. In the “Zero-Emission Vehicle Roadmap 2020”, the city authority of Boston outlines actions to support an affordable and convenient access of charging infrastructure in the capital of Massachusetts. One central aspect of the strategy outlined is to create actions that support utilities to invest in charging infrastructure (City of Boston 2019). Since 2017, this task is fulfilled by local utility National Grid. The “Massachusetts Residential EV Charging Infrastructure Program” by National Grid provides BEV users with up to $700 when installing charging equipment in their garage or parking area at a single-family home (additional rebate for 2 to 4 units) (National Grid 2023). The charging equipment rebate results from a broader regulatory process between the state of Massachusetts and three utilities, including National Grid. Since 2017, the utilities have received funding from the state of Massachusetts to deploy “make-ready” charging infrastructure and offer monetary rebates for Level 2 and direct current fast charging (DCFC) BEV chargers to certain customers. In its current form, the comprehensive “Make-Ready Program” enables BEV charger rebates for public and workplace, residential as well as fleet customers (Commonwealth of Massachusetts 2023). Case Denver (Colorado) has monetary incentives by the state of Colorado implemented to expand BEV charging infrastructure stations. In 2013, the Colorado Energy Office (CEO) incepted the “Charge Ahead Colorado” program (Colorado Energy Office 2023). Ultimately, the program is a central pillar of Colorado´s “Electric Vehicle Plan” and coordinates monetary support as well as joint action across local actors to extend Level II and fast-charging stations in Colorado (State of Colorado 2018). “Charge Ahead Colorado” has been offering grants for Level 2 charging stations ($6250 max.) to individuals. Among the three cases covered, Portland (Oregon) provides both monetary and non-monetary incentives for charging infrastructure extension to private BEV users. In 2009, Portland´s BEV strategy “The Portland Way” received and update that set streamlined electrical permitting process for charging station installations as a priority. It has aiming for a faster and more cost-effective deployment of home charging stations. A website designated to streamlined permitting processes was launched in 2010 (City of Portland 2009, 2017). Monetary incentives for purchase and installation costs for home charger stations have been granted by both state and utility actions. Oregon´s “Residential Energy Tax Credit Program” supported eligible BEV users with a tax credit of 50% of the project costs (up to $750) (Oregon Department of Energy 2023). When the program expired in 2018, the Oregon Department of Environmental Quality’s “Clean Fuels Program” provided funds to the local utility Portland General Electric (PGE). In 2019, PGE implemented the “Drive Change Fund”, which has been awarding grants for the purchase and installation of home charging equipment (Portland General Electric 2023a). Generally, cases Boston (Massachusetts), Denver (Colorado) and Portland (Oregon) represent a strict partnership between U.S. state entities and local utilities to meet contextualized demands of BEV users in U.S. cities when extending charging infrastructure stations.
Condition D adds further emphasize on the role of utility-related incentives by covering flat TOU and special rate schemes for BEV users. The scope of the scheme offered and the amount of savings possible vary across the three cases covered by configuration ∼BCD. Residential users of BEV in Boston (Massachusetts) received a $50 rebate and $20 annual bill credit when pausing BEV charging during peak demand events from local utility National Grid (“Demand Response Charging Incentive”) (Alternative Fuels Data Center 2023f). Xcel Energy, a local utility in Denver (Colorado), has been offering a flat TOU rate for residential customers and BEV users (Alternative Fuels Data Center 2023e). Similarly, BEV users and customers of PGE in Portland (Oregon) are offered a flat TOU rate scheme, which is aligning with summer and winter season (Portland General Electric 2023b).
Configuration ACD is covered by a total of four cases: Portland (Oregon), Austin (Texas), Los Angeles (California), New York City (New York). The configuration puts emphasis on monetary one-time and recurring incentives received upon and after the purchase of BEV. For the four cases mentioned, TCO difference for a representative BEV-ICEV pair are the lowest among all the 16 cases investigated indicating comparatively low TCO for the BEV selected.Footnote 19 Monetary incentives received upon purchase of BEV are present in all the four cases. Individuals that purchase a BEV in Austin (Texas) and in Portland (Oregon) receive a rebate of $2500 (Alternative Fuels Data Center 2023b; Department of Environmental Quality Oregon 2023). In Los Angeles (California) and New York City (New York) BEV users are granted additional monetary incentives. Starting in 2009, the “Clean Vehicle Rebate Project” was introduced by the California Air Resources Board (California Environmental Protection Agency 2013). Since then, it has granted California residents monetary incentives when purchasing or long-term leasing zero emission vehicles, including BEV (Governor’s Interagency Working Group on Zero-emission Vehicles 2016). In 2017, the amount was $2000 for the purchase of a BEV. Additionally, BEV users were freed from the one-time upfront registration fee (Alternative Fuels Data Center 2023a). Individuals in New York City (New York) have been benefitting from the 2016 “Drive Clean Rebate Program”, which is granting $2000 when purchasing or leasing a new BEV (New York State Energy Research and Development Authority 2023b). BEV users additionally receive a recurring monetary incentive, as BEV are exempt from state motor vehicle emissions inspections (Alternative Fuels Data Center 2023d).
The relevancy of conditions C and D was already elucidated by the cases linked to configuration ∼BCD. Nevertheless, cases Austin (Texas), Los Angeles (California) and New York City (New York) will be examined closer. Starting with necessary condition C, BEV user in Austin (Texas) have been able to apply at Austin Energy, a local utility, for a rebate of 50% of the purchase and installation cost of a Level 2 home charging station (Austin Energy 2023). Strategically, Austin Energy has been a central partner for the City of Austin´s approach towards electrified transportation. Austin Energy has defined the “5 EV Pillars Strategy”, which is next to charging infrastructure extension also covering equity and affordability, outreach and education as well as grid integration (Austin Energy 2022). In the case of New York City (New York), the “Charge Ready NY” program offers $4000 for the purchase and installation of a Level 2 EV charging station (New York State Energy Research and Development Authority 2023a). BEV users in Los Angeles (California) have been offered both monetary as well as non-monetary incentives for the set-up of charging infrastructure stations. As part of the encompassing “ZEV Action Plan”, the incumbent Governor in 2012 defined the milestone of streamlined permitting processes for charging infrastructure by 2015 (Governor’s Interagency Working Group on Zero-emission Vehicles 2013). Since then, cities and counties are obliged to streamline the process for BEV charging stations to be permitted. Monetary incentives are granted by local utility Los Angeles Department of Water and Power (LADWP). As part of the “Charge Up L.A.!”, BEV users receive a rebate of up to $1000 for the purchase and installation of qualified Level 2 BEV charging stations. Additionally, a $250 rebate for the installation of a dedicated EV charging station meter is provided (Alternative Fuels Data Center 2023c).
Complementary action is indicated by condition D. Utilities in Austin (Texas), Los Angeles (California) and New York City (New York) offered TOU rate schemes to BEV users. As with the cases that are covered by configuration ∼BCD, scope of the scheme offered and the amount of savings possible are varying. Utilities in Austin (Texas) and New York City (New York) offer flat TOU rate schemes for residential customers (ConEdison 2023; Austin Energy 2018). In the case of Los Angeles (California), local utility Southern California Edison provides BEV user with flexible TOU rate schemes that can be selected in accordance with individual charging preferences. There are three TOU rate schemes with different super off-peak, off-peak and on-peak time intervals and rates available.
Consequently, configuration ACD implicitly is confirming earlier research results covering the positive impact of monetary incentives on BEV diffusion (Clinton and Steinberg Reference Clinton and Steinberg2019; Wee et al. Reference Wee, Coffman and La Croix2018). Though, the positive impact of monetary incentives received upon vehicle purchase on BEV diffusion is present only in conjunction with proper (non-)monetary incentives at the local level. That said, the presence of necessary condition C and condition D add the importance of joint action between U.S. state entities, city authorities and local utilities in providing charging infrastructure equipment and services in a BEV user-centric way. Please note that even though the presence of condition B is not given in configuration ACD, cases Austin (Texas), Los Angeles (California) and New York City (New York) have implemented two recurring (non-)monetary incentives at the local level each. The presence of condition B is given for configuration ∼ABC∼D, which is not taken into account for the interpretation due to its low coverage score. In practical terms, recurring (non-)monetary incentives at the local level do matter for the composition of successful configurations policy configurations.
Ultimately, results of our empirical investigation confirm the relevance of well-composed bundles of BEV policies spanning across actions of U.S. state entities, city authorities and utilities while being tailored to local contexts. Cases Portland (Oregon), Los Angeles (California) and Denver (Colorado) illustrate the importance of initial action at the U.S. state level in setting main policy objectives and providing a regulatory framework for partnership among organizations at the local level. On this basis, city authorities and utilities are enabled to tie in with non-monetary and monetary incentives at the local level.
Discussion and conclusion
This research aims to analyze under which (non-)monetary policies at the U.S. state and local levels the diffusion of BEVs is supported. By systematically investigating a total of 16 U.S. cities with fsQCA, we created the following main results:
-
• BEV policy strategies that compose comprehensive policy bundles across U.S. state, city and utility-related policy levels are more likely to be successful. Thus, our empirical findings support the premise that local (non-)monetary incentives are active only in conjunction with local contexts by creating place-specific impact on BEV adoption (Held and Gerrits Reference Held and Gerrits2019; Hardman Reference Hardman2019).
-
• Our results indicate that (non-)monetary incentives for charging infrastructure extension are a necessary condition for the composition of a successful BEV policy bundle.
-
• State level-related monetary one-time and recurring incentives received upon and/or after vehicle purchase (condition A) in conjunction with (non-)monetary incentives for home charging infrastructure extension (condition C) in conjunction with recurring monetary incentives by utilities at the local level (condition D) lead to successful progress in BEV diffusion.
-
• Likewise, the absence of recurring (non-)monetary incentives at the local level (condition B) in conjunction with (non-)monetary incentives for home charging infrastructure extension (condition C) in conjunction with recurring monetary incentives by utilities at the local level (condition D) lead to successful progress in BEV adoption in U.S. cities.
In consequence, our results indicate two solution pathways (∼BCD + ACD → Y) that lead to progress in urban BEV diffusion. Thus, there is no sufficient BEV policy condition on its own responsible for BEV adoption to happen. Instead, two different configurations covering (non-)monetary incentives are sufficient, while the presence of condition C is necessary but only in conjunction with other conditions. By utilizing a rich and novel empirical data set covering a plausible selection of (non-)monetary BEV incentives in 16 U.S. cities, our approach resonates with the demand for investigating local variations and contextualized conditions that affect the impact of BEV policy approaches (Wee et al. Reference Wee, Coffman and La Croix2018). Results of our research confirm the relevance of monetary incentives received upon/after purchase of BEVs as emphasized by earlier research (Clinton and Steinberg Reference Clinton and Steinberg2019; Jenn et al. Reference Jenn, Springel and Gopal2018). Contrary to existing research, our results do not confirm a positive effect of (non-)monetary incentives (e.g., HOV lane access) on BEV diffusion (Jenn et al. Reference Jenn, Lee, Hardman and Tal2020; Jenn et al. Reference Jenn, Springel and Gopal2018; Sheldon and DeShazo Reference Sheldon and DeShazo2017). One reasons for that could be that earlier research used aggregated data at the U.S. state level for investigating the effect of such incentives. Our results add to existing research the importance of recurring monetary incentives provided by utilities at the local level (Wee et al. Reference Wee, Coffman and La Croix2018). Ultimately, our research approach investigates different BEV policies at different policy levels as policy configurations in conjunction promote the adoption of BEV in U.S. cities. As such, we add a novel approach to the existing body of research. In addition, our research results confirm that spatial variation highly matters when composing BEV policy bundles (Hardman Reference Hardman2019; Jenn et al. Reference Jenn, Springel and Gopal2018). That said, our research approach provides researchers and policymakers with an evaluation method that is sensitive to case-related variations of a set of heterogenous cases, while identifying common patterns across the cases considered (Ragin Reference Ragin2000). It thus is a promising approach for evaluating the impact of BEV policy bundles in U.S. cities within and across U.S. states.
Given the novelty of our approach, there are three major limitations. Firstly, the number of cases to be investigated could be higher. In our model, only seven out of 16 cases are linked to the occurrence of the outcome. As mentioned in the analysis section, coverage of the configurations leading to successful progress in BEV adoption appears to be relatively low (see section “Discussion and conclusion”). Consequently, explanatory value is limited to the set of cases investigated. The reason for a comparatively small case sample is data availability and accessibility at the local level. Our research model demands comprehensive place-specific data covering city-related BEV targets, BEV registration data and BEV incentives. Research in the future could add more cases to the case sample created for our research. That said, more U.S. cities with recurring non-monetary incentives (e.g., parking privileges, free access to HOV lanes etc.) are relevant, as only a few of the cases covered in our research implemented such incentives. Also, cities in U.S. states that are not covered by our research are a valid choice for case sample extension. Secondly and resulting from the first limitation, our research model entails only four policy conditions. Even though, we legitimately selected the most relevant policy conditions, there are many more incentives that could be investigated in future research (e.g., BEV car-sharing schemes, awareness campaigns, educational programs etc.) (Bui et al. Reference Bui, Slowik and Lutsey2021, Reference Bui, Slowik and Lutsey2020). Thirdly, our QCA research approach treats configurations of BEV incentives as static for the time span considered. The two sufficient configurations of BEV incentives identified only hold true for a certain timeframe (mainly between 2017 and 2021). Our findings only highlight a specific snapshot of what is a much longer transition process. Governing the transition towards fully electrified urban transportation systems is a highly erratic and thus dynamic challenge. Our approach is not sensitive to the way policymakers adapt BEV incentives across various policy levels in the course of time. Future research could follow Gerrits et al. (Reference Gerrits, Pagliarin, Klein and Knieling2023) that deploy a time sensitive variant of QCA, trajectory-based QCA, to investigate configurations of factors that in the course of time contributed to urban transformations (see also: Pagliarin and Gerrits Reference Pagliarin and Gerrits2020).
Ultimately, a configurational approach towards governing BEV transition in the urban domain can help to assess BEV policy bundles that propel progress in BEV diffusion. As demonstrated by our approach, QCA offers an alternative methodological approach that aids the analysis of various BEV incentives across U.S. state, city and utility-related levels. In consequence, QCA has the potential to add valuable explanatory power to the dynamics of BEV policy bundles that help to electrify urban transportation systems.
Supplementary material
The supplementary material for this article can be found at https://doi.org/10.1017/S0143814X26101068.
Data availability statement
Replication materials are available in the Journal of Public Policy Dataverse at https://doi.org/10.7910/DVN/6PXWSM.
Acknowledgments
We would like to thank the anonymous reviewers for their constructive criticism and recommendations that contributed to an improved version of our article. Also, we highly appreciate the support of the kind staff in the various departments of transportation, departments of motor vehicles, departments of revenues, city-related departments and agencies as well as utilities that provided empirical data.
Funding Statement
Open access funding provided by Erasmus University Rotterdam.
Competing interests
None.
Declaration of Generative AI and AI-assisted technologies in the writing process
None.
Appendices
Overview of effect on TCO of BEV for each U.S. state covered. For a detailed overview of the TCO calculations, please see “FILE 1” in the in the replication data

Number of BEVs registered between 2016 and 2022 for the U.S. cities/states selected


 Open access