


Introduction
We study the age structure of labor in a particular industry and geographic location during a period of major technological upheaval and substantial shifts in institutions. The age structure of labor in general or in a specific industry are topics rather seldom addressed in the social science history literature, except for questions related to child labor (e.g., Basu & Van Reference Basu and Hoang Van1998; Goulart & Bedi Reference Goulart and Bedi2017; Horrell & Humphries Reference Horrell and Humphries1995; Moehling Reference Moehling1999; Nardinelli Reference Nardinelli1990) and the social history of older workers (e.g., Haber & Gratton Reference Haber and Gratton1993; Thane Reference Thane2003). Age as such has more typically been used as a proxy or dummy to analyze other phenomena, not as the dependent variable representing key social or economic characteristics of work. Furthermore, previous studies of different industries have shown that—obviously—one’s practical experience increases with age, up to the extent that age can be used to measure skill (Goos & Manning Reference Goos and Manning2007; Ojala et al. Reference Ojala, Pehkonen and Eloranta2016; Skirbekk Reference Skirbekk2003; Sonenscher Reference Sonenscher2012: 100–2; Thompson Reference Thompson2003: 581; Vickers & Walsh Reference Vickers and Walsh1999: 19).
Previous literature has tended to emphasize technological and institutional changes as the drivers for the demand of labor in different age groups. In this article we contribute to these debates by examining the development of the labor market for sailors in Sweden and in Finland over a long period with a large database. This period, spanning from the mid-eighteenth century until World War II, featured many shocks (such as wars), institutional changes (e.g., child labor and retirement legislation and emergence of compulsory primary education and military conscription), changes in the aggregate society and economy (industrialization), demographic changes (declining infant mortality and increase in elderly population), and major macro inventions (the steam and motorized ships) that also had an effect on the demand for maritime labor.
Technological innovations that might have an impact on the demand for labor in different age groups can typically result in major societal and economic changes. The transition from older to newer technologies is usually a gradual but disruptive process, consisting of macro (general purpose technologies, like the steam engine) and micro (smaller advances, tinkering with the macro technologies) inventions. The history of resistance to technological change is quite abundant, ranging from nineteenth-century Luddites to modern-day fights against the ubiquity of robotized production and environmental concerns (Hayler Reference Hayler2015; Jones Reference Jones2013; Mokyr Reference Mokyr1992; Noble Reference Noble1995). Another feature of this resistance is the notion that technological advances can lead to fewer jobs in certain sectors and that this process favors the younger workers who are able to adjust to the new technologies more easily. Hence, older and more experienced workers might be pushed out of the labor market into unemployment in perpetuity and/or uneasy retirement. The younger ones would have to adjust to possibly stagnating wages and disappearing career prospects (Frey & Osborne Reference Frey and Osborne2017; Rotman Reference Rotman2013; Topel & Ward Reference Topel and Ward1992; West Reference West2015). Some scholars, like Robert Gordon (Reference Gordon2015) seem to consider the future of many types of manual laborers rather bleak amidst a so-called secular stagnation, whilst Mokyr et al. (Reference Mokyr, Vickers and Ziebarth2015), for example, have suggested a future full of new innovations and opportunities for new types of work. These notions can be investigated by examining similar historical technological transformations.
Similarly, institutions do play a role in the age structure of the labor force, together with overall demographic transitions. Legislation prohibiting child labor in the United Kingdom (Horrell and Humphries Reference Horrell and Humphries1995; Nardinelli Reference Nardinelli1980, Reference Nardinelli1990) and in the United States (e.g., Hindman Reference Hindman2002) did lead to a decline in the occupation rate of children especially in manufacturing, though the legislation alone was not the only source for the decline. As Carolyn Moehling (Reference Moehling1999) has stated, the child labor laws were rather a consequence than an initiator of this decline in the case of the United States. Besides these changes in legislation, the other sources contributing to the diminishing share of child labor included technological changes, increases in real wages, introduction of compulsory education, together with demographic transition and migration (in the United States) inducing increased supply for an unskilled adult labor force (Goldin Reference Goldin1979; Kirby Reference Kirby2003: 43; Osterman Reference Osterman1979). The use of child labor was, at least in the British and American cases, declining already from the mid-nineteenth century onward (Kirby Reference Kirby2003; Moehling Reference Moehling1999; Nardinelli Reference Nardinelli1980). Similarly, according to a survey made in Sweden in 1929 among 32 different industries, the share of workers below 18 years of age constituted only about 1 percent of the total labor force (Åldersfördelningen 1931). This statistic, however, does not include the shipping industry.
There have been profound changes impacting the other end of the age spectrum in the last two centuries, as the share of older men and women participating the labor force changed (Haber & Gratton Reference Haber and Gratton1993; Thane Reference Thane2003). On the one hand, in modern societies more elderly people are remaining in the labor force due to the increase in life expectancy and better health conditions. On the other, there were at least to some degree possibilities for retirement in the Western societies already present at the turn of the twentieth century, yet these retirement schemes did not cover blue-collar workers in most cases. Moreover, the poor relief systems for the elderly were mainly designed to encourage older people to work in tasks that demanded less physical strength (e.g., Thane Reference Thane2003). Sweden, however, introduced the world’s first universal public pension system for people aged 67 and above already in 1913, as a response to the growing elderly population (Hagen Reference Hagen2013; Edebalk & Olsson Reference Edebalk and Olsson2010). In the Swedish case, a 1929 survey of workers over 60 (up to 67) years of age made up more than 4 percent of the entire labor force (Åldersfördelningen 1931). Regardless, retirement was not an option for most of the people in the labor force in Finland and Sweden still in the early twentieth century, before more extensive pension reforms that came later with the formation of modern welfare states.
Shipping has traditionally been viewed as a young man’s profession, especially during the age of sail (Alexander Reference Alexander, Ommer and Panting1980; Lemisch Reference Lemisch1968; Vickers Reference Vickers1993; Vickers and Walsh Reference Vickers and Walsh1999, Reference Vickers and Walsh2005). Indeed, previous studies have shown that the majority of seamen on board such ships were below 30 years of age, whereas officers were, however, typically somewhat older (Bruijn Reference Bruijn, van Royen, Bruijn and Lucassen1997; Rediker Reference Rediker1987; Sager Reference Sager1989). Working on a ship required certain skills, which especially during the age of sail were mainly acquired through learning by doing. Thus, one could reasonably expect the age and skill of sailors to be correlated (Thompson Reference Thompson2003). Professionalization of the labor was seen in the lengthening of career paths and increased need for formal education, especially concerning officers working onboard steam vessels (Burton Reference Burton1990; Fink Reference Fink2011; Ojala et al. Reference Ojala, Frigren and Ojala2017).
The technological change from sail to steam and later to motorized (diesel) vessels had a major effect on the shipping industry as a whole. The emergence of steam technology also altered the structure of maritime labor profoundly: On the one hand, more and more high-skilled and educated men were needed as officers and engineers on steamships, but on the other, there was also an increase in the demand for unskilled firemen and trimmers (Armstrong Reference Armstrong1998: 73; Chin et al. Reference Chin, Juhn and Thompson2006; Hynninen et al. Reference Humphries2013; Kennerley Reference Kennerley2008). The steam engineers required onboard these ships were educated and, thus, older than many of their crewmates. Subsequently, steam ships required more physical strength from the low-skilled stokers that shoveled the coal to the bunkers, which in turn made it challenging for the youngest to be hired for such positions (Kennerley Reference Kennerley2008).
There were also institutional changes affecting the demand for seamen in different age groups during our period, similar to other professions. The early twentieth century witnessed a growing international demands to reduce child and youth labor on board of merchant ships (Fürst Reference Fürst1915; Lagergren Reference Lagergren1986: 311–12; Sciolla Reference Sciolla1920). This development was, however, to a large degree a consequence of ongoing other changes in the industry and society, as industrializing societies provided job opportunities on land for unskilled (and young) men too. Thus, institutional, societal and technological changes impacting the age structure of sailors were largely coevolving with each other. Moreover, elderly seamen serving onboard of ships were rather rare; thus, older men sought opportunities to work on land at their advanced age. This, in turn, lowered the average age of the men serving onboard the ships. Moreover, in Sweden the Seamen’s House as an institution offered social relief for elderly sailors already from the mid-eighteenth century onward.
Nevertheless, still in the early twentieth century there were a number of both very young and very old sailors in the Swedish and Finnish merchant fleets, despite—or because of—the institutional and technological changes that were influencing the average age structure. The motivation of this article is to analyze those changes with a quantitative approach. We focus on examining the evolution of seamen’s age in Swedish and Finnish merchant shipping over a long period, although our focus is primarily on Swedish maritime labor. As the child and youth labor onboard of ships declined, one can assume that the average age of the crew increased. But exactly when and why?
Peter Thompson (Reference Thompson2003) is among the few scholars who have analyzed the age structure of sailing ship era seamen statistically, using the Canadian merchant fleet in the late nineteenth and early twentieth century as a case study. This article complements this pivotal work by testing how new technologies (especially sail to steam) affected the age structure. However, whilst Thompson’s article concentrates on the earnings profiles of seamen, our article is focused on the age structure of sailors, though both articles have similar kinds of data (employment contracts). Thompson (Reference Thompson2003), for example, shows (similarly with our study) that seamen on board of sailing vessels were younger than those on the steamers, and that the average age of sailors was rising over time during the late nineteenth century. Our study has, though, also notable differences with the work of Thompson (Reference Thompson2003) and with other studies discussing the age structure of sailors (Bruijn Reference Bruijn, van Royen, Bruijn and Lucassen1997; Rediker Reference Rediker1987; Sager Reference Sager1989). In our article, the case area is different (Sweden and Finland), the period is longer (spanning from the mid-eighteenth century up to 1930s), and our data includes more explanatory variables.
According to our findings, the average age of sailors declined during the age of sail, and then increased when steam overtook sail during the late nineteenth and early twentieth century. Thus, we argue, first, that the technological changes in shipping had a profound effect on the age structure of Nordic seamen. These changes included both the incremental changes at the age of sail and the disruptive change from sail to steam and later to diesel engines. However, we maintain that this technological change was not necessarily the only reason for the increase in average age; there were also broader economic changes (e.g., opportunities on land) and institutional developments (e.g., legislation on work on ships and decline of child labor) that had an impact on this process. These changes, however, were largely related to technological changes that had occurred before; thus, both institutional and market changes can be seen as reactions to the technological changes. Moreover, the demand for Nordic shipping faced changes: Whereas the growth of shipping in the case towns used in this study originated from the internationalizing tramp shipping from the late eighteenth century until the early twentieth century, there was a clear concentration toward coastal cabotage shipping during the 1920s and 1930s. Furthermore, professionalization and other changes in the occupational structure during the early twentieth century had a profound influence on the age of maritime labor, leading to an increase in the average age.
In the following, we will first discuss the data we are using, to be followed by a descriptive analysis of the changes in the age structure over time, an analysis of age and skill, entry and exit ages, and, finally, statistical testing of the major variables affecting the age structure. We will conclude by discussing the findings and limitations of our study further.
Data Considerations
Our study is based on a particularly large dataset, which conforms to the recent demands for more targeted and empirically valid “big data” analyses (Guttman et al. 2018; Manning Reference Manning2013; Steckel Reference Steckel2007). We will use the extensive Swedish (and Finnish) Seamen’s House database that covers the period from 1752 to 1938 and includes 591,079 hiring cases from Sweden and Finland in this study. Finland and Sweden were important seafaring nations with similar institutions and labor markets during this period, similar to the other Nordic nations. Both countries possessed tonnages among the largest ones in the world in per capita terms during the late nineteenth century (Fritz Reference Fritz1980; Kaukiainen Reference Kaukiainen1991). During this period, especially the Swedish shipping tonnage grew substantially, as did the quantity of maritime labor: The number of merchant seamen in all Swedish towns was 5,500 in 1795, c. 8,000 in 1850, 27,500 in 1910, and 22,410 in 1938 (Swedish Official Statistics 1850, 1910, 1938).
The Seamen’s House was a formal public institution introduced in Sweden in 1748. According to Swedish (and Finnish) law, the hiring of men on board merchant vessels had to be carried out at the Seamen’s Houses. Therefore, all seamen were obligated to register themselves at a Seamen’s House to be hired. In these records, each individual was recorded for each voyage he or she was recruited; thus, the annual number of enrollments exceeds the number of seamen in each port as one man could (and usually was) be hired several times during the year. Thus, it is possible to trace at least to certain degree also the career paths of individual sailors in this data (Ojala et al. Reference Ojala, Frigren and Ojala2017).
In this article we have used the Seamen’s House database compiled by the Swedish National Archives’ project that combined data from nine Swedish and one Finnish Seamen’s Houses in this period.Footnote 1 We have data for the following towns: Kokkola (1814–1914) in Finland, and Örnsköldsvik (1900–39), Härnösand (1766–1940), Hudiksvall (1814–1939), Söderhamn (1819–1931), Gävle (1841–1907), Västervik (1806–1941), Visby (1752–1950), Oskarshamn (1912–14), and Karlskrona (1853–1937) in Sweden. These Swedish towns made up as much as one-third of the Swedish foreign trade shipping tonnage during the nineteenth century; by 1938, though, this share had declined to only 2–3 percent (Swedish Official Statistics 1938: 46–49). Of all recruitments to the Swedish merchant navy, however, these case towns comprised still roughly 10 percent of all Swedish shipping tonnage in 1915–38 (Arbetstillgången 1916–39).Footnote 2
Even though we have data up to 1950, we end our analysis in 1938 due to two reasons. First, the new Swedish maritime labor legislation enforced in 1939 changed the structure and demand for seamen onboard the Swedish vessels, thus making the data thereafter incomparable (Ny sjöarbetstidslag 1938). Second, World War II had a profound limiting impact on Swedish (and Nordic) shipping, thus decreasing the number of cases substantially, even though the country remained neutral throughout the war years.Footnote 3
The enrollment records include many types of information on these sailors, such as the date of birth, occupation, marital status, length of each recruitment, and so on. In total, the database includes 51 variables from each enrollment. Though age is one of the categories included in the database, it was recorded only for 125,000 enrollments, namely 19 percent of the cases. However, as the year of birth and year of hiring are known for 423,615 cases, this enables us to calculate the age of the seamen for these cases. Therefore, we have the age for 536,839 hiring cases for the period from 1752 to 1938. Based on this data, thus, we have information on individual seamen’s age comprising approximately 91 percent of the enrollments (table 1).Footnote 4
The number of enrollments and the average age of men hired during different time periods

Source: Seamen’s House database.
As the original database did not include an identification for each person, it could not be used as such to trace the entries, exits, and the entire career paths of the sailors, even though the same person could have been hired several times. Therefore, we created an additional database to identify as many sailors as possible to analyze those factors. We were able to identify 246,902 cases in which the same seaman was hired more than once. From this data we were able to create career paths for 56,188 individual sailors, and we utilize that data in the following text to trace the entry and exit ages of the seamen.Footnote 5 Unfortunately, this subdatabase includes only the years 1850–1938, as linking the data from earlier years appeared to be unreliable.
Although the Nordic shipping industry, as represented by this large long-run database, offers us a valuable opportunity to study sailors that operated in many parts of the globe, the original database does have certain limitations that should be considered when interpreting the outcomes of our research. In particular, we have two overlapping concerns. First, can we assume that our data is a random sample that presents the same underlying population of interest, that is, Swedish and Finnish mariners, over time? Second, does the changing town composition inherent in the database confound our analysis?
We have no absolute answers for these concerns for three reasons. First, it is possible that some of the original materials have not been digitized simply because they have been destroyed over the years for various reasons. Therefore, the Seamen’s House data has not been preserved from all towns and from all periods equally. However, this concern is likely to be of less importance because such omissions are likely to be random. Second, it is possible that digitized records have been systematically chosen by the digitizers. However, we have no evidence of this. Third, the digitized data at hand do not cover the two major shipping towns of Gothenburg and Stockholm. This is a major drawback, although it does not necessarily imply that our sample of sailors of the Swedish and Finnish merchant marine would be unrepresentative, especially because our dataset is a large, long-run panel.
In addition, we have taken into account some of these concerns related to the changing town composition in the empirical analysis. First, unobserved but permanent differences between towns (e.g., difference in the supply of labor) can be controlled in the regressions by using fixed effects (i.e., by town dummies). Second, observed and time-varying differences between towns can be controlled for by using interaction variables. For example, the effect of observed vessel characteristics (size, type, technology) on mariner’s average age can be allowed to vary across towns and over time. These econometric adjustments are, of course, only a partial remedy in addressing possible selection biases. Regardless, we contend that our dataset is well suited for our analytical framework.
Changes in the Age Structure over Time
Seafaring was indeed a young man’s profession for most of this period, according to our aggregate results. Table 1 and figure 1 show a clear trend: the average age diminished from the late eighteenth up to late nineteenth century (from 29 to 27) but increased thereafter during the early twentieth century (up to 33 years). During the 1770s and 1780s, the average age was more than 30 years and declined to 26 years by 1875. On sailing vessels, though, the average age was below 26 even in the early years of the twentieth century. The average age, however, rose rapidly after World War. I The early twentieth century witnessed a growth in the average age that was mainly due to the decline of child and youth labor. Namely, young boys (and sometimes girls) were no more hired on the steam vessels, and at the same time seamen occupation somewhat professionalized (as we will discuss in the following text).
Average age of enrolled seamen on sail and steam (left axis, years), number of hiring cases (right axis, n), 1752–1938 (N = 536,839) and main break points affecting shipping and age structure of sailors.
Source: Seamen’s House database.

We also tested for the structural characteristics of the underlying time series, to gauge whether the changes suggested by figure 1 held in econometric terms. We used the Bai–Perron test for sequentially determined breaks (up to a maximum of five breaks). The combined average age embodied breaks in the years 1810 and 1912. These two breakpoints aligned nicely with the major changes in our figure 1. The data for steam did not imply specific breakpoints, possibly due to the shorter period and some gaps in the series. However, the average age of sailors under sail changed structurally in 1792, 1854, and 1906 (or 1907, depending on the method used).
The breakpoint analysis and figure 1 above show that average age of sailors on board of sailing vessels declined. This is witnessed both in the major break in 1810 and sailing ships particularly in 1792 and was probably related to two factors. First, the average size of sailing vessels increased. The larger vessels required more men onboard but not necessarily very skilled ones, as the improvements in rigging and sail handling, for example, decreased the demand for skill. Besides these technological changes, secondly, the Swedish ships were more often used in international tramp shipping during the nineteenth century, which meant that ships were, in many cases, even years away from the home port. Old and married sailors were not necessarily keen on participating in these trades but rather worked on coastal vessels or sought opportunities on land. The second major breakpoint in 1912 (as well as the break in sailing vessels in 1906), in turn, was mainly related to three factors. First, steamers passed the sailing vessels in recruitments in the sample towns first in 1906, and by 1911 the share of steamers in the hirings was already more than 70 percent. Second, the first regulations on child labor were passed in 1914, followed by more regulations during the 1920s. Third, the case towns’ shipping concentrated more on coastal cabotage during the 1920s and 1930s, which was a more typical form of employment for older seamen. The breakpoint associated with the sailing vessels in 1854 might be related to the further increase in international tramp shipping. From this period on, the number of cases also increased significantly, as we can observe in figure 1. Thus, all of the breakpoints shown in figure 1 were not only related to technological changes but also to institutional and market factors that played an important role in the change of the age structure of seamen.
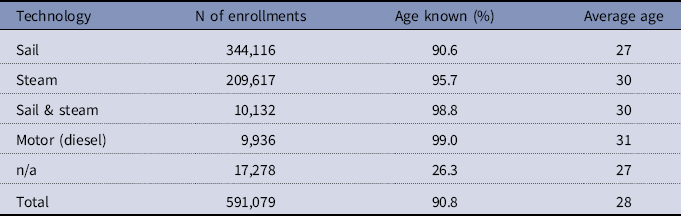
As can be discerned from table 2, almost 60 percent of the enrollments corresponded with the sailing ships and one-third with the steamers. The men hired for sailing vessels were clearly younger than the ones hired for ships using other technologies. Especially during the introductory years of steam technology, the men hired onboard these vessels were clearly older than average, as we saw in figure 1. This might be related to the fact that steamers required specific skills, experience, and education (engineers), which meant that in practice the men were older. Moreover, the first steamers were usually used in coastal shipping in which the men hired onboard were older, as already noted. The gap between the average age of men on steamers and ships using other technologies diminished during the early decades of the twentieth century as steam became the dominant technology and steamers were used in foreign trade shipments as well. Nevertheless, as can be clearly seen in figure 1, the average age grew significantly at the same time.
The number of enrollments among different technologies and the average age of men hired, 1752–1938
Source: Seamen’s House database.
The largest group in our data comprised of men between 16 to 25 years of age, who made up almost half all the enrollments. The age group from 26 to 30 years of age amounted to 16 percent, and 31 to 40 years of age formed 18 percent of the total enrollment, respectively. Experienced men, between 41 to 60 years of age, made up 13 percent of the sample, and the oldest ones, men more than 60 years of age, comprised of only 1 percent of all enrolled men, namely 5,700 hiring cases.
Based on figure 2 and table 3, two major structural changes occurred in the average age of men enrolled on these ships. First, the share of the youngest men increased during the nineteenth century. During the late eighteenth century, the share of men between 6 to 20 years was 16 percent of the enrollments, but this share rose to 22 percent by the early nineteenth century, and to 33 percent by the latter part of the century. This is in line with the results arising from previous research showing a decline in skill during the age of sail and the division of seamen into different age categories in the United States during the mid-nineteenth century (Battick Reference Battick, Ommer and Panting1980; Ojala et al. Reference Ojala, Pehkonen and Eloranta2016). The next change occurred during the early twentieth century, when the share of men under 16 years declined to around 1 percent, whereas this group previously made up 2 to 3 percent of all enrollments. At the same time, also the share of men in the group 16 to 25 years declined, whereas the share of men over 30 years increased to more than one-third—in fact, to the same level as it was during the late eighteenth century. The early twentieth century witnessed, besides a decline in the share of the youngest men of the total enrollment, an increase of the oldest age groups. Men over 40 years comprised more than 17 percent of the enrollment at this time, whereas the share of this age group was around 11 to 12 percent during the earlier centuries. The decline in average age can be, thus, explained by the decline of the youngest age group, on the one hand, and with the increase in age of the oldest groups, on the other. The same phenomena occurred also in a British sample: The share of hired men under 30 years of old was around 30 percent with steamers, but more than 70 percent with sailing vessels (Sager Reference Sager1989: 254). This decline is in line with overall decline of child labor during the industrialization, which was observed especially in the case of the United Kingdom from the mid-nineteenth century onward (Horrell & Humphries Reference Horrell and Humphries1995; Humphries Reference Hynninen, Ojala and Pehkonen2010).
Enrolled men by 5-year age categories, 1752–1938, per cent shares (N = 536,839).
Source: Seamen’s House database.

Share of enrollments of men at age 15 or below, 16 to 20, and 50 years and above, 1752–1938, per cent shares

Source: Seamen’s House database.
If we look more precisely at the share of men 15 and 20 years and younger (table 3), we see a striking development, namely a decline in the share of 20 years and below during the eighteenth century, then a growth trend in this share until the turn the twentieth century, and thereafter a deep decline. In the youngest age cohort, that of 15 years and under, we do not see a similar kind of development. The youngest ones were rather unusual cases: There were only 104 boys (or girls) under 11 years of age in the sample, most of them sons (and daughters) of captains. Even the age group 11 to 15 was quite rare, representing less than 2 percent of the cases—which still amounted to more than 10,000 enrollments. Lemisch (Reference Lemisch1968: 373), for example, has argued that a typical recruiting age was around 13 during the age of sail. Our data show that the use of child labor (under 15 years) was not typical aboard of Swedish ships even before the new legislation in the 1910s and 1920s that prohibited child labor.Footnote 6 The law was, in fact, enforced fairly quickly: There were no more boys under 15 years of age hired during the 1930s.
Thus, the increase in the average age during the 1920s and 1930s can most likely be explained by the decline of youth labor—that is, especially men between the age of 16 and 20. Moreover, the share of men of 50 years or above increased from the 1870s onward and especially strikingly from the early 1930s onward. This, in turn, might reflect the change in the occupational structure of seamen and shipping activities together with onshore opportunities offered to youth labor in the towns included in our dataset.
Age and Occupation
It is not a surprise that the oldest men were enrolled in occupations that required experience and education (table 4). Captains were on average the oldest group, followed by steamship officers. However, there were differences in experience and education among the captains. Moreover, mates were a diverse group, including experienced first mates, and rather young second or third mates (or constables). These younger mates had, in many cases, a lower salary than experienced seamen (see also Kaukiainen Reference Kaukiainen1994; Vickers & Walsh Reference Vickers and Walsh1999: 31). On Canadian ships, around one-third of the officers were in the age group of 30 to 39 years in the period 1863–1914 (Sager Reference Sager1989: 147). The most experienced crewmembers were boatswains and timbermen—both in their mid-30s—whereas able-bodied sailors (ABs) were a couple of years younger on average. The most inexperienced men, ordinary sailors (OS), deck boys, cooks, trimmers, and firemen were clearly below 30 years on average. In fact, even the Swedish term for ordinary sailors, jungman, referred to the young age of these men. Daniel Vickers and Vince Walsh (Reference Vickers and Walsh2005: 267) have shown that during the eighteenth century the average age of seamen was usually between 18 to 23 years, whereas officers were over 23 years of age. In the Canadian sample, the crew members were under 30 years of age in more than 70 percent of the cases—if the officers were not included (Sager Reference Sager1989: 154). The youngest ones enrolled were typically deck and cabin boys (see also Vickers & Walsh Reference Vickers and Walsh1999: 25).
Average age in different occupations, 1752–1938

* Catering personnel included passenger ship personnel such as stewards, cleaners etc.
Note: N = all cases; n = age known.
Source: Seamen’s House database.
The number of men hired in different occupations changed over time so that more men in occupations with typically younger men were hired during the nineteenth century. This, in turn, contributed to the decline in the average age as a whole in our sample. However, the technological change from sail to steam contributed to the increase in average age during the turn of the twentieth century. Especially the average age of the low skill occupation of steam vessels, firemen and trimmers, was clearly higher than that of the typical young men professions during the sailing era (lower-level ABs and OSs). That, in turn, was due to the fact that shoveling coal to bunkers demanded more physical strength than the work as a deck boy on sailing vessels (Kennerley Reference Kennerley2008). The situation of trimmers and firemen in particularly were discussed time and again in Sweden at the time, and changes to legislation on minimum age were defined accordingly (see, e.g., Sociala Meddelanden 1915: 354).
Shipping was thus a young man’s profession also according to the Swedish and Finnish data because more than two-thirds of the enrolled men were 30 years of age or below. The age grouping of maritime labor was strikingly different than in other occupations at the time. In 1929, a survey was compiled in Sweden covering more than 409,000 workers in different occupations—though not including any maritime labor occupations.Footnote 7 In this survey, the share of workers aged under 26 years made up roughly one-fifth of the labor force, whereas in our sample in same year almost half of the men were under 26 years of age (Åldersfördelningen 1931: 259). In a Canadian database on seamen, covering the years 1863–1914, men below 30 years of age amounted to as much as 70 to 80 percent of the total enrollment (Alexander Reference Alexander, Ommer and Panting1980; Sager Reference Sager1989). Similarly, according to Vickers (Reference Vickers1993: 422) up to 75 to 90 percent of the men hired aboard North American ships during the eighteenth and nineteenth century were below the age of 30 (see also Vickers and Walsh Reference Vickers and Walsh1999: 11). According to Stig Tenold (Reference Tenold2015: 789), the share of enrolled men below age 20 declined from 1963 to 1983 from 25 to less than 5 percent in the Norwegian fleet. Thus, the average age onboard Swedish and Finnish vessels in our sample was somewhat higher than in studies dealing with other regions or periods. This might be explained by several factors. First, the Seamen’s House dataset included also vessels that were used in coastal shipping. Typically, men engaged in coastal shipping were older than the ones hired for international shipping (compare, e.g., with Rediker Reference Rediker1987: 299; Vickers & Walsh Reference Vickers and Walsh1999: 18). Moreover, the small towns included in our sample might have lacked other job opportunities, thus also older men were forced to enroll onboard ships.
Age and Skill
The age structure of Nordic seamen can be further analyzed by dividing the sailors into different skill categories. These categories are defined in terms of the demand for skills in their work, namely by assigning them into high-skilled abstract jobs, middle-skilled routine jobs, and unskilled manual jobs (see, e.g., Autor et al. Reference Autor, Levy and Murnane2003, Reference Autor, Katz and Kearney2008; Goos and Manning Reference Goos and Manning2007; van Reenen Reference van Reenen2011). The high-skill group in our case consisted of trained and educated men performing abstract tasks on board, including captains, mates, and steam engineers. The middle-skill group consisted of experienced men with little or no education. Instead, they had a great deal of practical training and experience on ships and performed mainly manual tasks. This second (medium-skill) group included boatswains, carpenters, and able-bodied seamen. The third (low-skill) group consisted of young and inexperienced men performing physical tasks that required little skill on board. The main occupations in this group were ordinary sailors, namely deck/cabin boys, cooks, and during the steam era also firemen and trimmers.
According to earlier studies, the share of medium-skilled men declined during the age of sail from roughly half to less than one-fourth of all enrolled men. The share of this group declined further during the early twentieth century. The share of low-skilled men, in turn, increased throughout the period: Their share was roughly one-fourth during the mid-eighteenth century, rising to more than half during the early twentieth century. According to previous studies, the skill shares and skill premia both became more polarized during the introduction of steam—this same seems to have happened also in the case of the average age (Chin et al. Reference Chin, Juhn and Thompson2006; Ojala et al. Reference Ojala, Pehkonen and Eloranta2016).
Figures 3a–3c capture the changes in age distribution in different age cohorts (cf. figure 2). The share of high-skilled men increased because initially the larger sailing ships required more officers (mates) and later steam engineers were enrolled aboard steamers (Ojala et al. Reference Ojala, Pehkonen and Eloranta2016). These men in the high-skill group were on average, obviously, the oldest ones, even though there were some differences within this group—especially between the youngest third mates/constables and the captains (figures 3a–3c). The average age of the men in the high-skill group declined during the early nineteenth century. This decline of the average age was related to the fact that the ships from the sample towns were used more frequently in international trade and also that the average size of ships increased; therefore, these ships needed more officers on board, including educated, though less experienced second and third mates. The average age of the high-skill group, in turn, grew during the late nineteenth and especially in the early twentieth century as experienced and more educated steam engineers were hired on board of steamers.
Enrolled high-skilled (a), medium-skilled (b), and low-skilled (c) men by 5-year age categories, 1752–1938, per cent shares (N a = 119,346; b = 121,547; c = 284,807).
Source: Seamen’s House database.
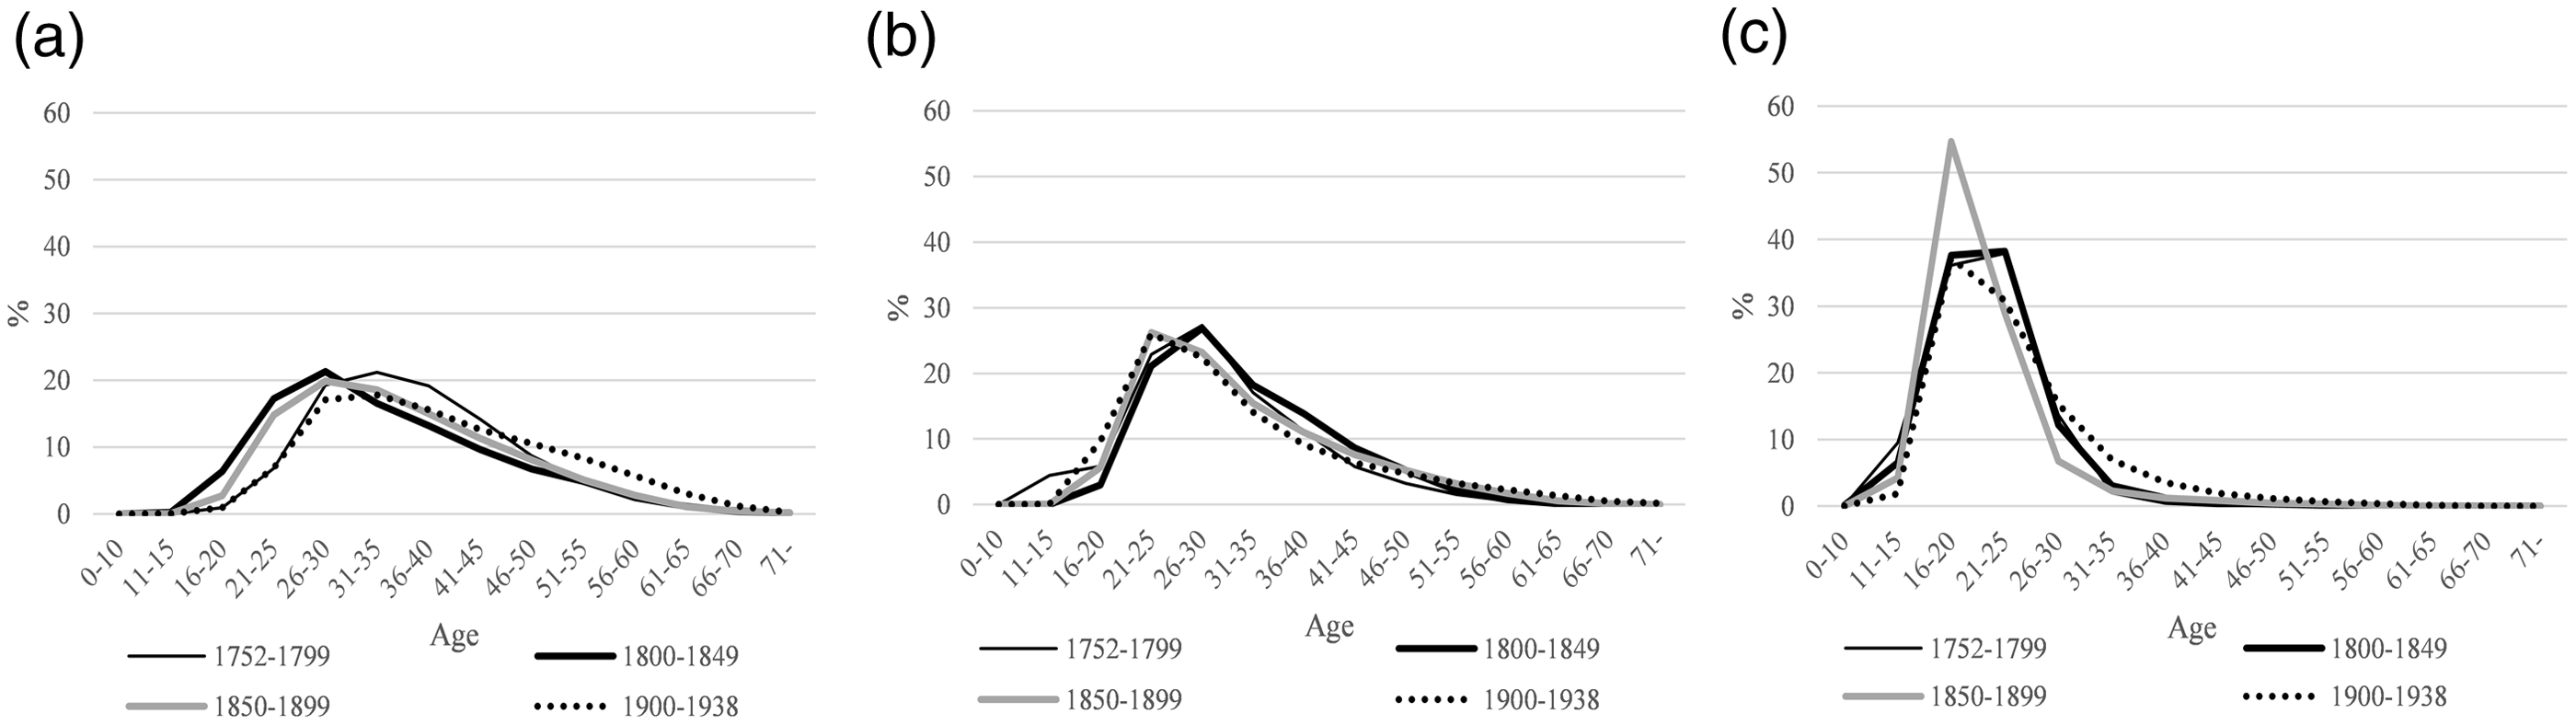
In the case of the medium-skilled men, there was a change from the late eighteenth and early nineteenth century to younger age cohorts during the following periods (figure 3b). Nevertheless, there were no significant changes in the average age of the medium-skilled men. Also, the men in the low-skill group did not experience much change in terms of average age before the turn of the twentieth century. However, as shown in figure 3c, the share of the age cohort 16–20 years was especially large during the late nineteenth century, as young men were recruited on board of large, ocean going sailing vessels. Thereafter, the average age of this group increased significantly. As the same time also the group’s share of all crewmembers increased, and this change in age had a significant impact in the overall increase in the average age. The major reason for this was the fact that the enrollments of the youngest men, below 20 years of age, declined as already noted. After gaining experience and age, these low-skill men, obviously, moved to the medium-skill group—or chose to exit from the industry. Nonetheless, there were persistently also men over age of 30 that were enrolled in the low-skilled group, which made 10 percent of the whole group in the sample; that is, roughly 30,000 enrollments. Thus, in all especially the average age of the low-skilled group rose, and as this group was proportionally larger than the other groups, it led to an increase in the average age of the whole sample.
Entry and Exit Age
The entry and exit ages are essential factors to describe the changes in the age structure of the sailors. By using a subdatabase including the career paths of 56,188 sailors with 246,902 individual hiring cases we can trace both the entry and exit age of each seaman. One should, however, be cautious when interpreting these results as the men hired only once were excluded from the data, and there might have been men that had either started or ended their careers in other towns that were not included in our sample. Moreover, this career path data is, unfortunately reliable only from the mid-nineteenth century onward. Therefore, in the following we only use two cohorts in our comparisons: those hired between years 1850 and 1899 and those between 1900 and 1938 (table 5, figure 4). Furthermore, for entries we counted only those with lower skill levels, as there were men hired from other towns and professions directly to medium- or high-skill demanding tasks. However, for exits, all the skill levels were included.
Average entry and exit ages and career lengths for sailors, 1850–1938 (N = 56,188 individual sailors)

Source: Seamen’s House sub-database on career paths. See Ojala et al. Reference Ojala, Frigren and Ojala2017 for details.
Number of men entering and exiting the shipping industry at different ages, 1850–1938 (N = 56,188 individual sailors).
Source: See Table table 5.
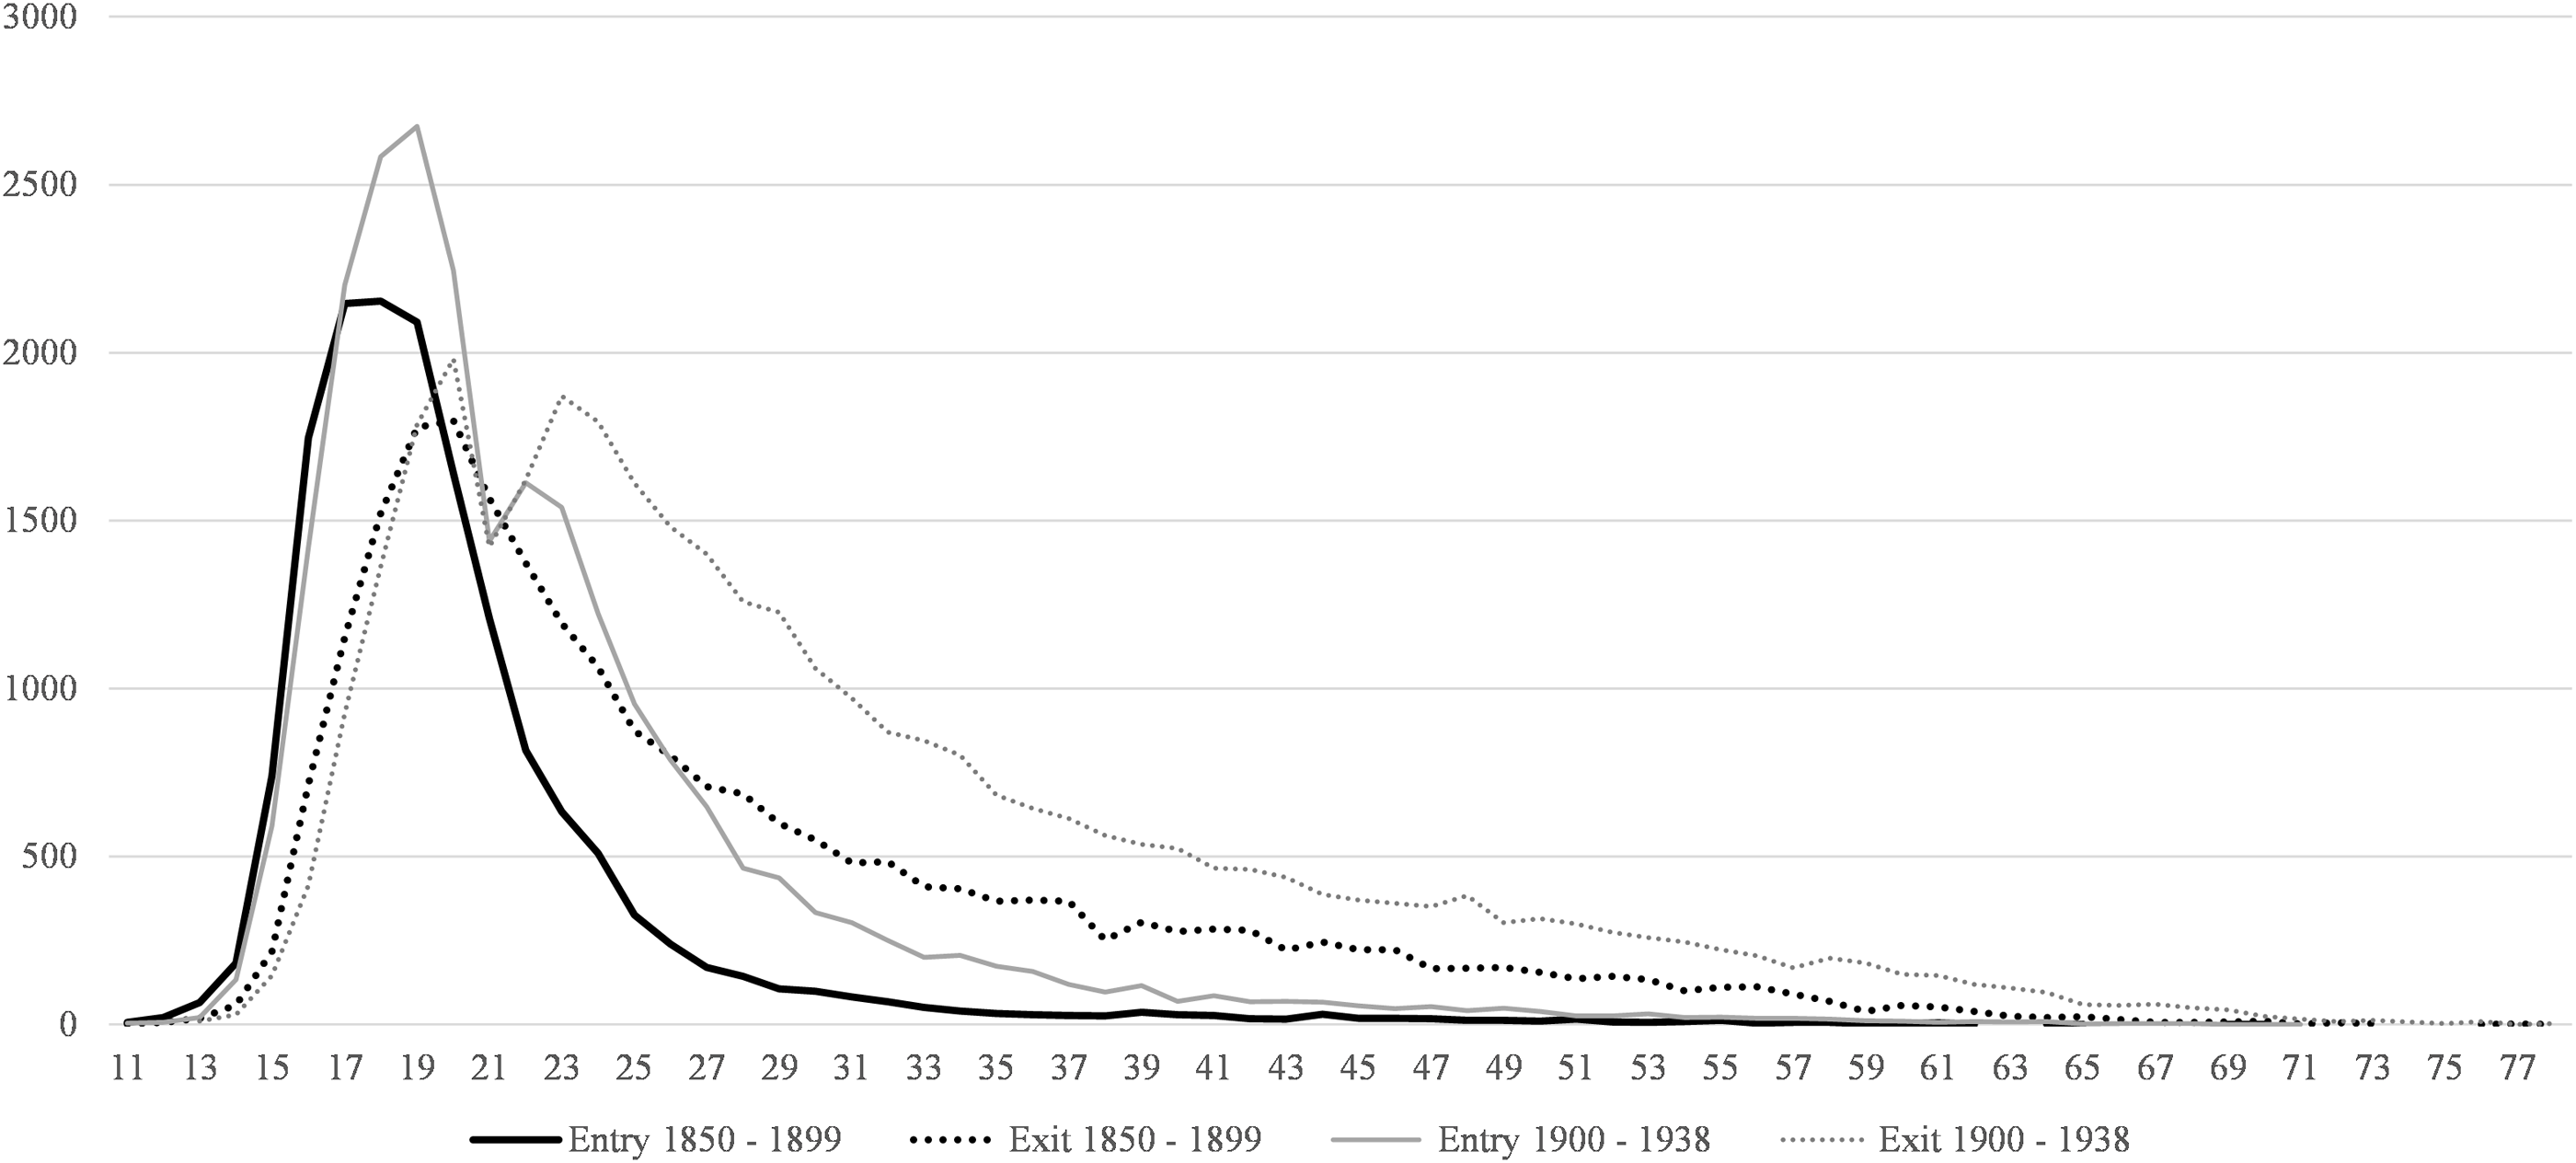
The average entry age confirms our results, namely that most men did not enter the shipping industry as children, but rather as youngsters. Previous studies highlighting, for example, the average age of 13 years as a typical entry age (e.g., Lemisch Reference Lemisch1968) were not supported with our data. As shown in the table 5, the average entry age for sailing ships was just below 20 years both in the late nineteenth and early twentieth century. For steamers and motorized vessels this entry age was somewhat higher, around 23 years. Therefore, the skill demand and age did not match as such: Men hired onto early-twentieth-century steamers roughly at age 23 were equally unskilled as the 19-year-old men hired onboard sailing ships during the previous century. Furthermore, we do not know exactly what kind of skills these men had developed from their previous employment on land; for example, it is reasonable to equate working as firemen or trimmers with typical physical work on land.
Interestingly, the average career length was rather equal both onboard sailing vessels, steamers, and on motorized vessels, with no particular difference between different periods. An interesting fact, though, is that men left the industry on average rather early, in their thirties. Thus, very few reached the official retirement age of 67 years introduced in Sweden in 1903 during the early twentieth century while working on ships. This provides strong evidence showing that shipping was, indeed, a young men’s profession.
Figure 4 shows that a typical age of entry for seamen between 1850 to 1899 was 17–19 years; in fact, this age group made up to 52 percent of all men entering to industry in that period. However, in the years 1900–38 this age group constituted 41 percent of all entries. Whilst in the late nineteenth century highest number of entries were for men of 18 years of old, this figure was 19 years in early twentieth century. Regarding the exits, the seamen most often left the industry already in their early twenties: age group 20–25 years made up one-third of exits in the latter part of the nineteenth century, and about 29 percent in the early twentieth century.
In addition to child labor laws, there are two other institutional constraints that might have had an effect on the entry ages: primary education laws and military service. The emergence of primary education in Sweden in 1842 was aimed at keeping the pupils in school from 4 to 6 years after age of 7. However, in reality the effective number of school years could have been 2 years or even less until the 1930s (Ljungberg and Nilsson Reference Ljungberg and Nilsson2009). As the majority of the low-skilled recruits for the merchant marine came from lower social classes, it is reasonable to assume that compulsory education did not have a major role in increasing of the average age of sailors. Compulsory conscription, in turn, was introduced in 1901 in Sweden and it included all men between 21 and 47 years of age to serve for 150 days of basic military training (Leander Reference Leander2005). Thus, it might have had an effect on recruitments to merchant marines, though not necessarily declining the youngest age cohorts entering to the profession. Nevertheless, the compulsory conscription might explain the decline in entries and exits at the age of 21 during 1900–38 in figure 4.
Technology, Institutions, and Professionalization: Quantitative Analysis of the Age Structure
The descriptive analysis we have presented here already offers some suggestions about the changes of average age of men hired onto merchant fleets, on the one hand, and on the causes of these changes, on the other. To further strengthen our argument, we approached the issue also by engaging in regression analysis. Our points of departure are figures 2 and 3, showing, first, the changes in age structure over time and, second, the age structure in different categories. The purpose of our quantitative analysis is to provide a more precise view of the observed changes in the seamen’s average age by controlling for factors that might have influenced age trends in the industry. In particular, we looked for possible signs of diversified trends in the mean age by exploiting the database by skill-based groupings and occupations.
There are several factors that may have influenced seamen’s average age over time. We focus on three potential sources that operate through the demand for or supply of labor in the industry, already suggested in our descriptive analysis, namely, prevailing vessel technology, existing labor laws, and professionalization of occupation. First, technological advances can lead to changes in optimal vessel capacity and vessel technology, and thereby to changes in the optimal composition of the crew. For example, steamers may have required different skills and experience from their labor than sail vessels. The same applies to vessel types: Bigger vessels may need more diversified skill composition and more experienced crew than smaller vessels. The potential importance of these factors for an industry’s age structure can be illustrated by a comparison of data in two cross-sections: In 1830, men were hired only on sailing ships with an average size of 135 net register tons, whilst in 1930 in practice all were hired on steamers with an average size of more than 707 tons.
Second, the laws that stipulated the use of labor or improvements in labor legislation in general, may have induced changes in the composition of the crew. The labor laws that limited child and youth labor on board that in the 1910s and 1920s are examples of restrictions on labor supply that may have affected the entry ages. General improvements in labor legislation, in turn, may have motivated older men to recruit on board of ships; this, however, does not show up in our descriptive analysis (table 5, figure 4). As table 3 shows, the decline of youngest age group (20 years or below) of all enrollments was marked in two periods: at the turn of the twentieth century and in the early 1930s. The first episode was likely associated with the rapid growth of the share of steamers, while the second coincided with the strengthening of labor laws and changes in markets for shipping in our sample towns, namely, concentration to coastal shipping. It is quite possible that the technological change provided the initial boost in age, to be complemented later by the altered institutional framework of the labor market. Third, there is a large literature on the professionalization of occupations. It is reasonable to assume that the maritime industry was not an exception, as is shown also in previous literature (e.g., Burton Reference Burton1990; Chin et al. Reference Chin, Juhn and Thompson2006; Davids Reference Davids1994, Reference Davids2015).
To understand the variation in age structure of seamen over time by skill groups and occupations, we explored a quantitative model with various potential explanatory factors. We used our large database and Ordinary Least Square (OLS) techniques to estimate models of the form:
 $${\rm{Ag}}{{\rm{e}}_{{\rm{ijt}}}} = {\rm{constant}} + {\rm \alpha} {\left( {{\rm{Technology}}} \right)_{\rm{j}}} + {\rm \beta} {\left( {{\rm{Labor}}\,{\rm{Laws}}} \right)_{\rm{t}}} + {\rm \theta} {\left( {{\rm{Professionalization}}} \right)_{\rm{t}}} + {\rm \partial} {\left( {{\rm{Controls}}} \right)_{{\rm{ijt}}}} + {\rm \varepsilon _{{\rm{ijt}}}}$$
Where the age of a seaman i at the time of contract t on a vessel j was related to technological characteristics of the vessel (technological status of a vessel and its gross capacity), labor laws implemented over the investigation period (measured by dummy variables), and professionalization of occupations (measured by time trends). We allowed for a separate occupational trend on the period of sail (pre-1860) and on the period of steam (post-1860). To account for omitted variable bias, we controlled for changes in relative demand for and supply of labor by regional dummies (town indicator), vessel characteristics (vessel type indicator), and proxies of wage developments (indicators for relative wages by skill groups). Furthermore, we allowed for the possibilities that the relationship between age and individual-specific characteristics may have depended on vessel-specific characteristics.
Before proceeding, three remarks are worth a note. First, we employed dataset that is smaller than the one described in tables 1 and 2 as well as figure 1. Due to missing data on certain covariates, the total sample consisted of 363,963 observations. Second, the analyses did not provide information on causal effects but illustrated associations between the average age of men and the covariates, while controlling for several factors that may have affected the relationship. Third, the numerical estimates of covariates might be biased if the model omitted variables that were important determinants of age and correlated with the included covariates. However, the comparison of relative effects across groups or occupations was justified if the effects of omitted variables on age were similar across skill groups and occupations.
Tables 6 and 7 summarize our main results: Table 6 shows the estimates for the skill-based groups and table 7 for selected occupations. The high-skilled group (N = 75,313) consisted of captains, steam engineers, mates, and constables. The medium-skilled group (N = 90,689) comprised of boatswains, carpenters, and able-bodied sailors. The low-skilled group (N = 197,961) included ordinary sailors, firemen, and trimmers, as well as cooks and cabin boys. We focus on occupations that represent both ends of the skill distribution in sail and steam respectively, namely captains (N = 30,606), cooks and cabin boys (N = 49,330), steam engineers (N = 10,066), and firemen and trimmers (N = 30,829) in table 7.
Evolution of average age over time by occupational groups, 1752–1938: Parameter estimates for covariates

Notes: The dependent variable is seamen’s age. Heteroskedasticity-robust standards errors are reported in parentheses.;
*** = statistically significant at the 0.01 level.
Evolution of average age over time by occupations, 1752–1938: Parameter estimates for covariates

Notes: The dependent variable is seamen’s age. Heteroskedasticity-robust standards errors are reported in parentheses.;
*** = statistically significant at the 0.01 level.
The skill group–based analysis produced three findings. First, only the high-skilled group provided evidence on the professionalization of occupations, proxied by the linear trends. The estimates for the whole period (β = 0.60, p < 0.01; β = 0.008, p > 0.10; β = –0.24, p < 0.01) were consistent with the data on age variation across the skill groups, as seen in figure 3. Furthermore, they are in accordance with our expectations: The occupations that require more training and education are more likely to be professionalized than occupations where such needs are of less importance. Although interpretations based on linear trends should be cautious, our results affirm the findings that the additional trend for the post-1860 period played no role in the determination of age.
Second, the association between technology and age was similar across the skill groups: The average age on steamers compared to sail was approximately one year higher, being highest in the low-skilled group (1.2 years). Third, the association between vessel size and age varied across the skill groups. In the middle-skill and low-skill groups, the doubling of vessel size was associated with an increase of 0.25 years in the average age of men. This indicates that bigger vessels were able to offer more attractive career paths for men of the middle and low-skilled occupations, or they valued experience more than smaller vessels. In the high-skilled group, the association was reversed. This suggests that bigger vessels preferred to have a more diversified age structure amongst the high-skilled occupations. However, as table 7 shows, there was heterogeneity in the age-capacity relationship across vessel technology.
Fourth, the results for the level dummies that proxied the association between age and institutional changes in the labor laws in the interwar period (1925–38 and 1934–38) were similar across the skill groups with certain differences. In particular, the results indicate that there was a strong association between the strengthening of labor laws and age. The estimate for the 1925–38 period was similar in all skill groups (approximately 2.6 years). The additional dummy for the 1934–38 period indicates an extra effect of legislation on age in the middle-skilled and the low-skilled groups but not in the high-skilled group. The estimated effects were substantial: 3.0 years in the middle-skilled group and 4.4 years in the low-skilled group. We emphasize that the size of these estimates must be interpreted with caution, due to possibility of omitted confounders. However, the estimates were consistent with a priori expectations, yet it is more likely that the labor laws would have had an impact on the low-skill occupations rather than the high-skill occupations.
Table 7 supplements the analysis by a separate examination of four occupations. These occupations represent both the two technologies (sail, steam) at the ends of the skill distribution (captains vs. cooks and cabin boys; steam engineers vs. firemen and trimmers). In essence, the findings reaffirmed our results but also contained certain interesting differences. There are several points worth noting. First, the time trend for the captains and steam engineers (β = 0.54, p < 0.01; β = 1.49, p < 0.01) implied that a professionalization of occupations occurred. The heterogeneity of the estimates, in particular, a high estimate for the steam engineers might be related to the fact that the men hired (as youths) to work in this profession remained in the industry for the entirety of their careers. The estimates for the lower-end occupations vis-à-vis sail and steam were similar, providing no statistical evidence of professionalization (β = 0.02, p > 0.10; β = 0.04, p > 0.10).
Second, the associations between the technological advances and age varied across occupations. The average age on steamers compared to sail was six years higher for the cooks and cabin boys (β = 6.0, p < 0.01) and 2 years higher for the captains (β = 1.87; p < 0.01). The association between vessel size and age similarly varied across occupations. For cooks and cabin boys, the doubling of the vessel size was associated with an increase of about 1.2 years in age (β = 1.21, p < 0.01). For firemen and trimmers, the estimate was lower, approximately 0.7 years (β = 0.67, p < 0.01). The results for the high-skill occupations revealed interesting heterogeneity. The estimate for the captains was positive (β = 0.26, p < 0.01), but for the steam engineers it was negative (β = –0.37, p < 0.01). This suggests that a more diversified age structure amongst the high-skilled labor was particularly preferred on the bigger steamers. Third, the labor law dummies are indicative that changes in legislation were statistically (p < 0.01), and strongly associated with the low-skill occupations (columns 3 and 4). This is particularly marked for the 1934–38 dummy (β = 6.09, and β = 4.35). The corresponding estimates for the high-skill occupations (columns 1 and 2) are also statistically significant (p < 0.01) but considerably lower (β = –0.4; and β = 0.99).
In sum, the results implied that both the strength and direction of an association between age and covariates varied across skill groups and occupations. The evolution of the average age in the high-skilled occupations has been strongly related to the professionalization of the occupations, and partly driven by the technological advances. The evolution of average age in the low-skilled occupations, in turn, has been strongly related to the technological advances and the changes in labor legislation.
Discussion
Periods of macro inventions that change the productivity of an entire sector or the economy as a whole are often perceived to be disruptive. Moreover, in modern economies the greater degree of automation and the changing nature of manual labor can lead to age polarization as well as a forced exit from the labor market by the older workers. Here we examined this issue by analyzing the age structure of sailors on Nordic vessels over a long period that featured many societal and economic changes, and in particular the move from sail to steam technology in shipping. We found that the age structure of the seamen was skewed toward the young in the age of sail, but there was a rather significant change in this respect during the early twentieth century. Namely, throughout the age of sail the average age of men declined, reflecting the deskilling that occurred at the time. The technological change, professionalization, landward opportunities, changes in markets for shipping services, and institutional changes all contributed to a substantial increase in the mean age during the first half of the twentieth century. This increase was especially due to the exclusion of men between 16 to 20 years of old, on the one hand, and the increase in the number of older men (50 and over) on board these ships, on the other. Thus, the shipping was no longer a young man’s profession at all, even though vast majority of the seamen were still under 30 years of age in the early twentieth century.
What were, then, the forces that contributed to the changes in the average age of enrolled men? They can, roughly, be divided to industry-related, endogenous factors, as well as exogenous forces related to the overall economic and societal development of the countries and the towns we used as cases. The industry-related explanations were especially important in illuminating the changes in the mean age during the eighteenth and nineteenth century. During the eighteenth century, the dataset included more small coastal vessels that were typically used only during the summer months, which usually hired older and experienced men (e.g., Frigren Reference Frigren2016). The decline in the average age during the nineteenth century, in turn, was also related to the changes within the industry. The large vessels engaged in international freight carrying trades experienced a decline in skill and average age. The increase in average age during the twentieth century can mainly be explained by the decline of the youngest age groups, on the one hand, and the increase of older groups, on the other. This was also connected to endogenous industry-related changes because steam vessels and liner shipping provided opportunities for older men as well. Regardless, the men working below deck were mainly young and inexperienced (Kaukiainen Reference Kaukiainen2008: 403). Kennerley (Reference Kennerley2008: 202) has shown with British data that the average age of trimmers and firemen was between 20 to 30 years of age from the mid-nineteenth to the mid-twentieth century; thus, they were on average older than the men hired aboard sailing vessels. Moreover, in the towns used in our data the shipping concentrated back to the coastal waters during the interwar period, thus offering (again) hiring possibilities for elderly men—similar to the situation some 150 years earlier.
The most important reason, though, for the increase in the average age on ships probably pertained to the legislative changes restricting child and youth labor on board these ships. Steamers were specific targets of these restrictions; thus, the overall increase of steam and the simultaneous restriction of child and youth labor onboard the steamers together resulted in an increase in the average age of maritime labor. These labor restrictions, however, should be seen as outcomes of the technological change from sail to steam as well as related to the more general attempts to reduce child labor in different industries (Lagergren Reference Lagergren1986). Thus, the legislative changes leading to reduction of child and youth labor on board of ships was a similar phenomenon that occurred in industries in many countries around the same time: The legislation was to a large degree a consequence of technological change that already had decreased the demand of child labor (Moehling Reference Moehling1999). Moreover, an increase in the job opportunities on land might have had another cumulative effect on the age structure, though we did not examine it further in this article. Nevertheless, the late industrializing country provided employment also for the young and inexperienced men that no longer yearned be hired on board these ships. The older men, however, stayed on in their positions. A similar phenomenon occurred also in a US sample during the late nineteenth century as older men stayed onboard ships and the younger ones sought opportunities in various land-based industries (Battick Reference Battick, Ommer and Panting1980). Nevertheless, though a comprehensive retirement age (67 years) was implemented in Sweden already in 1913, there were only a handful of seamen that achieved that age while working on ships.
An increase in the average size of ships also had an effect on the age structure of men (Sager Reference Sager1989: 75). The average age increased in all of the size classes, yet most clearly on ships more than one hundred tons. During the age of sail, in turn, the average age was the highest on the smallest vessels used in coastal trades. The average age of men can be used as a rough measure to study the changes in skill shares in shipping. Especially the share of low-skilled men increased, whereas the share of the medium-skilled men decreased quite rapidly. The average age of men declined throughout the nineteenth century, yet it increased during the early twentieth century. Our results seem to be consistent with most labor economics literature, namely that the middle-skilled group has the hardest task of adjusting to major technological changes, that is, we can confirm the hollowing out phenomenon in the Nordic shipping labor markets. Moreover, our results suggest that professionalization deepened especially among the high-skilled group of sailors.
In sum, major changes in technology, especially macro inventions like the steam engine, do not necessarily favor younger workers, as the changing nature of the work is the most important factor, regardless of the period. Furthermore, general purpose technologies may bring about situations in which older workers have valuable expertise that younger, less experienced workers may lack—and managerial expertise is also age related. The bleak prognosticators of the changing twenty-first-century labor markets may in fact be wrong in the long run, as the nature of work and labor markets tend to be fluid in periods of transition. Nevertheless, despite our findings in the case of Nordic sailors over two centuries, one should always exercise caution in predicting future labor market transitions.


 Open access

