


Introduction
The ability to link an entire population across multiple years of data opens the door to answering key social science questions related to migration, mobility, and the impact of various shocks and policies. Many methods have been developed that utilize machine learning and other statistical tools to link individuals in a probabilistic way across US census records (Abramitzky et al. Reference Abramitzky, Mill and Pérez2020; Bailey et al. Reference Bailey, Cole, Henderson and Massey2017; Helgertz et al. Reference Helgertz, Price, Wellington, Thompson, Ruggles and Fitch2022). One impediment to achieving higher link rates is the quality of the underlying data. Another issue is the fact that many people were missed by the census, and others show up in the census more than once (Anderson and Fienberg Reference Anderson and Fienberg1999; Hacker Reference Hacker2013; Steckel Reference Steckel1991)
In this article, we examine an issue that is a combination of poor data quality and over-enumeration: the fabrication of individuals in the census. Several things could motivate an enumerator to fabricate data. First, there is a potential monetary incentive, since about 88 percent of the 1920 Census enumerators were compensated based on the number of people they enumerated. Since it takes less time to falsify a census record than to obtain it correctly, this could motivate enumerators to create fake people and earn more money. Second, the 1920 Census occurred in January, which potentially exposed many enumerators to inclement weather. Third, ethnic or racial discrimination might have motivated a census enumerator to fabricate data if there were specific groups with which they did not want to directly interact. Counteracting these potential factors were specific punishments for fabrication outlined in the instructions to the enumerators, and most enumerators felt a moral duty to be honest in the work they performed.
We started by documenting a case study for the 1920 US census in Homestead, Pennsylvania, which contains a set of census sheets that were clearly fabricated by the enumerator, Henry Silverstein. By attempting to match individuals recorded by Silverstein to other records, we have found 78 fabricated households comprising 439 individuals. Many of these individuals appear on the last 9 of the 21 pages Silverstein submitted. We further determined that 32 of these 78 fabricated households were listed at addresses that never existed. We can confidently identify the occupants of one-third of the real addresses in January 1920, corroborating that the names in the census were faked. Other patterns in the data, such as demographic differences between the fake and real residents, confirm that 40 percent of the enumeration Silverstein submitted was knowingly and intentionally fabricated.
We use the insights from this case study to test if there are any other towns for which it seems the enumerator fabricated census records. For each sheet in the 1920 census, we use the Census Tree, a longitudinally-linked panel of census data, to calculate the fraction of people on the sheet that are linked to another census between 1880 and 1940 (Price et al. Reference Price, Buckles, Leeuwen and Riley2021). While the average match rate across all sheets is 51 percent, we find that there are 16,636 census sheets that have a match rate below 10 percent (0.7 percent of all sheets in the 1920 census). We develop an empirical model that both identifies the features that are most relevant in predicting the match rate for a census sheet and generates a predicted match rate. We use this predicted match rate to flag census sheets that have a much lower match rate than we would expect given the characteristics of the people on the sheet. While a poor match rate alone is not enough to show as evidence of fabrication, we believe that identifying sheets with a lower match rate than expected allows us to consider the sheets that are most likely to have been falsified.
We manually check each of the 394 sheets that have unexpectedly low match rates. Search tools on FamilySearch.org and Ancestry.com are employed in this process to look for the same individuals in other records. Our criterion for a falsified census sheet is one in which we are unable to find any of the people on the sheet in other census records (which is what occurred in our case study). Based on our hand-check, we estimate that 90 of these census sheets appear to be fully fabricated, along with four sheets that are mostly fabricated. These cover 67 enumeration districts and include 4,375 fake people. The enumeration districts that include fake people have about the same immigrant share as the general population (11.2 percent vs 11.6 percent) but have much higher rates of non-White individuals (14.0 percent vs 10.6 percent). However, within the enumeration districts with fake people, the actual sheets that include fake people have a lower rate of immigrants (7.7 percent vs 11.2 percent) and a lower rate of non-White individuals (6.9 percent vs 14.0 percent).
Background
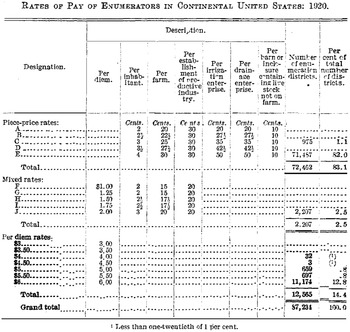
The 1920 Census began on January 2. A detailed booklet of instructions and an assigned district were given to each census enumerator. They were tasked with visiting every household in their district to gather information about its residents. They were also given clarifications for how to fill out each of the 29 columns on the census sheet (Fourteenth Census of the United States, January 1, 1920: Instructions to Enumerators 1919). Payment was made based on the classification of the district to which they were assigned, as well as the type of residence they gathered information on. There were five classifications that based pay purely on the number of people enumerated, ranging from 2 to 4 cents per person in a nonfarm residence. There were also five mixed-rate classifications where the enumerator was paid per person in addition to per diem. This ranged from a 1 dollar per diem and 2 cents per person to 2 dollars per diem and 3 cents per person for a normal nonfarm residence. Finally, there were seven classifications that provided only a per diem, ranging from 3 to 6 dollars (see Figure 1). Out of the 87,234 enumeration districts, 74,659 provided pay based, at least in part, on the number of people enumerated (Annual Report of the Director of the Census to the Secretary of Commerce for the Fiscal Year ended June 30, 1920 1920, 16).
Enumeration pay rate table.
Notes: This table shows how much a census enumerator would be compensated for their work. Their enumeration districts were given a specific designation, and they were paid accordingly. One group of designations resulted in pay entirely based on the number of people enumerated, one was entirely per diem, and one was a mixed rate: partly per diem and partly per person. The right columns show how many districts fall into each category.
Source: Annual Report of the Director of the Census to the Secretary of Commerce for the Fiscal Year Ended June 30, 1920. 1920. https://search.proquest.com/docview/57950003.

The payment of these funds was dependent on whether the enumerator worked enough per day and if the enumerator canvased their district in time. For most places, the enumerator had one month from the start of the census day to complete the task. For cities of more than 2,500, however, the enumeration was required to be completed within two weeks. To keep track of how much each enumerator was doing, they were also given a set of daily report cards to fill out. This ultimately determined how much compensation was received at the end of the census period.
There were several checks put into place to avoid misreporting or false information. First, each enumerator took an oath of office, making an honor system the foremost safeguard. Enumerators were told not to accept any information that they think is false. They were also told strictly not to miss any farm or residence in their district, as well as not to report any fictitious information. The maximum fine for this type of behavior was $2,000 and five years in prison (Fourteenth Census of the United States, January 1, 1920: Instructions to Enumerators 1919).
Despite these regulations designed to minimize error, both over-enumeration and under-enumeration occur in every census. This has been shown by demographic analysis based on records other than the Decennial census (Hacker Reference Hacker2013). These miscounts by the census are not distributed evenly across different groups. However, according to these modern demographic studies, females and Black residents were much more likely to be undercounted, as well as the very old and very young (Anderson and Fienberg Reference Anderson and Fienberg1999; Hacker Reference Hacker2013). For example, when the number of draft-age men from the 1940 census was compared to the Selective service registration from that same year, it found an undercount of 2.81 percent for white males versus an undercount of 12 percent for Black males. (Anderson and Fienberg Reference Anderson and Fienberg1999). Although under-enumeration has been shown to be a much larger problem, over-enumeration occurred as well. It is usually defined as an enumerator counting a family or household more than once (Steckel Reference Steckel1991). We show through our case study that over-enumeration also includes people who were fabricated.
Data
The 1920 US census includes individual-level data for over 107 million people. Among the information provided is name, age, race, place of birth, sex, immigration date, and occupation. The original data were recorded on sheets that included up to 50 people, grouped by household. Altogether, there were 2,278,823 census sheets completed by enumerators across 87,234 enumeration districts. The average enumeration district had just over 26 census sheets.
Using the individual-level data from the 1920 census, we construct a set of sheet-level characteristics that serve as controls in our analysis. These controls include the gender, age, and racial mix of the sheet. We also included, as a control, the number of people on each sheet that were not a part of a nuclear family, specifically the number of boarders or lodgers. In addition, we control for average house size on the sheet, the average occupational score of working adults on the sheet, and the number of prisoners or clergy (both of which are surprisingly hard to link across census records).
The key measure that we used to detect fabricated people is the sheet-level match rates. Our match rates for each sheet are constructed using the census-to-census links from the Census Tree as described in Buckles et al. (Reference Buckles, Haws, Price and Wilbert2025). The Census Tree combines two types of approaches to link individuals across censuses. The first are rule-based methods developed by Abramitzky et al. (Reference Abramitzky, Boustan and Eriksson2014) and others, which match people across censuses using rules to determine a match (i.e., having the same first name, last name, birth place, and birth year). The second is a machine learning approach that relies on training data constructed from censuses linked to profiles for individuals on a large genealogy website, FamilySearch. This training data is particularly useful because it relies on links created through personal genealogy by individuals who likely have private information that is unavailable to researchers. Because of this, the Census Tree can match a larger fraction of individuals across censuses than other methods. These links allow us to see how frequently the people on each 1920 Census sheet appear on other census records between 1880 and 1940. We adjust our match rates for children and immigrants who would not be expected to appear in the census for the years 1880 to 1910. Since fabricated people should be unlinkable to other census records, we can use the sheet-level match rates to identify cases where the enumerator fabricated entire sheets of people (as was the case in Homestead, Pennsylvania).
Method and results
We start our analysis with a case study that provided the original motivation for this article. The case study involves the 3rd Ward of Enumeration District 144 in Homestead, Pennsylvania, in the 1920 census. We document this as an obvious case of individuals being fabricated by a specific enumerator. We provide evidence, drawing on multiple records, which suggests that roughly 439 individuals clustered on nine distinct census sheets were fabricated in this enumeration district. We are then able to apply the findings from this enumeration district to detect similar instances of census-record fabrication across the entire country using an automated approach.
Homestead case study
Homestead, Pennsylvania, is a mill town outside of Pittsburgh. In 1920, it was a thoroughly blue-collar town: for Enumeration District 144, the town’s 1918 directory records that 71 percent of its employed people had jobs likely tied to one of the town’s two industrial establishments. It was also an immigrant town; in 1920, at least a third of the district’s households were headed by immigrants. Of the American-born heads of household, 10–20 percent were Black.Footnote 1
We detected the fabricated records within Enumeration District 144 as part of a manual review of multiple Homestead censuses to identify Jewish residents of the town (Hepps Reference Hepps2022). Within this district, we selected 10 households with Jewish-sounding surnames or Yiddish language for further research, but could only link one of the households to other records. The other nine households were entirely untraceable without a single additional record that could be located for any of these 50 individuals. This extreme ratio of traceable versus untraceable individuals was not replicated in any of the other enumeration districts included in the manual review, which led us to suspect fabrication on the part of the enumerator, Henry Silverstein. Reconstructing the exact details of Silverstein’s enumeration revealed the long-buried fraud of a singular figure.
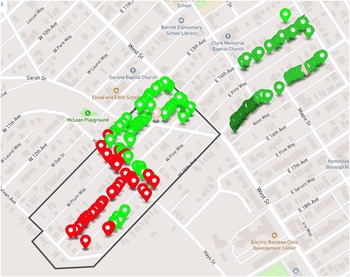
First, we had to confirm that there was, indeed, fabrication within Enumeration District 144. To do so, we used a semi-automated procedure to compare all 194 heads of household in this enumeration district, including the 10 households originally selected, with the individuals listed in the 1918 and 1921 Homestead directories that bookend this census. In the cases where there was no directory match, we did manual research to determine if the person matched any other records. There was a clear pattern in the matched data. Before line 86 on sheet 6B, 95 percent of households (n=119) could be matched to other records. After line 85, 0 percent could be matched (n=74). (We excluded the last household in this enumeration district, which was added months later by a census office supervisor.) Overall, we detected 78 fabricated households containing 439 fabricated people, confirming our suspicions. We then wondered if a deeper analysis of the enumeration data could point to the reasons for this fraud. Indeed, mapping the households enumerated in the Enumeration District revealed clear patterns in the fabrication. The color of the pin in the map in Figure 2 indicates the success (green) or failure (red) of matching the census household to another record. The red pins on the left of the map are households that the record matching analysis showed to be entirely fabricated. (The two light red pins may be false negatives, since although record matching failed, they appear in sections where Silverstein was otherwise doing legitimate work.) As the map shows, the fake households are largely clustered together, suggesting that the problematic households were part of a concerted effort.
Mapped households in Enumeration District 144.
Notes: This map depicts the households in Silverstein’s enumeration. The medium and darkest green pins on the right represent households matched to other records; the lightest green pins on the left represent households without record matching. (Silverstein was not the only confused enumerator in Homestead: a medium green pin indicates that the household was duplicated in one other enumeration district, and a dark green pin indicates duplication in two other enumeration districts.) The light red indicates unmatched households where there is not enough information to be sure that the household was fabricated, leaving the darker red pins as the definite fakes. The black line shows the boundary of Enumeration District 144, Silverstein’s assigned area. All of the pins outside of the boundary are the households he was not supposed to canvas. Thirty-two of Silverstein’s fabricated households are listed with addresses that never existed. These households, therefore, cannot appear on this map.

Furthermore, the map reveals three other concerns about the data. To begin, the first 52 households (26.8 percent) that Silverstein enumerated lay outside the borders of his assigned enumeration district (border indicated in black on the left side of the map). Thus, all but one were duplicated in other enumeration districts. These duplicate census entries made it possible to boost the 90 percent city directory-only match rate of these 52 households to 98 percent. However, the other enumeration districts include additional households that Silverstein missed within the sections he mistakenly canvased. It appears that he missed 18.8 percent of the households, even when he was doing honest work. While these enumeration-district-to-enumeration-district comparisons confirm that Silverstein’s initial work was largely accurate, they reveal it was also incomplete.
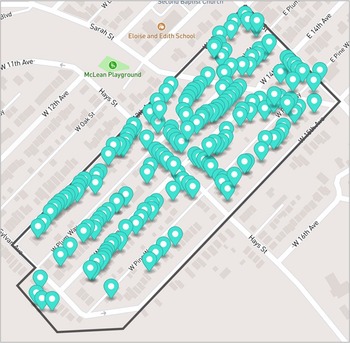
This incompleteness becomes much more pronounced within the borders of the area where Silverstein was actually assigned to enumerate. Comparing Silverstein’s work to the 1918 and 1921 city directories, as well as the overlapping enumerations, shows that he often missed households when multiple households shared the same address. More significantly, as the map indicates, he omitted entire blocks. His enumeration recorded 111 unique addresses within the designated boundaries of Enumeration District 144, but this count is much less than the 182 unique addresses in the 1918 directory (61 percent), as shown in Figure 3, and the 203 unique addresses in the 1921 directory (55 percent).Footnote 2 These omissions appear in the same part of the town as the fake households, adding to the portrait of an enumerator failing at his work.
Mapped households in the 1918 homestead directory.
Note: A side-by-side comparison of this map of all the households in the 1918 Homestead city directory with Silverstein’s enumeration of the same blocks (in Figure 2) shows just how many households he skipped entirely and did not even attempt to represent with fabricated data.

The fact that some data were fabricated becomes even clearer when compared with sources that more accurately document the actual residents of enumeration district 144 in 1920. Among one-third of the real addresses with fake people (n=33), the city directories list the same residents in 1918 and 1921. This continuity between the directories gives a high degree of confidence that we know the actual people who lived in those homes in 1920. Similarly, the city directories and other Homestead records confirm that there were only two Jewish families in Enumeration District 144 in 1920 (one Silverstein enumerated and the other one he skipped). However, of the 10 possibly-Jewish households Silverstein recorded (one real and nine fake), seven are coded as Jewish because they were listed with Yiddish language origins, leading to a 250–400 percent increase in this demographic in the fake data. By comparison, in the 1910 census, this area had no Jewish residents, and there were never more than three Jewish households here. Silverstein was the child of Russian Jewish immigrants; perhaps when devising fake people, he favored identities familiar to him from his own cultural context. The surest and most shocking evidence that Silverstein recorded fake census entries is that he placed some of his fabricated households at fabricated addresses. We identified such addresses by comparing them as they appeared in the census to the 1918 and 1921 Homestead city directories, the 1913 and 1926 Sanborn maps of the neighborhood, and the present-day map of the neighborhood. While all the street names he recorded were real, he fabricated address numbers within real blocks (e.g., he added numbers at the beginning and end of the 300 block of West Fourteenth Avenue) and created entire blocks that never existed (e.g., there was never a 200 block of West Fifteenth Avenue). Among the fabricated households in the enumeration, 43 percent (n=74) of the addresses were also fabricated. As before, these fabricated addresses appear in the same section as all the fake and skipped households. This finding suggests that not only did Silverstein not speak to the inhabitants of these households, but also that he likely did not even traverse most of his district. We turned two additional sets of records to determine why Silverstein might have shirked his responsibilities so blatantly. First, newspaper articles revealing the historical context surrounding Enumeration District 144 at the time of the 1920 Census gave some insight into the challenges Silverstein faced. The weather in Homestead throughout the enumeration period was freezing, even close to zero on some days. On the day Silverstein enumerated his last real household, the weather prediction was for freezing rain and snow. Moreover, January 1920 was the tail end of the Great Steel Strike, in which immigrant steelworkers were tarred as foreign Bolshevik agents. Further, this was a peak period for “red raids” that swept up thousands of purported Communists. Enumeration District 144 was an immigrant district of steelworkers in a mill town that had brutally suppressed the strikers. They likely had a great distrust of government agents knocking on their doors during that fraught period.
We were also able to consult the map that the Census Bureau gave Silverstein. We discovered that it was oriented upside-down from Homestead’s actual geography and did not indicate its own misorientation. We were able to trace the exact path that Silverstein followed by matching the order on his census sheets with the exact locations of each home on a map. At the outset of his enumeration, Silverstein turned left to go west, but instead headed east, recording households located to the east of his actual district. Perhaps, he never overcame the frustration of days wasted mistakenly enumerating the wrong households.Footnote 3
Combining the historical circumstances that made Homestead residents reluctant to speak to Silverstein, the weather that made it painful for Silverstein to continue his work, and the upside-down map that led to Silverstein’s enumerating the wrong households for days, we can reconstruct the narrative of this rogue enumerator. On his first two days of work, Friday, January 2, and Saturday, January 3, Silverstein did reasonable work. It seems likely that the end of his second day was when he learned that he had been working in the wrong part of town. When he resumed on Monday, January 5, he relocated to the right part of town, still doing reasonable work. But on Wednesday, January 7, with a new round of red raids close to Homestead and yet more freezing weather, he began to intersperse fake households amongst real ones. On Thursday, January 8, the temperature was dropping further, and freezing rain and snow were predicted. From that day on, the household Silverstein records were fake in all the ways described above. He dated his fake pages as though he worked until January 13. To someone familiar with such enumerations, the number of pages seems appropriate to the size of the district, but the pages from outside his district, of course, compensate for all the areas for which he did not even bother to fake data. Silverstein’s extraordinarily convincing fraud lay undetected for nearly a century.
While it is atypical for researchers to learn anything at all about the circumstances of an individual enumeration, Silverstein’s fraud was unusual. In the next section, we answer the question of how common this type of fraud was among census enumerators. Our procedure to detect the fabrication in the case study is not readily replicable to other enumeration districts since it depended on the existence of closely proximate city directories to minimize the amount of manual research required. Instead, we develop a generalizable and replicable methodology for detecting fabrication in any enumeration district in the 1920 Census to determine the rarity of Silverstein’s fraud.
The focus in this article is on fraud committed by individual enumerators. The most notable example of more widespread enumeration fraud occurred in 1910 in Tacoma, Washington, when the census was found to have “over 30,000 false of fictional entries in the census schedules” (Bouk Reference Bouk2020). A major focus, prior to the 1920 census, was to put in place changes to prevent that type of fraud from happening again. Some of the changes included requiring the information on place of abode to be included in the census sheet and ensuring that the relationship field was kept. There was also a shift in the resources allocated to the census enumeration so they could hire and retain better workers (Bouk Reference Bouk2020).
National-level estimates of fabricated people
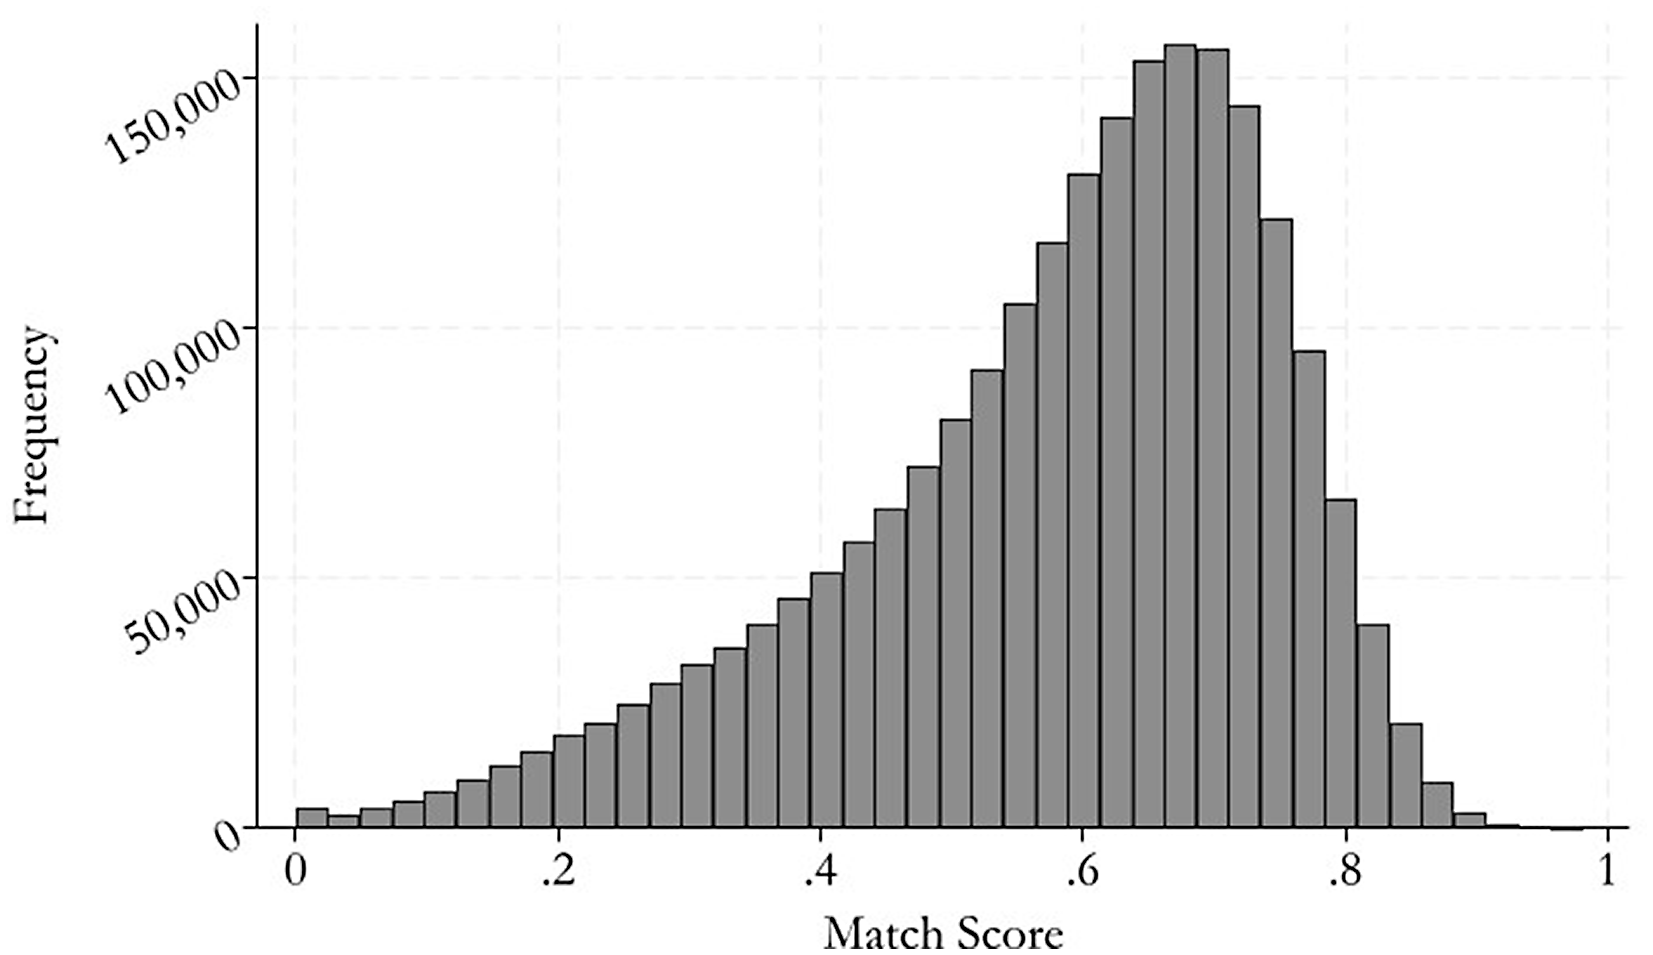
To investigate other possibly fabricated census records across the United States, we used an ordinary least squares regression to predict match scores of each sheet in the 1920 census. We used features such as the characteristics of the people located on the sheet and weather data to recover our predictions. Match score, the measure of how connected a sheet is to other years, was constructed by first matching each person on a sheet to five other census years (1880, 1900, 1910, 1930, and 1940) using the Census Tree (Buckles et al. Reference Buckles, Haws, Price and Wilbert2025). We use this to construct a ratio of the number of census years an individual actually appears in and the number of census years in which we would expect them to appear. The expected number of census years is determined by immigration status and birth year for the census years before 1920, and it is assumed that people in the 1920 Census should appear in the 1930 and 1940 census years, since death information is not available. This ratio is then averaged across a census sheet to give the match score of that census sheet. Figure 4 illustrates the distribution of these match scores. There are more than 16,000 sheets that have a lower match score than 10 percent, which is where we would expect sheets with fabricated people to be located, since the people on these sheets are relatively disconnected from other census years.
1920 sheet match scores.
Notes: This figure shows the number of 1920 Census sheets that fall at each level of match score. Match score is a measure of how well connected the people listed on a 1920 Census sheet are to other census years. For example, a sheet with a match score of 0.6 has people who, on average, appear in 60 percent of the census years that they are expected to be in.

We then created a set of features for each census sheet. These features include the percentage of people on each sheet that are female, Black, Hispanic, children, nonnuclear family residents, immigrants, or lodgers or boarders. We also include the average house size, the percentage of people employed, and the average occupational score for those employed. These demographic features are the strongest factors that could potentially influence match rates when linking the census records. Immigrants are harder to link because they often change their names or other aspects of their identity (Gráda et al. Reference Gráda, Anbinder, Connor and Wegge2023). Black individuals can be difficult to link as they have more variation across census years in their birth information (Buckles et al. Reference Buckles, Haws, Price and Wilbertforthcoming). People who are part of a nuclear family or a larger household are relatively easy to link, especially when using the household links from the Multigenerational Longitudinal Panel (MLP) (Helgertz et al. Reference Helgertz, Price, Wellington, Thompson, Ruggles and Fitch2022). Finally, there is some general concern in the data linkage literature that there is a negative correlation between link rates and socioeconomic status (Bohensky et al. Reference Bohensky, Jolley and Sundararajan2010; Randall et al. Reference Randall, Ferrante, Boyd and Brown2018).
In addition to features based on insights from previous linking efforts, we also include some additional controls after an initial examination of sheets that had very low match rates. We discovered that many of the sheets with such match rates were camps or locations with many nuns, soldiers, lumbermen, or miners. As a result, we included additional controls for the percentage of inmates, clergy members, servicemen, and lumber workers on each sheet, and an indicator, for the sheet, if a sheet was entirely one of those occupations. We also included a variable defined as the largest percentage of people on the sheet who had the same occupation. Together, these situations provide a reasonable explanation for the low match rates and were thus included as additional controls so that our model can better flag those census sheets with actual fake people. This approach of closely examining the groups or settings where our automated linking methods achieve low match rates provides an important opportunity for us to better understand and improve our census linking models. Specifically, we can increase the representation of groups that have been previously overlooked by other linking methods.
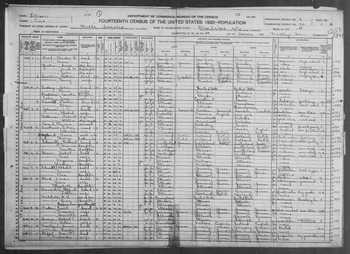
Finally, we include information on the number of poor weather days that the enumerators experienced in January 1920. We construct this measure using 1920 weather data gathered from the Applied Climate Information System and aggregate it at the county level by averaging information from all weather stations in a county. We consider a poor weather day to be one in which the average recorded maximum temperature was below 25 degrees Fahrenheit, the average snow depth was greater than 14 inches, or the average snowfall that day was greater than 4 inches. The enumerators of the 1920 Census do have a place to record the day they began filling out a manuscript (see Figure 6), but for simplicity, we do not use this information to match census manuscripts to the exact weather, but rather sum up all “poor weather days” during the month of January. The case study of Silverstein led us to believe that weather may have played a role in his decision to create fake people, motivating the inclusion of this variable. As mentioned earlier, the weather in Homestead, Pennsylvania, during the enumeration period was freezing and close to zero most days, and the weather prediction for the day that Silverstein stopped enumerating real households included freezing rain and snow.
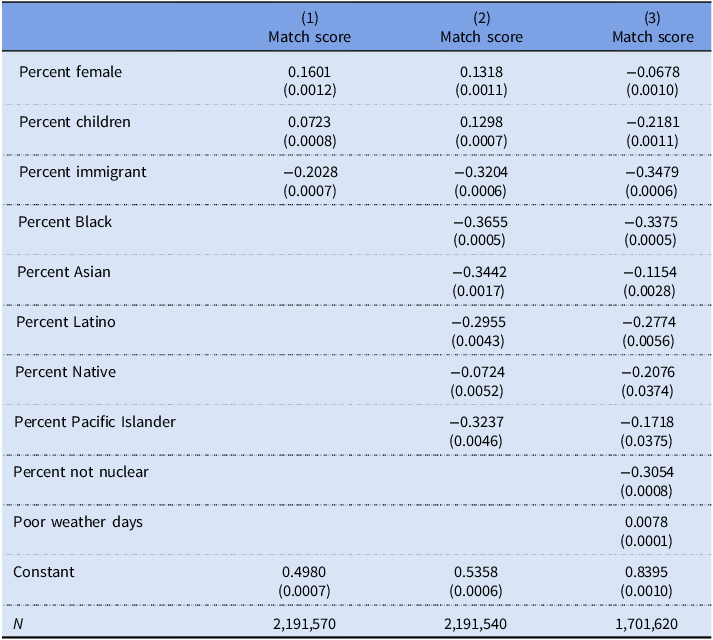
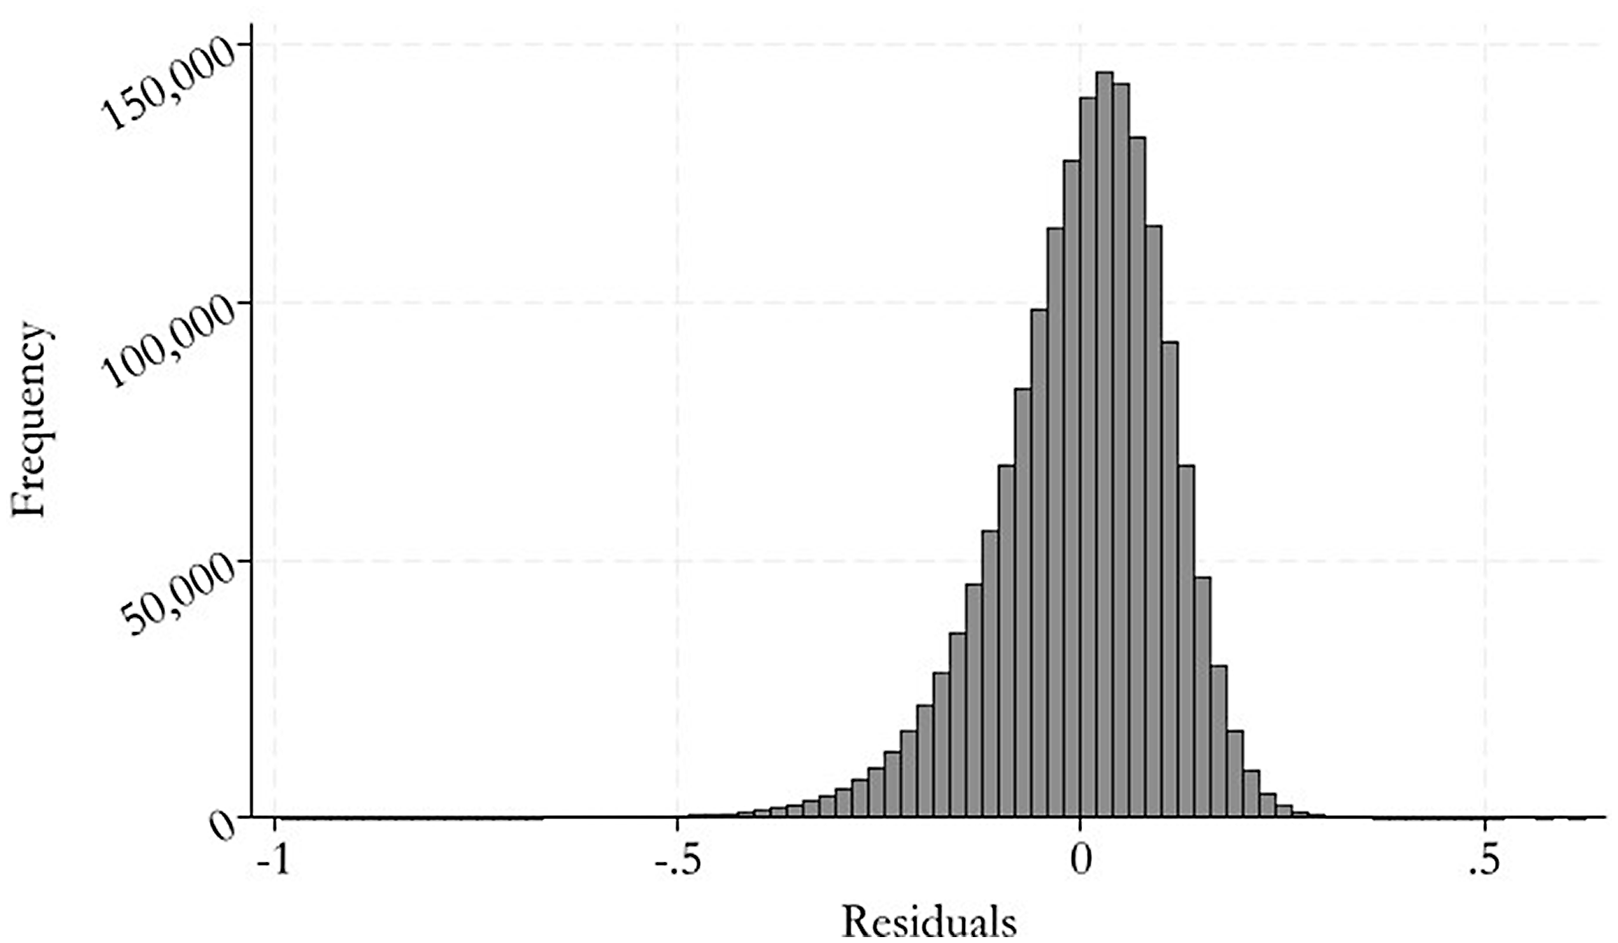
The coefficients from this model are presented in Table 1. The unit of observation in this table is the census sheet, and the dependent variable is the match score of the sheet. Of the included features, the percentage of immigrants, the percentage of Black people, and the percentage of people that are not in a nuclear family (Head, Spouse, Son, or Daughter) are most predictive of the sheet match score. Using the coefficients on these variables, we then predicted the match score and obtained the residual for every sheet in the census. Figure 5 shows the distribution of these residuals.
Factors used to predict census sheet match scores

Notes: This table contains the results of three regressions, with the third regression being the one used for the hand-check. The outcome is match score, which is a measure of how well people listed a 1920 Census sheet are connected to other census years. The regressors are also on the 1920 sheet level. For example, percent employed is the percentage of people on a 1920 Census sheet that are employed. For conciseness, predictors of match score concerning specific occupations and occupation score are omitted. Standard errors are reported in parentheses.
Predicted Match Score Residuals.
Notes: This figure shows the distribution of Predicted Match Score Residuals. These are found by taking the difference between the true Match Score for a 1920 census sheet and its predicted Match Score. Predicted Match Score is found by using the coefficients of a regression of Match Score on various predictors. A residual close to 0 means that a sheet had similar true and predicted Match Scores.

1920 Census Manuscript Example.
Notes: This figure shows an example of the 1920 Decennial Census of Population and Housing.
Source: United States Census Bureau

As is expected, most census sheets have residuals close to zero. More than 73 percent of sheets have predicted match scores that are within 20 percentage points of the true match score. Sheets that have fabricated people would most likely have very negative residuals since they have much lower match scores than we would expect, given the characteristics of the people recorded. To narrow down the search, we use Silverstein’s sheets as a benchmark for the match score residual. The nine sheets that Silverstein fabricated have match scores that are between 49 and 64 percentage points lower than we would expect. We use –0.49 as our cutoff rule, resulting in 394 census sheets with a match score at least 49 percentage points lower than what we would expect.
A hand-check is then performed on these sheets to see if they contain fabricated people. We take each person from the census sheet and look for other records that match the information for the individual using search tools on FamilySearch.org and Ancestry.com. We performed this hand-check for 18,270 people on these 394 census sheets. Since we used a residual cutoff of –0.49, we hand checked sheets for which we would have expected to be able to link the individuals, on average, to half of the years they should appear in. From this set, we find 90 sheets that seem to be entirely fabricated and another four sheets that mostly comprise fabricated people. This is in addition to the sheets fabricated by Silverstein. Comparing Enumeration District 144’s 9 fully- and 1 partially-fabricated sheets in his district to the other 94 fabricated sheets from 67 districts (averaging 1.3 sheets per district) highlights just how audacious was the sheer scale of Silverstein’s fraud.
The 90 census sheets that include fake people allow us to look at some of the demographic characteristics for enumeration districts with fake people. We focus on the fraction of the enumeration district that are immigrants (using immigration year information in the census) and the fraction of the enumeration district that are non-White (using the race information in the census). In the 1920 US Census, individuals were classified into one of six racial categories: White, Black/African American, American Indian or Alaska Native, Chinese, Japanese, and Other Asian or Pacific Islander. For the purposes of our analysis, we group individuals into two broad categories: “White” and “Non-White.” These categories reflect the racial classifications used by the Census at the time, which may not align with contemporary understandings of race. We find that the enumeration districts that included at least one sheet with fake people had the same immigrant share as the national average (11.2 percent vs 11.6 percent) but had a much higher rate of non-White individuals (14.0 percent vs 10.6 percent). These statistics use all sheets in enumeration districts that had at least one sheet with fake people, but were calculated excluding the actual sheets with fake people. Within the enumeration districts with fake people, the sheets that themselves include fake people have a lower rate of immigrants (7.7 percent vs 11.2 percent) and a lower rate of non-White individuals (6.9 percent vs 14.0 percent).
Reflecting Homestead’s known demographics, Silverstein’s non-fraudulent sheets within the actual bounds of Enumeration District 144 demonstrate a higher immigrant share than average (20 percent vs. 11.6 percent), as well as a higher-than-average rate of non-White individuals (16 percent vs 10.6 percent). As expected, his fraudulent sheets do match the pattern in decreasing the proportion of immigrants (to 14 percent) and Black people (to 9 percent). However, balancing the enumerator’s tendency to favor faking American-born households with an awareness that Homestead was a town of immigrants, Silverstein’s fake American-born heads of households are significantly more often the children of immigrants than was the case in his real sheets (47 percent vs 11 percent). In a way, this discrepancy highlights Silverstein’s determination to make his fake families appear appropriate to Homestead.
While our article was motivated by a case study that involved the obvious falsification of many census records with a particular district, our national-level results indicate that this type of behavior was quite rare (about 0.005 percent of the national population in 1920). It is worth noting that our sheet-level approach is likely to be an undercount since it will miss any minor forms of falsification where a single household or individual is fabricated. We identify fabricated households based on a record-linking method similar to early approaches to identifying under-enumeration in the census by linking together multiple records (Adams and Kasakoff Reference Adams and Kasakoff1991; DeBats Reference Debats1991; Knights Reference Knights1991 and Furstenberg et al. Reference Furstenberg, Strong and Crawford1979). In these previous studies, the failure to link a census record to other records was an indication that they were not enumerated in the other record collection. In our study, a failure to link suggests that the record may be fabricated entirely. However, our two-step process of double-checking the sheet with low matches helps us avoid false positives.
It is also important to note that our approach hinges on the premise that we should not be able to link fake individuals to other records. This depends on the precision of our record linking. Lack of precision, in our case, would create a problem as we would fail to detect falsified families and would instead incorrectly link them to real families. Furthermore, there has been considerable debate about whether various linking methods are creating false links. We think this is unlikely in our setting since we are using links from the Census Tree that have been shown to have high levels of precision. In addition, since we use the match score for the entire sheet, we would have to falsely match a lot of people on the sheet for it to escape detection by our filter.
One weakness of our approach related to avoiding false positives is that we had to hand-check the links for individuals on sheets with low match scores. This concern will likely subside in the future as linking methods will improve, leading to fewer false positives to be reviewed. In our case, most of the sheets that had low match rates turned out to include individuals that are hard to link using automated methods but can be linked by hand using the search tools provided by genealogical websites and other family history skills. As machine learning algorithms incorporate more of the features and techniques used by family history researchers, it will become easier to detect various errors in census records, including under-enumeration, misspellings, transcription errors, and even fake people.
Conclusion
There are about 217 million unique individuals who appear in at least one census record between 1850 and 1940 (Price et al. Reference Price, Buckles, Leeuwen and Riley2021). It is likely that a combination of machine learning methods and human hand checking will eventually help link nearly all these people across each of the census records that occurred during their lifetime. Data quality and enumeration issues are major impediments to these efforts, though they are likely to be surmountable with improved methods to clean data, link records, and identify duplicate individuals in the census. However, fabricated individuals cannot be fixed by any of these traditional methods.
The motivation for this article stemmed from an egregious case of fraud that occurred in the 1920 Census in Homestead, Pennsylvania. While it has long been understood that individuals will lie when responding to surveys, our case study of Henry Silverstein highlights that sometimes the person administering the survey also lies. However, in our article, we argue that widespread fraud in a historical census is likely to be very limited. Based on our sheet-level approach to detecting the creation of fake people, we estimate that only 0.005 percent of the individuals in the 1920 Census were part of a census sheet where everyone was fabricated. While this estimate is certain to be an undercount since it misses cases where individuals or households (rather than entire census sheets) were fabricated, it does indicate that the vast majority of enumerators faithfully carried out the instructions of the Census Bureau. While they might have missed people (Hacker Reference Hacker2013) or had handwriting that was difficult to transcribe (Arkadev et al. Reference Arkadev, Hwang and Squires2023), they did not fabricate entire census sheets.
Approaches like the one detailed in this study can be used to detect fraud in modern data collection efforts. Advances in record linking and broad access to public records make it possible to link people across multiple records (Gross and Mueller-Smith Reference Gross2020), and the method used in this article can be adapted to probabilistically detect fabrication in real time as survey or other data is gathered. This could be particularly useful in cases in which workers are paid based on the number of surveys they have people complete or other forms of information they gather. These present a principal-agent problem in which the worker or firm hired to do survey research may find it expensive to get real responses and much cheaper to generate fake responses. Record linking provides a powerful tool to detect fraud in these situations.
Competing interests
The authors declare none.

 Open access

