


1. Introduction
Stalagmite δ18O has been one of the most important proxies to track climate evolution during the late Quaternary in recent decades (e.g., Cheng et al. Reference Cheng, Edwards, Sinha, Spötl, Yi, Chen, Kelly, Kathayat, Wang, Li, Kong, Wang, Ning and Zhang2016, Reference Cheng, Zhang, Zhao, Li, Ning and Kathayat2019). However, the interpretation of stalagmite δ18O records from regions impacted by the Asian summer monsoon remains controversial. Wang et al. (Reference Wang, Cheng, Edwards, An, Wu, Shen and Dorale2001) suggested that the evolution of δ18O records in the east China stalagmite is driven predominantly by ratios of the summer and winter precipitation. Alternatively, Yuan et al. (Reference Yuan, Cheng, Edwards, Dykoski, Kelly, Zhang, Qing, Lin, Wang, Wu, Dorale, An and Cai2004) argued that variations in stalagmite δ18O in the Dongge Cave were controlled mostly by the fraction of water vapour between the moisture sources and cave sites. Other views also suggested the contribution of various degrees of different moisture sources from the Indian and Pacific Oceans on the δ18O signature (Maher & Thompson, Reference Maher and Thompson2012; Baker et al. Reference Baker, Sodemann, Baldini, Breitenbach, Johnson, Hunen and Zhang2015). Some studies noted that reconciling those factors may better explain the δ18O of precipitation and stalagmites (Liu et al. Reference Liu, Wen, Brady, Otto-Bliesner, Yu, Lu, Cheng, Wang, Zheng, Ding, Edwards, Cheng, Liu and Yang2014).
Pausata et al. (Reference Pausata, Battisti, Nisancioglu and Bitz2011) suggested that Chinese stalagmite δ18O was controlled by fluctuations in the Indian Summer Monsoon (ISM) intensity using climate model simulations for Heinrich stadial 1. They indicated that decreased intensity of the ISM results in enriched stalagmite δ18O in eastern China during Heinrich stadial 1. Several geological archives have also recorded the contribution of the Indian Ocean to the δ18OP (δ18O of precipitation) in eastern China (Yang et al. Reference Yang, Liu, Liang, Yuan, Yang, Lu and Chen2014; Chen et al. Reference Chen, Chen, Chen, Zhou, Wu, Tang, Zhang, Huang and Yu2015; Liu et al. Reference Liu, Chen, Zhang, Li, Rao and Chen2015). However, this viewpoint was challenged by other geological records (Tan, Reference Tan2009; Tan, Reference Tan2013; Li et al. Reference Li, Tan, Cai, Jiang, Ma, Cheng, Edwards, Zhang, Gao and An2019; Liang et al. Reference Liang, Zhao, Edwards, Wang, Shao, Zhang, Zhao, Wang, Cheng and Kong2020). For example, Tan et al. argued that moisture sources of the monsoon regions of China including both the Indian Ocean and the Pacific Ocean, with depleted and enriched δ18O signal in precipitation (Tan, Reference Tan2009, Reference Tan2013). They found that the δ18O signal in stalagmite reflects the intensity contrast between two summer monsoons, the ISM and the East Asian Summer Monsoon (EASM), which is further dependent on the variation of the Western Pacific Subtropical High (WPSH). Li et al. (Reference Li, Tan, Cai, Jiang, Ma, Cheng, Edwards, Zhang, Gao and An2019) subtracted the typical δ18O signal of the ISM from a stalagmite record of eastern China during the Heinrich stadial 1 to isolate the Pacific’s δ18O signal. The latter signal shows a clear negative correlation with the Sea Surface Temperature (SST) of the Western Pacific Warm Pool.
Moreover, the position of the westerly jet in summer is also important in affecting stalagmite δ18O records in China. The shifts of the westerly jet change the geographic position and δ18OP of the monsoon rainband (Sampe & Xie, Reference Sampe and Xie2010; Baker et al. Reference Baker, Sodemann, Baldini, Breitenbach, Johnson, Hunen and Zhang2015; Chiang et al. Reference Chiang, Fung, Wu, Cai, Edman, Liu, Day, Bhattacharya, Mondal and Labrousse2015, Reference Chiang, Swenson and Kong2017, Reference Chiang, Herman, Yoshimura and Fung2020). The rapid millennial-scale climatic changes during the last glacial occurred in the high-latitude Northern Hemisphere and transduced to East Asia, which is realized through the northern westerlies (e.g., Porter & An, Reference Porter and An1995; Guo et al. Reference Guo, Liu, Guiot, Wu, Lü and Han1996; Nagashima et al. Reference Nagashima, Tada, Tani, Sun, Isozaki, Toyoda and Hasegawa2011; Sun et al. Reference Sun, Clemens, Morrill, Lin, Wang and An2012).
We suggest that systematic comparisons of the stalagmite δ18O records at different spatial-temporal scales can help to resolve these disputes. The last glacial is the most recent period when global climate changed dramatically, with expanding ice sheet, lowering sea levels, exposing shelves (Siddall et al. Reference Siddall, Rohling, Almogl-Labin, Hemleben, Meischner, Schmelzer and Smeed2003, Reference Siddall, Rohling, Thompson and Waelbroeck2008), dropping in SST (Kucera et al. Reference Kucera, Weinelt, Kiefer, Pflaumann, Hayes, Weinelt, Chen, Mix, Borrows, Cortijo, Duprat, Juggins and Waelbroeck2005) and reorganizing in atmospheric–oceanic circulation (Bohm et al. Reference Bohm, Lippold, Gutjahr, Frank, Blaser, Antz, Fohlmeister, Frank, Andersen and Deininger2015; Markle et al. Reference Markle, Steig, Buizert, Schoenemann, Bitz, Fudge, Pedro, Ding, Jones, White and Sowers2016; Lynch-Stieglitz, Reference Lynch-Stieglitz2017; Dong et al. Reference Dong, Kathayat, Rasmussen, Svensson, Severinghaus, Li, Sinha, Xu, Zhang, Shi, Cai, Pérez-Mejías, Baker, Zhao, Spötl, Columbu, Ning, Stríkis, Chen, Wang, Gupta, Dutt, Zhang, Cruz, An, Edwards and Cheng2022). In the Asian region, atmospheric–oceanic circulation changed, with a southward shift of the Intertropical Convergence Zone (ITCZ) in the South China Sea (Zhao et al. Reference Zhao, Liu, Colin, Zhao, Wang and Jian2018; Kaboth-Bahr et al. Reference Kaboth-Bahr, Bahr, Yamoah, Chuang, Li, Su and Wei2021), weakened Asian summer monsoon (Cheng et al. Reference Cheng, Sinha, Wang, Cruz and Edwards2012, Reference Cheng, Edwards, Sinha, Spötl, Yi, Chen, Kelly, Kathayat, Wang, Li, Kong, Wang, Ning and Zhang2016) and intensified winter monsoon (Sun et al. Reference Sun, Chen, Clemens, Liu, Ji and Tada2006, Reference Sun, Clemens, Morrill, Lin, Wang and An2012).
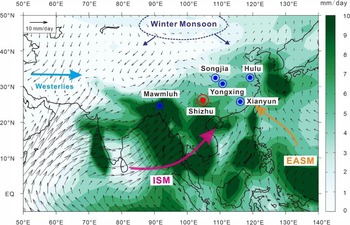
Here, we established a high-resolution δ18O record from two stalagmites of the Shizhu Cave from 45 to 15 ka B.P. in southwestern China (Fig. 1). The hydroclimate there is dominated by the ISM but also partly influenced by the EASM and the westerlies (Wang & Chen, Reference Wang and Chen2012; Cai et al. Reference Cai, Fung, Edwards, An, Cheng, Lee, Tan, Shen, Wang, Day, Zhou, Kelly and Chiang2015). Thus, stalagmites of the Shizhu Cave are suitable materials to better constrain the moisture trajectory of ISM in the past. Further, we compared δ18O records of the Shizhu Cave with other available records that were widely deposited in the ISM and EASM regions during the middle to late last glacial to investigate the possible moisture trajectories of the Asian summer monsoon during this period. In this study, first, we explore the possible moisture trajectories over the ISM and EASM regions during the middle to late last glacial. Second, we obtain amplitudes of stalagmite δ18O records from caves in the Asian region during Heinrich stadial 1 to 4 (HS1 to HS4) and investigate their distribution pattern to further discuss the controlling factors behind the pattern.
Cave locations in Asia. The detailed information for every cave is as follows: Mawmluh Cave: 25°15′N, 91°52′E, 1290 m a.s.l. (Dutt et al. Reference Dutt, Gupta, Clemens, Cheng, Singh, Kathayat and Edwards2015); Shizhu Cave: 26°02′N, 107°16′E, 950 m a.s.l. ; Xianyun Cave: 116°59′E, 25°33′N; 970 m a.s.l. (Zhang et al. Reference Zhang, Qiu, Jiang, Hu, Xiao, Cai and Shen2021; Qiu et al. Reference Qiu, Zhang, Jiang, Hu, Ma, Xiao, Cai and Shen2022); Hulu Cave: 32°32′N, 119°10′E, 90 m a.s.l. (Wang et al. Reference Wang, Cheng, Edwards, An, Wu, Shen and Dorale2001); Yongxing Cave: 31°35′N, 111°14′E, 750 m a.s.l. (Chen et al. Reference Chen, Wang, Cheng, Edwards, Wang, Kong and Liu2016); Songjia Cave: 32°24′N, 107°10′E; 680 m a.s.l. (Zhou et al. Reference Zhou, Zhao, Feng, Gagan, Zhou and Yan2008). The little black arrows represent the present-day averaged June–July–August (JJA) wind at 850 hPa (NCEP/NCAR, 1994). Four arrows represent the ISM, EASM, Westerly and Winter monsoon, respectively.

2. Materials and methods
2.a. Setting and sampling
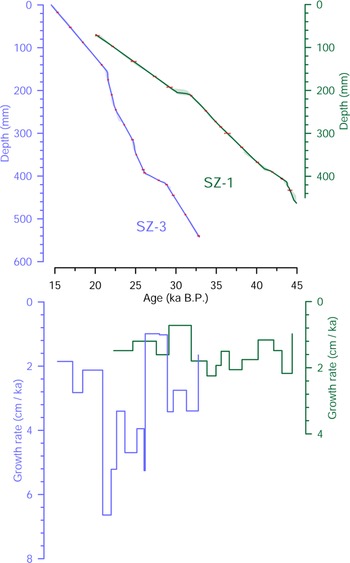
The Shizhu Cave is located in the southern Guizhou Province (26°02′N, 107°28′E; 1089 m above sea level), southwestern China (Fig. 1). The mean annual temperature and precipitation are 16.1 °C and 1431.1 mm, respectively (http://data.cma.cn/dataService). Warm and humid air from the Indian Ocean and the equatorial Pacific Ocean generates heavy and continuous rain in this region from May to October, constituting about 80% of the yearly precipitation (Dykoski et al. Reference Dykoski, Edwards, Cheng, Yuan, Cai, Zhang, Lin, Qing, An and Revenaugh2005). Two stalagmites, SZ-1 and SZ-3 (Fig. 2), were sampled from the Shizhu Cave at a chamber approximately 50 m below the surface. SZ-1 and SZ-3 are 430 mm and 542.5 mm in length, respectively (Fig. 3).
Age models and growth rates of the stalagmites SZ-1 and SZ-3 from Shizhu Cave. Age–depth relationship for SZ-1 (green line and axis) and SZ-3 (blue line and axis). Chronologies are established by U-Th dating and the StalAge model; error bars are indicated for every dating in red.

Cross sections of the stalagmites SZ-1 (a) and SZ-3 (b); the scale is the same for both stalagmites. The yellow rectangle in SZ-1 highlights the area where recrystallization might have occurred. Dating results and related dated areas of each stalagmite are indicated by the red rectangles. The white bars are remnants of the original marks and can be ignored. The oxygen isotope sampling track was performed directly on the left of the central axis of each stalagmite, which is marked by the orange lines.

2.b. U-Th dating
The U-Th dating method is one of the most important advantages of stalagmite paleoclimate research because of its high degree of accuracy in absolute timing (Cheng et al. Reference Cheng, Zhang, Zhao, Li, Ning and Kathayat2019). Thirty subsamples with 20 mm in length, 10 mm in width and 2.5 mm in depth were collected discontinuously from SZ-1 and SZ-3 along their growth axis for U-Th dating (Table 1). Uranium and thorium isotopic composition and content were measured using a multi-collector inductively coupled plasma mass spectrometer (MC-ICP-MS) in the High-Precision Mass Spectrometry and Environment Change Laboratory (HISPEC), Department of Geoscience, National Taiwan University (Shen et al. Reference Shen, Wu, Cheng, Edwards, Hsieh, Gallet, Chang, Li, Lam, Kano, Hori and Spötl2012). Uncertainties of the isotope data and U-Th dates, relative to 1950 AD, are given at the two-sigma (2s) level or two standard deviations of the mean (2sm) unless otherwise noted. Decay constants used for age calculation are available in Cheng et al. (Reference Cheng, Edwards, Shen, Polyak, Asmerom, Woodhead, Hellstrom, Wang, Kong, Spötl, Wang and Alexander2013).
U-Th isotopic measurements for Shizhu Cave stalagmite SZ-1 and SZ-3, on MC-ICP-MS

Analytical errors are 2s of the mean.
a [238U] = [235U] × 137.818 (±0.65‰) (Hiess et al. Reference Hiess, Condon, McLean and Noble2012); d234U = ([234U/238U]activity – 1) × 1000.
b d234Uinitial corrected was calculated based on 230Th age (T), i.e., d234Uinitial = d234Umeasured X el234*T, and T is corrected age.
c [230Th/238U]activity = 1 – e−l230T + (d234Umeasured/1000)[l230/(l230 – l234)](1 – e−(l230 – l234) T), where T is the age.
Decay constants are 9.1705 × 10⁻⁶ yr−1 for 230Th, 2.8221 × 10⁻⁶ yr−1 for 234U (Cheng et al. Reference Cheng, Edwards, Shen, Polyak, Asmerom, Woodhead, Hellstrom, Wang, Kong, Spötl, Wang and Alexander2013) and 1.55125 × 10⁻¹⁰ yr−1 for 238U (Jaffey et al. Reference Jaffey, Flynn, Glendenin, Bentley and Essling1971).
d Age corrections, relative to chemistry date, were calculated using an estimated atomic 230Th/232Th ratio of 4 (± 2) × 10−6.
Those are the values for material at secular equilibrium, with the crustal 232Th/238U value of 3.8. The errors are arbitrarily assumed to be 50%.
2.c. Oxygen isotopic measurements
The measurement technology of oxygen isotopes has been already quite mature after years of development. Here, 406 and 276 subsamples (cylinder of 0.3 mm diameter wide) were drilled, respectively, from the SZ-1 and SZ-3 with carbide dental burrs at a spacing of 2 mm along their growth axes. Acidic hydrolysis of CaCO3 was then performed from the extracted material, to which 0.2 mg of calcite was added to each subsample, using H3PO4 at a concentration close to 100 % at a constant controlled temperature of ∼72 °C to extract the CO2. Released CO2 was carried with helium (He) flow to an accessory Finnigan Gas Bench, where water vapour was separated through gas chromatography. The resultant CO2 was ionized and accelerated to mass separation in an automated system. Measurements of oxygen and carbon stable isotopes were performed on a Gasbench attached to a Thermo MAT 253 mass spectrometer at Fujian Normal University with an external 1σ precision of ± 0.06‰. Oxygen isotope values were presented as δ18O (δ18O = [(18O/16O)sample/(18O/16O)standard – 1] × 1000‰) with the Vienna Pee Dee Belemnite (VPDB) standard.
2.d. X-ray diffraction (XRD) analysis
Calcite is more stable than other carbonate materials like aragonite in recording stable isotope information (Zhang et al. Reference Zhang, Cai, Tan, Qin and An2014). Thus, it is necessary to detect the properties of the research materials. Eight subsamples from the sectioned surfaces of the stalagmite SZ-1 and SZ-3 were collected for XRD analysis. For each subsample, 2 mg powder was loaded on stages with a silicon tablet background and analysed by a Rigaku MiniFlex benchtop X-ray diffraction (XRD) instrument (Cu-Kα radiation) in the Center for Social Science, Southern University of Science and Technology. The XRD spectra were obtained from 2° to 100° 2θ. The major phase identification and semi-quantification were conducted using the PDXL2 software.
2.e. Data collecting and statistical analysis
The stack curve between stalagmite δ18O records of SZ-1 and SZ-3 in Figure 4 and the stack curve among five caves in Figure 7b were both obtained using the bootstrap resampling method, which can reserve the general trend of different curves as much as possible. Before stacking SZ-1 and SZ-3, we calculated the Pearson correlation coefficient between them in Fig. S1. The stack curve of SZ-1 and SZ-3 and the error bars are shown in Figure 4.
δ18O records from the stalagmites SZ-1 and SZ-3 investigated in this study. The original δ18O records from (a) SZ-1 (forest green) and (b) SZ-3 (purple). (d) Composite Shizhu δ18O record SZ-1-3 (navy blue). Error bars of the 230Th dating points are shown at the top for both stalagmites. The light yellow bar in (a) highlights the stage lacking dating results before 22.28 ka and the possible recrystallization during 22.28 ka to 24.64 ka B.P. of SZ-1. The black lines in (d) are error curves of stack analysis. The light pink and green rectangles present the periods of MIS 2 and MIS 3.

3. Results
3.a. Geochronology
The measured isotope ratios of U and Th, decay constants and calculated ages are listed in Table 1. Most of the 2σ uncertainties are better than 200 years for SZ-1 and 100 years for SZ-3, respectively. The StalAge chronology was used to establish the age models. Ages versus depths show that stalagmites SZ-1 and SZ-3 continuously grew from 45.0 to 22.0 ka B.P. and 32.8 to 14.4 ka B.P., respectively (Figs. 2 and 3). The growth rates vary from 1 to 7 cm/ka B.P. for SZ-1 and from 0.4 to 2.4 cm/ka B.P. for SZ-3. It is noted that samples before 22.28 ka B.P. of SZ-1 were lost before obtaining U-Th results, corresponding to a depth of about 0–9.75 cm. Thus, the δ18O records before 22.28 ka are unusable.
3.b. XRD results
The XRD results (Fig. S2) indicate that samples from SZ-1 and SZ-3 are predominantly composed of calcite, which makes them suitable for studying oxygen isotope variations. It is noted that ‘unclear laminations’ occurring during the period 22.28 to 24.64 ka B.P. were observed in stalagmite SZ-1 (Fig. 3); they may be formed by the recrystallization of the primary calcite crystals, alter the primary stable isotope composition (Zhang et al. Reference Zhang, Cai, Tan, Qin and An2014; Lachniet, Reference Lachniet2015) and thus have been excluded for further paleoclimate interpretations (Fig. 4a).
3.c. Combination of curve SZ-1-3
The δ18O values of SZ-1 range between −2.31‰ and −7.87‰ with an average value of −5.50‰, while the δ18O values of SZ-3 varied from −2.38‰ to −7.47‰ with an average value of −5.60‰. Centennial- to decadal-scale variability of SZ-1 and SZ-3 can be identified (Fig. 4), with averages of temporal resolution of 128 years (SZ-1) and 66 years (SZ-3). Although the evolution of δ18O between SZ-1 and SZ-3 (Fig. 4c) could not overlap perfectly due to different growth rates and sampling resolutions during 32.65 to 24.64 ka B.P., their overall trend, amplitudes and the average value of variations are comparable. The result of the Pearson correlation coefficient in Fig. S1 is 0.56, indicating a medium correlation and implying that SZ-1 and SZ-3 are available for further stack analysis. We stacked these two curves deposited between 24.64 ka and 32.65 ka to composite SZ-1-3 with the error curves in Figure 4d. The centennial-scale amplitudes of SZ-1-3 are 2.53 ‰, 1.05 ‰, 0.96 ‰ and 2.86 ‰ at nearly 16 ka B.P., 24 ka B.P., 31 ka B.P. and 39 ka B.P., respectively, indicating the existence of HS1 to HS4 (Wang et al. Reference Wang, Cheng, Edwards, An, Wu, Shen and Dorale2001; Andersen, Reference Andersen2004). Additionally, the average values of SZ-1-3 during Marine Isotope Stages 2 and 3 (MIS 2 and MIS 3) are −5.16‰ and −5.56‰, respectively.
4. Discussion
4.a. The Asian stalagmite δ18O records reveal moisture trajectories during the middle to late glacial
Previous studies have shown that variations in the stalagmite δ18O indicate the mean state of summer monsoon intensity and/or the integrated moisture transports (Cheng et al. Reference Cheng, Sinha, Wang, Cruz and Edwards2012, Reference Cheng, Edwards, Sinha, Spötl, Yi, Chen, Kelly, Kathayat, Wang, Li, Kong, Wang, Ning and Zhang2016). However, the exact mechanisms controlling the stalagmite δ18O values are still widely debated, including the ‘upstream depletion mechanism’ (Yuan et al. Reference Yuan, Cheng, Edwards, Dykoski, Kelly, Zhang, Qing, Lin, Wang, Wu, Dorale, An and Cai2004), the ratio of summer to winter rainfall (Wang et al. Reference Wang, Cheng, Edwards, An, Wu, Shen and Dorale2001) and the ratio of water vapour between the Pacific Ocean and the Indian Ocean (Tan, Reference Tan2013). We suggest that systematic comparison at different spatial-temporal scales may partially settle those disputes. Then, we selected relatively continuous stalagmites δ18O records from caves that are far enough to capture spatial variation in the Asian region during the middle to late last glacial for comparison.
The stalagmite δ18O records in the monsoon region of China are controlled by δ18O of yearly precipitation (Qiu et al. Reference Qiu, Li, Chen, Huang, Wang, Wu, Xiao, Xu, Huang, Zhang, Yang and Li2021), of which almost 80% is contributed by the EASM and the last 20% is dominated by the East Asian Winter Monsoon (EAWM) in the current climate setting. While, under the background of weakened Asian summer monsoon and intensified winter monsoon during the last glacial (Sun et al. Reference Sun, Chen, Clemens, Liu, Ji and Tada2006), this ratio may change partially. However, in this discussion, we do not explore the changed proportion emphasized by Wang et al. (Reference Wang, Cheng, Edwards, An, Wu, Shen and Dorale2001) but focus on the averages of these stalagmite δ18O records over the last glacial period.
Wang et al. (Reference Wang, Cheng, Edwards, An, Wu, Shen and Dorale2001) explained the changed stalagmite δ18O records of the Hulu Cave as the ratio between the East Asia summer and winter monsoon, which is very reasonable. Whereas, when comparing averages of stalagmite δ18O records from different regions over the last glacial period, the enhanced winter winds had a relatively common effect on these caves, although the influences on these caves may differ. It is conceivable that summer precipitation still constitutes the majority of yearly precipitation (Jiang et al. Reference Jiang, Lang, Tian and Guo2011; Cai et al. Reference Cai, Fung, Edwards, An, Cheng, Lee, Tan, Shen, Wang, Day, Zhou, Kelly and Chiang2015) and dominates the composition of stalagmite δ18O records. Thus, the comparison among averages of stalagmite δ18O records reflects summer moisture sources and trajectories during the middle to late last glacial period based on Rayleigh fractionation (Dansgaard, Reference Dansgaard1964).
Hu et al. (Reference Hu, Henderson, Huang, Xie, Sun and Johnson2008) compared stalagmite δ18O records from two caves along the same moisture transport path to quantify the history of rainfall during the Holocene, verifying the effectiveness of comparing records from different regions based on spatially coherent variability. Further, Li et al. (Reference Li, Rao, Cao, Jiang and Gao2017) demonstrated the different moisture sources and paths of southwest and east China by comparing stalagmite δ18O records from different regions. In the ISM region, the spatial variation of stalagmite δ18O records from coast to inland has been demonstrated on a subregional scale in south and Southeast Asia by Liu et al. (Reference Liu, Li, Chiang, Yuan, Chawchai, He, Lu, Aung, Maung, Tun, Oo and Wang2020) over the past 40 ka. In the EASM region, Zhang et al. (Reference Zhang, Qiu, Jiang, Hu, Xiao, Cai and Shen2021) demonstrated that the Yongxing Cave was located downstream of the EASM moisture path during the last glacial. These previous studies inspire us but lack systematical comparison on larger spatial scales.
The graph in Figure 5 illustrates how the average isotope values change over time. The Shizhu Cave is located at the main path of the ISM moisture trajectory whether in the present day or during the last glacial (Fig. 1; Fig. 6). Therefore, SZ-1-3 records are used to compare with those from sites along the ISM moisture trajectory (i.e., Mawmluh and Yongxing Caves) between 45 and 15 ka B.P. (Fig. 5). Their average values in Figure 5a show systematically decrease from the Indian Ocean to inland China. Specifically, the stalagmite δ18O records of Mawmluh Cave are significantly enriched because it is close to the moisture source, the Indian Ocean (Dutt et al. Reference Dutt, Gupta, Clemens, Cheng, Singh, Kathayat and Edwards2015). In contrast, the δ18O records in the Yongxing Cave are considerably lower than those of the Shizhu and Mawmluh Caves because of its midstream or downstream location along the moisture trajectory of the ISM (yellow arrows in Figure 6; Hu et al. Reference Hu, Henderson, Huang, Xie, Sun and Johnson2008; Cai et al. Reference Cai, Fung, Edwards, An, Cheng, Lee, Tan, Shen, Wang, Day, Zhou, Kelly and Chiang2015; Chen et al. Reference Chen, Wang, Cheng, Edwards, Wang, Kong and Liu2016). We demonstrate here that water vapour fractionation along this coastal-inland moisture transport route from the Indian Ocean to the coastal Mawmluh Cave, then to the Shizhu Cave, and probably extended to the Yongxing Cave during 45 and 15 ka (Fig. 6).
Comparison of δ18O records on ISM and EASM moisture trajectories. (a) Mawmluh (pink), Shizhu (navy blue; this study) and Yongxing (purple) Cave records. (b) Hulu (green), Yongxing (purple) and Songjia (black) Cave records. The light yellow bars highlight the four weak monsoon periods in the Asian monsoon regions, coeval with the Heinrich stadials 1 to 4 (Wang et al. Reference Wang, Cheng, Edwards, An, Wu, Shen and Dorale2001). The light pink and green rectangles are the same as in Figure 4.

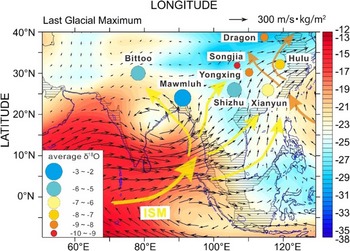
Possible ISM (yellow arrows) and EASM (orange arrows) moisture trajectories during the middle to late last glacial. The base map is modified from Cai et al. (Reference Cai, Fung, Edwards, An, Cheng, Lee, Tan, Shen, Wang, Day, Zhou, Kelly and Chiang2015), showing modelled June–August vapour transport (arrows, m−1skgm−2) and isotopic composition of column integrated vapour (colour-shading, ‰) during the last glacial maximum. Dark grey lines indicate the present coastline; the blue lines and hatched area indicate the coastline and the exposed continental shelf during the LGM when the sea level was ∼120 m lower than the present day. Legends in the left bottom indicate distribution intervals of the averages of stalagmite δ18O records during the middle to late last glacial.

In the eastern monsoonal region of China, the coastal Xianyun and Hulu Caves received more enriched δ18O of precipitation from the adjacent tropical and western Pacific Oceans (Wang et al. Reference Wang, Cheng, Edwards, An, Wu, Shen and Dorale2001; Zhang et al. Reference Zhang, Qiu, Jiang, Hu, Xiao, Cai and Shen2021; Qiu et al. Reference Qiu, Zhang, Jiang, Hu, Ma, Xiao, Cai and Shen2022). From the coastal Hulu/Xianyun Caves to the western inland Yongxing and then Songjia Caves, the average stalagmite δ18O values gradually decrease (Fig. 5b). We suggest that water vapour fractionation along this coastal-inland moisture transport route from the Pacific Ocean to the Yongxing Cave can be extended to the Songjia Cave during 45 and 15 ka (orange arrows in Fig. 6). Additionally, from coastal Hulu/Xianyun Caves to Dragon records in northern China (Dong et al. Reference Dong, Shen, Kong, Wang and Duan2018) probably imply a northern moisture trajectory. Overall, we propose that the two moisture trajectories from the Indian Ocean and the Pacific Ocean may exist during 45–15 ka B.P., just as similar to the climatology of modelled summer water vapour transport during the last glacial period (Cai et al. Reference Cai, Fung, Edwards, An, Cheng, Lee, Tan, Shen, Wang, Day, Zhou, Kelly and Chiang2015; Fig. 6).
4.b. Spatial pattern of millennial-scale variations of Asian stalagmite δ18O records
Millennial-scale abrupt climate changes also occur during 45–15 ka B.P., that is, Heinrich stadials. To highlight these Heinrich stadials, the Hulu, Yongxing, Dragon, Mawmluh and Shizhu δ18O records in the Asian region in Figure 7a were selected according to their data availability during the middle to late last glacial and far distances among them. We highlighted their changes during HS1 to HS4 after minus their respective averages of δ18O records in Figure 7a. We further stacked them using the bootstrap resampling method to avoid visual clutter in Figure 7b. The stacked curve shows rather consistent changes during HS1 to HS4. This consistent strongly suggests that they are dominated simultaneously by the same mechanism – integral changes in atmospheric–oceanic circulation patterns of the East Asian Monsoon (Wang et al. Reference Wang, Cheng, Edwards, An, Wu, Shen and Dorale2001), which is further linked to the paleoclimatic changes in the North Atlantic region (Fig. 7c, d).
Abrupt cooling at the North Atlantic region during the Heinrich stadials presents a north–south propagation of climatic signal initiated by the intrusion of vast amounts of freshwater into the Atlantic from melting continental ice sheets, which have been proved by Ice Raft Debris (IRD in Fig. 7c). This causes a disruption of the meridional overturning circulation (Bohm et al. Reference Bohm, Lippold, Gutjahr, Frank, Blaser, Antz, Fohlmeister, Frank, Andersen and Deininger2015; Markle et al. Reference Markle, Steig, Buizert, Schoenemann, Bitz, Fudge, Pedro, Ding, Jones, White and Sowers2016; Lynch-Stieglitz, Reference Lynch-Stieglitz2017; Dong et al. Reference Dong, Kathayat, Rasmussen, Svensson, Severinghaus, Li, Sinha, Xu, Zhang, Shi, Cai, Pérez-Mejías, Baker, Zhao, Spötl, Columbu, Ning, Stríkis, Chen, Wang, Gupta, Dutt, Zhang, Cruz, An, Edwards and Cheng2022) and further a reduction of the northward heat transport, leading to a cooling in the middle and high-latitude North Atlantic (Fig. 7d) and warming of the Southern Hemisphere (Zhang & Delworth, Reference Zhang and Delworth2005). This distinct change in heat balance between both hemispheres causes anomalously southward migration of the ITCZ (Chiang & Bitz, Reference Chiang and Bitz2005; Broccoli et al. Reference Broccoli, Dahl and Stouffer2006), severely altering the spatial precipitation pattern in the tropics and subtropics (Jacobel et al. Reference Jacobel, McManus, Anderson and Winckler2016), including the Asian summer monsoon region.
Specifically, the Asian summer monsoon consists of tropical ISM and hybrid EASM, which in response to Heinrich stadials different in detail. From the perspective of ISM, the ITCZ shifts southward, leading to a relatively dry and cool climate over the northern Indian Ocean (Dahl et al. Reference Dahl, Broccoli and Stouffer2005; Clement & Peterson, Reference Clement and Peterson2008; Mohtadi et al. Reference Mohtadi, Prange, Oppo, Pol-Holz, Merkel, Zhang, Steinke and Luckge2014; Zorzi et al. Reference Zorzi, Goñi, Anupama, Prasad, Hanquiez, Johnson and Giosan2015; Tierney et al. Reference Tierney, Pausata and DeMenocal2016; Bradley et al. Reference Bradley, Eric, Christo, Spruce, Cecilia, Fudge, Joel, Ding, Tyler, Jones and Todd2017) and decreasing rainfall and river runoff in the south Asian subcontinent further (Mohtadi et al. Reference Mohtadi, Prange, Oppo, Pol-Holz, Merkel, Zhang, Steinke and Luckge2014; Deplazes et al. Reference Deplazes, Luckge, Stuut, Patzold, Kuhlmann, Husson, Fant and Haug2014). Simulations also show that the sudden increase in North Atlantic sea-ice extent in the HS1 impacts the Indian Ocean climate and causes a sudden increase in δ18OP over the Indian subcontinent, as well as isotopically heavier water vapour exported eastward into Southeast Asia (Pausata et al. Reference Pausata, Battisti, Nisancioglu and Bitz2011).
Overall, it is commonly agreed that climate changes in the Indian Ocean are the primary cause of enriched stalagmite δ18O records in the ISM regions from HS1 to HS4. The change in water vapour in the Indian Ocean and the Indian subcontinent to what extent affects the EASM region is still controversial. As described above, Pausata et al. (Reference Pausata, Battisti, Nisancioglu and Bitz2011) proposed that the changed water vapour in the Indian Ocean leads to enriched δ18OP in the ISM region. These two mutually account for δ18OP of the downstream EASM region. That is to say, variations of stalagmite δ18O records in Chinese caves during Heinrich stadials are almost entirely affected by the ISM rather than the EASM.
However, recent studies suggest that the meridional position of the westerlies also affects the precipitation seasonality, and consequently, the δ18O of precipitation and stalagmite records in the EASM region (Chiang et al. Reference Chiang, Fung, Wu, Cai, Edman, Liu, Day, Bhattacharya, Mondal and Labrousse2015, Reference Chiang, Swenson and Kong2017, Reference Chiang, Herman, Yoshimura and Fung2020; Liang et al. Reference Liang, Zhao, Edwards, Wang, Shao, Zhang, Zhao, Wang, Cheng and Kong2020). For example, Liang et al. (Reference Liang, Zhao, Edwards, Wang, Shao, Zhang, Zhao, Wang, Cheng and Kong2020) suggested that 28°N is a boundary line for stalagmite δ18O records, with higher amplitude in the north (>1.5‰) and lower amplitude in the south (∼1‰) during HS1. The impediment of the westerly jet stream caused a small fraction of maritime moisture transported into inland China (less δ18O-depleted precipitation), but a large fraction (more δ18O-depleted precipitation) can still reach the lower latitude regions under modern settings and the Heinrich stadials. Thus, a mixture of yearly rainfall could cause small amplitude changes in calcite δ18O and regional differences in the north and south of the boundary line.
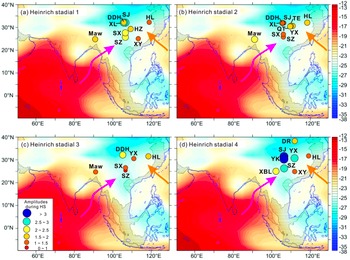
Furtherly, to detect factors affecting stalagmite δ18O records in the EASM region, we took amplitudes, which are defined as the departures apart from the background, of existing stalagmite δ18O records (shown in Fig. S3) widely in Asian summer monsoon during HS1 to HS4 for comparison by the method in Fig. S4. As shown in Tab. S1 and Figure 8, amplitudes of stalagmite δ18O records from different caves increase from coastal oceans to mid-latitude inland China, presenting a ‘coastal-inland’ pattern, which is probably associated with two types of explanations.
Response of stalagmite δ18O records to IRD and SST in North Atlantic. (a) Rcords from the Mawmluh, Shizhu, Yongxing, Hulu and Dragon Caves after minus their respective average values; (b) the stacked curve of these five caves which is calculated by bootstrap resampling method; (c–d) IRD and SST records are referred to Lisiecki & Stern (Reference Lisiecki and Stern2016).

Changing amplitudes of caves during Heinrich stadials 1 to 4. The pink and orange arrows indicate the positions of ISM and EASM. The information on the base map is the same as in Figure 6.

First, this is possibly interpreted by the increased continental climate in central China, which concerns decreased summer rainfall amounts. Changing North Atlantic surface water strengthens the EAWM and weakens the summer monsoon probably through the northern westerlies (Porter & An, Reference Porter and An1995; Sun et al. Reference Sun, Clemens, Morrill, Lin, Wang and An2012). The southern shifts of the ITCZ in the tropical ocean (Mohtadi et al. Reference Mohtadi, Prange, Oppo, Pol-Holz, Merkel, Zhang, Steinke and Luckge2014) and the South China Sea (Kaboth-Bahr et al. Reference Kaboth-Bahr, Bahr, Yamoah, Chuang, Li, Su and Wei2021) together with exposed shelves in the Asian region caused less maritime moisture transported into inland China, which means less δ18O-depleted precipitation in a year as Wang et al. (Reference Wang, Cheng, Edwards, An, Wu, Shen and Dorale2001) proposed. Chiang et al. (Reference Chiang, Fung, Wu, Cai, Edman, Liu, Day, Bhattacharya, Mondal and Labrousse2015) also suggested that a southward movement of the westerly jet could prevent the inland intrusion of the low-level monsoonal flow and Asian summer monsoon moisture. Eventually, the summer seasonality is gradually reducing in central China with increasing distance to oceans, resulting in increasing amplitudes of stalagmite δ18O records during Heinrich stadials.
Another possibility is the increased proportion of summer moisture resources from the Pacific Ocean. Tan (Reference Tan2009, Reference Tan2011, Reference Tan2013, Reference Tan2016) proposed that the position of the WPSH affects this proportion in summer monsoonal China. The WPSH is further associated with the global atmospheric and oceanic circulation. Specifically, a strong WPSH at a more southwestern location may weaken the ISM over the Bay of Bengal and strengthen the EASM over the South China Sea and the Western North Pacific, and vice versa (e.g., Gong & Ho, Reference Gong and Ho2002; Zhou et al. Reference Zhou, Yu, Zhang, Drange, Cassou, Deser, Hodson, Sanchez-Gomez, Li, Keenlyside, Xin and Okumura2009; Cao et al. Reference Cao, Hu and Tao2012, Reference Cao, Gui, Su and Yang2016). The enriched stalagmite δ18O records of caves in southeast China during HS1 to HS4 were possibly caused by an increased proportion of moisture from the Pacific Ocean. As to the ‘coastal-inland’ pattern, Zhao et al. (Reference Zhao, Cheng, Yang, Tan, Spötl, Ning, Zhang, Cheng, Sun, Li, Li, Liu and Edwards2019) proposed that caves in other monsoon regions of China with dominant moisture sources from either the Pacific or the Indian Ocean are not significantly correlated with WPSH variations. Considering this, we suggest that the caves located in central China where influenced by both ISM and EASM are most affected by the changed proportion, showing the biggest amplitudes in the southeast China region during Heinrich stadials.
Additionally, the distribution pattern of HS2 (Fig. 8b) seems to differ from the last three, without an obvious ‘coastal-inland’ pattern. While records in the EASM region in Figure 8b show a less obvious ‘south-north’ pattern in mid-low latitudes. Some researchers suggest that this pattern is possibly caused by the migration of the westerlies during Heinrich stadials directly (Chiang et al. 2015, 2017, Reference Chiang, Herman, Yoshimura and Fung2020; Nagashima et al. Reference Nagashima, Tada, Tani, Sun, Isozaki, Toyoda and Hasegawa2011). The specific mechanisms have been described above by the Liang et al. (Reference Liang, Zhao, Edwards, Wang, Shao, Zhang, Zhao, Wang, Cheng and Kong2020). Besides, it is noted that the Dragon Cave in northern China in Figure 8d presents smaller amplitudes, compared with these caves in central China. A previous study of backward trajectory analysis in northern China reveals the importance of westerly borne and near-sourced moisture, dominating 77% of the summertime rainfall (Draxler & Hess, Reference Draxler and Hess1998). This probably leads to a weaker source effect and smaller amplitudes of the Dragon Cave during Heinrich stadials compared with caves in central China.
Conclusion
To further explore the moisture transportation process from oceans to the continent over China in the past, we present stalagmite δ18O records between 45 and 15 ka B.P. from the Shizhu Cave, southwestern China. After comparing it with other Asian δ18O records, we propose two main moisture trajectories: one from the Indian Ocean, through the Shizhu Cave to central China, and one from the Pacific Ocean to central China. This gradually systematical decreasing average values of stalagmite δ18O from oceans to inland China present a spatial pattern of water vapour fractionation during the middle to late last glacial. Further, to explore factors affecting stalagmite δ18O records in the EASM region during Heinrich stadials, we took amplitudes of stalagmite δ18O records widely in Asian summer monsoon during HS1 to HS4 for comparison. The amplitude results show an increasing trend from coastal oceans to mid-latitude inland China, presenting a ‘coastal-inland’ pattern, which is probably associated with the decreased summer rainfall amount in inland areas or/and the increased proportion of summer moisture resources from the Pacific Ocean.
Supplementary material
To view supplementary material for this article, please visit https://doi.org/10.1017/S0016756824000013
Acknowledgements
This research was supported by grants from the National Natural Science Foundation of China (42074071, 42071106, 41874078, 92158208, 42274094), Shenzhen Science and Technology Program (grant no. KQTD20170810111725321), Science and Technology Innovation Committee of Shenzhen Municipality (ZDSYS201802081843490), Technology and Innovation Commission of Shenzhen Municipality (20200925154739001), Southern University of Science and Technology (Y01316111), and Key Special Project for Introduced Talents Team of Southern Marine Science, the International Cooperation Project of Fujian (2022I0013 to X. J) and Engineering Guangdong Laboratory (Guangzhou) (GML2019ZD0210). U-Th dating was partially supported by grants from the National Science and Technology Council (111-2116-M-002-022-MY3), the National Taiwan University (112L894202 to C.-C.S.), and the Higher Education Sprout Project of the Ministry of Education (110L901001 and 110L8907). Shanghai Sheshan National Geophysical Observatory (SSKP202102).
Competing interests
We declare that we have no financial and personal relationships with other people or organizations that can inappropriately influence our work, and there is no professional or other personal interest of any nature or kind in any product, service, and/or company that could be construed as influencing the position presented in, or the review of, the manuscript entitled, ‘Chinese stalagmite δ18O records reveal the diverse moisture trajectories during the middle to late last glacial period’.


 Open access