


1. Introduction
Dynamics of interest rates have implications in different areas such as asset and derivatives pricing, portfolio management, and risk measurement. In the context of actuarial science, interest rate models are central to the evaluation of long-term financial contracts such as standard insurance and annuities, as well as equity-linked products.
The seminal work of Nelson & Siegel (Reference Nelson and Siegel1987) depicts the term structure as a linear combination of interpretable factors representing the level, the slope, and a hump in the yield curve. Although this model was initially developed in a static setting, Diebold & Li (Reference Diebold and Li2006) extend the Nelson & Siegel (Reference Nelson and Siegel1987) model into a dynamic framework. However, a drawback associated with the dynamic version of the model is its incompatibility with no-arbitrage theory, an issue that is discussed in Filipović (Reference Filipović1999). The work of Christensen et al. (Reference Christensen, Diebold and Rudebusch2011) reconciles both the no-arbitrage strand of literature and the Nelson & Siegel (Reference Nelson and Siegel1987) model by developing the so-called arbitrage-free Nelson-Siegel (AFNS) model. Such model is an affine term structure (ATS) model (see Duffie & Kan, Reference Duffie and Kan1996) where the specification of the diffusion followed by term structure factors is carefully chosen such that factor loadings exactly coincide with these of the Nelson-Siegel model. The discrepancy between spot rates of the Nelson-Siegel model and of the AFNS model only stems from a corrective term whose inclusion is necessary to preclude theoretical arbitrage opportunities.
The AFNS model is expressed in a continuous-time settings. It is however of interest to develop a discrete-time counterpart to the model. Indeed, many of existing interest rate models already have such discrete-time versions, as described for instance in Wüthrich & Merz (Reference Wüthrich and Merz2013). Discrete-time models often possess the advantage of being more simple to manipulate, which is favorable in applications. For instance, when Monte-Carlo simulations are used to generate discount factors, discretization must often be applied. Whenever such approximation is used, numerical testing is required to ensure that discretization errors exhibit sufficiently low bias and variance. Discrete-time models allow circumventing all such analyses by providing exact simulations. Furthermore, multiple time series and econometric models involving regressions (e.g. these including lagged components) are naturally formulated in discrete-time, and compatibility with such frameworks is often a key consideration when developing interest rate models. Finally, dynamic optimization schemes such as reinforcement learning are more extensively developed in a discrete-time context and exhibit much more tractability in that case. The integration of stochastic interest rates to applications of such methods to finance, such as the deep hedging scheme of Buehler et al. (Reference Buehler, Gonon, Teichmann and Wood2019), will be simplified if the model is already specified in discrete-time.
A discrete-time version of the AFNS model has been developed in Hong et al. (Reference Hong, Niu and Zeng2019). This paper further expands on the work of Hong et al. (Reference Hong, Niu and Zeng2019) and revisits the discrete-time arbitrage-free Nelson-Siegel (DTAFNS) model, providing the following three main contributions. The first is to obtain a closed-form expression for risk-free spot rates. The closed-form solution is obtained after slightly modifying the interest rate dynamics from Hong et al. (Reference Hong, Niu and Zeng2019) so as to obtain additional tractability (i.e. simpler formulas), while still retaining asymptotic equivalence with the AFNS model. As highlighted in Section 2.5 of Hong et al. (Reference Hong, Niu and Zeng2019), ATS models often provide enough tractability to study the decomposition of yields into expected rates and risk premia analytically. The closed-form expression we obtain can therefore further facilitate such analysis. The second contribution consists in presenting evidence of superior distributional out-of-sample predictive ability of the DTAFNS model over benchmarks when applied on historical Canadian term structure data. Finally, as an actuarial application, our third contribution is to develop a modified version of the mixed fund return model of Augustyniak et al. (Reference Augustyniak, Godin and Hamel2021) by substituting their three-factor Gaussian model with the DTAFNS model. The latter is justified by the higher performance of the DTAFNS model outlined in this paper. Such model is useful when pricing life insurance contracts embedding guarantees related to financial market performance such as variable annuities, universal life or participating contracts.
The remainder of this paper is organized as follows. Section 2 specifies the proposed interest rate model and provides closed-form expressions for risk-free zero-coupon bond prices and spot rates. In Section 3, the model calibration is illustrated and numerical experiments assessing predictive performance are provided. Section 4 adapts the mixed fund model of Augustyniak et al. (Reference Augustyniak, Godin and Hamel2021) to include the DTAFNS model as a building block for the term structure model. Section 5 concludes.
2. Interest rate term structure model
This section presents the mathematical construction of the discrete-time version of the arbitrage-free Nelson-Siegel term structure model, referred to subsequently as the DTAFNS model. First, the specification of the traditional Nelson-Siegel model and its dynamic continuous-time arbitrage-free extension are recalled. Then, the dynamics of the short rate in the DTAFNS model is provided and closed-form formulas for spot rates are derived. As explained in more details subsequently, the DTAFNS model presented in this section has a slighlty different specification from that of Hong et al. (Reference Hong, Niu and Zeng2019).
2.1. The Nelson-Siegel term structure representation
Nelson & Siegel (Reference Nelson and Siegel1987) propose a parametric representation of the yield curve of the form
 \begin{equation}y(t,T)=X^{(1)}+X^{(2)}\left(\dfrac{1-e^{-\lambda\tau}}{\lambda\tau}\right)+X^{(3)}\left(\dfrac{1-e^{-\lambda\tau}}{\lambda\tau} - e^{-\lambda\tau }\right),\end{equation}
where y(t, T) is the time-t spot rate with tenor $\tau=T-t$
, and
$\tau=T-t$
, and $ X^{(1)},X^{(2)},X^{(3)}$
and
$ X^{(1)},X^{(2)},X^{(3)}$
and $\lambda>0$
are model parameters. The model leads to a convenient interpretation of the parameters, with
$\lambda>0$
are model parameters. The model leads to a convenient interpretation of the parameters, with $X^{(1)}$
,
$X^{(1)}$
, $X^{(2)}$
, and
$X^{(2)}$
, and $X^{(3)}$
, respectively, characterizing the level, slope, and curvature of the yield curve, while
$X^{(3)}$
, respectively, characterizing the level, slope, and curvature of the yield curve, while $\lambda$
is a dilation parameter. Although this model has first been considered in a static setting, Diebold & Li (Reference Diebold and Li2006) embed it in a dynamic setting where time-varying factors
$\lambda$
is a dilation parameter. Although this model has first been considered in a static setting, Diebold & Li (Reference Diebold and Li2006) embed it in a dynamic setting where time-varying factors $X^{(1)}_{t},X^{(2)}_{t},X^{(3)}_{t}$
are considered instead of
$X^{(1)}_{t},X^{(2)}_{t},X^{(3)}_{t}$
are considered instead of $X^{(1)},X^{(2)},X^{(3)}$
. Several auto-regressive models are used for the dynamics of such parameters, thereby making it possible to forecast the term structure.
$X^{(1)},X^{(2)},X^{(3)}$
. Several auto-regressive models are used for the dynamics of such parameters, thereby making it possible to forecast the term structure.
A pitfall of the dynamic Nelson-Siegel model of Diebold & Li (Reference Diebold and Li2006) is its incompatibility with no-arbitrage theory as discussed Filipović (Reference Filipović1999). Christensen et al. (Reference Christensen, Diebold and Rudebusch2011) therefore adapt the Nelson-Siegel framework and develop the AFNS model, an arbitrage-free term structure model whose spot rate formulas match exactly these of the Nelson-Siegel model up to a correction term. It is obtained by specifying the short rate risk-neutral dynamics as the following affine Gaussian Itô diffusion:
 \begin{align}r_t \equiv X^{(1)}_t + X^{(2)}_t, \end{align}
 \begin{align} \left[ \begin{array}{c} dX^{(1)}_t \\[4pt] dX^{(2)}_t \\[4pt] dX^{(3)}_t \end{array} \right] \equiv \underbrace{\left[ \begin{array}{c@{\quad}c@{\quad}c} 0 & 0 & 0 \\[4pt] 0 & \lambda & -\lambda \\[4pt] 0 & 0 & \lambda \end{array} \right] }_{ \kappa^\mathbb{Q} }\underbrace{\left[ \begin{array}{c} \theta^{\mathbb{Q}}_1-X^{(1)}_t \\[4pt] \theta^{\mathbb{Q}}_2-X^{(2)}_t \\[4pt] \theta^{\mathbb{Q}}_3-X^{(3)}_t \end{array} \right] }_{ \theta^{\mathbb{Q}}-\textbf{X}_t } dt + \Sigma \!\left( {\begin{array}{c} dW^{\mathbb{Q}}_{t,1} \\[6pt] dW^{\mathbb{Q}}_{t,2} \\[6pt] dW^{\mathbb{Q}}_{t,3} \\[4pt] \end{array} } \right) \end{align}
where $\big\{W^{\mathbb{Q}}_{t,1}\big\}_{t \geq 0}$
,
$\big\{W^{\mathbb{Q}}_{t,1}\big\}_{t \geq 0}$
, $\big\{W^{\mathbb{Q}}_{t,2}\big\}_{t \geq 0}$
and
$\big\{W^{\mathbb{Q}}_{t,2}\big\}_{t \geq 0}$
and $\big\{W^{\mathbb{Q}}_{t,3}\big\}_{t \geq 0}$
are independent Brownian motions under the risk-neutral probability measure
$\big\{W^{\mathbb{Q}}_{t,3}\big\}_{t \geq 0}$
are independent Brownian motions under the risk-neutral probability measure $\mathbb{Q}$
,
$\mathbb{Q}$
, $\Sigma$
is a
$\Sigma$
is a $3\times 3$
positive semi-definite matrix and
$3\times 3$
positive semi-definite matrix and $\theta^{\mathbb{Q}}_1,\theta^{\mathbb{Q}}_2,\theta^{\mathbb{Q}}_3,\lambda$
are real numbers. As shown in Christensen et al. (Reference Christensen, Diebold and Rudebusch2011), this leads to the following formulas for spot rates:
$\theta^{\mathbb{Q}}_1,\theta^{\mathbb{Q}}_2,\theta^{\mathbb{Q}}_3,\lambda$
are real numbers. As shown in Christensen et al. (Reference Christensen, Diebold and Rudebusch2011), this leads to the following formulas for spot rates:
 \begin{align}y(t,T) = -\frac{1}{\tau}\sum^3_{j=1} \tilde{B}^{(j)}(t,T) X^{(j)}_{t} - \frac{\tilde{C}(t,T)}{\tau},\end{align}
 \begin{align} \tilde{C}(t,T) = \sum^3_{j=2} \big(\kappa^\mathbb{Q} \theta^\mathbb{Q}\big)_j \int^T_{t} \tilde{B}^{(j)}(s,T)ds + \frac{1}{2} \sum^3_{j=1} \int^T_{t} \!\left(\Sigma^\top \tilde{B}(s,T) \tilde{B}(s,T)^\top \Sigma \right)_{j,j} ds\end{align}
with
 \begin{eqnarray}\tilde{B}(s,T) &\equiv& \left[\tilde{B}^{(1)}(s,T), \,\, \tilde{B}^{(2)}(s,T), \,\, \tilde{B}^{(3)}(s,T)\right]^\top \notag\\[4pt] &\equiv& \left[{-}\tau, \,\, -\left(\dfrac{1-e^{-\lambda\tau}}{\lambda} \right), \,\, \left(\tau e^{-\lambda\tau } -\dfrac{1-e^{-\lambda\tau}}{\lambda} \right)\right]^\top \end{eqnarray}
and $()_j$
or
$()_j$
or $()_{j,j}$
denoting respectively the j
$()_{j,j}$
denoting respectively the j $^{th}$
element of a vector or the element at row j and column j of a matrix, respectively.
$^{th}$
element of a vector or the element at row j and column j of a matrix, respectively.
Striking similarities can be observed when comparing (2.1) with (2.4) and (2.6). Indeed, identifying $X^{(1)}_{t}, X^{(2)}_{t}, X^{(3)}_{t}$
with
$X^{(1)}_{t}, X^{(2)}_{t}, X^{(3)}_{t}$
with $X^{(1)}, X^{(2)}, X^{(3)}$
, discrepancies between the spot rates from both models are only caused by the corrective term
$X^{(1)}, X^{(2)}, X^{(3)}$
, discrepancies between the spot rates from both models are only caused by the corrective term $- \frac{\tilde{C}(t,T)}{\tau}$
appearing in (2.4). This leads Christensen et al. (Reference Christensen, Diebold and Rudebusch2011) to describe the arbitrage-free Nelson-Siegel model (2.2)–(2.3) as the “closest match to the Nelson-Siegel yield function” within some class of exponential affine term structure models.
$- \frac{\tilde{C}(t,T)}{\tau}$
appearing in (2.4). This leads Christensen et al. (Reference Christensen, Diebold and Rudebusch2011) to describe the arbitrage-free Nelson-Siegel model (2.2)–(2.3) as the “closest match to the Nelson-Siegel yield function” within some class of exponential affine term structure models.
2.2. Discrete-time arbitrage-free Nelson-Siegel model
The purpose of this section is to define a discrete-time model analogous to model (2.2)–(2.3). In what follows, an arbitrage-free market with discrete time steps $t=0,1,...,T$
, each separated by a time elapse
$t=0,1,...,T$
, each separated by a time elapse $\Delta$
, is considered. Market dynamics are defined on probability space
$\Delta$
, is considered. Market dynamics are defined on probability space $(\Omega, \mathcal{F}_T,\mathbb{P})$
where
$(\Omega, \mathcal{F}_T,\mathbb{P})$
where $\mathbb{P}$
is the real-world probability measure and
$\mathbb{P}$
is the real-world probability measure and $\mathcal{F}\,:\!=\,\left\lbrace \mathcal{F}_t \right\rbrace_{t=0}^{T}$
is a filtration characterizing the information flow in the market.
$\mathcal{F}\,:\!=\,\left\lbrace \mathcal{F}_t \right\rbrace_{t=0}^{T}$
is a filtration characterizing the information flow in the market.
In the discrete-time context, the time-t short risk-free rate $r_t$
is the
$r_t$
is the $\mathcal{F}_t$
-measurable rate effective for the period
$\mathcal{F}_t$
-measurable rate effective for the period $[t,t+1)$
. The short rate dynamics considered are
$[t,t+1)$
. The short rate dynamics considered are
 \begin{align}r_t = X^{(1)}_t + X^{(2)}_t,\end{align}
 \begin{align}X_{t+1} = X_t+\kappa^{\mathbb{P}} \big(\theta^{\mathbb{P}}-X_t\big)+\Sigma Z_{t+1}^{\mathbb{P}}, \end{align}
where the stochastic factor vectors are $X_{t} =\left[X^{(1)}_t, X^{(2)}_t, X^{(3)}_t\right]^\top$
,
$X_{t} =\left[X^{(1)}_t, X^{(2)}_t, X^{(3)}_t\right]^\top$
, $t=0,\ldots,T$
,
$t=0,\ldots,T$
, $\kappa^{\mathbb{P}}$
and
$\kappa^{\mathbb{P}}$
and $\Sigma$
are constant parameter matrices of dimension
$\Sigma$
are constant parameter matrices of dimension $3\times 3$
, and
$3\times 3$
, and $\theta^{\mathbb{P}}$
is a constant column vector of dimension 3. The process
$\theta^{\mathbb{P}}$
is a constant column vector of dimension 3. The process $Z^{\mathbb{P}}= \big\{ Z_{t}^{\mathbb{P}} \big\}^T_{t=1}$
with
$Z^{\mathbb{P}}= \big\{ Z_{t}^{\mathbb{P}} \big\}^T_{t=1}$
with $ Z_{t}^{\mathbb{P}}= \left[Z^{\mathbb{P}}_{t,1}, Z^{\mathbb{P}}_{t,2}, Z^{\mathbb{P}}_{t,3}\right]^\top$
is a multivariate standard Gaussian white noise under
$ Z_{t}^{\mathbb{P}}= \left[Z^{\mathbb{P}}_{t,1}, Z^{\mathbb{P}}_{t,2}, Z^{\mathbb{P}}_{t,3}\right]^\top$
is a multivariate standard Gaussian white noise under $\mathbb{P}$
with contemporaneous correlation parameters
$\mathbb{P}$
with contemporaneous correlation parameters $\rho^{(Z)}_{i,j} \equiv \text{corr}\!\left(Z_{t,i}^{\mathbb{P}},Z_{t,j}^{\mathbb{P}}\right)$
,
$\rho^{(Z)}_{i,j} \equiv \text{corr}\!\left(Z_{t,i}^{\mathbb{P}},Z_{t,j}^{\mathbb{P}}\right)$
, $t=1,\ldots,T$
and
$t=1,\ldots,T$
and $i,j=1,2,3$
. The initial value of the factor process is fixed at
$i,j=1,2,3$
. The initial value of the factor process is fixed at $X_0= x_0\in \mathbb{R}^3$
.
$X_0= x_0\in \mathbb{R}^3$
. $\Sigma$
is assumed to be a diagonal matrix with strictly positive elements. Equations (2.7)–(2.8) are meant to mimic (2.2)–(2.3), except that the model is specified under the physical measure
$\Sigma$
is assumed to be a diagonal matrix with strictly positive elements. Equations (2.7)–(2.8) are meant to mimic (2.2)–(2.3), except that the model is specified under the physical measure $\mathbb{P}$
instead of under the risk-neutral measure
$\mathbb{P}$
instead of under the risk-neutral measure $\mathbb{Q}$
. A more general class of Gaussian discrete-time affine structure models is studied in Wüthrich & Merz (Reference Wüthrich and Merz2013), but without specializing to the DTAFNS model which is the object of this paper.
$\mathbb{Q}$
. A more general class of Gaussian discrete-time affine structure models is studied in Wüthrich & Merz (Reference Wüthrich and Merz2013), but without specializing to the DTAFNS model which is the object of this paper.
To obtain the specification of spot rates under the DTAFNS model, risk-neutral dynamics need to be specified. Indeed, spot rates are given by
 \begin{equation*}y(t,T) = -\frac{\log P(t,T)}{(T-t)\Delta}\end{equation*}
where P(t,T) is the time-t of a risk-free zero coupon of unit face value with maturity on time point T. In discrete-time models of the short rate, the relationship between P(t,T) and the risk-free rate is
 \begin{equation*}P(t,T) = \mathbb{E}^{\mathbb{Q}}\!\left[ \exp\!\left(-\Delta \sum^{T-1}_{j=t} r_{j}\right) \bigg\vert \mathcal{F}_t\right].\end{equation*}
To obtain risk-neutral dynamics, following the lines of Augustyniak et al. (Reference Augustyniak, Godin and Hamel2021) for instance, a discrete-time version of the Girsanov theorem can be invoked to apply a translation to the drift of short rate factors $X_t$
without altering their volatilities, while keeping a multivariate Gaussian distribution for innovations.Footnote 1 It follows from this theorem that for a given constant market price of risk matrix
$X_t$
without altering their volatilities, while keeping a multivariate Gaussian distribution for innovations.Footnote 1 It follows from this theorem that for a given constant market price of risk matrix $\gamma \in \mathbb{R}^{3\times 3}$
, there exists a probability measure
$\gamma \in \mathbb{R}^{3\times 3}$
, there exists a probability measure $\mathbb{Q}$
equivalent to
$\mathbb{Q}$
equivalent to $\mathbb{P}$
such that the process
$\mathbb{P}$
such that the process $ Z^{\mathbb{Q}}=\big\lbrace Z^{ \mathbb{Q} }_t\big\rbrace_{t=1}^{T} $
defined through
$ Z^{\mathbb{Q}}=\big\lbrace Z^{ \mathbb{Q} }_t\big\rbrace_{t=1}^{T} $
defined through $Z^{\mathbb{Q}}_{t+1}=Z^{\mathbb{P}}_{t+1}-\gamma X_t $
is also an
$Z^{\mathbb{Q}}_{t+1}=Z^{\mathbb{P}}_{t+1}-\gamma X_t $
is also an $\mathcal{F}$
-adapted standard Gaussian white noise under
$\mathcal{F}$
-adapted standard Gaussian white noise under $\mathbb{Q}$
, still with contemporaneous correlation matrix
$\mathbb{Q}$
, still with contemporaneous correlation matrix $\rho^{(Z)} = \left[ \rho^{(Z)}_{i,j} \right]^3_{i,j=1}$
. Substituting
$\rho^{(Z)} = \left[ \rho^{(Z)}_{i,j} \right]^3_{i,j=1}$
. Substituting $ Z^{\mathbb{P}}_{t+1}=Z^{\mathbb{Q}}_{t+1}+\gamma X_t $
into (2.8) leads to
$ Z^{\mathbb{P}}_{t+1}=Z^{\mathbb{Q}}_{t+1}+\gamma X_t $
into (2.8) leads to
 \begin{equation*} X_{t+1}=X_t+\kappa^{\mathbb{P}} \theta^{\mathbb{P}} - \left(\kappa^{\mathbb{P}} - \Sigma \gamma\right) X_t +\Sigma Z_{t+1}^{\mathbb{Q}}.\end{equation*}
Assuming there is a solution $(\kappa^{\mathbb{Q}},\theta^{\mathbb{Q}})$
with
$(\kappa^{\mathbb{Q}},\theta^{\mathbb{Q}})$
with $\kappa^{\mathbb{Q}} \in \mathbb{R}^{3\times 3}$
and
$\kappa^{\mathbb{Q}} \in \mathbb{R}^{3\times 3}$
and $\theta^{\mathbb{Q}} \in \mathbb{R}^{3\times 1}$
to the system of equations
$\theta^{\mathbb{Q}} \in \mathbb{R}^{3\times 1}$
to the system of equations
 \begin{eqnarray}\begin{cases}\kappa^{\mathbb{Q}} \theta^{\mathbb{Q}} = \kappa^{\mathbb{P}} \theta^{\mathbb{P}},\\[4pt] \kappa^{\mathbb{Q}} = \kappa^{\mathbb{P}} - \Sigma \gamma,\end{cases}\end{eqnarray}
then
 \begin{align}X_{t+1} = X_t+\kappa^{\mathbb{Q}} (\theta^{\mathbb{Q}}-X_t)+\Sigma Z_{t+1}^{\mathbb{Q}} \end{align}
and thus, the factor process $\{X_t\}^T_{t=0}$
preserves its auto-regressive structure under the risk-neutral measure. Note that as a future research avenue, other pricing kernels can be considered. For instance, these associated with essentially affine models defined in Duffee (Reference Duffee2002) are shown in that work to enhance the forecasting ability of the model by generalizing the physical dynamics of term structure factors while retaining the same risk-neutral dynamics.
$\{X_t\}^T_{t=0}$
preserves its auto-regressive structure under the risk-neutral measure. Note that as a future research avenue, other pricing kernels can be considered. For instance, these associated with essentially affine models defined in Duffee (Reference Duffee2002) are shown in that work to enhance the forecasting ability of the model by generalizing the physical dynamics of term structure factors while retaining the same risk-neutral dynamics.
The DTAFNS model relies on specific choices of parameters mimicking the AFNS model. Zero-coupon bond prices under such specific choices are hereby derived. The proofs for the next results are provided in Appendix A.
Lemma 2.1. For some integer $\tau>0$
and a real number
$\tau>0$
and a real number $r \neq 1$
,
$r \neq 1$
,
 \begin{align}\zeta_0(r,\tau) \equiv \sum_{u=1}^{\tau-1}r^{u} =\dfrac{r-r^{\tau}}{1-r},\end{align}
 \begin{align}\zeta_1(r,\tau) \equiv \sum_{u=1}^{\tau-1}u r^{u} = \dfrac{r- \tau r^{\tau}+(\tau-1) r^{\tau+1}}{(1-r)^2},\end{align}
 \begin{align}\zeta_2(r,\tau) \equiv \sum_{u=1}^{\tau-1}u^2 r^{u} = \dfrac{ -(\tau-1)^2 r^{\tau+2} + (2\tau^2-2\tau-1)r^{\tau+1} - \tau^2 r^{\tau} + r^2+r}{(1-r)^3}.\end{align}
Proposition 2.1. Consider $\lambda\in (0,1)$
and assume
$\lambda\in (0,1)$
and assume
 \begin{equation} \kappa^{\mathbb{Q}} = \left( {\begin{array}{c@{\quad}c@{\quad}c} 0 & 0 & 0 \\[4pt] 0 & \lambda & -\lambda \\[4pt] 0& 0 & \lambda \\[4pt] \end{array}} \right). \end{equation}
In other words, suppose that the state variables $X_t$
have the following risk-neutral dynamics:
$X_t$
have the following risk-neutral dynamics:
 \begin{align*} \left( {\begin{array}{c} X^{(1)}_{t+1}-X^{(1)}_t \\[4pt] X^{(2)}_{t+1}-X^{(2)}_t \\[4pt] X^{(3)}_{t+1}-X^{(3)}_t \\[4pt] \end{array} } \right) = \left( {\begin{array}{c@{\quad}c@{\quad}c} 0 & 0 & 0 \\[4pt] 0 & \lambda & -\lambda \\[4pt] 0& 0 & \lambda \\[4pt] \end{array}} \right) \left[ {\begin{array}{c} \theta^{\mathbb{Q}}_1- X^{(1)}_t \\[4pt] \theta^{\mathbb{Q}}_2- X^{(2)}_t \\[4pt] \theta^{\mathbb{Q}}_3 - X^{(3)}_t \end{array} } \right] + \left( {\begin{array}{c@{\quad}c@{\quad}c} \Sigma_{1,1} & 0 & 0 \\[4pt] 0 & \Sigma_{2,2} & 0 \\[4pt] 0& 0 & \Sigma_{3,3} \\[4pt] \end{array} } \right) \left( {\begin{array}{c} Z^{\mathbb{Q}}_{t+1,1} \\[4pt] Z^{\mathbb{Q}}_{t+1,2} \\[4pt] Z^{\mathbb{Q}}_{t+1,3} \\[4pt] \end{array} } \right).\end{align*}
Then, the time-t arbitrage-free price of a zero-coupon maturing at T is, for $t=0,\ldots,T-1$
,
$t=0,\ldots,T-1$
,
 \begin{equation}P(t,T)= A_\tau\exp \big[{-}\Delta B_\tau^\top X_t\big], \end{equation}
where $\tau=T-t$
,
$\tau=T-t$
, $B_\tau=\left[B^{(1)}_\tau, \,\, B^{(2)}_\tau, \, \, B^{(3)}_\tau\right]^\top$
and
$B_\tau=\left[B^{(1)}_\tau, \,\, B^{(2)}_\tau, \, \, B^{(3)}_\tau\right]^\top$
and
 \begin{align*}B^{(1)}_\tau&= \tau, \quad B^{(2)}_\tau= \dfrac{1-(1-\lambda )^\tau}{\lambda }, \quad B^{(3)}_\tau= \frac{1-(1-\lambda )^{\tau-1}}{\lambda } - (\tau-1) (1-\lambda )^{\tau-1}, \\[4pt]\log A_\tau &= -\Delta\theta^{\mathbb{Q}}_2 \!\left(B^{(1)}_\tau - B^{(2)}_\tau\right) + \Delta \theta^{\mathbb{Q}}_3 B^{(3)}_\tau + \frac{1}{2} \Delta^2\upsilon_\tau\end{align*}
with
 \begin{align*} \upsilon_\tau &= \sum^3_{i=1} \sum^3_{j=1}\upsilon^{(i,j)}_\tau\\[4pt]\upsilon^{(1,1)}_\tau &= \Sigma^2_{1,1}\dfrac{\tau(\tau-1)(2\tau-1)}{6},\\[4pt]\upsilon^{(2,2)}_\tau &= \frac{\Sigma^2_{2,2}}{\lambda ^2} \left( \tau - 2 \!\left[\frac{1-(1-\lambda )^\tau }{\lambda }\right] + \frac{1-(1-\lambda )^{2 \tau}}{1-(1-\lambda )^2}\right),\\[4pt]\upsilon^{(3,3)}_\tau &= \unicode{x1D7D9}_{ \{ \tau > 1\} } \frac{\Sigma^2_{3,3}}{\lambda ^2} \Bigg[ \tau-2 + \zeta_0\!\left( (1-\lambda )^2,\tau-1\right)+\lambda ^2 \zeta_2\!\left( (1-\lambda )^2,\tau-1\right)\\[4pt]& \quad - 2\zeta_0\!\left( (1-\lambda ),\tau-1\right) - 2\lambda \zeta_1\!\left( (1-\lambda ),\tau-1\right) + 2\lambda \zeta_1\!\left( (1-\lambda )^2,\tau-1\right) \bigg],\\[4pt]\upsilon^{(1,2)}_\tau &= \upsilon^{(2,1)}_\tau = \rho_{1,2}\Sigma_{1,1} \Sigma_{2,2} \frac{1}{\lambda }\left( \frac{\tau(\tau-1)}{2} - \zeta_1 ((1-\lambda ),\tau)\right),\\[4pt]\upsilon^{(1,3)}_\tau &= \upsilon^{(3,1)}_\tau = \unicode{x1D7D9}_{ \{ \tau > 1\} } \rho_{1,3}\Sigma_{1,1} \Sigma_{3,3} \frac{1}{\lambda } \bigg[\frac{\tau(\tau-1)}{2}-1 -\zeta_0\!\left( (1-\lambda ),\tau-1\right) \\[4pt] & \quad -(\lambda +1)\zeta_1\!\left( (1-\lambda ),\tau-1\right)-\lambda \zeta_2\!\left( (1-\lambda ),\tau-1\right) \bigg],\\[4pt]\upsilon^{(2,3)}_\tau &= \upsilon^{(3,2)}_\tau = \unicode{x1D7D9}_{ \{ \tau > 1\} } \rho_{2,3}\Sigma_{2,2} \Sigma_{3,3} \bigg( \frac{\tau-2- (2-\lambda )\zeta_0\!\left( (1-\lambda ),\tau-1\right) + (1-\lambda )\zeta_0\!\left( (1-\lambda )^2,\tau-1\right) }{\lambda ^2} \\[4pt] &\quad \quad \quad \quad \quad \quad + \frac{- \zeta_1\!\left( (1-\lambda ),\tau-1\right) + (1-\lambda )\zeta_1\!\left( (1-\lambda )^2,\tau-1\right) }{\lambda } \bigg).\end{align*}
This entails that spot rates have the form
 \begin{equation} y(t,T) = X_t^{(1)} + \dfrac{ (1-(1-\lambda )^\tau)}{\tau \lambda }X_t^{(2)} + \bigg [ \dfrac{ (1- (1-\lambda )^{\tau-1} )}{\tau \lambda } - \dfrac{\tau-1}{\tau} (1-\lambda )^{\tau-1} \bigg ] X_t^{(3)} - \dfrac{1}{\Delta\tau} \log A_\tau.\end{equation}
Remark 2.1. In Proposition 2.1, parameter $\theta^{\mathbb{Q}}_1$
does not appear in the zero-coupon price formula (2.15) and thus can be set to
$\theta^{\mathbb{Q}}_1$
does not appear in the zero-coupon price formula (2.15) and thus can be set to $\theta^{\mathbb{Q}}_1=0$
.
$\theta^{\mathbb{Q}}_1=0$
.
To obtain risk-neutral dynamics of the form proposed in Proposition 2.1, the following physical dynamics is considered:
 \begin{equation*} \kappa^{\mathbb{P}} = \left( {\begin{array}{c@{\quad}c@{\quad}c} \kappa^{\mathbb{P}}_{1,1} & 0 & 0 \\[4pt] 0 & \kappa^{\mathbb{P}}_{2,2} & -\lambda \\[4pt] 0& 0 & \kappa^{\mathbb{P}}_{3,3} \\[4pt] \end{array}} \right), \quad \theta^{\mathbb{P}} = \left( {\begin{array}{c} 0 \\[4pt] \theta^{\mathbb{P}}_2 \\[4pt] \theta_3^{\mathbb{P}} \end{array} } \right)\end{equation*}
which allows meeting the second condition in (2.9) with
 \begin{eqnarray}\gamma &=& \left( {\begin{array}{c@{\quad}c@{\quad}c} \gamma_1 & 0 & 0 \\[4pt] 0 & \gamma_2 & 0 \\[4pt] 0& 0 & \gamma_3 \\[4pt] \end{array}} \right), \quad \gamma_i = \left( \kappa^{\mathbb{P}}_{i,i} -\unicode{x1D7D9}_{ \{i>1\} } \lambda \right)/\Sigma_{i,i}, \, i=1,2,3.\end{eqnarray}
Furthermore, substituting (2.17) in the first equation of (2.9) leads to
 \begin{equation*} \theta_2^{\mathbb{Q}} = \lambda^{-1}\!\left(\kappa_{2,2}^{\mathbb{P}} \theta_2^{\mathbb{P}} + \kappa_{3,3}^{\mathbb{P}} \theta_3^{\mathbb{P}} - \lambda \theta_3^{\mathbb{P}}\right), \quad \theta_3^{\mathbb{Q}} = \lambda^{-1} \kappa_{3,3}^{\mathbb{P}} \theta_3^{\mathbb{P}}.\end{equation*}
Conversely, physical parameters can be retrieved from risk-neutral parameters through
 \begin{equation} \kappa^{\mathbb{P}}_{i,i} = \unicode{x1D7D9}_{ \{i>1\} } \lambda+\Sigma_{i,i}\gamma_i, \, i=1,2,3,\quad \theta_3^{\mathbb{P}}=\lambda \theta_3^{\mathbb{Q}}/\kappa^{\mathbb{P}}_{3,3}, \quad \theta_2^{\mathbb{P}}=\frac{\lambda}{\kappa^{\mathbb{P}}_{2,2}} \left[\theta_2^{\mathbb{Q}} -\frac{\theta_3^{\mathbb{Q}}}{\kappa^{\mathbb{P}}_{3,3}}\left(\kappa^{\mathbb{P}}_{3,3}-\lambda\right) \right].\end{equation}
Remark 2.2. Since $\kappa^{\mathbb{Q}}_{1,1} = 0$
, an alternative specification enforcing
$\kappa^{\mathbb{Q}}_{1,1} = 0$
, an alternative specification enforcing $\kappa^{\mathbb{P}}_{1,1} = 0$
has been tested, but it was ultimately not retained due to lower performance. See Appendix E of the Online Appendix for more details.
$\kappa^{\mathbb{P}}_{1,1} = 0$
has been tested, but it was ultimately not retained due to lower performance. See Appendix E of the Online Appendix for more details.
Remark 2.3. The DTANFS model of this paper is specified slightly differently than in Hong et al. (Reference Hong, Niu and Zeng2019). In the latter work, the matrix $\kappa^{\mathbb{Q}}$
is chosen such that factor loadings
$\kappa^{\mathbb{Q}}$
is chosen such that factor loadings $B_\tau$
exactly match these of the Nelson-Siegel model (2.1). Conversely, this paper emphasizes an auto-regressive representation of factors, i.e. Equation (2.10), which is the discrete-time counterpart of the diffusive dynamics of the AFNS model (2.3). Nevertheless, both specifications of the model are quite similar conceptually. In Hong et al. (Reference Hong, Niu and Zeng2019), only a recursive representation of
$B_\tau$
exactly match these of the Nelson-Siegel model (2.1). Conversely, this paper emphasizes an auto-regressive representation of factors, i.e. Equation (2.10), which is the discrete-time counterpart of the diffusive dynamics of the AFNS model (2.3). Nevertheless, both specifications of the model are quite similar conceptually. In Hong et al. (Reference Hong, Niu and Zeng2019), only a recursive representation of $A_\tau$
is provided, which makes the derivation of the closed-form solution for
$A_\tau$
is provided, which makes the derivation of the closed-form solution for $A_\tau$
a useful contribution of the present work.
$A_\tau$
a useful contribution of the present work.
3. Model estimation
This section presents a method to estimate the DTAFNS model using historical spot curves data. The model is estimated on Canadian interest rate data. The fit performance is analyzed and benchmarked against the discrete-time Gaussian three-factor model of Augustyniak et al. (Reference Augustyniak, Godin and Hamel2021) and a version of the Dynamic Nelson-Siegel model of Diebold & Li (Reference Diebold and Li2006).
3.1. Estimation framework
Several methods have been considered in the literature to estimate factor models of interest rates, such as conventional maximum likelihood estimation (Chen & Scott, Reference Chen and Scott1993), maximum likelihood with Kalman filters (Duan & Simonato, Reference Duan and Simonato1999; Lemke, Reference Lemke2006; Park, Reference Park2014; Augustyniak et al., Reference Augustyniak, Godin and Hamel2021), the method of simulated moments (Dai & Singleton, Reference Dai and Singleton2000), or Bayesian approaches (Hong et al., Reference Hong, Niu and Zeng2019). In this paper, the Kalman filter approach is applied. Observed spot rates (observable data) are considered to be a noisy version of the true spot rates (the signal). Setting up the Kalman filter requires to first derive the recursive Gaussian linear relationship between the observable quantities and factors driving the signal, which is hereby provided.
Assume that on each time t a set of M annualized continuously compounded spot rates with fixed times-to-maturity $n_1, ..., n_M$
are observed, which are denoted by the column vector
$n_1, ..., n_M$
are observed, which are denoted by the column vector
 \begin{equation*}\hat{\textsf{y}}(t) \equiv (\hat{y}(t,t+n_1), ..., \hat{y}(t,t+n_M))^\top.\end{equation*}
Define also the corresponding model-implied spot rate vector
 \begin{equation*} \textsf{y}(t) \equiv \left(y(t,t+n_1),...,y(t,t+n_M)\right)^\top\end{equation*}
where (2.16) leads to
 \begin{align}y(t,t+n) = \dfrac{-1}{n\Delta}\log A_n+\dfrac{1}{n}B_n^\top X_t.\end{align}
The relationship between observed and model-implied spot rate is assumed to be
 \begin{equation*} \hat{\textsf{y}}(t)=\textsf{y}(t)+\eta_{\textsf{t}}\end{equation*}
where $\{\eta_{\textsf{t}}\}^T_{t=1}$
is a multivariate Gaussian white noise with diagonal variance-covariance matrix H. Furthermore, for simplicity, all values on the diagonal of matrix H are assumed to be identical and equal to some parameter h. This leads to
$\{\eta_{\textsf{t}}\}^T_{t=1}$
is a multivariate Gaussian white noise with diagonal variance-covariance matrix H. Furthermore, for simplicity, all values on the diagonal of matrix H are assumed to be identical and equal to some parameter h. This leads to
 \begin{align}\hat{\textsf{y}}(t) &=\textsf{a}+\textsf{B}X_t+\eta_{\textsf{t}}, \end{align}
where
 \begin{align}\textsf{a} & \equiv\left(\dfrac{-1}{n_1\Delta} \log A_{n_1},\dots,\dfrac{-1}{n_M\Delta} \log A_{n_M}\right)^\top,\\\beta_{n} & \equiv\left(\dfrac{B^{(1)}_n}{n},\dfrac{B^{(2)}_n}{n},\dfrac{B^{(3)}_n}{n}\right)^\top, \nonumber\end{align}
 \begin{align}\textsf{B} \equiv \left({\beta}_{n_1},\dots, {\beta}_{n_M}\right)^\top .\qquad\qquad\qquad\qquad\end{align}
Furthermore, the transition equation describing the dynamics of the latent factors $X_t$
is obtained from (2.8):
$X_t$
is obtained from (2.8):
 \begin{equation}X_{t+1}=\textbf{b}+\textbf{D}X_t+{\xi}_{t+1},\end{equation}
where
 \begin{align}\textbf{b}\equiv\kappa^{\mathbb{P}} \theta^{\mathbb{P}},\quad \textbf{D}\equiv I-\kappa^{\mathbb{P}}, \quad {\xi}_{t+1}&\equiv \Sigma Z_{t+1}^{\mathbb{P}}.\end{align}
The sequence $\{\xi_{\textsf{t}}\}^T_{t=1}$
is therefore a multivariate Gaussian white noise with covariance matrix
$\{\xi_{\textsf{t}}\}^T_{t=1}$
is therefore a multivariate Gaussian white noise with covariance matrix
 \begin{equation} \textbf{Q} =\Sigma \rho \Sigma.\end{equation}
The representation (3.2)–(3.5) of state space variables allows estimating the DTAFNS model using a Kalman filter. The general Kalman filter algorithm is presented in Appendix D of the Online Appendix. The Kalman filter allows deriving the log-likelihood of observed spot rate curves for a candidate set of parameters. Algorithm 1 indicates steps to calculate the log-likelihood function in the context of the DTAFNS model. In this algorithm, p denotes joint density functions. In the present work, the implementation of the Kalman filter is performed with the R package FKF. Moreover, to find maximum likelihood estimates of the parameters, consistently with Augustyniak et al. (Reference Augustyniak, Godin and Hamel2021), an optimization of the likelihood is conducted with the R package Rsolnp (Ghalanos & Theussl, Reference Ghalanos and Theussl2015) applying the nonlinear augmented Lagrange multiplier optimization method of Ye (Reference Ye1987). The optimization is performed under the following constraints:
 \begin{equation*} \Sigma_{i,i}\geq 0, \quad h \geq 0, \quad -1 \leq \rho_{i,j} \leq 1, \, i,j=1,2,3, \quad \lambda \in (0,1).\end{equation*}
Additional constraints could be applied to enforce the positive semi-definiteness of matrices $\Sigma$
and
$\Sigma$
and $\rho$
, but optimization results obtained with our dataset satisfy such constraints without explicitly specifying them to the optimizer.
$\rho$
, but optimization results obtained with our dataset satisfy such constraints without explicitly specifying them to the optimizer.
Kalman filter algorithm for the calculation of likelihood function and smoothed state densities

The smoothed state density is the density of time-t factors conditional on all observations from the sample, namely $p(X_{t}|\hat{y}(1),\dots,\hat{y}(T))$
. Such distribution is multivariate Gaussian with mean
$p(X_{t}|\hat{y}(1),\dots,\hat{y}(T))$
. Such distribution is multivariate Gaussian with mean $\bar{x}_{t|T}$
and covariance matrix
$\bar{x}_{t|T}$
and covariance matrix $P_{t|T}$
. Such mean and variance are obtained with the Kalman smoother algorithm (Shumway & Stoffer, Reference Shumway and Stoffer2017) which is also shown in Algorithm 1.
$P_{t|T}$
. Such mean and variance are obtained with the Kalman smoother algorithm (Shumway & Stoffer, Reference Shumway and Stoffer2017) which is also shown in Algorithm 1.
3.2. Model estimation and analysis
This section presents the DTAFNS model estimation using historical Canadian spot rate data.
3.2.1. The dataset
To estimate the model, end-of-month Canadian spot rate curves from January 1986 to January 2022 (434 months) are considered. Such yield curves are provided publicly on the website of the Bank of CanadaFootnote 2 and are constructed through an exponential smoothing methodology described in Bolder et al. (Reference Bolder, Metzler and Johnson2004). 33 spot rate tenors are considered, which include short-end maturities of 3, 6, and 9 months and all integer times-to-maturity from 1 to 30 years.Footnote 3
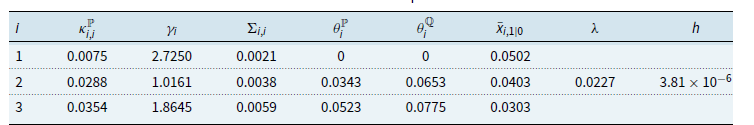
3.2.2. Estimated parameters and performance
Table 1 gives estimates of DTAFNS model parameters obtained with Algorithm 1 which applies the Kalman filter. Factor 1 innovations are negatively correlated with these of the two other factors, which are positively correlated between themselves. The negative correlation between the level factor $X^{(1)}$
and the slope and curvature factors
$X^{(1)}$
and the slope and curvature factors $X^{(2)}$
and
$X^{(2)}$
and $X^{(3)}$
tends to reduce the frequency of very large or low values of the short rate
$X^{(3)}$
tends to reduce the frequency of very large or low values of the short rate $r_t$
. Furthermore, it implies that when the long-term rates increase through higher values of
$r_t$
. Furthermore, it implies that when the long-term rates increase through higher values of $X^{(1)}$
, the slope given by
$X^{(1)}$
, the slope given by $-X^{(2)}$
also tends to go up. Thus, movements in the long-end of the curve are not necessarily matched by movements of a similar magnitude and direction in the short-end. The hump in the curve reflected by
$-X^{(2)}$
also tends to go up. Thus, movements in the long-end of the curve are not necessarily matched by movements of a similar magnitude and direction in the short-end. The hump in the curve reflected by $X^{(3)}$
also tends to decrease during periods of increasing of long-term spot rates. The speed of reversion
$X^{(3)}$
also tends to decrease during periods of increasing of long-term spot rates. The speed of reversion $\kappa^{\mathbb{P}}_{i,i}$
is much lower for the first factor (
$\kappa^{\mathbb{P}}_{i,i}$
is much lower for the first factor ( $i=1$
) than for the other two, which is not surprising due to the overall rates level having had a clear lasting downward trend in the historical sample, representing close-to-non-stationary behavior. Finally, the estimation implies a long-term average of short rates of
$i=1$
) than for the other two, which is not surprising due to the overall rates level having had a clear lasting downward trend in the historical sample, representing close-to-non-stationary behavior. Finally, the estimation implies a long-term average of short rates of $\theta^{\mathbb{P}}_{2}= 0.0301$
under physical dynamics.
$\theta^{\mathbb{P}}_{2}= 0.0301$
under physical dynamics.
Maximum likelihood estimates of the DTAFNS model parameters
 $\rho$
=
$\rho$
= $\displaystyle\left[\begin{array}{c@{\quad}c@{\quad}c} 1 & -0.6303 & -0.4097 \\[4pt] -0.6303 & 1 & 0.2993 \\[4pt] -0.4097 & 0.2993 & 1 \\[4pt] \end{array}\right] $
,
$\displaystyle\left[\begin{array}{c@{\quad}c@{\quad}c} 1 & -0.6303 & -0.4097 \\[4pt] -0.6303 & 1 & 0.2993 \\[4pt] -0.4097 & 0.2993 & 1 \\[4pt] \end{array}\right] $
, $P_{1|0}$
=
$P_{1|0}$
= $\left[\begin{array}{c@{\quad}c@{\quad}c} 4.45\!\times\! 10^{-6} & 0 & 0 \\[4pt] 0 & 4.45\!\times\! 10^{-6} & 0 \\[4pt] 0 & 0 & 4.45\!\times\! 10^{-6} \\[4pt] \end{array}\right] $
Notes: Maximum likelihood parameter estimates for the DTAFNS model presented in Section 2.2 obtained with the Kalman filter (see Algorithm 1). The data sample includes Canadian end-of-month yield curves from January 1986 to January 2022. $\bar{x}_{i,1|0}$
refers to element i of the vector
$\bar{x}_{i,1|0}$
refers to element i of the vector $\bar{x}_{1|0}$
.
$\bar{x}_{1|0}$
.
Fig. 1 shows the smoothed value (the smoothed distribution expected value) of latent factors provided by the Kalman smoother procedure described in Algorithm 1. The black curve is the short rate implied by the model which is obtained by summing the smoothed values of the first two factors, consistently with (2.7). The decreasing trend of the short rate throughout the data sample is recovered by the downward trend of Factor 1. Conversely, Factor 2 and Factor 3, driving the slope and humps in the curve respectively, exhibit more stationary fluctuations.
Model-implied factors and short rate time series. Notes: Time series of DTAFNS model-implied factors which correspond to the smoothed state inferences $ E^{ \mathbb{P}}\!\left[ x_t^{(i)}|\hat{y}(1),\hat{y}(2),..., \hat{y}(T)\right]$
,
$ E^{ \mathbb{P}}\!\left[ x_t^{(i)}|\hat{y}(1),\hat{y}(2),..., \hat{y}(T)\right]$
, $i =1, 2, 3$
provided by Algorithm 1, and implied short rates obtained by summing smoothed values of the first two factors. The model is estimated on the end-of-month Canadian spot rate curves extending from January 1986 to January 2022.
$i =1, 2, 3$
provided by Algorithm 1, and implied short rates obtained by summing smoothed values of the first two factors. The model is estimated on the end-of-month Canadian spot rate curves extending from January 1986 to January 2022.

To assess the ability of the DTAFNS model to match observed short- and long-term spot rates of the term structure, time series of observed spot rates of three-month and 10-year tenors are compared to the model-implied spot rates for the same tenors. Such time series are provided in Fig. 2. The model can be seen to adequately match short- and long-term rates throughout the entire sample, as differences between the model-implied and observed spot rates are very small.
Model-implied and observed spot rate time series for 3-month and 10-year tenors. Notes: Time series of observed 3-month (short-term) and 10-year (long-term) maturity spot rates (dotted curves), with corresponding spot rates implied by the fitted DTAFNS model. The dataset considered is the end-of-month Canadian spot rate curves extending from January 1986 to January 2022.

3.3. Performance assessment and benchmarking
This section analyzes the adequacy of the fit and the predictive performance of the DTAFNS model through benchmarking.
3.3.1. Benchmarks
The discrete-time Gaussian three-factor model of Augustyniak et al. (Reference Augustyniak, Godin and Hamel2021), subsequently referred to as the DG3 model, and a version of the dynamic Nelson-Siegel (DNS) model introduced by Diebold & Li (Reference Diebold and Li2006) are benchmarks considered in this study for comparison of performance results. See Appendix B for a formal specification of these two models. The main differences between DG3 and the DTAFNS model are that (i) the latent factors in the former only regress on themselves instead of allowing cross-factor auto-regressions, (ii) the DTAFNS has a short rate equal to the sum of two of the factors instead of the three as in the benchmark, and (iii) the DTAFNS has a fixed structure for the matrix $\kappa^{\mathbb{Q}}$
driving the auto-regression intensity, unlike the Augustyniak et al. (Reference Augustyniak, Godin and Hamel2021) model allowing optimizing such quantities. Regarding the second benchmark, unlike in the DTAFNS model, the DNS model does not include a deterministic adjustment term in spot rates to rule out arbitrage opportunities. Additionally, a nested version of the DTAFNS model which sets all correlation parameters to zero, i.e.
$\kappa^{\mathbb{Q}}$
driving the auto-regression intensity, unlike the Augustyniak et al. (Reference Augustyniak, Godin and Hamel2021) model allowing optimizing such quantities. Regarding the second benchmark, unlike in the DTAFNS model, the DNS model does not include a deterministic adjustment term in spot rates to rule out arbitrage opportunities. Additionally, a nested version of the DTAFNS model which sets all correlation parameters to zero, i.e. $\rho_{i,j}=0$
,
$\rho_{i,j}=0$
, $i,j=1,2,3$
, is also considered for benchmarking purposes. This benchmark, which is denoted by the acronym DTAFNS-U, is used to evaluate the impact of the innovation correlations on performance. Table 2 shows parameter estimates for the DTAFNS-U model, which are slightly different but qualitatively similar to these of the DTAFNS model presented in Table 1.
$i,j=1,2,3$
, is also considered for benchmarking purposes. This benchmark, which is denoted by the acronym DTAFNS-U, is used to evaluate the impact of the innovation correlations on performance. Table 2 shows parameter estimates for the DTAFNS-U model, which are slightly different but qualitatively similar to these of the DTAFNS model presented in Table 1.
Maximum likelihood estimates of the DTAFNS-U model parameters
 $\rho$
=
$\rho$
= $\displaystyle\left[\begin{array}{c@{\quad}c@{\quad}c} 1 & 0 & 0 \\[4pt] 0 & 1 & 0 \\[4pt] 0 & 0 & 1 \\[4pt] \end{array}\right] $
,
$\displaystyle\left[\begin{array}{c@{\quad}c@{\quad}c} 1 & 0 & 0 \\[4pt] 0 & 1 & 0 \\[4pt] 0 & 0 & 1 \\[4pt] \end{array}\right] $
, $P_{1|0}$
=
$P_{1|0}$
= $\left[\begin{array}{c@{\quad}c@{\quad}c} 4\!\times\! 10^{-6} & 0 & 0 \\[4pt] 0 & 4\!\times\! 10^{-6} & 0 \\[4pt] 0 & 0 & 4\!\times\! 10^{-6} \\[4pt] \end{array}\right] $
Notes: Maximum likelihood parameter estimates for the DTAFNS-U model obtained with the Kalman filter. The DTAFNS-U is identical to the DTAFNS model except that the term structure innovations are uncorrelated, i.e. the matrix $\rho$
is set to the identity matrix. The data sample includes Canadian end-of-month yield curves from January 1986 to January 2022.
$\rho$
is set to the identity matrix. The data sample includes Canadian end-of-month yield curves from January 1986 to January 2022. $\bar{x}_{i,1|0}$
refers to element i of the vector
$\bar{x}_{i,1|0}$
refers to element i of the vector $\bar{x}_{1|0}$
.
$\bar{x}_{1|0}$
.
3.3.2. Goodness-of-fit of the model and forecasting ability
To assess the model’s ability to adequately fit the observed data, we compare the log-likelihood of the DTAFNS, the DTAFNS-U, the DG3 and the DNS models. Two types of log-likelihoods are computed: an in-sample version obtained by fitting the models to the entire dataset, and an out-of-sample version which is obtained by considering an expanding window sequential approach. For the latter, in the first iteration, data from January 1986 up to the end of 2016 is considered as a first training set, and data from 2017 is considered as a test set. In any following iteration, the training sets are expanded by one year and the test year moves to the year following that of the previous iteration. The last iteration has a test set including data for both 2021 and 2022 since the dataset only includes data for January in 2022. The aggregated out-of-sample log-likelihood is obtained by summing these associated with all test sets. Table 3 provides the results. The best-performing model in terms of aggregate log-likelihood over the full sample is the DTAFNS-U. However, when looking at year-by-year performance, the DTAFNS outperforms the DTAFNS-U for the three first years, while only underperforming the latter for the last year. Moreover, the DTAFNS beats both the DG3 and DNS benchmarks out-of-sample for all years except for the DG3 in years 2020 and 2021–2022. While the in-sample log-likelihood of the DG3 is higher than that of the three other competing models, such better fit does not translate to better (out-of-sample) predictive ability. These tests imply that either the DTAFNS or the DTAFNS-U should be favored over the DG3 and DNS benchmarks.
Log-likelihood of the DTAFNS model and its benchmarks

Notes: Comparison of the log-likelihood of the DTAFNS model of Section 2.2 and of the DG3 and DNS benchmarks described in Appendix B. The data sample is the Canadian end-of-month yield curve. The in-sample dataset starts in January 1986 and ends in January 2022. The out-of-sample estimation procedure uses an expanding window approach described in Section 3.3.2. The aggregated out-of-sample log-likelihood is ultimately obtained by summing the log-likelihood for all test years.
To further analyze the predictive ability of the competing interest rate models, Appendix C provides descriptive statistics on out-of-sample point forecasts of spot rates for various tenors. The difference between the performance of the DTAFNS model and that of benchmarks seems overall marginal, with slightly higher (lower) performance exhibited by the DTAFNS for long (medium) tenors. Therefore, our analyses indicate that point forecasting performance of the various models is somewhat similar, but the distributional predictive ability of the DTAFNS model is slightly superior.
To visualize the ability of the DTAFNS model and benchmarks to replicate observed yield curves, Fig. 3 presents the realized spot curves and model-implied counterparts for four selected dates. These four days are the same that are considered in Augustyniak et al. (Reference Augustyniak, Godin and Hamel2021) to display fitting performance, namely December 29, 2006, December 31, 2008, June 30, 2016 and October 31, 2018. Such dates exhibit several spot curve shapes: flat, upward sloping or humped. The figure shows that the DTAFNS and all three benchmarks are able to reproduce observed yield curves reasonably well.
Model-implied and observed yield curves. Notes: Realized and model-implied spot rate curves on the four following dates: December 29, 2006, December 31, 2008, June 30, 2016 and October 31, 2018. Dotted black line: observed spot rates. Full green line: DTAFNS model-implied curve. Dashed blue line: DG3 benchmark implied curve. Red dotted-dashed line: DNS benchmark implied curve. Pink dotted-dashed line: DTAFNS-U benchmark implied curve. The observed data are end-of-month Canadian spot rates provided by the Bank of Canada.

3.3.3. Frequency of negative values
A drawback associated with the use of the Gaussian distribution within interest rate models is the possibility of producing negative short rates. Although negative rates have been observed in some European markets, such phenomenon almost did not occur in North America. To investigate the propensity of the DTAFNS model and its benchmarks to generate negative interest rates, 200,000 five-year monthly paths are simulated under the physical measure with the estimated parameters drawn from Tables 1, 2, B.1 and B.2, respectively, and starting values for factors being their smoothed values on January 2022. Note that the sample period used for the development of the model excludes interest rate hikes that occurred after January 2022. The January 2022 starting point for the simulation therefore explains the large proportion of simulated negative rates.
Table 4 reports (i) the proportion of simulated observations below the thresholds 0, $-0.01$
,
$-0.01$
, $-0.02$
, or
$-0.02$
, or $-0,03$
, and (ii) the proportion of paths with at least one observation below such thresholds. The DTAFNS model significantly reduces such proportions when compared with the DTAFNS-U, the DG3, and the DNS models, which is desirable.
$-0,03$
, and (ii) the proportion of paths with at least one observation below such thresholds. The DTAFNS model significantly reduces such proportions when compared with the DTAFNS-U, the DG3, and the DNS models, which is desirable.
4. An application to mixed fund modeling
One of the main building blocks of the mixed fund (a fund containing both fixed income and equity) model of Augustyniak et al. (Reference Augustyniak, Godin and Hamel2021), which is used for variable annuity pricing, is the underlying factor-based DG3 interest rate model. Since the DTAFNS model is shown herein to improve predictive performance over the DG3 benchmark, it is relevant to adapt the Augustyniak et al. (Reference Augustyniak, Godin and Hamel2021) mixed fund model by replacing the DG3 model with the DTAFNS model.
Probability of observing negative short rates with the DTAFNS model or its benchmarks

Notes: Within $200,\!000$
five-year monthly simulated paths of the DTAFNS model and the DG3 and DNS benchmarks described in Appendix B, the proportion of (i) simulated months with short rates being smaller than, respectively, 0,
$200,\!000$
five-year monthly simulated paths of the DTAFNS model and the DG3 and DNS benchmarks described in Appendix B, the proportion of (i) simulated months with short rates being smaller than, respectively, 0, $-0.01$
,
$-0.01$
, $-0.02$
and
$-0.02$
and $-0.03$
, and (ii) simulated paths with at least one month below such thresholds are reported. Model parameters are drawn from Tables 1, 2, B.1, and B.2, respectively, with starting values of the factors being their smoothed values on January 2022.
$-0.03$
, and (ii) simulated paths with at least one month below such thresholds are reported. Model parameters are drawn from Tables 1, 2, B.1, and B.2, respectively, with starting values of the factors being their smoothed values on January 2022.
4.1. Rolling bond fund returns
The dynamics of the mixed fund model of Augustyniak et al. (Reference Augustyniak, Godin and Hamel2021) involves a regression on movements of interest rate factors, among other quantities. The inclusion of such regressors is justified by an analysis of returns of a rolling bond fund, which are shown to depend on such drivers. Therefore, to adapt the Augustyniak et al. (Reference Augustyniak, Godin and Hamel2021), the rolling bond fund dynamics is derived under the DTAFNS dynamics.
Consider a fund containing a single zero-coupon of time-to-maturity $\tau$
that is rolled-over on each period. Denoting its time-
$\tau$
that is rolled-over on each period. Denoting its time- $t+1$
log-return by
$t+1$
log-return by $R^{(\tau)}_{t+1}$
, (2.15) leads to
$R^{(\tau)}_{t+1}$
, (2.15) leads to
 \begin{align} R^{(\tau)}_{t+1} &=\log \!\left(\dfrac{P(t+1,t+\tau)}{P(t,t+\tau)}\right) \nonumber\\[4pt] &= \log A_{\tau-1} - \log A_{\tau} - \Delta B_{\tau-1}^\top X_{t+1} +\Delta B_\tau^\top X_t\nonumber\\[4pt] &=\log A_{\tau-1} - \log A_{\tau} - \Delta \sum_{i=1}^3 \left( B_{\tau-1}^{(i)} X_{t+1}^{(i)}-B_{\tau}^{(i)}X_{t}^{(i)}\right).\end{align}
Moreover, recalling that $r_t = X_t^{(1)}+X_t^{(2)}$
and using (2.14), (2.18), Lemma A.2 and (4.1), the excess return can be expressed as
$r_t = X_t^{(1)}+X_t^{(2)}$
and using (2.14), (2.18), Lemma A.2 and (4.1), the excess return can be expressed as
 \begin{align} R^{(\tau)}_{t+1} - \Delta r_t &= \log A_{\tau-1} - \log A_{\tau} - \Delta \sum_{i=1}^3 \left( B_{\tau-1}^{(i)} X_{t+1}^{(i)}-(B_{\tau}^{(i)}-1) X_t^{(i)}\right) \nonumber\\& \quad +\Delta \sum_{i=1}^3 X_t^{(i)}- \Delta \!\left(X_t^{(1)}+X_t^{(2)}\right) \nonumber \\[4pt] &= \log A_{\tau-1} - \log A_{\tau} - \Delta \sum_{i=1}^3 \left(B_{\tau-1}^{(i)} X_{t+1}^{(i)}-\left(B_{\tau-1}^{(i)}\left(1-\kappa^{\mathbb{Q}}_{i,i}\right)\right.\right.\nonumber\\& \quad\left.\left.-\unicode{x1D7D9}_{ \{i=3\} } (1-\lambda)^{\tau-1}\right)X_t^{(i)}\right) + \Delta X_t^{(3)}\nonumber \\[4pt] &=\log A_{\tau-1} - \log A_{\tau} - \Delta\! \sum_{i=1}^3 B_{\tau-1}^{(i)}\!\left(X_{t+1}^{(i)}-\left(1-\kappa^{\mathbb{Q}}_{i,i}\right)X_t^{(i)}\right) + \Delta \!\left(1-(1-\lambda)^{\tau - 1}\right)X_t^{(3)}.\end{align}
Mimicking Augustyniak et al. (Reference Augustyniak, Godin and Hamel2021) by considering a portfolio consisting of M positions with weights $\omega_1, \dots, \omega_M$
(where
$\omega_1, \dots, \omega_M$
(where $\sum_{j=1}^M\omega_j=1$
) that are rolled-over on bonds with fixed time-to-maturities
$\sum_{j=1}^M\omega_j=1$
) that are rolled-over on bonds with fixed time-to-maturities $\tau_1, \dots, \tau_M$
, the log-return of the rolling bond fund between times t and
$\tau_1, \dots, \tau_M$
, the log-return of the rolling bond fund between times t and $t+1$
, denoted by
$t+1$
, denoted by $R_{t+1}^{(B)}$
, is approximately characterized by
$R_{t+1}^{(B)}$
, is approximately characterized by
 \begin{align} R^{(B)}_{t+1} - \Delta r_t & \approx \omega_1 R^{(\tau_1)}_{t+1}+\dots+ \omega_M R^{(\tau_M)}_{t+1}-\Delta r_t\nonumber\\[4pt] &=\omega_1\!\left( R^{(\tau_1)}_{t+1}-\Delta r_t\right)+\dots+ \omega_M \!\left(R^{(\tau_M)}_{t+1}-\Delta r_t\right)\nonumber\\[4pt] &=\sum_{j=1}^M\omega_j\bigg(\log A_{\tau_j-1} - \log A_{\tau_j} - \Delta \sum_{i=1}^3 B_{\tau_j-1}^{(i)}\left(X_{t+1}^{(i)}-\left(1-\kappa^{\mathbb{Q}}_{i,i}\right)X_t^{(i)}\right)\nonumber \\[4pt] &\quad + \Delta \!\left(1-(1-\lambda)^{\tau_j - 1}\right)X_t^{(3)}\bigg) \nonumber \\[4pt] &=\sum_{j=1}^M\omega_j\!\left(\log A_{\tau_j-1} - \log A_{\tau_j}\right) - \Delta \sum_{i=1}^3\sum_{j=1}^M\omega_j B_{\tau_j-1}^{(i)}\!\left(X_{t+1}^{(i)}-\left(1-\kappa^{\mathbb{Q}}_{i,i}\right)X_t^{(i)}\right) \nonumber \\[4pt] &\quad + \Delta \sum_{j=1}^M \omega_j\!\left(1-(1-\lambda)^{\tau_j - 1}\right)X_t^{(3)}.\end{align}
Relationship (4.3) will serve as the basis to model the fixed income part of the mixed fund in the proposed model. The key difference with the Augustyniak et al. (Reference Augustyniak, Godin and Hamel2021) model is the presence of the last term proportional to $X_t^{(3)}$
in (4.3), which is not present in their work.
$X_t^{(3)}$
in (4.3), which is not present in their work.
4.2. Risky assets returns
The adaptation of the mixed fund model proposed in this paper keeps the same model for excess equity returns as in Augustyniak et al. (Reference Augustyniak, Godin and Hamel2021). Returns of q equity assets are represented with the exponential generalized auto-regressive conditional heteroskedastic (EGARCH) model of Nelson (1991):
 \begin{align} R_{t+1,j}^{(S)}-\Delta r_t &= \lambda_j^{(S)}\sqrt{h_{t,j}^{(S)}}-\dfrac{1}{2}h_{t,j}^{(S)} + \sqrt{h_{t,j}^{(S)}}Z_{t+1,j}^{(S)},\end{align}
 \begin{align} \log h_{t,j}^{(S)}=\omega^{(S)}_j+\alpha_j^{(S)}Z_{t,j}^{(S)}+\gamma^{(S)}_j\bigg (|Z_{t,j}^{(S)}|-\dfrac{2}{\sqrt{2\pi}}\bigg )+\beta_j^{(S)}\log h_{t-1,j}^{(S)}, \end{align}
where $\big(\omega_j^{(S)}, \alpha_j^{(S)}, \gamma_j^{(S)}, \beta_j^{(S)}\big)$
are parameters associated with the conditional volatility. The process
$\big(\omega_j^{(S)}, \alpha_j^{(S)}, \gamma_j^{(S)}, \beta_j^{(S)}\big)$
are parameters associated with the conditional volatility. The process $\big\{h_{t,j}^{(S)}\big\}_{t=1}^{T-1}$
is
$\big\{h_{t,j}^{(S)}\big\}_{t=1}^{T-1}$
is $\mathcal{F}$
-adapted. Parameters
$\mathcal{F}$
-adapted. Parameters $\lambda_j^{(S)}$
represent equity risk premia. For
$\lambda_j^{(S)}$
represent equity risk premia. For $j=1,\ldots,q$
,
$j=1,\ldots,q$
, $Z_{j}^{(S)} \equiv \big\{Z_{t,j}^{(S)}\big\}_{t=1}^{T}$
are standard Gaussian white noises under
$Z_{j}^{(S)} \equiv \big\{Z_{t,j}^{(S)}\big\}_{t=1}^{T}$
are standard Gaussian white noises under $\mathbb{P}$
, independent of
$\mathbb{P}$
, independent of $Z_{t}$
, where the correlation between
$Z_{t}$
, where the correlation between $Z_{t,i}^{(S)}$
and
$Z_{t,i}^{(S)}$
and $Z_{t,j}^{(S)}$
is denoted
$Z_{t,j}^{(S)}$
is denoted $\Gamma_{i,j}$
.
$\Gamma_{i,j}$
.
As in Augustyniak et al. (Reference Augustyniak, Godin and Hamel2021), the following risk-neutral dynamics for the q equity assets is assumed:
 \begin{align} R_{t+1,j}^{(S)}-\Delta r_t = -\dfrac{1}{2}h_{t,j}^{(S)} + \sqrt{h_{t,j}^{(S)}}Z_{t+1,j}^{\mathbb{Q}(S)}, \end{align}
 \begin{align} \log h_{t,j}^{(S)} =\omega^{(S)}_j+\alpha_j^{(S)}\!\left(Z_{t,j}^{\mathbb{Q}(S)}-\lambda_j^{(S)}\right)+\gamma^{(S)}_j\bigg (|Z_{t,j}^{\mathbb{Q}(S)}-\lambda_j^{(S)}|-\dfrac{2}{\sqrt{2\pi}}\bigg )+\beta_j^{(S)} \log h_{t-1,j}^{(S)}, \end{align}
where, under the risk-neutral measure $\mathbb{Q}$
,
$\mathbb{Q}$
, $\left\{Z_{t,j}^{\mathbb{Q}(S)} \right\}^T_{t=1} = \left\{Z_{t,j}^{(S)} + \lambda_j^{(S)} \right\}^T_{t=1}$
are also standard Gaussian white noises for each
$\left\{Z_{t,j}^{\mathbb{Q}(S)} \right\}^T_{t=1} = \left\{Z_{t,j}^{(S)} + \lambda_j^{(S)} \right\}^T_{t=1}$
are also standard Gaussian white noises for each $j=1,\dots,q$
, still with a contemporaneous correlation matrix
$j=1,\dots,q$
, still with a contemporaneous correlation matrix $\Gamma =[ \Gamma_{i,j}]_{i,j=1}^q$
. The independence between the equity innovations
$\Gamma =[ \Gamma_{i,j}]_{i,j=1}^q$
. The independence between the equity innovations $\left\{Z_{t,j}^{\mathbb{Q}(S)} \right\}^T_{t=1}$
and interest rate innovations
$\left\{Z_{t,j}^{\mathbb{Q}(S)} \right\}^T_{t=1}$
and interest rate innovations $\left\{Z_{t}^{\mathbb{Q}} \right\}^T_{t=1}$
is assumed to also hold under
$\left\{Z_{t}^{\mathbb{Q}} \right\}^T_{t=1}$
is assumed to also hold under $\mathbb{Q}$
.
$\mathbb{Q}$
.
4.3. Mixed fund dynamics
To motivate the structure of the proposed mixed fund model, consider a portfolio invested in the rolling bond fund with weight W and in equity indices with respective weights $\tilde\psi^{(S)}_1,\ldots,\tilde\psi^{(S)}_q$
, where
$\tilde\psi^{(S)}_1,\ldots,\tilde\psi^{(S)}_q$
, where $W+ \sum^q_{j=1} \tilde\psi^{(S)}_j =1 $
. Its excess return would be represented as
$W+ \sum^q_{j=1} \tilde\psi^{(S)}_j =1 $
. Its excess return would be represented as
 \begin{eqnarray}\tilde{R}_{t+1}^{(F)}- \Delta r_t &\approx& W\!\left(R_{t+1}^{(B)} - \Delta r_t\right) + \sum_{j=1}^q \tilde\psi^{(S)}_j \!\left(R_{t+1,j}^{(S)} - \Delta r_t\right)\nonumber\\[4pt] &=& \tilde{\psi}_0+ \sum_{i=1}^3 \tilde{\psi}_i\!\left(X_{t+1}^{(i)}-\left(1\!-\!\kappa^{\mathbb{Q}}_{i,i}\right)X_t^{(i)}\right)\!+ \tilde{\psi}^{\prime}_3 X_t^{(3)}+ \sum_{j=1}^q \tilde\psi^{(S)}_j \!\left(R_{t+1,j}^{(S)} \!-\! \Delta r_t\right)\end{eqnarray}
where
 \begin{align}\tilde{\psi}_0 = W \sum_{j=1}^M\omega_j\left(\log A_{\tau_j-1} - \log A_{\tau_j}\right), \end{align}
 \begin{align} \tilde{\psi}_i = - W \Delta \sum_{j=1}^M\omega_j B_{\tau_j-1}^{(i)},\quad i=1,2,3,\end{align}
 \begin{align} \tilde{\psi}^{\prime}_3 = W \Delta \sum_{j=1}^M \omega_j\!\left(1-(1-\lambda)^{\tau_j - 1}\right).\end{align}
Equation (4.8) serves as the conceptual basis for the proposed mixed fund model. However, instead of relying on (4.9)–(4.11), model parameters can be directly estimated from the data in an econometric fashion. Indeed, allocations to fixed income and equity assets from the mixed funds are not exactly identical to those implied by previous assumptions – that is an investment in a rolling horizon bond fund and in equity indices – and basis risk needs to be taken into account. Moreover, as in Augustyniak et al. (Reference Augustyniak, Godin and Hamel2021), basis risk is further represented through a noise component also following EGARCH dynamics. Mixed fund excess returns are thus assumed to be of the form
 \begin{align} R_{t+1}^{(F)} - \Delta r_t = \psi_0+ \sum_{i=1}^3 \psi_i\!\left(X_{t+1}^{(i)}\!-\!\left(1\!-\!\kappa^{\mathbb{Q}}_{i,i}\right)X_t^{(i)}\right)\!+\! \psi^{\prime}_3 X_t^{(3)}\!+\! \sum_{j=1}^q \psi^{(S)}_j \left(R_{t+1,j}^{(S)} - \Delta r_t\right) \!+\!\sqrt{h^{(F)}_{t}}Z^{(F)}_{t+1}, \end{align}
 \begin{align} \log h_{t}^{(F)} =\omega^{(F)}+\alpha^{(F)}Z_{t}^{(F)}+\gamma^{(F)}\bigg (|Z_{t}^{(F)}|-\dfrac{2}{\sqrt{2\pi}}\bigg)+\beta^{(F)} \log h_{t-1}^{(F)},\end{align}
where the basis risk innovation process $Z^{(F)}=\big\{Z_t^{(F)}\big\}_{t=1}^T$
is a standard Gaussian white noise under
$Z^{(F)}=\big\{Z_t^{(F)}\big\}_{t=1}^T$
is a standard Gaussian white noise under $\mathbb{P}$
, independent of interest rate innovations
$\mathbb{P}$
, independent of interest rate innovations $Z^{\mathbb{P}}$
and equity innovations
$Z^{\mathbb{P}}$
and equity innovations $Z_{j}^{(S)}, j=1,\dots,q$
. Basis risk volatility parameters
$Z_{j}^{(S)}, j=1,\dots,q$
. Basis risk volatility parameters $\big(\omega^{(F)},\alpha^{(F)}, \gamma^{(F)}, \beta^{(F)}\big)$
and linear coefficients
$\big(\omega^{(F)},\alpha^{(F)}, \gamma^{(F)}, \beta^{(F)}\big)$
and linear coefficients $\big(\psi_0,\psi_1,\psi_2, \psi_3,\psi^{\prime}_3,\psi^{(S)}_1,\ldots,\psi^{(S)}_q\big)$
are model parameters to be estimated.
$\big(\psi_0,\psi_1,\psi_2, \psi_3,\psi^{\prime}_3,\psi^{(S)}_1,\ldots,\psi^{(S)}_q\big)$
are model parameters to be estimated.
The risk-neutral dynamics can also be obtained along the lines of Augustyniak et al. (Reference Augustyniak, Godin and Hamel2021) by translating basis risk innovations $\big\{Z_{t}^{(F)} \big\}^T_{t=1}$
by some adapted process
$\big\{Z_{t}^{(F)} \big\}^T_{t=1}$
by some adapted process $\big\{\lambda_{t}^{(F)} \big\}^{T-1}_{t=0}$
: under
$\big\{\lambda_{t}^{(F)} \big\}^{T-1}_{t=0}$
: under $\mathbb{Q}$
, innovations
$\mathbb{Q}$
, innovations $\big\{Z_{t}^{\mathbb{Q}(F)} \big\}^T_{t=1} \equiv \big\{Z_{t}^{(F)} + \lambda^{(F)}_{t-1} \big\}^T_{t=1}$
form a Gaussian white noise independent of risk-neutral term structure and equity innovations
$\big\{Z_{t}^{\mathbb{Q}(F)} \big\}^T_{t=1} \equiv \big\{Z_{t}^{(F)} + \lambda^{(F)}_{t-1} \big\}^T_{t=1}$
form a Gaussian white noise independent of risk-neutral term structure and equity innovations $\big\{Z_{t}^{\mathbb{Q}} \big\}^T_{t=1}$
and
$\big\{Z_{t}^{\mathbb{Q}} \big\}^T_{t=1}$
and $\big\{Z_{t,j}^{\mathbb{Q}(S)} \big\}^T_{t=1}$
, respectively. The determination of the process
$\big\{Z_{t,j}^{\mathbb{Q}(S)} \big\}^T_{t=1}$
, respectively. The determination of the process $\big\{\lambda_{t}^{(F)} \big\}^{T-1}_{t=0}$
stems from the martingale property that must be satisfied by the mixed fund value process. Its value, which characterizes the risk-neutral dynamics of the mixed fund, is provided in the following proposition whose proof is in Appendix A.
$\big\{\lambda_{t}^{(F)} \big\}^{T-1}_{t=0}$
stems from the martingale property that must be satisfied by the mixed fund value process. Its value, which characterizes the risk-neutral dynamics of the mixed fund, is provided in the following proposition whose proof is in Appendix A.
Proposition 4.1. The risk-neutral dynamics of mixed fund excess returns are given by
 \begin{align} R_{t+1}^{(F)}-\Delta r_t = -\dfrac{1}{2}\bigg(\sigma_t^{(F)}\bigg)^2+\sigma_t^{(F)}\epsilon^{\mathbb{Q}(F)}_{t+1} \end{align}
where
 \begin{align} \bigg(\sigma_t^{(F)}\bigg)^2 &\equiv \sum_{i=1}^3\sum_{l=1}^3\psi_i \psi_l \Sigma_{i,i} \Sigma_{l,l}\rho_{i,l}+\sum_{j=1}^{q}\sum_{k=1}^q\psi_j^{(S)}\psi_k^{(S)}\Gamma_{j,k}\sqrt{h_{t,j}^{(S)}h_{t,k}^{(S)}}+h_t^{(F)}, \\[4pt] \phi_t &\equiv \psi_0 + \sum_{i=1}^3 \psi_i \!\left( \kappa^{\mathbb{Q}}_{i,i} \theta^{\mathbb{Q}}_i -\lambda \theta^{\mathbb{Q}}_3 \unicode{x1D7D9}_{ \{ i=2\} } \right) + (\psi_2 \lambda +\psi^{\prime}_3) X_t^{(3)} - \sum_{j=1}^q \psi_j^{(S)} \left( \dfrac{1}{2}h_{t,j}^{(S)}\right), \nonumber \\[4pt] \epsilon^{\mathbb{Q}(F)}_{t+1}& \equiv \dfrac{\sum_{i=1}^p\psi_i\Sigma_{i,i} Z_{t+1}^{\mathbb{Q}(i)}+\sum_{j=1}^q\psi_j^{(S)}\sqrt{h_{t,j}^{(S)}}Z_{t+1,j}^{\mathbb{Q}(S)}+\sqrt{h_{t}^{(F)}}Z_{t+1}^{\mathbb{Q}(F)}}{\sigma_t^{(F)}}, \nonumber \\[4pt] \log h_{t}^{(F)}&=\omega^{(F)}+\alpha^{(F)}\!\left(Z_{t}^{\mathbb{Q}(F)}-\lambda_{t-1}^{(F)}\right)+\gamma^{(F)}\bigg (|Z_{t}^{\mathbb{Q}(F)}-\lambda_{t-1}^{(F)}|-\dfrac{2}{\sqrt{2\pi}}\bigg )+\beta^{(F)} \log h_{t-1}^{(F)}, \nonumber \\[4pt] \lambda_{t}^{(F)} \equiv& \dfrac{1}{\sqrt{h_t^{(F)}}}\Bigg[\phi_t+\dfrac{1}{2}\bigg(\sigma_t^{(F)}\bigg)^2\bigg]. \nonumber\end{align}
and the process $\left\{\epsilon^{\mathbb{Q}(F)}_{t+1}\right\}^T_{t=1}$
is a sequence of independent standardized Gaussian variables under
$\left\{\epsilon^{\mathbb{Q}(F)}_{t+1}\right\}^T_{t=1}$
is a sequence of independent standardized Gaussian variables under $\mathbb{Q}$
.
$\mathbb{Q}$
.
4.4. Estimation of the mixed fund model
The mixed fund model developed above is estimated on real data. The equity model (4.4) and (4.5) is estimated for two equity assets ( $q=2$
), namely the S&P/TSX Composite and S&P 500 stock indices. For the mixed fund model (4.12)–(4.13), we consider the Assumption/Louisbourg Balanced Fund A.Footnote 4 This is a mixed bond and equity fund composed approximately of 39% of Canadian fixed income, 36% of Canadian equity, 15% of US equity, and 10% of other products. Monthly price return data (NAV returns for the mixed fund) in Canadian currency from February 1986 (from February 1996 for the mixed fund) to January 2022 are considered, a span that matches the term structure data used in earlier sections. Note that for the mixed fund, 14 out of the 326 monthly returns are missing values.
$q=2$
), namely the S&P/TSX Composite and S&P 500 stock indices. For the mixed fund model (4.12)–(4.13), we consider the Assumption/Louisbourg Balanced Fund A.Footnote 4 This is a mixed bond and equity fund composed approximately of 39% of Canadian fixed income, 36% of Canadian equity, 15% of US equity, and 10% of other products. Monthly price return data (NAV returns for the mixed fund) in Canadian currency from February 1986 (from February 1996 for the mixed fund) to January 2022 are considered, a span that matches the term structure data used in earlier sections. Note that for the mixed fund, 14 out of the 326 monthly returns are missing values.
Tables 5 and 6 respectively show maximum likelihood estimated parameter and corresponding standard errors for the equity model (4.4)–(4.5) and the mixed fund model (4.12)–(4.13).Footnote 5 Note that initial variances $h^{(S)}_{0,j}$
,
$h^{(S)}_{0,j}$
, $j=1,2$
and
$j=1,2$
and $h^{(F)}_0$
are also considered as parameters to optimize during the estimation. Equity indices are highly correlated with
$h^{(F)}_0$
are also considered as parameters to optimize during the estimation. Equity indices are highly correlated with $\Gamma_{1,2}=0.753$
. Furthermore, the persistence of the volatility for both indices is high and similar, with
$\Gamma_{1,2}=0.753$
. Furthermore, the persistence of the volatility for both indices is high and similar, with $\beta_1^{(S)}=0.628$
for the S&P TSX Composite and
$\beta_1^{(S)}=0.628$
for the S&P TSX Composite and $\beta_2^{(S)}=0.697$
the S&P 500. Furthermore, the presence of a leverage effect is implied by negative values of
$\beta_2^{(S)}=0.697$
the S&P 500. Furthermore, the presence of a leverage effect is implied by negative values of $\alpha_j^{(S)}$
,
$\alpha_j^{(S)}$
, $j=1,2$
. For the mixed fund model, all parameter estimates are significant at the 99% confidence level. Negative values for estimates of coefficient
$j=1,2$
. For the mixed fund model, all parameter estimates are significant at the 99% confidence level. Negative values for estimates of coefficient $\psi_i$
,
$\psi_i$
, $i=1,2$
reflect negative correlation between variations of the short rate and returns of the mixed fund. This is expected due to the fund being partially invested in fixed income, where bond prices are inversely related to interest rates. Interestingly, the estimate of coefficient
$i=1,2$
reflect negative correlation between variations of the short rate and returns of the mixed fund. This is expected due to the fund being partially invested in fixed income, where bond prices are inversely related to interest rates. Interestingly, the estimate of coefficient $\psi^{\prime}_3$
, a parameter not present in the Augustyniak et al. (Reference Augustyniak, Godin and Hamel2021) model, is also significant and negative. It implies that mixed fund returns are negatively related to the humpiness of the term structure (and not only to changes in humpiness).
$\psi^{\prime}_3$
, a parameter not present in the Augustyniak et al. (Reference Augustyniak, Godin and Hamel2021) model, is also significant and negative. It implies that mixed fund returns are negatively related to the humpiness of the term structure (and not only to changes in humpiness).
Bivariate EGARCH equity model parameter estimates

Notes: Maximum likelihood estimates and standard errors (in parentheses) of the equity model (4.4)–(4.5). Indices $j=1$
and
$j=1$
and $j=2$
are respectively the S&P/TSX Composite and the S&P 500. The estimation is performed on monthly price return time series extending from February 1986 to January 2022 (432 returns by index).
$j=2$
are respectively the S&P/TSX Composite and the S&P 500. The estimation is performed on monthly price return time series extending from February 1986 to January 2022 (432 returns by index).
The performance of our mixed fund model (4.12)–(4.13) is compared to that of Augustyniak et al. (Reference Augustyniak, Godin and Hamel2021), which basically imposes the constraint $\psi^{\prime}_3=0$
and uses the DG3 instead of the DTAFNS model for the computation of smoothed values for term structure factors X. Our model has an in-sample log-likelihood of
$\psi^{\prime}_3=0$
and uses the DG3 instead of the DTAFNS model for the computation of smoothed values for term structure factors X. Our model has an in-sample log-likelihood of $1038.719$
, whereas that of the Augustyniak et al. (Reference Augustyniak, Godin and Hamel2021) benchmark is
$1038.719$
, whereas that of the Augustyniak et al. (Reference Augustyniak, Godin and Hamel2021) benchmark is $1035.714$
. Such reported figures are conditional log-likelihood for the mixed fund returns specification given smoothed values of the term structure factors for each respective models and equity index returns. Since the use of our mixed fund model does not lead to a deterioration in fitting performance, and since such model is compatible with the DTAFNS model which has arguably more favorable properties than the DG3 counterpart, the use of our mixed fund model shall be preferred over that of Augustyniak et al. (Reference Augustyniak, Godin and Hamel2021).
$1035.714$
. Such reported figures are conditional log-likelihood for the mixed fund returns specification given smoothed values of the term structure factors for each respective models and equity index returns. Since the use of our mixed fund model does not lead to a deterioration in fitting performance, and since such model is compatible with the DTAFNS model which has arguably more favorable properties than the DG3 counterpart, the use of our mixed fund model shall be preferred over that of Augustyniak et al. (Reference Augustyniak, Godin and Hamel2021).
Mixed fund model parameter estimates

5. Conclusion
This paper develops a discrete-time version of the arbitrage-free Nelson-Siegel model for dynamic term structure modeling which is slightly different than but similar to that in Hong et al. (Reference Hong, Niu and Zeng2019). A closed-form solution for the price of risk-free zero-coupon bonds is obtained, which makes it possible to devise a convenient Kalman filter-based joint estimation procedure for physical and risk-neutral dynamics of factors driving the term structure. The estimation of the model on historical data for the Canadian spot curve reveal that the model accurately represents term structure movements and possesses superior distributional predictive power in comparison to some version of the dynamic Nelson-Siegel model and to a discrete-time G3 model previously proposed by Augustyniak et al. (Reference Augustyniak, Godin and Hamel2021), at least for the considered dataset. The discrete-time arbitrage-free Nelson-Siegel model also has two other advantages over the latter benchmark: it tends to produce less frequent negative short rates and it provides better interpretability for the three factors underlying the model. Finally, the mixed fund model of Augustyniak et al. (Reference Augustyniak, Godin and Hamel2021) characterizing the dynamics of a mutual fund invested in both equity and fixed income is adapted to integrate the discrete-time arbitrage-free Nelson-Siegel model as its component to depict interest rates dynamics.
Supplementary material
To view supplementary material for this article, please visit https://doi.org/10.1017/S1748499524000010
Acknowledgements
We thank the anonymous referee for their valuable feedback which helped improving the paper.
Data availability statement
The R code allowing for the replication of our results is made available in the following GitHub repository: https://github.com/FredericGodinQC/DTAFNS_model.
Funding statement
We thank the Natural Sciences and Engineering Research Council of Canada (Godin: RGPIN-2017-06837, Gaillardetz: RGPIN-2020-06821) and the Canadian Institute of Actuaries for their financial support.
Competing interests
We have no conflict of interest or competing interests to declare in relation to this project.
Appendix A. Proofs
In this section, proofs to several results mentioned in the body of the manuscript are provided.
To prove Proposition 2.1, the following lemma is needed.
Lemma A.1. Assume (2.10) holds. For $t=0,\ldots,T$
and
$t=0,\ldots,T$
and $n=0,\ldots,T-t$
,
$n=0,\ldots,T-t$
,
 \begin{align} X^{(i)}_{t+n}& = X^{(i)}_{t}\left(1-\kappa^{\mathbb{Q}}_{i,i}\right)^{n}+\kappa^{\mathbb{Q}}_{i,i} \theta^{\mathbb{Q}}_i \sum_{l=1}^{n}\left(1-\kappa^{\mathbb{Q}}_{i,i}\right)^{(n-l)}+\Sigma_{i,i}\sum_{l=1}^{n}Z^{\mathbb{Q}}_{t+l,i}\left(1-\kappa^{\mathbb{Q}}_{i,i}\right)^{(n-l)}\nonumber\\[4pt] &\quad +\sum_{l=1}^{n}\sum_{j\neq i}^3 \kappa^{\mathbb{Q}}_{i,j} \!\left(\theta^{\mathbb{Q}}_j-X^{(j)}_{t+l-1}\right) \left(1-\kappa^{\mathbb{Q}}_{i,i}\right)^{(n-l)} .\end{align}
Proof of Lemma A.1: The proof relies on induction. The case $n=0$
is trivial when using the convention
$n=0$
is trivial when using the convention $\sum_{l=1}^{0} x_l \equiv 0$
for any sequence of real numbers
$\sum_{l=1}^{0} x_l \equiv 0$
for any sequence of real numbers $\{x_l\}$
.
$\{x_l\}$
.
Then, assume (A.1) holds for some $n<T-t-1$
. Using (2.10), for any
$n<T-t-1$
. Using (2.10), for any $i=1,2,3$
,
$i=1,2,3$
,
 \begin{align*}X^{(i)}_{t+n+1}& = X^{(i)}_{t+n}+\sum_{j=1}^{3}\kappa^{\mathbb{Q}}_{i,j}\!\left(\theta ^{\mathbb{Q}}_j-X^{(j)}_{t+n}\right)+\Sigma_{i,i}Z^{\mathbb{Q}}_{t+n+1,i}\\[4pt]& =X^{(i)}_{t+n}\!\left(1-\kappa^{\mathbb{Q}}_{i,i}\right)+ \kappa^{\mathbb{Q}}_{i,i}\theta^{\mathbb{Q}}_i +\sum_{j\neq i}^{3}\kappa^{\mathbb{Q}}_{i,j}\!\left(\theta ^{\mathbb{Q}}_j-X^{(j)}_{t+n}\right)+\Sigma_{i,i}Z^{\mathbb{Q}}_{t+n+1,i}.\end{align*}
Applying (A.1) in the latter equality yields
 \begin{align*}X^{(i)}_{t+n+1}&= X^{(i)}_{t}\!\left(1-\kappa^{\mathbb{Q}}_{i,i}\right)^{n+1}+\kappa^{\mathbb{Q}}_{i,i}\theta^{\mathbb{Q}}_i \sum_{l=1}^{n}\!\left(1-\kappa^{\mathbb{Q}}_{i,i}\right)^{(n+1-l)}+\Sigma_{i,i}\sum_{l=1}^{n}Z^{\mathbb{Q}}_{t+l,i}\!\left(1-\kappa^{\mathbb{Q}}_{i,i}\right)^{(n+1-l)}\\[4pt]&+\sum_{l=1}^{n}\sum_{j\neq i}^{3}\kappa^{\mathbb{Q}}_{i,j}\!\left(\theta ^{\mathbb{Q}}_j-X^{(j)}_{t+l-1}\right)\left(1-\kappa^{\mathbb{Q}}_{i,i}\right)^{(n+1-l)} + \kappa^{\mathbb{Q}}_{i,i}\theta^{\mathbb{Q}}_i +\sum_{j\neq 1}^{3}\kappa^{\mathbb{Q}}_{i,j}\!\left(\theta ^{\mathbb{Q}}_j-X^{(j)}_{t+n}\right)\nonumber\\[5pt]&+\Sigma_{i,i}Z^{\mathbb{Q}}_{t+n+1,i}\\[4pt] &= X^{(i)}_{t}\!\left(1-\kappa^{\mathbb{Q}}_{i,i}\right)^{n+1}+\kappa^{\mathbb{Q}}_{i,i}\theta^{\mathbb{Q}}_i \sum_{l=1}^{n+1}\left(1-\kappa^{\mathbb{Q}}_{i,i}\right)^{(n+1-l)}+\Sigma_{i,i}\sum_{l=1}^{n+1}Z^{\mathbb{Q}}_{t+l,i}\!\left(1-\kappa^{\mathbb{Q}}_{i,i}\right)^{(n+1-l)}\\[4pt]&+\sum_{l=1}^{n+1}\sum_{j\neq i}^{3}\kappa^{\mathbb{Q}}_{i,j}\!\left(\theta ^{\mathbb{Q}}_j-X^{(j)}_{t+l-1}\right)\left(1-\kappa^{\mathbb{Q}}_{i,i}\right)^{(n+1-l)}, \end{align*}
hence completing the induction.
Remark A.1. The result of Lemma A.1 is also valid under the $\mathbb{P}$
-measure, i.e. when replacing all
$\mathbb{P}$
-measure, i.e. when replacing all $\mathbb{Q}$
’s with
$\mathbb{Q}$
’s with $\mathbb{P}$
’s in the statement of the lemma and the proof.
$\mathbb{P}$
’s in the statement of the lemma and the proof.
Proof of Lemma 2.1: Equation (2.11) is trivial. To show (2.12),
 \begin{align} \sum_{u=1}^{\tau-1}u r^{u} \notag &= \sum_{u=1}^{\tau-1}r\frac{d}{dr} r^{u} \notag\\[4pt] &= r\frac{d}{dr} \sum_{u=1}^{\tau-1} r^{u} \notag\\[4pt] &= r\frac{(1-\tau r^{\tau-1})(1-r) +(r-r^{\tau}) }{(1-r)^2} \notag\\[4pt] &=r \dfrac{1- \tau r^{\tau-1}+\tau r^{\tau}-r^\tau}{(1-r)^2} \notag\\[4pt] &= \dfrac{r- \tau r^{\tau}+(\tau-1) r^{\tau+1}}{(1-r)^2}. \notag\end{align}
Finally, to show (2.13),
 \begin{align*} \sum_{u=1}^{\tau-1}u^2 r^{u} &= r \sum_{u=1}^{\tau-1}u \frac{d}{d r} r^{u} \\[4pt] &= r \frac{d}{d r} \sum_{u=1}^{\tau-1}u r^{u} \\[4pt] &= r \frac{d}{d r} \dfrac{r- \tau r^{\tau}+(\tau-1) r^{\tau+1}}{(1-r)^2} \\[4pt] &= r \dfrac{(1-r)^2[1- \tau^2 r^{\tau-1}+(\tau+1)(\tau-1) r^{\tau}] + 2(1-r)[r- \tau r^{\tau}+(\tau-1) r^{\tau+1}]}{(1-r)^4} \\[4pt] &= \dfrac{[r-r^2 - \tau^2 r^{\tau} + \tau^2 r^{\tau+1}+ (\tau+1)(\tau-1) r^{\tau+1}-(\tau+1)(\tau-1) r^{\tau+2}] + 2[r^2- \tau r^{\tau+1}+(\tau-1) r^{\tau+2}]}{(1-r)^3} \\[4pt] &= \dfrac{ -(\tau-1)^2 r^{\tau+2} + (2\tau^2-2\tau-1)r^{\tau+1} - \tau^2 r^{\tau} + r^2+r}{(1-r)^3}.\end{align*}
Proof of Proposition 2.1: From (2.7), for any $\tau = 1,\ldots,T-t$
,
$\tau = 1,\ldots,T-t$
,
 \begin{align*}\sum_{s=0}^{\tau-1}r_{t+s}=\sum_{s=0}^{\tau-1}X^{(1)}_{t+s}+\sum_{s=0}^{\tau-1}X^{(2)}_{t+s}.\end{align*}
Furthermore, since $\kappa^{\mathbb{Q}}_{1,j}=0$
for
$\kappa^{\mathbb{Q}}_{1,j}=0$
for $j=1,\ldots,3$
, Equation (A.1) leads to
$j=1,\ldots,3$
, Equation (A.1) leads to

Moreover, relying again on Equation (A.1) and recalling that $\kappa^{\mathbb{Q}}_{2,1}=0$
,
$\kappa^{\mathbb{Q}}_{2,1}=0$
, $\kappa^{\mathbb{Q}}_{2,2}=\lambda$
and
$\kappa^{\mathbb{Q}}_{2,2}=\lambda$
and $\kappa^{\mathbb{Q}}_{2,3}=-\lambda$
,
$\kappa^{\mathbb{Q}}_{2,3}=-\lambda$
,
 \begin{align}\sum_{s=0}^{\tau-1}X^{(2)}_{t+s}&=\sum_{s=0}^{\tau-1} \bigg \lbrace X^{(2)}_{t}(1-\lambda )^s + \lambda \theta^{\mathbb{Q}}_2\sum_{l=1}^{s}(1-\lambda )^{s-l}+\Sigma_{2,2}\sum_{l=1}^{s}Z^{\mathbb{Q}}_{t+l,2}(1-\lambda )^{s-l} \notag\\[4pt]&- \lambda \sum_{l=1}^{s}(1-\lambda )^{s-l}\theta^{\mathbb{Q}}_3 +\lambda \sum_{l=1}^{s}(1-\lambda )^{s-l}X^{(3)}_{t+l-1}\bigg \rbrace \notag\\[4pt]&=X^{(2)}_{t}\sum_{s=0}^{\tau-1}(1-\lambda )^s + \lambda \theta ^{\mathbb{Q}}_2\sum_{s=1}^{\tau-1}\sum_{l=1}^{s}(1-\lambda )^{s-l}+\Sigma_{2,2}\sum_{s=1}^{\tau-1}\sum_{l=1}^{s}(1-\lambda )^{s-l}Z^{\mathbb{Q}}_{t+l,2} \notag\\[4pt]&- \lambda \theta^{\mathbb{Q}}_3\sum_{s=1}^{\tau-1}\sum_{l=1}^{s}(1-\lambda )^{s-l} +\lambda \sum_{s=1}^{\tau-1}\sum_{l=1}^{s}(1-\lambda )^{s-l}X^{(3)}_{t+l-1} \notag\\[4pt]&=X^{(2)}_{t}\sum_{s=0}^{\tau-1}(1-\lambda )^s + \lambda \!\left(\theta^{\mathbb{Q}}_2 - \theta^{\mathbb{Q}}_3\right) \sum_{s=1}^{\tau-1}\sum_{l=0}^{s-1}(1-\lambda )^{l}\nonumber\\& \quad +\sum_{s=1}^{\tau-1}\sum_{l=1}^{\tau-1}\unicode{x1D7D9}_{ \lbrace l \leq s \rbrace } (1-\lambda )^{s-l} \left(\Sigma_{2,2} Z^{\mathbb{Q}}_{t+l,2}+ \lambda X^{(3)}_{t+l-1}\right) \notag\\[4pt]&=X^{(2)}_{t}\sum_{s=0}^{\tau-1}(1-\lambda )^s + \lambda \!\left(\theta^{\mathbb{Q}}_2 - \theta^{\mathbb{Q}}_3\right) \sum_{s=1}^{\tau-1} \frac{1-(1-\lambda )^s}{\lambda }\nonumber\\&\quad + \sum_{l=1}^{\tau-1}\sum_{s=1}^{\tau-1}\unicode{x1D7D9}_{ \lbrace l \leq s \rbrace } (1-\lambda )^{s-l} \left(\Sigma_{2,2} Z^{\mathbb{Q}}_{t+l,2}+ \lambda X^{(3)}_{t+l-1}\right) \notag\\[4pt]&=X^{(2)}_{t}\dfrac{1-(1-\lambda )^\tau}{\lambda }+\left( \theta^{\mathbb{Q}}_2-\theta^{\mathbb{Q}}_3\right)\left(\tau -1 -\dfrac{1-\lambda -(1-\lambda )^\tau}{\lambda }\right) \notag\\[4pt]&+ \sum_{l=1}^{\tau-1} \left(\Sigma_{2,2} Z^{\mathbb{Q}}_{t+l,2}+ \lambda X^{(3)}_{t+l-1}\right)\sum_{s=1}^{\tau-1}\unicode{x1D7D9}_{ \lbrace l \leq s \rbrace } (1-\lambda )^{s-l}. \end{align}
Note that
 \begin{align}\sum_{s=1}^{\tau-1}\unicode{x1D7D9}_{ \lbrace l \leq s \rbrace } (1-\lambda )^{s-l}=&\sum_{s=l}^{\tau-1} (1-\lambda )^{s-l} =\sum_{s=0}^{\tau-1-l}(1-\lambda )^{s}=\dfrac{1-(1-\lambda )^{\tau-l}}{\lambda }.\end{align}
 \begin{align}\sum_{s=0}^{\tau-1}X^{(2)}_{t+s} =& X^{(2)}_{t}\dfrac{1-(1-\lambda )^\tau}{\lambda }+\left( \theta^{\mathbb{Q}}_2-\theta^{\mathbb{Q}}_3\right)\left(\tau -1 -\dfrac{1-\lambda -(1-\lambda )^\tau}{\lambda }\right) \notag\\[4pt]&+ \Sigma_{2,2}\sum_{l=1}^{\tau-1} Z^{\mathbb{Q}}_{t+l,2} \dfrac{1-(1-\lambda )^{\tau-l}}{\lambda } + \sum_{l=1}^{\tau-1} \left[1-(1-\lambda )^{\tau-l} \right] X^{(3)}_{t+l-1}. \end{align}
Additionally, combining (A.1) with $\kappa^{\mathbb{Q}}_{3,1}=\kappa^{\mathbb{Q}}_{3,2}=0$
and
$\kappa^{\mathbb{Q}}_{3,1}=\kappa^{\mathbb{Q}}_{3,2}=0$
and $\kappa^{\mathbb{Q}}_{3,3}=\lambda$
leads to
$\kappa^{\mathbb{Q}}_{3,3}=\lambda$
leads to
 \begin{align}&\sum_{l=1}^{\tau-1} \left[1-(1-\lambda )^{\tau-l} \right] X^{(3)}_{t+l-1} \nonumber\\[4pt]&= \sum_{l=0}^{\tau-2} \left[1-(1-\lambda )^{\tau-l-1} \right] X^{(3)}_{t+l} \nonumber\\[4pt]&= \sum_{l=0}^{\tau-2} \left[1-(1-\lambda )^{\tau-l-1} \right] \left[X^{(3)}_{t}(1-\lambda )^{l}+\lambda \theta^{\mathbb{Q}}_3 \sum_{k=1}^{l}(1-\lambda )^{(l-k)}+\Sigma_{3,3}\sum_{k=1}^{l}Z^{\mathbb{Q}}_{t+k,3}(1-\lambda )^{(l-k)} \right]\nonumber\\[4pt] &= X^{(3)}_{t} \!\left( \sum_{l=0}^{\tau-2} (1-\lambda )^l - \sum_{l=0}^{\tau-2} (1-\lambda )^{\tau-1} \right) + \lambda \theta^{\mathbb{Q}}_3 \sum_{l=0}^{\tau-2} \frac{1-(1-\lambda )^l-(1-\lambda )^{\tau -l-1}+(1-\lambda )^{\tau - 1}}{\lambda } \nonumber \\[4pt]&+ \Sigma_{3,3} \sum_{l=0}^{\tau-2} \sum_{k=1}^{\tau-2} \unicode{x1D7D9}_{\{k \leq l\}} Z^{\mathbb{Q}}_{t+k,3} \!\left[(1-\lambda )^{(l-k)} -(1-\lambda )^{\tau-k-1} \right] \nonumber\\[4pt] &= X^{(3)}_{t} \!\left( \frac{1-(1-\lambda )^{\tau-1}}{\lambda } - (\tau-1) (1-\lambda )^{\tau-1} \right)\nonumber\\& + \theta^{\mathbb{Q}}_3 \sum_{l=0}^{\tau-2} \left( 1-(1-\lambda )^l - (1-\lambda )^{\tau -l-1}+(1-\lambda )^{\tau - 1} \right)\nonumber\\[4pt] &\quad + \Sigma_{3,3} \sum_{k=1}^{\tau-2} Z^{\mathbb{Q}}_{t+k,3} \sum_{l=k}^{\tau-2} \left[(1-\lambda )^{(l-k)} -(1-\lambda )^{\tau-k-1} \right] \nonumber\\[4pt] &= X^{(3)}_{t} \!\left( \frac{1-(1-\lambda )^{\tau-1}}{\lambda } - (\tau-1) (1-\lambda )^{\tau-1} \right) + \theta^{\mathbb{Q}}_3 \bigg( \left(\tau - 1\right)\left(1+(1-\lambda )^{\tau - 1}\right) \nonumber \\[4pt]&\quad - \dfrac{2- (1-\lambda )^{\tau-1}-\lambda - (1-\lambda )^{\tau}}{\lambda }\bigg)\nonumber\\& + \Sigma_{3,3} \sum_{k=1}^{\tau-2} Z^{\mathbb{Q}}_{t+k,3} \!\left[ \frac{1-(1-\lambda )^{(\tau-1-k)}}{\lambda } -(1-\lambda )^{\tau-k-1}(\tau-1-k) \right]. \end{align}
 \begin{align}\sum_{s=0}^{\tau-1}X^{(2)}_{t+s} =& X^{(2)}_{t}\dfrac{1-(1-\lambda )^\tau}{\lambda }+ X^{(3)}_{t} \!\left( \frac{1-(1-\lambda )^{\tau-1}}{\lambda } - (\tau-1) (1-\lambda )^{\tau-1} \right) \notag\\[4pt]&+ \theta^{\mathbb{Q}}_2 \!\left(\tau -1 -\dfrac{1-\lambda -(1-\lambda )^\tau}{\lambda }\right) + \theta^{\mathbb{Q}}_3 \!\left( (\tau - 1)(1-\lambda )^{\tau - 1}-\dfrac{1-(1-\lambda )^{\tau - 1}}{\lambda }\right) \notag\\[4pt] & +\Sigma_{2,2}\sum_{l=1}^{\tau-1} Z^{\mathbb{Q}}_{t+l,2} \dfrac{1-(1-\lambda )^{\tau-l}}{\lambda }\nonumber\\&+ \Sigma_{3,3} \sum_{k=1}^{\tau-2} Z^{\mathbb{Q}}_{t+k,3} \!\left[ \frac{1-(1-\lambda )^{(\tau-1-k)}}{\lambda } -(1-\lambda )^{\tau-k-1}(\tau-1-k) \right]. \end{align}
Define $R_{t,T} \equiv \Delta \sum^{T-1}_{j=t} r_j = \Delta \sum^{T-1}_{j=0} X^{(1)}_{t+j} + X^{(2)}_{t+j}$
. Define also
$R_{t,T} \equiv \Delta \sum^{T-1}_{j=t} r_j = \Delta \sum^{T-1}_{j=0} X^{(1)}_{t+j} + X^{(2)}_{t+j}$
. Define also
 \begin{align*}B^{(1)}_\tau&= \tau, \quad B^{(2)}_\tau= \dfrac{1-(1-\lambda )^\tau}{\lambda }, \quad B^{(3)}_\tau= \frac{1-(1-\lambda )^{\tau-1}}{\lambda } - (\tau-1) (1-\lambda )^{\tau-1}.\end{align*}
Based on (A.2) and (A.7), given $\mathcal{F}_t$
,
$\mathcal{F}_t$
, $-R_{t,T}$
has a Gaussian distribution with mean
$-R_{t,T}$
has a Gaussian distribution with mean
 \begin{align*} & -\Delta\sum_{j=1}^3 B^{(j)}_\tau X^{(j)}_t -\Delta\theta^{\mathbb{Q}}_2 \!\left(\tau -1 -\dfrac{1-\lambda -(1-\lambda )^\tau}{\lambda }\right)\nonumber\\& \quad - \Delta \theta^{\mathbb{Q}}_3 \!\left( (\tau - 1)(1-\lambda )^{\tau - 1}-\dfrac{1-(1-\lambda )^{\tau - 1}}{\lambda }\right)\end{align*}
and variance $\Delta^2 \upsilon_\tau$
where
$\Delta^2 \upsilon_\tau$
where
 \begin{equation*} \upsilon_\tau = \sum^3_{i=1} \sum^3_{j=1}\upsilon^{(i,j)}_\tau\end{equation*}
with
 \begin{align*} \upsilon^{(1,1)}_\tau &= \text{Var}^{\mathbb{Q}}\!\left( \Sigma_{1,1}\sum_{l=1}^{\tau-1}(\tau-l)Z^{\mathbb{Q}}_{t+l,1} \right) = \Sigma^2_{1,1}\sum_{l=1}^{\tau-1}(\tau-l)^2=\Sigma^2_{1,1}\sum_{l=1}^{\tau-1}l^2=\Sigma^2_{1,1}\dfrac{\tau(\tau-1)(2\tau-1)}{6},\\[4pt]\upsilon^{(2,2)}_\tau &= \text{Var}^{\mathbb{Q}}\!\left(\Sigma_{2,2}\sum_{l=1}^{\tau-1} Z^{\mathbb{Q}}_{t+l,2} \dfrac{1-(1-\lambda )^{\tau-l}}{\lambda } \right)\\[4pt] &= \frac{\Sigma^2_{2,2}}{\lambda ^2} \sum_{l=1}^{\tau-1} \left( 1-(1-\lambda )^{l} \right)^2\\[4pt] &= \frac{\Sigma^2_{2,2}}{\lambda ^2} \left( \tau -1 - 2 \!\left[\frac{1-(1-\lambda )^\tau }{\lambda }-1\right] + \frac{1-(1-\lambda )^{2 \tau}}{1-(1-\lambda )^2}-1\right)\\[4pt] &= \frac{\Sigma^2_{2,2}}{\lambda ^2} \left( \tau - 2 \!\left[\frac{1-(1-\lambda )^\tau }{\lambda }\right] + \frac{1-(1-\lambda )^{2 \tau}}{1-(1-\lambda )^2}\right),\end{align*}
 \begin{align*}\upsilon^{(3,3)}_\tau &= \text{Var}^{\mathbb{Q}}\!\left( \Sigma_{3,3} \sum_{k=1}^{\tau-2} Z^{\mathbb{Q}}_{t+k,3} \!\left[ \frac{1-(1-\lambda )^{(\tau-1-k)}}{\lambda } -(1-\lambda )^{\tau-k-1}(\tau-1-k) \right]\right)\\[4pt]&= \Sigma^2_{3,3} \sum_{k=1}^{\tau-2} \left[ \frac{1-(1-\lambda )^{(\tau-1-k)}}{\lambda } -(1-\lambda )^{\tau-k-1}(\tau-1-k) \right]^2\\[4pt]&= \frac{\Sigma^2_{3,3}}{\lambda ^2} \sum_{k=1}^{\tau-2} \left[ 1-(1-\lambda )^{k} -\lambda (1-\lambda )^{k}k \right]^2\\[4pt] &= \frac{\Sigma^2_{3,3}}{\lambda ^2} \sum_{k=1}^{\tau-2} \left[ 1+(1-\lambda )^{2k} +\lambda ^2(1-\lambda )^{2k}k^2 -2(1-\lambda )^{k} -2k\lambda (1-\lambda )^{k} + 2\lambda k (1-\lambda )^{2k}\right]\\[4pt]&= \unicode{x1D7D9}_{ \{ \tau > 1\} } \frac{\Sigma^2_{3,3}}{\lambda ^2} \Bigg[ \tau-2 + \zeta_0\!\left( (1-\lambda )^2,\tau-1\right)+\lambda ^2 \zeta_2\!\left( (1-\lambda )^2,\tau-1\right)\\[4pt]&\quad - 2\zeta_0\!\left( (1-\lambda ),\tau-1\right) - 2\lambda \zeta_1\!\left( (1-\lambda ),\tau-1\right) + 2\lambda \zeta_1\!\left( (1-\lambda )^2,\tau-1\right) \bigg]\end{align*}
and
 \begin{align*} \upsilon^{(1,2)}_\tau = \upsilon^{(2,1)}_\tau &= \text{Cov}^{\mathbb{Q}} \!\left(\Sigma_{1,1}\sum_{l=1}^{\tau-1}(\tau-l)Z^{\mathbb{Q}}_{t+l,1}, \Sigma_{2,2}\sum_{l=1}^{\tau-1} Z^{\mathbb{Q}}_{t+l,2} \dfrac{1-(1-\lambda )^{\tau-l}}{\lambda }\right) \\[4pt] &= \rho_{1,2}\Sigma_{1,1} \Sigma_{2,2} \sum_{l=1}^{\tau-1} l \dfrac{1-(1-\lambda )^{l}}{\lambda } \\[4pt] &= \rho_{1,2}\Sigma_{1,1} \Sigma_{2,2} \frac{1}{\lambda }\left( \frac{\tau(\tau-1)}{2} - \zeta_1 ((1-\lambda ),\tau)\right), \\[4pt] \upsilon^{(1,3)}_\tau = \upsilon^{(3,1)}_\tau&= \text{Cov}^{\mathbb{Q}} \!\left(\Sigma_{1,1}\sum_{k=1}^{\tau-1}(\tau-k)Z^{\mathbb{Q}}_{t+k,1}, \Sigma_{3,3} \sum_{k=1}^{\tau-2} Z^{\mathbb{Q}}_{t+k,3} \!\left[ \frac{1-(1-\lambda )^{(\tau-1-k)}}{\lambda }\right.\right.\nonumber\\ &\qquad\left.\left. -(1-\lambda )^{\tau-k-1}(\tau-1-k) \right]\right) \\[4pt] &= \rho_{1,3}\Sigma_{1,1} \Sigma_{3,3} \sum_{k=1}^{\tau-2} (\tau-k)\left[ \frac{1-(1-\lambda )^{(\tau-1-k)}}{\lambda } -(1-\lambda )^{\tau-k-1}(\tau-1-k) \right] \\[4pt] &= \rho_{1,3}\Sigma_{1,1} \Sigma_{3,3} \sum_{k=1}^{\tau-2} (k+1) \left[ \frac{1-(1-\lambda )^{k}}{\lambda } -(1-\lambda )^{k}k \right] \\[4pt] &= \rho_{1,3}\Sigma_{1,1} \Sigma_{3,3} \frac{1}{\lambda }\sum_{k=1}^{\tau-2} (k+1)\left[ 1 -(1+\lambda k)(1-\lambda )^{k} \right] \\[4pt] &= \unicode{x1D7D9}_{ \{ \tau > 1\} }\rho_{1,3}\Sigma_{1,1} \Sigma_{3,3} \frac{1}{\lambda } \left( \frac{(\tau-1)\tau}{2}-1 - \sum_{k=1}^{\tau-2} (1+(\lambda +1)k+\lambda k^2)(1-\lambda )^{k}\right) \end{align*}
 \begin{align*} &= \unicode{x1D7D9}_{ \{ \tau > 1\} }\rho_{1,3}\Sigma_{1,1} \Sigma_{3,3} \frac{1}{\lambda } \bigg[\frac{\tau(\tau-1)}{2}-1 -\zeta_0\!\left( (1-\lambda ),\tau-1\right) -(\lambda +1)\zeta_1\!\left( (1-\lambda ),\tau-1\right) \\[4pt] & \quad -\lambda \zeta_2\!\left( (1-\lambda ),\tau-1\right) \bigg], \end{align*}
 \begin{align*} \upsilon^{(2,3)}_\tau = \upsilon^{(3,2)}_\tau &= \text{Cov}^{\mathbb{Q}} \bigg(\Sigma_{2,2}\sum_{l=1}^{\tau-1} Z^{\mathbb{Q}}_{t+l,2} \dfrac{1-(1-\lambda )^{\tau-l}}{\lambda }, \Sigma_{3,3} \sum_{k=1}^{\tau-2} Z^{\mathbb{Q}}_{t+k,3} \bigg[ \frac{1-(1-\lambda )^{(\tau-1-k)}}{\lambda } \\[4pt] &\quad -(1-\lambda )^{\tau-k-1}(\tau-1-k) \bigg]\bigg) \\[4pt] &= \rho_{2,3}\Sigma_{2,2} \Sigma_{3,3} \sum_{k=1}^{\tau-2} \left( \frac{1-(1-\lambda )^{\tau-k}}{\lambda }\right) \left[ \frac{1-(1-\lambda )^{\tau-k-1}}{\lambda }\right.\\ & \left. -(1-\lambda )^{\tau-k-1}(\tau-k-1) \right] \\[4pt] &= \rho_{2,3}\Sigma_{2,2} \Sigma_{3,3} \sum_{k=1}^{\tau-2} \left( \frac{1-(1-\lambda )^{k+1}}{\lambda }\right) \left[ \frac{1-(1-\lambda )^{k}}{\lambda } -(1-\lambda )^{k}k \right] \\[4pt] &= \rho_{2,3}\Sigma_{2,2} \Sigma_{3,3} \sum_{k=1}^{\tau-2} \left( \frac{1-(2-\lambda )(1-\lambda )^{k} + (1-\lambda )(1-\lambda )^{2k}}{\lambda ^2}\right.\\ & \left. + \frac{-(1-\lambda )^{k}k +(1-\lambda )(1-\lambda )^{2k}k}{\lambda } \right) \\[4pt] & = \unicode{x1D7D9}_{ \{ \tau > 1\} } \rho_{2,3}\Sigma_{2,2} \Sigma_{3,3} \bigg( \frac{\tau-2- (2-\lambda )\zeta_0\!\left( (1-\lambda ),\tau-1\right) + (1-\lambda )\zeta_0\!\left( (1-\lambda )^2,\tau-1\right) }{\lambda ^2} \\[4pt] &\quad + \frac{- \zeta_1\!\left( (1-\lambda ),\tau-1\right) + (1-\lambda )\zeta_1\!\left( (1-\lambda )^2,\tau-1\right) }{\lambda } \bigg).\end{align*}
Note that in the final expression of $\upsilon^{(j,3)}_\tau$
,
$\upsilon^{(j,3)}_\tau$
, $j=1,2,3$
, the indicator
$j=1,2,3$
, the indicator $\unicode{x1D7D9}_{ \{ \tau > 1\} }$
could have been replaced with
$\unicode{x1D7D9}_{ \{ \tau > 1\} }$
could have been replaced with $\unicode{x1D7D9}_{ \{ \tau > 2\} }$
since
$\unicode{x1D7D9}_{ \{ \tau > 2\} }$
since $\upsilon^{(j,3)}_2 =0$
.
$\upsilon^{(j,3)}_2 =0$
.
Lemma A.2. Consider assumptions of Proposition 2.1. Set $B_{0}^{(1)}=B_{0}^{(2)}=B_{0}^{(3)}=0$
. Then, for
$B_{0}^{(1)}=B_{0}^{(2)}=B_{0}^{(3)}=0$
. Then, for $i=1,2,3$
and any integer
$i=1,2,3$
and any integer $\tau \geq 1$
,
$\tau \geq 1$
,
 \begin{equation*} B_{\tau}^{(i)}-1= B_{\tau-1}^{(i)}\!\left(1-\kappa^{\mathbb{Q}}_{i,i}\right) -\unicode{x1D7D9}_{ \{i=3\} } (1-\lambda)^{\tau-1}= B_{\tau-1}^{(i)}\!\left(1-\lambda\unicode{x1D7D9}_{ \{i>1\} }\right) -\unicode{x1D7D9}_{ \{i=3\} } (1-\lambda)^{\tau-1}.\end{equation*}
Proof of Lemma A.2: Based on Proposition 2.1, the case $\tau=1$
is trivial. Now consider
$\tau=1$
is trivial. Now consider $\tau>1$
.
$\tau>1$
.
 \begin{equation*}B_{\tau}^{(1)}-1 = \tau - 1 = B_{\tau-1}^{(1)}.\end{equation*}
Furthermore,
 \begin{equation*} \dfrac{B_{\tau}^{(2)}-1}{B_{\tau-1}^{(2)}} = \dfrac{\dfrac{1-(1-\lambda)^\tau}{\lambda}-1}{\dfrac{1-(1-\lambda)^{\tau-1}}{\lambda}} = \dfrac{(1-\lambda)\dfrac{1-(1-\lambda)^{\tau-1}}{\lambda}}{\dfrac{1-(1-\lambda)^{\tau-1}}{\lambda}} = 1-\lambda. \end{equation*}
Finally,
 \begin{align*} B_{\tau}^{(3)}&= \frac{1-(1-\lambda )^{\tau-1}}{\lambda } - (\tau-1) (1-\lambda )^{\tau-1} \\[4pt] &=(1-\lambda )\left(\frac{1-(1-\lambda )^{\tau-2}}{\lambda } +\dfrac{1}{1-\lambda} - (\tau-2) (1-\lambda )^{\tau-2}-(1-\lambda )^{\tau-2}\right) \\[4pt] &=B_{\tau-1}^{(3)}(1-\lambda)+1-(1-\lambda)^{\tau-1}. \end{align*}
Proof of Proposition 4.1: Using (2.10), (2.14), (4.6) and (4.12),
 \begin{align*} R_{t+1}^{(F)} - \Delta r_t &= \psi_0 + \sum_{i=1}^3 \psi_i \!\left(X_{t+1}^{(i)}-\left(1-\kappa^{\mathbb{Q}}_{i,i}\right)X_t^{(i)}\right) + \psi^{\prime}_3 X_t^{(3)}\\& + \sum_{j=1}^q \psi_j^{(S)} \!\left(R_{t+1,j}^{(S)} - \Delta r_t\right)+ \sqrt{h^{(F)}_{t}}Z^{(F)}_{t+1} \notag \\[4pt] &= \psi_0 + \sum_{i=1}^3 \psi_i \!\left(\Sigma_{i,i} Z^{\mathbb{Q}(i)}_{t+1} + \lambda \theta^{\mathbb{Q}}_i \unicode{x1D7D9}_{ \{ i>1\} } -\lambda \theta^{\mathbb{Q}}_3 \unicode{x1D7D9}_{ \{ i=2\} } + \lambda \unicode{x1D7D9}_{ \{ i=2\} } X^{(3)}_t \right) + \psi^{\prime}_3 X_t^{(3)} \nonumber\\[4pt] & \quad + \sum_{j=1}^q \psi_j^{(S)} \!\left(R_{t+1,j}^{(S)} - \Delta r_t\right)+ \sqrt{h^{(F)}_{t}}Z^{(F)}_{t+1} \notag \\[4pt] &= \underbrace{\psi_0 + \sum_{i=1}^3 \!\psi_i \!\left( \kappa^{\mathbb{Q}}_{i,i} \theta^{\mathbb{Q}}_i -\lambda \theta^{\mathbb{Q}}_3 \unicode{x1D7D9}_{ \{ i=2\} } \right) + (\psi_2 \lambda + \psi^{\prime}_3) X_t^{(3)} - \sum_{j=1}^q \!\psi_j^{(S)} \!\left( \dfrac{1}{2}h_{t,j}^{(S)}\right) }_{=\phi_t}\! {-} \sqrt{h^{(F)}_{t}} \lambda^{(F)}_{t} \notag \\[4pt] &\quad + \sum_{i=1}^3 \psi_i \Sigma_{i,i} Z^{\mathbb{Q}(i)}_{t+1} + \sum_{j=1}^q \psi^{(S)}_j \sqrt{h_{t,j}^{(S)}} Z_{t+1,j}^{\mathbb{Q}(S)} + \sqrt{h^{(F)}_{t}}Z^{\mathbb{Q}(F)}_{t+1}. \nonumber\end{align*}
Conditionally upon $\mathcal{F}_t$
,
$\mathcal{F}_t$
, $R_{t+1}^{(F)} - \Delta r_t$
is therefore Gaussian with variance
$R_{t+1}^{(F)} - \Delta r_t$
is therefore Gaussian with variance
 \begin{equation} \text{Var}^{\mathbb{Q}} \!\left[ R_{t+1}^{(F)} - \Delta r_t \big\vert \mathcal{F}_t\right] = \bigg(\sigma_t^{(F)}\bigg)^2\end{equation}
with $\sigma_t^{(F)}$
given by (4.15). Enforcing that the discounted mixed fund value is a
$\sigma_t^{(F)}$
given by (4.15). Enforcing that the discounted mixed fund value is a $\mathbb{Q}$
-martingale requires
$\mathbb{Q}$
-martingale requires
 \begin{eqnarray*} 1 &=& \mathbb{E}^{\mathbb{Q}} \!\left[ \exp \!\left(R_{t+1}^{(F)} - \Delta r_t \right) \big\vert \mathcal{F}_t\right] \\[4pt] &=& \exp \!\left(\phi_t - \sqrt{h^{(F)}_{t}} \lambda^{(F)}_{t} +\frac{1}{2} \bigg(\sigma_t^{(F)}\bigg)^2\right)\end{eqnarray*}
which leads to
 \begin{equation*} \lambda_{t}^{(F)} = \dfrac{1}{\sqrt{h_t^{(F)}}}\Bigg[\phi_t+\dfrac{1}{2}\bigg(\sigma_t^{(F)}\bigg)^2\bigg].\end{equation*}
Finally, due to (A.8), the innovation
 \begin{equation*} \epsilon^{\mathbb{Q}(F)}_{t+1} = \dfrac{\sum_{i=1}^3\psi_i\Sigma_{i,i} Z_{t+1}^{\mathbb{Q}(i)}+\sum_{j=1}^q\psi_j^{(S)}\sqrt{h_{t,j}^{(S)}}Z_{t+1,j}^{\mathbb{Q}(S)}+\sqrt{h_{t}^{(F)}}Z_{t+1}^{\mathbb{Q}(F)}}{\sigma_t^{(F)}}\end{equation*}
is standard Gaussian under $\mathbb{Q}$
, and thus
$\mathbb{Q}$
, and thus $\{\epsilon^{\mathbb{Q}(F)}_{t+1}\}^T_{t=1}$
is a standard Gaussian white noise.
$\{\epsilon^{\mathbb{Q}(F)}_{t+1}\}^T_{t=1}$
is a standard Gaussian white noise.
Appendix B. Benchmarks
In this paper, the discrete-time Gaussian three-factor model introduced by Augustyniak et al. (Reference Augustyniak, Godin and Hamel2021) and the dynamic Nelson-Siegel model from Diebold & Li (Reference Diebold and Li2006) are considered as benchmarks for the DTAFNS model. Such benchmarks are presented below.
B.1. Discrete-time Gaussian three-factor model
Augustyniak et al. (Reference Augustyniak, Godin and Hamel2021) assume that the physical measure $\mathbb{P}$
dynamics of the short rate are that of a discrete-time version of the three-factor Gaussian G3 model:
$\mathbb{P}$
dynamics of the short rate are that of a discrete-time version of the three-factor Gaussian G3 model:
 \begin{align}r_t&= X^{(1)}_t + X^{(2)}_t + X^{(3)}_t, \nonumber \\[4pt]X^{(i)}_{t+1}&=X^{(i)}_t+\kappa_i \!\left(\mu_i-X^{(i)}_t\right)+\sigma_i Z_{t+1}^{(i)}, \quad \quad i = 1,2,3,\end{align}
where $(\kappa_i,\mu_i,\sigma_i)$
are the model parameters and
$(\kappa_i,\mu_i,\sigma_i)$
are the model parameters and $\big\{Z_{t}^{(1)},Z_{t}^{(2)},Z_{t}^{(3)}\big\}^T_{t=1}$
is a Gaussian white noise process with contemporaneous correlation matrix
$\big\{Z_{t}^{(1)},Z_{t}^{(2)},Z_{t}^{(3)}\big\}^T_{t=1}$
is a Gaussian white noise process with contemporaneous correlation matrix $\Gamma$
.
$\Gamma$
.
The risk-neutral dynamics of the factors is obtained using a discrete-time version of the Girsanov theorem. The processes $ Z^{\mathbb{Q}}_{i}=\big\lbrace Z^{ \mathbb{Q} }_{t,i}\big\rbrace_{t=1}^{T} $
,
$ Z^{\mathbb{Q}}_{i}=\big\lbrace Z^{ \mathbb{Q} }_{t,i}\big\rbrace_{t=1}^{T} $
, $i=1,2,3$
defined through
$i=1,2,3$
defined through $Z^{\mathbb{Q}}_{t+1,i}=Z_{t+1,i}-\lambda_i X^{(i)}_{t} $
, with
$Z^{\mathbb{Q}}_{t+1,i}=Z_{t+1,i}-\lambda_i X^{(i)}_{t} $
, with $\lambda_i \in \mathbb{R}$
, are standard Gaussian white noises under the risk-neutral measure
$\lambda_i \in \mathbb{R}$
, are standard Gaussian white noises under the risk-neutral measure $\mathbb{Q}$
, still with contemporaneous correlation matrix
$\mathbb{Q}$
, still with contemporaneous correlation matrix $\Gamma$
. Therefore,
$\Gamma$
. Therefore,
 \begin{equation}X_{t+1}^{(i)}=X^{(i)}_t+\kappa_i^{\mathbb{Q}} \!\left(\mu_i^{\mathbb{Q}}-X_t\right)+\sigma_i Z_{t+1}^{\mathbb{Q}}, \quad i = 1,2,3 \end{equation}
where
 \begin{align*}\kappa_i^{\mathbb{Q}}=\kappa_i-\sigma_i \lambda_i, \quad \quad \mu_i^{\mathbb{Q}}=\dfrac{\kappa_i \mu_i}{\kappa_i-\sigma_i \lambda_i}.\end{align*}
Augustyniak et al. (Reference Augustyniak, Godin and Hamel2021) show that under (B.2), the time-t price of a risk-free zero-coupon bond paying one dollar at the maturity time T is given by
 \begin{align*}P(t,T)=\mathbb{E^Q}\!\left[\exp\!\left(-\Delta \sum_{j=t}^{T-t-1}r_{t-j}\right)\right]=\exp\bigg(A_{\tau}- \Delta\sum_{i=1}^{3}B_{\tau}^{(i)}X_t^{(i)}\bigg),\end{align*}
with $\tau = T-t$
and
$\tau = T-t$
and
 \begin{align*}A_{\tau} & =\dfrac{\Delta^2}{2} \unicode{x1D7D9}_3^\top \upsilon_\tau \unicode{x1D7D9}_3 - \Delta \sum_{i=1}^3\mu^{\mathbb{Q}} _i\left(\tau - B_{\tau}^{(i)}\right), \\[4pt]B_{\tau}^{(i)} & = \dfrac{1-\left(1-\kappa^{\mathbb{Q}}_{i}\right)^\tau }{\kappa^{\mathbb{Q}}_{i}}, \quad i=1,2,3,\end{align*}
where $\unicode{x1D7D9}_3$
is the three-dimensional column vector containing ones as elements and
$\unicode{x1D7D9}_3$
is the three-dimensional column vector containing ones as elements and $\upsilon_\tau$
is a
$\upsilon_\tau$
is a $3 \times 3$
matrix whose element on row i and column l,
$3 \times 3$
matrix whose element on row i and column l, $\upsilon_\tau^{i,l}$
, is
$\upsilon_\tau^{i,l}$
, is
 \begin{equation*} \upsilon_\tau^{i,l} = \dfrac{\sigma_i \sigma_l}{\kappa^{\mathbb{Q}}_{i} \kappa^{\mathbb{Q}}_{l}}\Gamma_{i,l}\!\left[\tau - B_{\tau}^{(i)} - B_{\tau}^{(l)}+\dfrac{1-\left(1-\kappa^{\mathbb{Q}}_{i}\right)^\tau\left(1-\kappa^{\mathbb{Q}}_{l}\right)^\tau}{1-\left(1-\kappa^{\mathbb{Q}}_{i}\right)\left(1-\kappa^{\mathbb{Q}}_{l}\right)}\right].\end{equation*}
The model is estimated with maximum likelihood using a Kalman filter on the Canadian end-of-month yield curve data from January 1986 to January 2022. Resulting parameter estimates are given in Table B.1.
DG3 model parameter estimates
 $\Gamma$
=
$\Gamma$
= $\left[\begin{array}{c@{\quad}c@{\quad}c} 1 & 0.146 & -0.785 \\[4pt] 0.146 & 1 & -0.569 \\[4pt] -0.785& -0.569 & 1 \\[4pt] \end{array}\right] $
Notes: Parameter estimates for the discrete-time G3 model of Augustyniak et al. (Reference Augustyniak, Godin and Hamel2021) given by Equations (B.1)-(B.2). The maximum likelihood estimation procedure is conducted with a Kalman filter on the Canadian end-of-month yield curve data extending from January 1986 to January 2022.
B.2. Dynamic Nelson-Siegel model
To represent the DNS model dynamics, we consider the same model specification than for the DTAFNS model, except that we that we use $\log A_\tau = 0$
and
$\log A_\tau = 0$
and $B_\tau=\left[\tau, \,\, \dfrac{1-e^{-\lambda\tau}}{\lambda}, \, \, \dfrac{1-e^{-\lambda\tau}}{\lambda} - \tau e^{-\lambda\tau }\right]^\top$
in the bond pricing formula (2.15).
$B_\tau=\left[\tau, \,\, \dfrac{1-e^{-\lambda\tau}}{\lambda}, \, \, \dfrac{1-e^{-\lambda\tau}}{\lambda} - \tau e^{-\lambda\tau }\right]^\top$
in the bond pricing formula (2.15).
A global optimization of the log-likelihood is conducted with the R package Rsolnp on the Canadian end-of-month yield curve data extending from January 1986 to January 2022. Corresponding parameter estimates are provided in Table B.2.
Dynamic Nelson-Siegel model parameters estimates
 $\rho$
=
$\rho$
= $\left[\begin{array}{c@{\quad}c@{\quad}c} 1 & -0.8397 & -0.9202\\[4pt] 0.8397 & 1 & 0.7106 \\[4pt] -0.9202 & 0.7106 & 1 \\[4pt] \end{array}\right] $
,
$\left[\begin{array}{c@{\quad}c@{\quad}c} 1 & -0.8397 & -0.9202\\[4pt] 0.8397 & 1 & 0.7106 \\[4pt] -0.9202 & 0.7106 & 1 \\[4pt] \end{array}\right] $
, $P_{1|0}$
=
$P_{1|0}$
= $\left[\begin{array}{*{3}{c}} 4\!\times\! 10^{-6} & 0 & 0 \\[4pt] 0 & 4\!\times\! 10^{-6} & 0 \\[4pt] 0 & 0 & 4\!\times\! 10^{-6} \\[4pt] \end{array}\right] $
Notes: Parameter estimates for the dynamic Nelson-Siegel model. The estimation is conducted with the R package Rsolnp. The data sample consists of Canadian end-of-month yield curve from January 1986 to January 2022.
Appendix C. Point prediction performance for spot rates
In this section, we compare the ability of the various considered models to produce accurate point monthly forecasts for spot rates. Let $\hat{y}(t,t+\tau)$
be the realized time-t spot rates with tenor
$\hat{y}(t,t+\tau)$
be the realized time-t spot rates with tenor $\tau$
, and
$\tau$
, and $\tilde{y}(t,t+\tau)$
be its associated model-implied forecast produced at time
$\tilde{y}(t,t+\tau)$
be its associated model-implied forecast produced at time $t-1$
. Out-of-sample predictions are performed with the expanding window approach detailed in Section 3.3.2, i.e. models are retrained yearly, with yearly out-of-sample test sets covering the period extending from January 2017 to January 2022. Define the following performance metrics:
$t-1$
. Out-of-sample predictions are performed with the expanding window approach detailed in Section 3.3.2, i.e. models are retrained yearly, with yearly out-of-sample test sets covering the period extending from January 2017 to January 2022. Define the following performance metrics:
Performance metrics for in-sample spot rate point predictions

Notes: Performance metrics for the in-sample point forecasting of spot rates by the DTAFNS model and its three benchmarks. Performance metrics are reported for a selection of 16 tenors (in months) among the 33 available in dataset, while the average row at the bottom considers all tenors available.
Performance metrics for out-of-sample spot rate point predictions

Notes: Performance metrics for the out-of-sample point forecasting of spot rates by the DTAFNS model and the DNG3 and DNS benchmarks explained in Appendix B. The expanding window approach detailed in Section 3.3.2 is used for testing: models are retrained yearly, with yearly out-of-sample test sets covering the period extending from January 2017 to January 2022. Performance metrics are reported for a selection of 16 tenors (in months) among the 33 available in dataset, while the average row at the bottom considers all tenors available.
 \begin{align} \text{Mean error}^{(\tau)} = & \dfrac{1}{T^*}\sum_{t=1}^{T^*}(\hat{y}(t,t+\tau)-\tilde{y}(t,t+\tau)), \nonumber \\[4pt] RMSE^{(\tau)} =& \sqrt{ \dfrac{1}{T^*}\sum_{t=1}^{T^*}(\hat{y}(t,t+\tau)-\tilde{y}(t,t+\tau))^2}, \nonumber\\[4pt] MAE^{(\tau)} =& \dfrac{1}{T^*}\sum_{t=1}^{T^*}|\hat{y}(t,t+\tau)-\tilde{y}(t,t+\tau)|, \nonumber\\[4pt] rMAE^{(\tau)}_\mathcal{M}=&\dfrac{MAE^{(\tau)}_{DTAFNS}}{MAE^{(\tau)}_{\mathcal{M}}} \end{align}
where $T^*$
is the total number of forecasting days (e.g. in the union of all test sets for out-of-sample tests) and
$T^*$
is the total number of forecasting days (e.g. in the union of all test sets for out-of-sample tests) and $MAE^{(\tau)}_\mathcal{M}$
is the
$MAE^{(\tau)}_\mathcal{M}$
is the $MAE^{(\tau)}$
for model
$MAE^{(\tau)}$
for model $\mathcal{M}$
. Tables C.1 and C.2 report the point predictive performance results in-sample and out-of-sample, respectively. Since DTAFNS and DTAFNS-U forecasts are extremely close in the in-sample experiment, the DTAFNS-U benchmark is left out of the out-of-sample test. RMSE and MAE metrics indicate that the point forecasting performance of the DTAFNS model is quite similar to that of the DG3, the DNS and the DTAFNS-U models.
$\mathcal{M}$
. Tables C.1 and C.2 report the point predictive performance results in-sample and out-of-sample, respectively. Since DTAFNS and DTAFNS-U forecasts are extremely close in the in-sample experiment, the DTAFNS-U benchmark is left out of the out-of-sample test. RMSE and MAE metrics indicate that the point forecasting performance of the DTAFNS model is quite similar to that of the DG3, the DNS and the DTAFNS-U models.


 Open access