

“States were originally defined by anthropologists and political scientists, but archaeologists can now identify the skeletons of their institutions” (Flannery Reference Flannery, Feinman and Marcus1998:16).
“Because the early state must have been … a regional phenomenon, methodological control over regional analysis must be emphasized in the study of the transition phenomenon” (Jones and Kautz Reference Jones, Kautz, Jones and Kautz1981:34).
Introduction
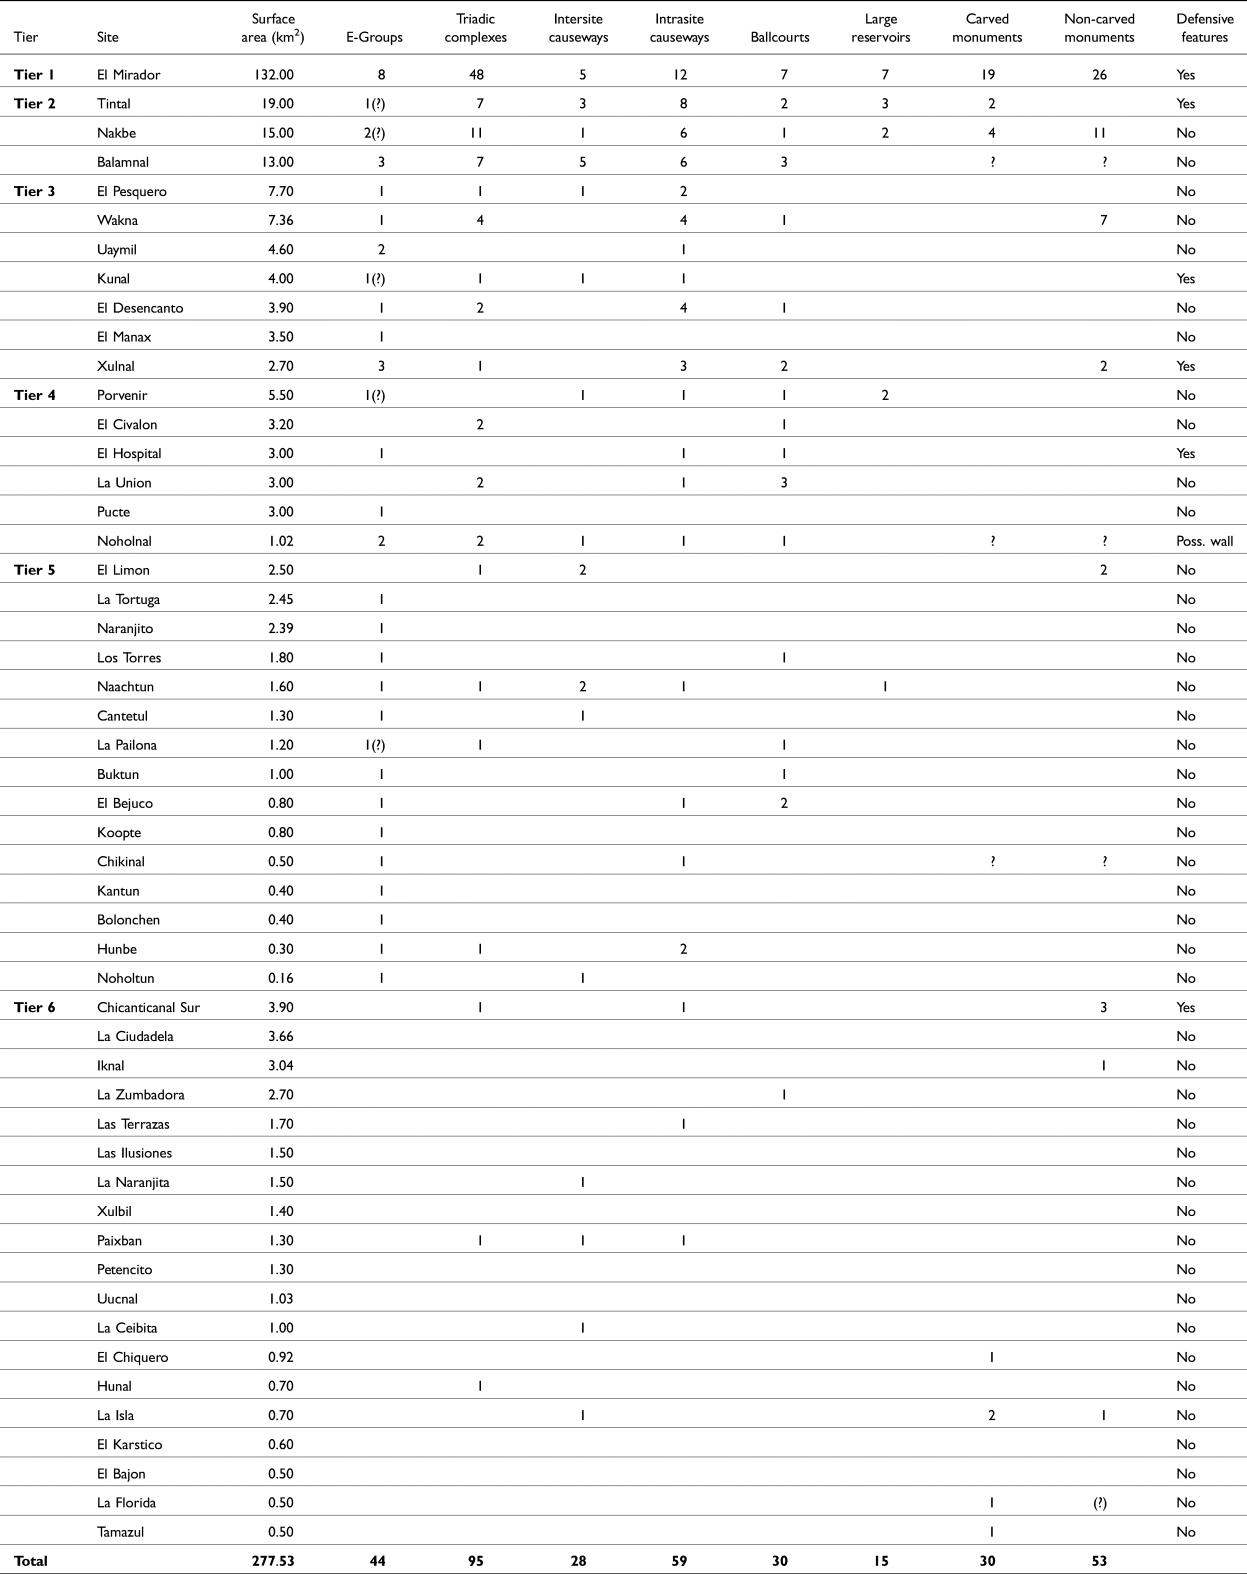
This article presents one of the largest, contiguous, regional LiDAR studies published to date in the Maya Lowlands, revealing more than 775 ancient Maya settlements within the Mirador-Calakmul Karst Basin (MCKB), and 189 more in the surrounding karstic ridge that comprise the geomorphological borders of the geographical area, together forming 964 archaeological settlements. A “settlement” is defined as a grouping or independent cluster of architecture, but when a group of settlements can be demonstrated as related via intrasite causeways or other architectural affiliations, such as shared logistics facilities like reservoirs or marshes, we suggest they can be defined as a “site” or “polity.” A single settlement can also be a site, depending on the quantity of public or residential architecture, as determined by the volumetrics of contemporary construction fill. The settlements that demonstrate a strong political/social/geographical relationship with other settlements within the basin via intrasite causeways have allowed us to suggest a condensation of “settlements” into at least 417 centralized site hierarchies forming ancient cities, towns, and villages (defined below in Settlement Distribution) with specific boundaries, such as bajo or arroyo edges or large areas of uninhabited terrain. A preliminary settlement and administrative hierarchy of at least six tiers is proposed for sites based on surface area, numbers, and densities of monumental architecture, and volumetric calculations of architecture extracted from surface-mapping measurements and LiDAR data. The approximate volumetric assessments were conducted in each site of what appeared to be the civic center of an area 1 km2, with monumental architecture and specific architectural configurations dating to the Middle and Late Preclassic periods, as determined by extensive regional archaeological testing by the Mirador Basin Project in 56 sites, consisting of test pits, archaeological salvage of looters’ trenches, and broad horizontal architectural exposure of structures, as well as morphological characteristics of architecture (e.g., Mejía Reference Mejía, Laporte, Arroyo and Mejía2008, Reference Mejía, Arroyo, Escobedo, Hazard, Melendez and Girón2012; Mejía et al. Reference Mejía, Valle, Castañeda, Hernández, Laporte, Arroyo and Mejía2007, Reference Mejía, Aguilar, Cotom, Iwamoto, Portillo, Arroyo, Palma and Aragón2010). Monumental architecture, consistent architectural formats, specific site boundaries, water management and collection facilities, and more than 177 km of elevated Preclassic causeways suggest labor investments that defy organizational capabilities of lesser polities and portray the strategies of governance by uniting major sites in a network in the Middle and Late Preclassic periods.
Mesoamerica is one of the ideal areas of the world where the process of cultural, political, and economic complexity can be critically evaluated (Clark Reference Clark, Traxler and Sharer2016; Love and Guernsey Reference Love and Guernsey2022; Rosenswig Reference Rosenswig2021a; Traxler and Sharer Reference Traxler and Sharer2016). The wide range of natural resources and variant cultures within a limited geographical framework permitted social, political, and economic interactions via emulation, adaptation, and/or independent innovation. Data relevant to site formation and complexity are more readily available, due to the duration and consistency of archaeological research and new technologies such as LiDAR (light detection and ranging), which have been conducted in the Mirador-Calakmul Karst Basin (MCKB; Ensley et al. Reference Ensley, Hansen, Morales-Aguilar and Thompson2021; Force and Dohrenwend Reference Force and Dohrenwend2008, Reference Force, Dohrenwend, Hansen, Suyuc-Ley and Martínez2021) of northern Guatemala and southern Campeche, Mexico (Figures 1 and 2; Table 1; see also Supplementary Figure 1). Multidisciplinary research over the past four decades in the area of the MCKB by the Foundation for Anthropological Research and Environmental Studies (FARES) and the Mirador Basin Project has resulted in the field mapping and excavations in 56 separate archaeological sites of varying sizes, providing a ground-truthing of LiDAR and GIS analyses. Many of these studies have been published in annual symposium volumes in the National Museum of Anthropology and Ethnology of Guatemala (https://www.asociaciontikal.com), in scientific papers (e.g., https://www.researchgate.net/profile/Richard-Hansen-3), and in technical reports provided to the Government of Guatemala. LiDAR studies of a contiguous area of the southern MCKB have provided new information that, when combined with systematic archaeological research, suggests that a more adequate and improved interpretation of the cultural process can be obtained via improved archaeological methodologies, a greater utilization of multidisciplinary approaches, application of more advanced technologies, improved chronometric methods, and archaeological investigations conducted on a regional scale (Hansen Reference Hansen, Traxler and Sharer2016b:333). Long-term, comprehensive regional investigations have the advantage of broader, multidisciplinary perspectives based on multiple lines of evidence and allow testing of hypotheses, identification of multi-causal factors, and alternative models for the rise of complexity within specific regions (Clark Reference Clark, Traxler and Sharer2016; Rosenswig Reference Rosenswig2021a; Sharer and Sedat Reference Sharer and Sedat1987; Sharer et al. Reference Sharer, Balkansky, Burton, Feinman, Flannery, Grove, Marcus, Moyle, Douglas Price, Redmond, Reynolds, Rice, Spencer, Stoltman and Yaeger2006). This study uses airborne LiDAR data to demonstrate how complex societies organized their infrastructure to reflect their socio-economic organization and political power, conforming to a proposed incipient kingdom/state during the Preclassic period in the Maya Lowlands.
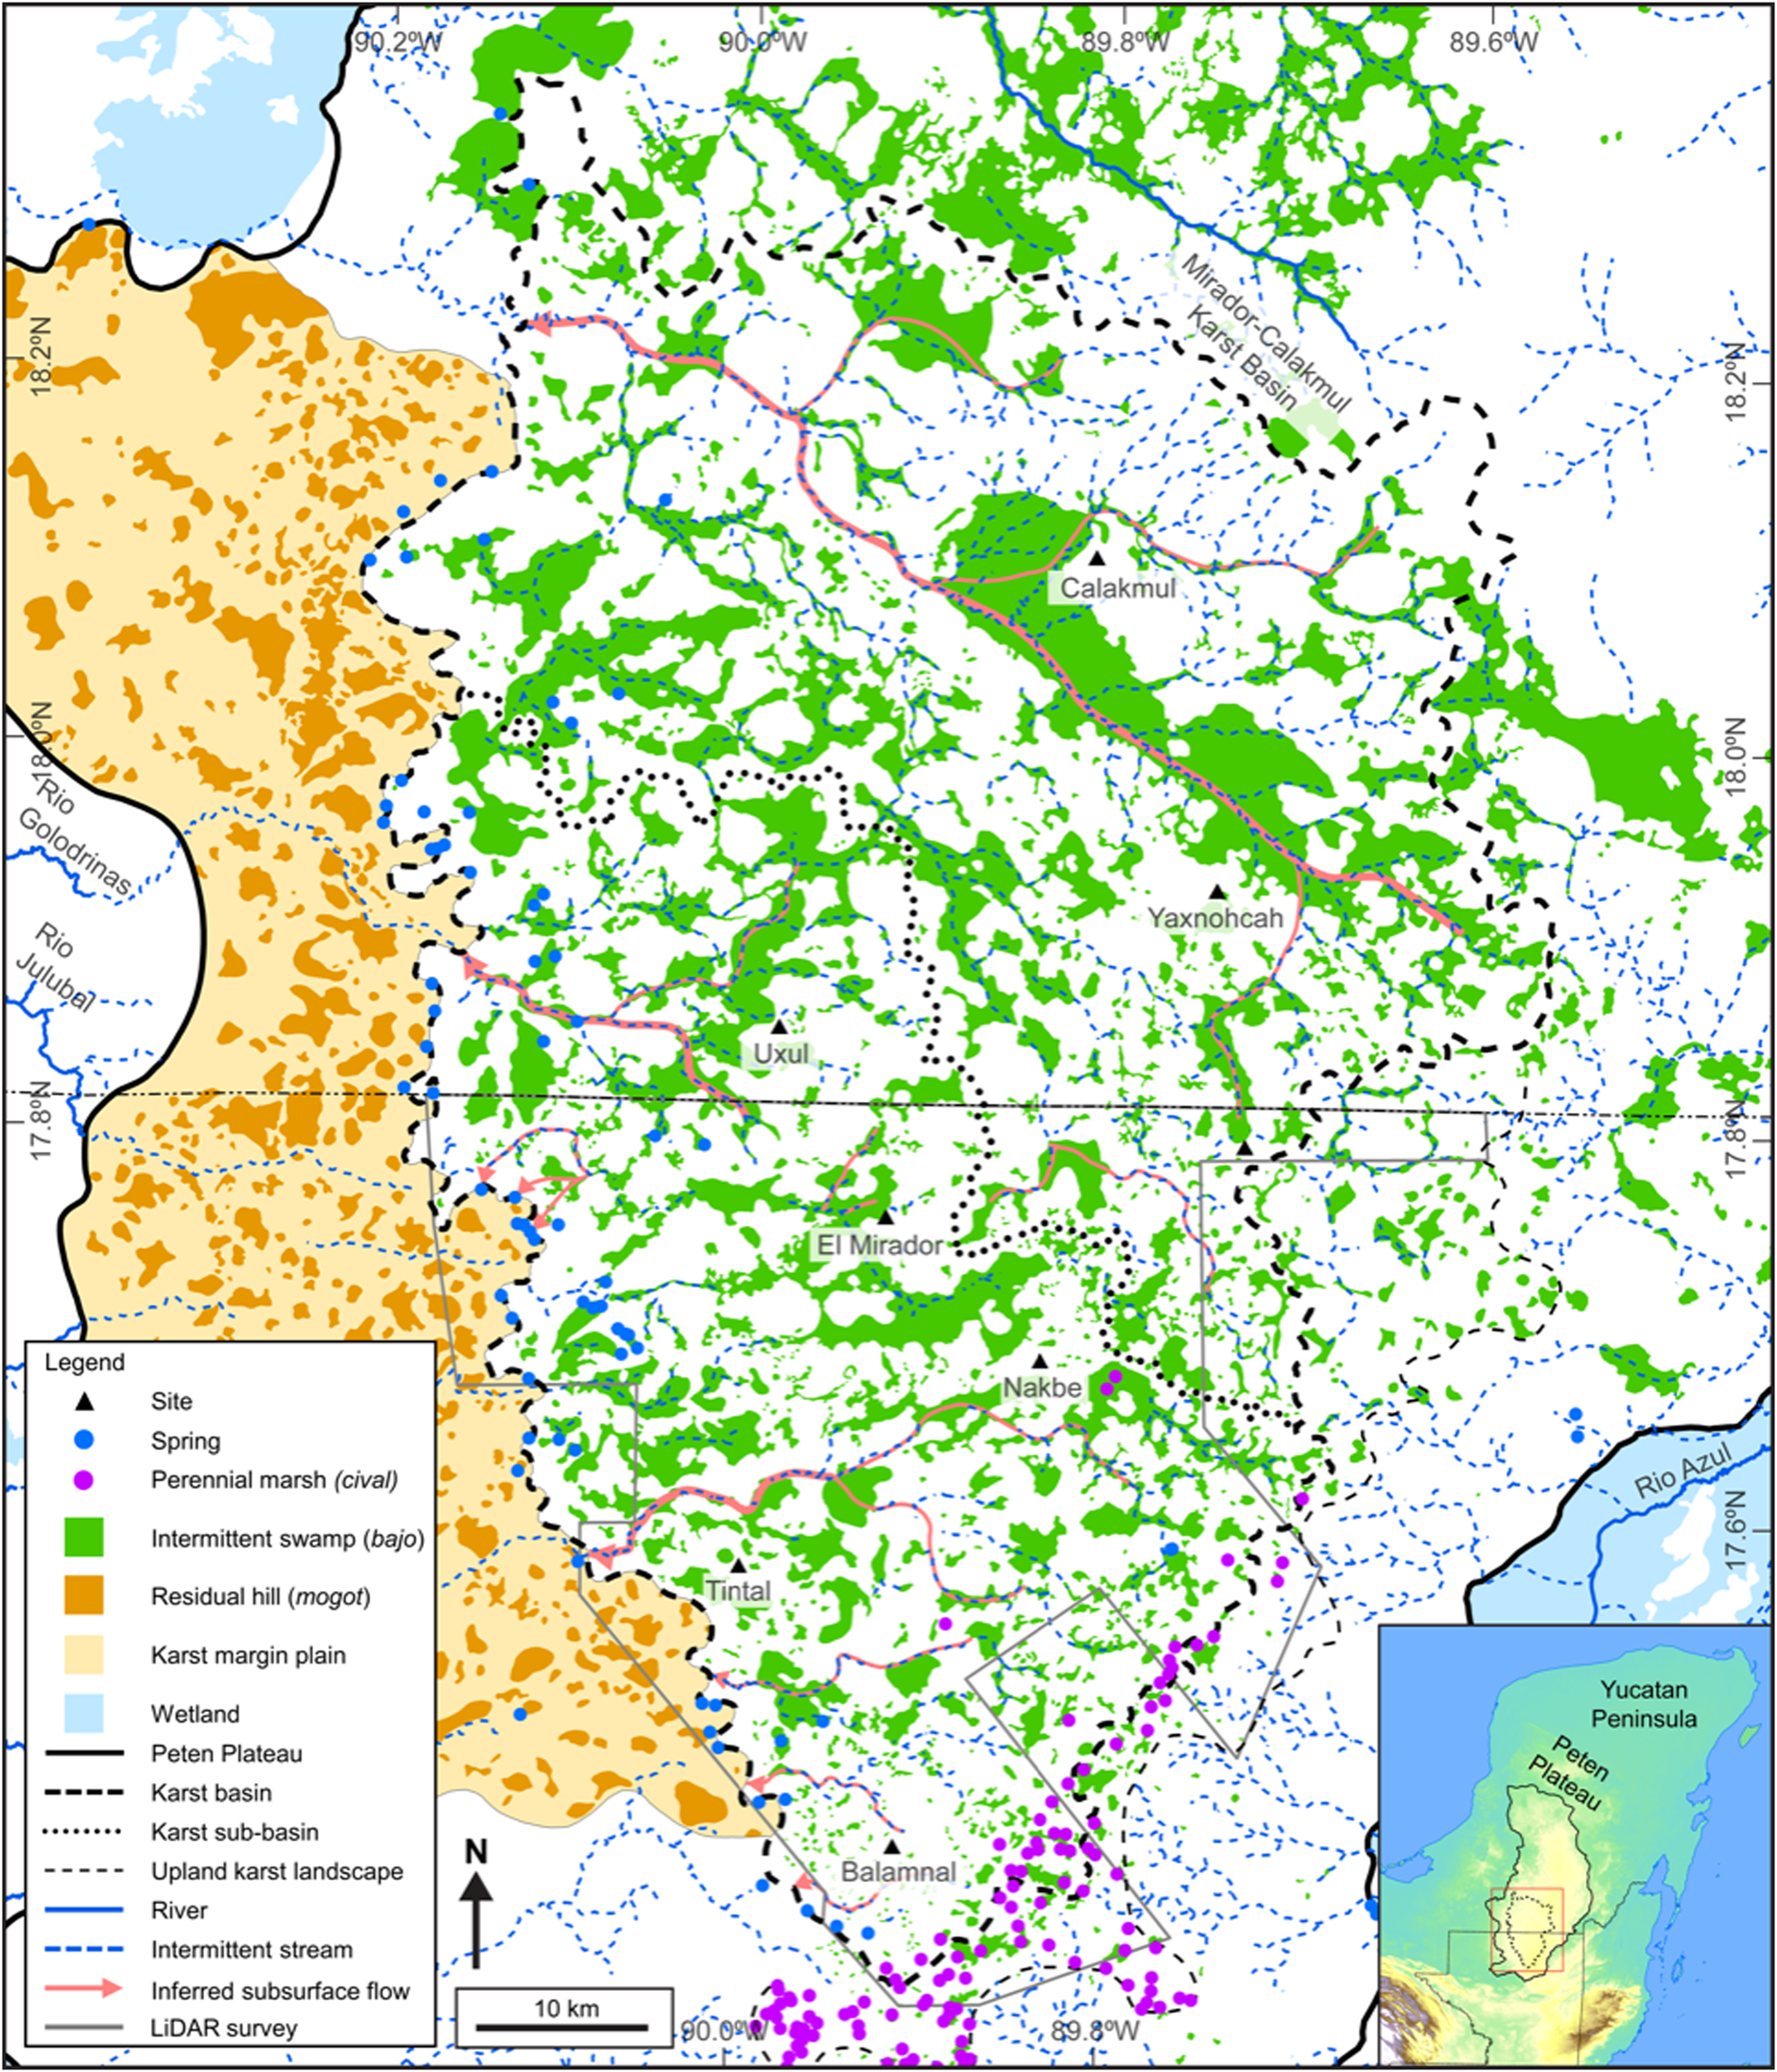
Drainage map of the MCKB in the southern Peten Plateau, which is a fluviokarst landscape dominated by seasonally inundated bajos and intermittent streams. Numerous civales occur in the southeast MCKB, and springs exist at the base of low hills punctuated by dry karst valleys at the edge of the karst basin. Over time, the west karst margin border and plain have eroded, leaving residual hills, or mogotes. Modified after Ensley et al. (Reference Ensley, Hansen, Morales-Aguilar and Thompson2021).
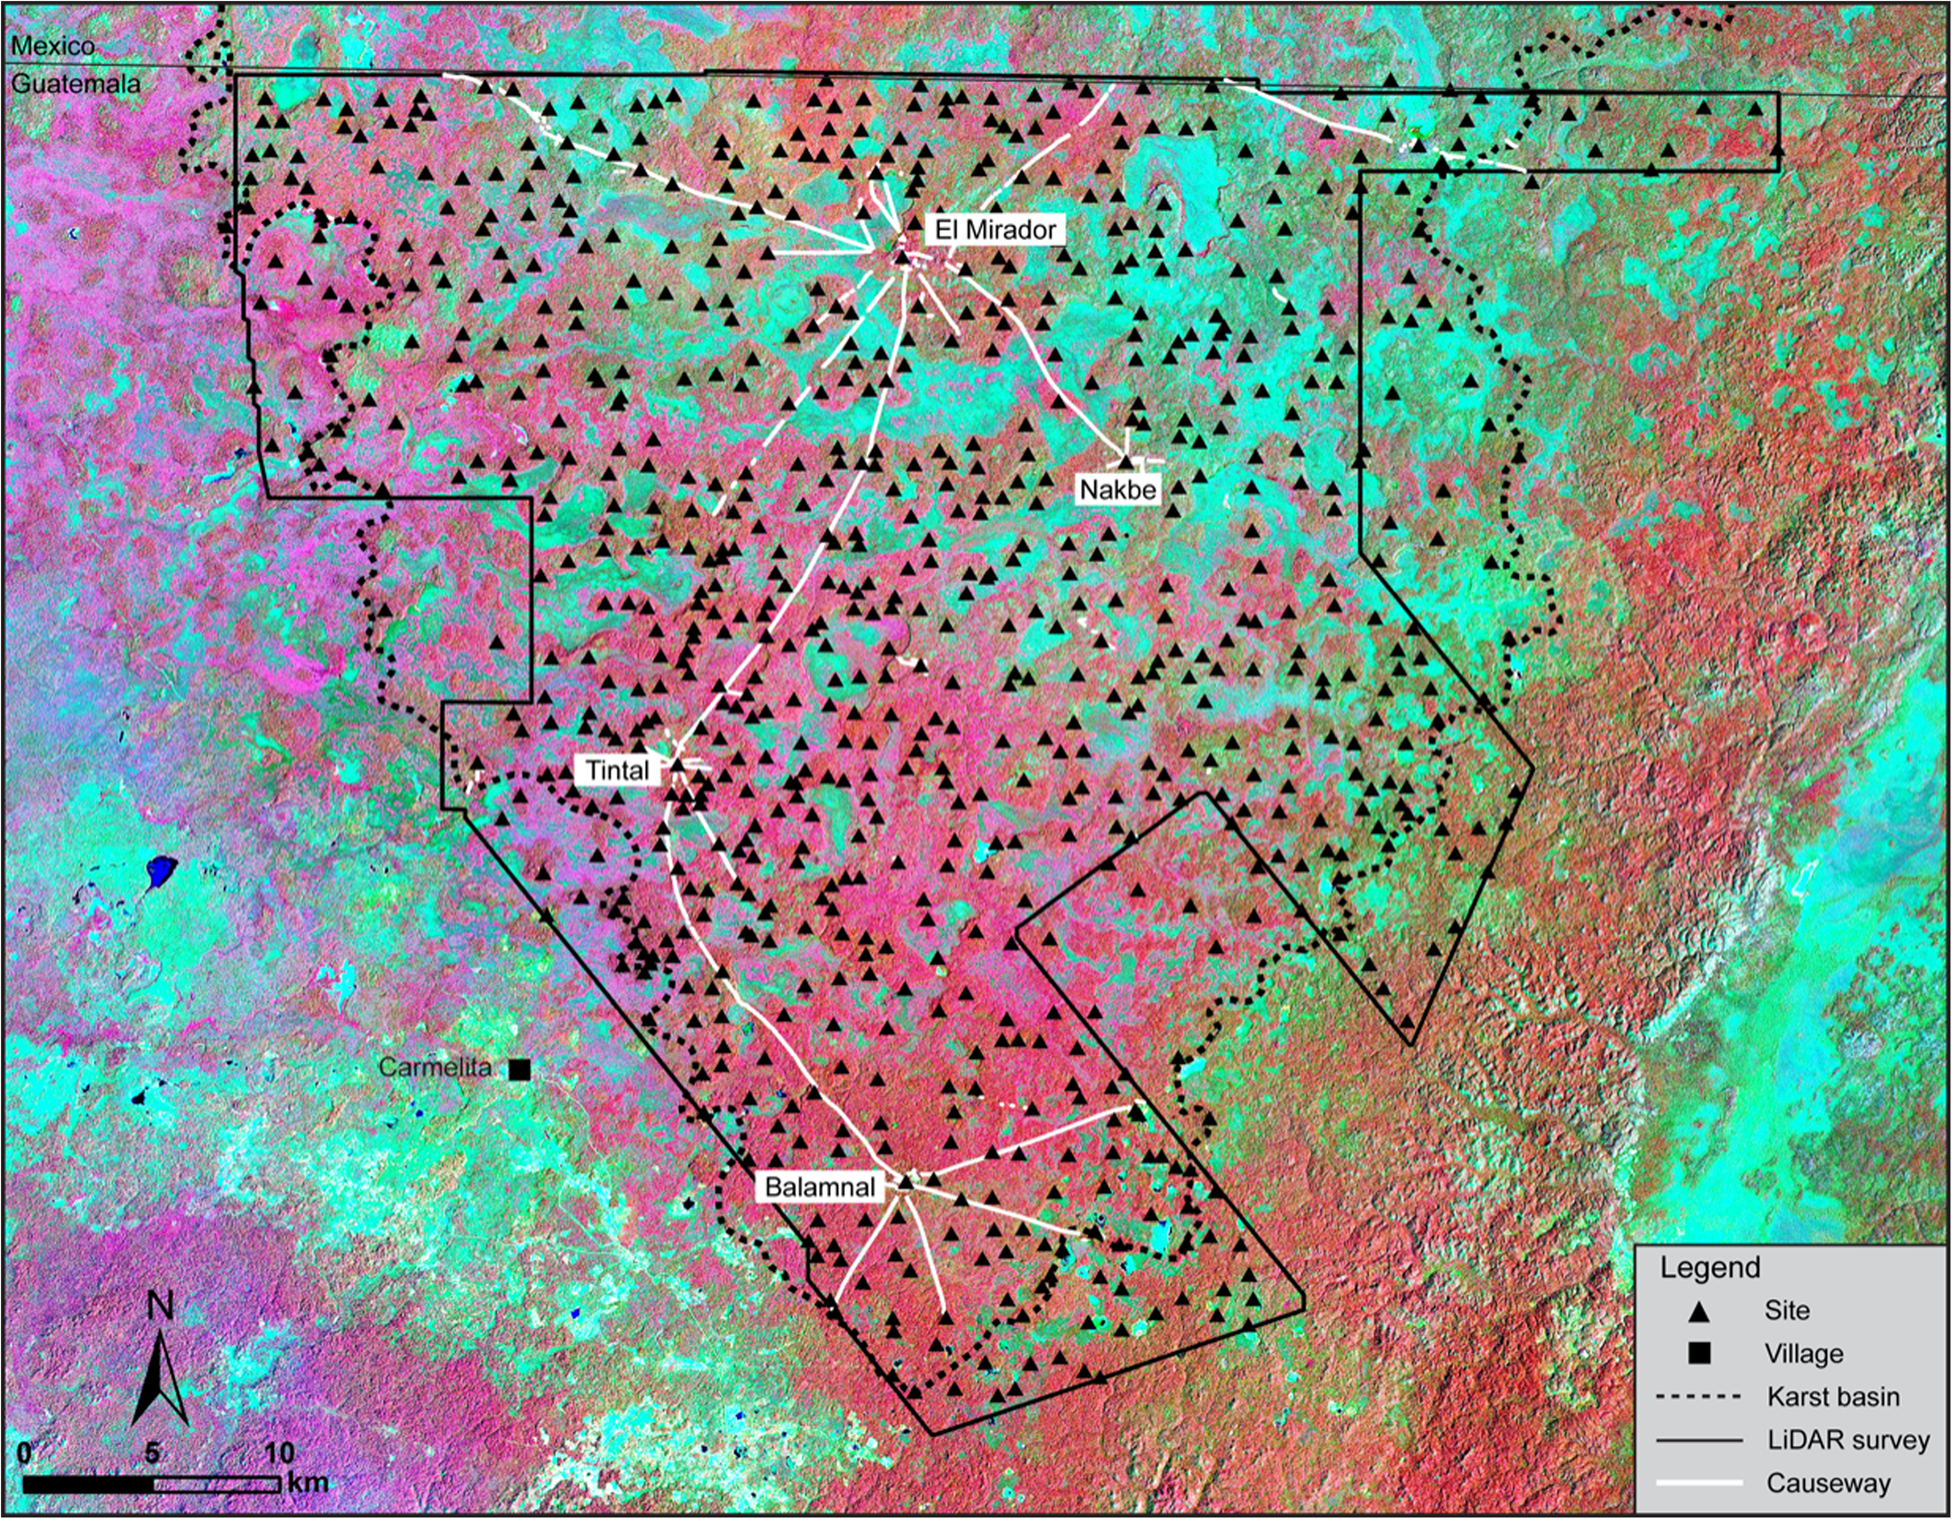
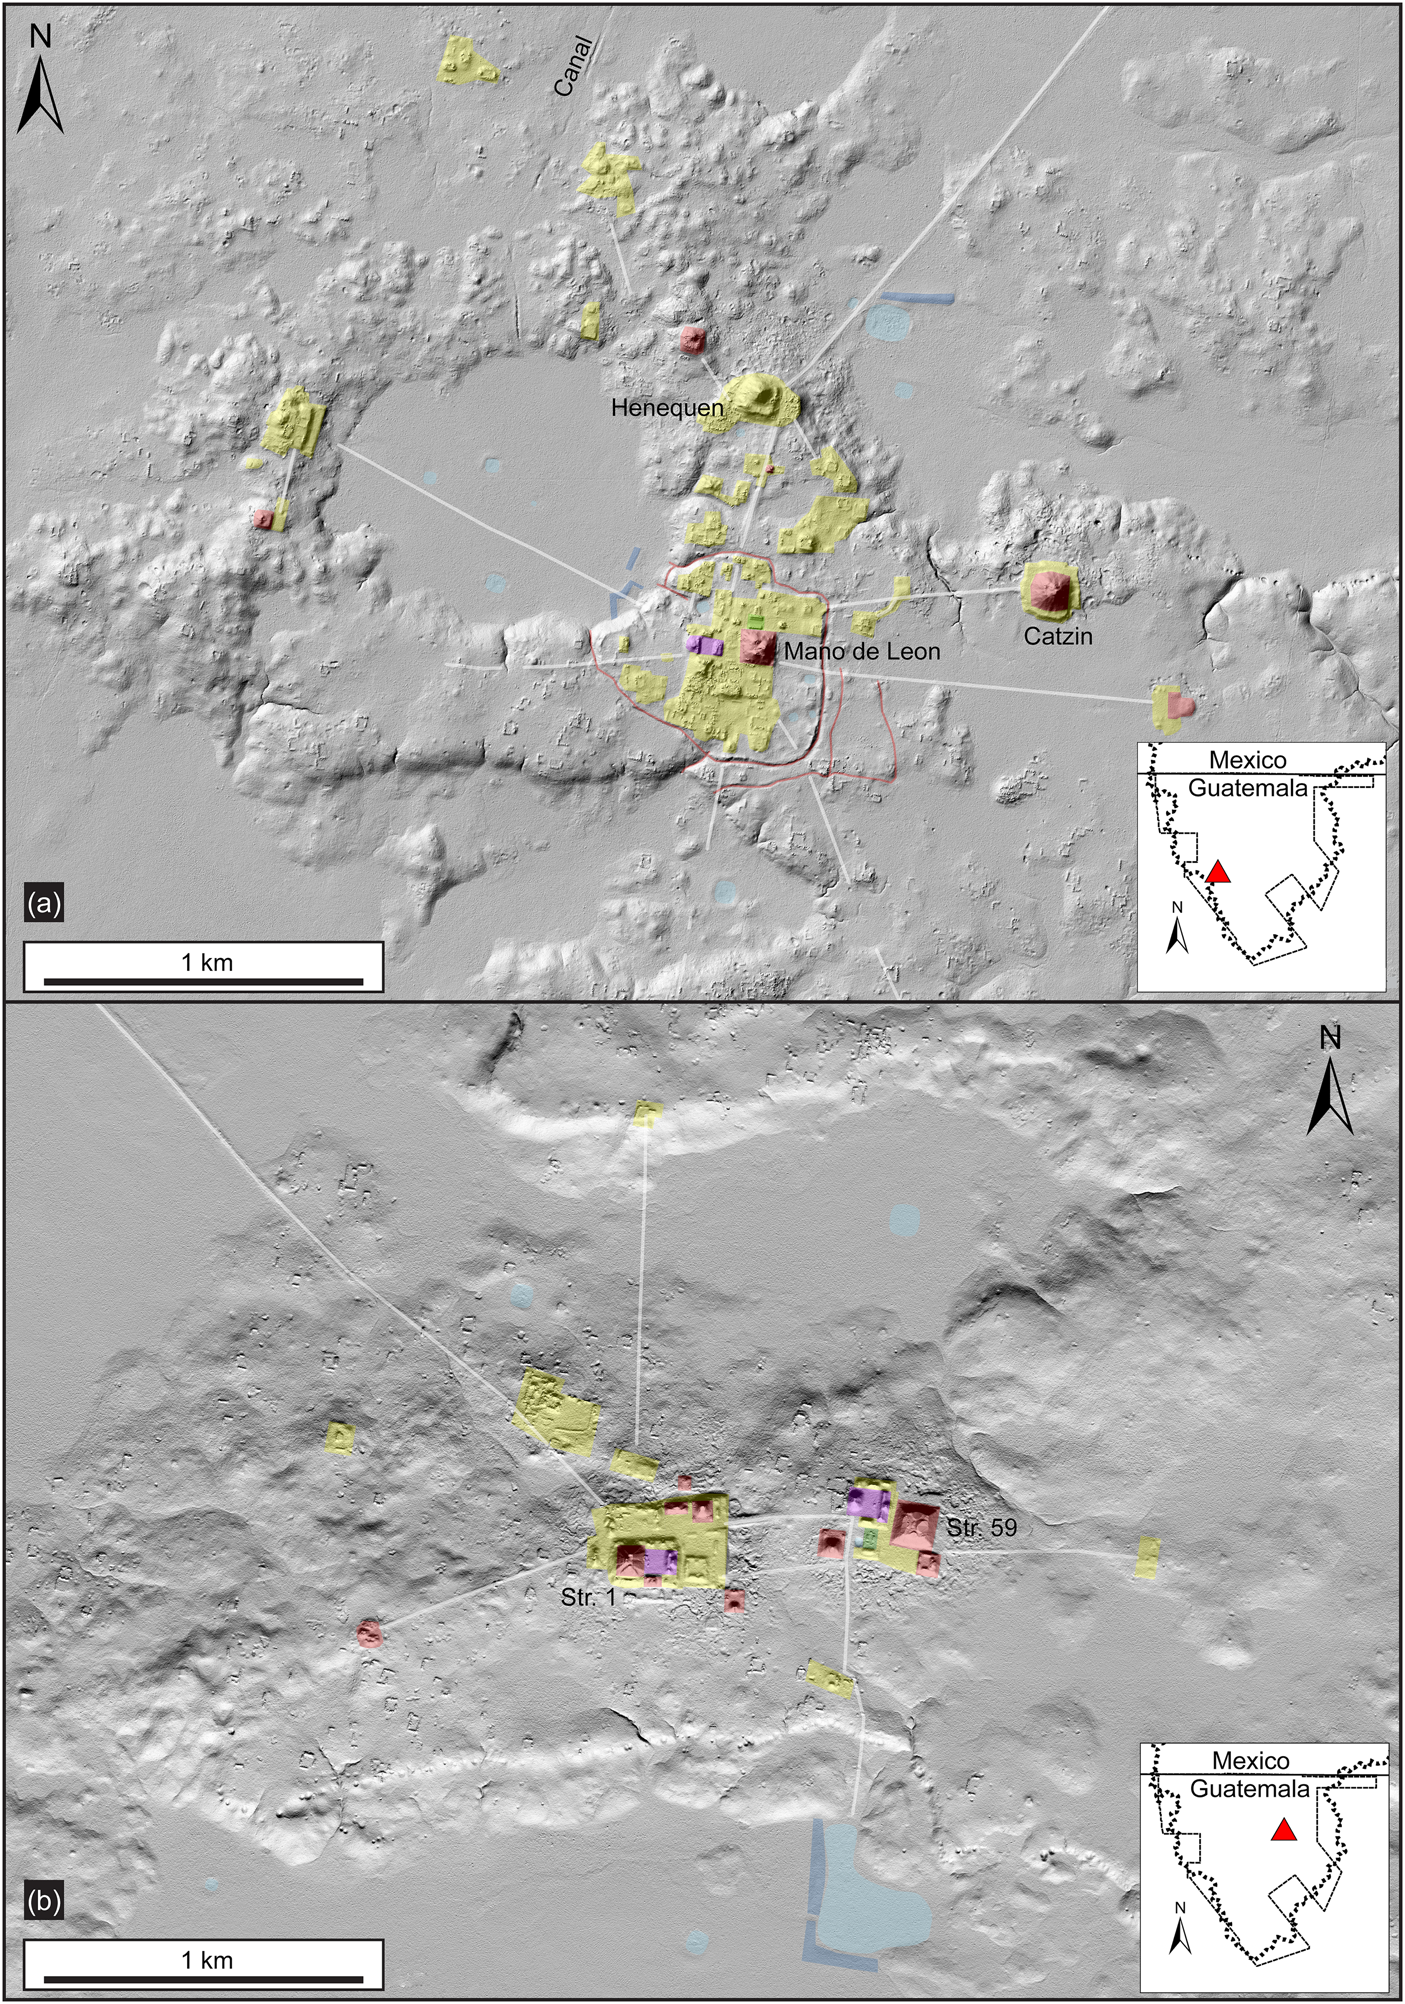
Site map of the southern MCKB. The concentration of sites and causeways in the MCKB demonstrates the likely economic and political cohesion of the area. The background near-infrared image indicates the vegetation types with lowland, or bajo, vegetation in blue-green and upland vegetation in red. Causeways do not extend beyond the natural borders of the basin, suggesting an enclosed centralization associated with settlement nucleation in the Middle and Late Preclassic periods. Sentinel-2 multispectral data: https://earthexplorer.usgs.gov.
These data are relevant to the cultural development within the Mirador-Calakmul region, a karst basin defined by hydrological and geomorphological features, groundwater flow, and natural boundaries (Ensley et al. Reference Ensley, Hansen, Morales-Aguilar and Thompson2021; Force and Dohrenwend Reference Force and Dohrenwend2008, Reference Force, Dohrenwend, Hansen, Suyuc-Ley and Martínez2021). Over recent years, LiDAR data have been acquired that cover 85.8 percent of the southern, or Guatemalan, MCKB. These data have unveiled a remarkable density of Maya sites (Table 2), many of them linked by a network of elevated causeways. Using a GIS and remote-sensing methodology, we have identified and are proposing a six-tiered settlement and administrative hierarchy of sites, with monumental ceremonial architecture, that were present during the Preclassic period, based on archaeological data, density of architecture, superficial areas, calculated volumetrics of architectural fill of contemporaneously constructed or occupied architecture, consistent or similar architectural or artistic traits, and geographical characteristics. A similar study was suggested for the region between Yaxuna and Coba by Stanton and colleagues (Stanton et al. Reference Stanton, Ardren, Barth, Fernandez-Diaz, Rohrer, Meyer, Miller, Magnoni and Pérez2020), with architectural densities, surface areas, and architectural volumes to be considered in settlement pattern research. Extensive monumental architecture in the MCKB has been mapped, including E-Groups, triadic complexes, ballcourts, causeways, and reservoirs throughout the basin. Collectively, we argue that the development of infrastructure demonstrates the presence of complex societies with strong levels of socio-economic organization and political power during the Middle and Late Preclassic periods.
The Mirador-Calakmul Karst Basin
The Mirador-Calakmul area is a Neogene fluviokarst landscape (Gates Reference Gates, Folan, Ortega and Gonzáles1992, Reference Gates, Folan, Gonzáles and Ortega1999), located on the southern Peten Plateau and defined by its geomorphological features (Ensley Reference Ensley2018; Ensley et al. Reference Ensley, Hansen, Morales-Aguilar and Thompson2021:Figure 1; Folan et al. Reference Folan, Hau, Marcus, Frank Miller and Heredia2001; Force and Dohrenwend Reference Force and Dohrenwend2008; Gunn and Folan Reference Gunn and Folan1992; see also Figure 1). The area is dominated by low-lying seasonal swamps, known as bajos, where water collects from the surrounding karstic upland hills that form the natural borders (Ensley Reference Ensley2018; Ensley and Hansen Reference Ensley, Hansen, Hansen, Suyuc-Ley, Morales-Aguilar and Balcárcel-Villagran2020; Ensley et al. Reference Ensley, Hansen, Morales-Aguilar and Thompson2021:20; Gunn and Folan Reference Gunn and Folan1992; Hansen Reference Hansen, Boxt and Dillon2012a, Reference Hansen, Janetski, Gurr and Nielson-Grimm2012b, Reference Hansen, Hansen and Suyuc-Ley2016a, Reference Hansen, Traxler and Sharer2016b, Reference Hansen, Chacon and Mendoza2017; Hansen et al. Reference Hansen, Bozarth, Jacob, Wahl and Schreiner2002). The area is particularly visible on infrared satellite images, first published in 1992 (Supplementary Figure 1), due to the dominant, stunted bajo vegetation (blue in infrared color) that varies from tropical forests in more elevated areas (red in infrared color; Stuart Reference Stuart1992; see also Hansen Reference Hansen, Traxler and Sharer2016b:340, Reference Hansen, Chacon and Mendoza2017:308).
The MCKB exhibits hydrological features common to drainage basins, in addition to inferred groundwater flow routes and defined boundaries (Ensley et al. Reference Ensley, Hansen, Morales-Aguilar and Thompson2021:20; Quinlan and Ewers Reference Quinlan, Ewers, White and White1989:66; Ray Reference Ray, Beck and Herring2001:236; Taylor and Greene Reference Taylor, Greene, Rosenberry and LaBaugh2008:81; White Reference White1988:112–113, 153–155). Regional visualization and hydrogeological interpretation of the basin and its surrounding landscapes used satellite-derived elevation data recorded by the Japan Aerospace Exploration Agency (Takaku et al. Reference Takaku, Tadono and Tsutsui2014, Reference Takaku Junichi, Tsutsui and Ichikawa2016), and was confirmed by LiDAR data covering much of the southern portion of the basin. Borders of the MCKB drainage basin are delineated by the Mirador Anticline on the southeast, the Calakmul Anticline to the northeast, a northern line of karst hills that denotes the divide between the Calakmul and Desempeño drainages, and the line of low, residual hills interrupted by karst valleys along the west. Like the western flank of the Mirador Anticline, the eastern flank is part of the upland karst landscape (Ensley et al. Reference Ensley, Hansen, Morales-Aguilar and Thompson2021:19–20) and has a similar karst geomorphology, dominated by numerous perennial marshes known as civales.
Karst landscapes form a periphery surrounding the MCKB. To the southeast, the basin is bounded by a rugged polygonal karst landscape (e.g., Ensley et al. Reference Ensley, Hansen, Morales-Aguilar and Thompson2021:17–19, Figure 3) that is a geomorphologically defined buffer zone (Adams Reference Adams1999:Figures 1 and 2; Adams and Jones Reference Adams and Jones1981:Figure 2; Gunn et al. Reference Gunn, Folan, Torrescano-Valle, Faust, Geovannini-Acuña, Siemens, Torrescano-Valle, Islebe and Roy2019: Figure 11.5) flanked by the Buenavista Escarpment. On the west side, a karst margin plain is a seasonally flooded alluvial plain with residual hills (Figure 1) which constrains the basin. North of Calakmul, the basin is bounded by a range of hills that separates two fluviokarst drainages, the Desempeño to the northwest and the Escondido to the northeast. The area is believed to be an important water source for much of the Yucatecan shelf (Bauer et al. Reference Bauer-Gottwein, Gondwe, Charvet, Marin, Vieyra and Merediz-Alonso2011).
Materials and methods of LiDAR exploration of the MCKB
The MCKB contains some of the largest ancient Maya cities, and the antiquity of many, if not most, of the sites dates to the Middle and Late Preclassic periods (ca. 1000 b.c.–a.d. 150), with a more modest occupation of the area during the Late Classic period (a.d. 600–900; Clark and Hansen Reference Clark, Hansen, Inomata and Houston2001; Clark et al. Reference Clark, Hansen, Perez, Manzanilla and Lujan2000; Hansen Reference Hansen and Houston1998, Reference Hansen and Grube2001, Reference Hansen and Powis2005, Reference Hansen, Boxt and Dillon2012a, Reference Hansen, Janetski, Gurr and Nielson-Grimm2012b, Reference Hansen, Hansen and Suyuc-Ley2016a, Reference Hansen, Traxler and Sharer2016b, Reference Hansen, Chacon and Mendoza2017; Hansen and Suyuc-Ley Reference Hansen and Suyuc-Ley2016; Hansen et al. Reference Hansen, Howell, Guenter, Stanton and Magnoni2008; Morales-Aguilar Reference Morales-Aguilar2010, Reference Morales-Aguilar2021). Previous archaeological mapping in the southern MCKB surveyed the sites of Nakbe, La Florida, El Mirador, and Tintal with Total Station laser technology, allowing 3-D capability. The success of LiDAR in the archaeology of tropical forests in the Maya Lowlands of Belize (Chase et al. Reference Chase, Chase, Weishampel, Drake, Shrestha, Clint Slatton, Awe and Carter2011, 2014; Ford et al. Reference Ford, Bihr, Morales, Arroyo, Salinas and Rojas2014; Prufer et al. Reference Prufer, Thompson and Kennett2015; Weishampel et al. Reference Weishampel, Hightower, Chase, Chase and Patrick2011), Mexico (Fernandez-Diaz et al. Reference Fernandez-Diaz, Carter, Shrestha and Glennie2014; Hare et al. Reference Hare, Masson and Russell2014; Hutson and Welch Reference Hutson and Welch2014; Rosenswig et al. Reference Rosenswig, Lopez-Torrijos, Antonelli and Mendelsohn2013), and Angkor, Cambodia (Evans et al. Reference Evans, Fletcher, Pottier, Chevance, Soutif, Tan, Im, Ea, Tin, Kim, Cromarty, De Greef, Hanus, Bâty, Kuszinger, Shimoda and Boornazian2013) prompted the pioneering use of LiDAR in the northern Peten of Guatemala by the Mirador Basin Project. Starting in 2015, the project recorded two large-scale aerial LiDAR surveys within the southern half of the MCKB, covering an area of 1703 km2 (Figure 2), making it one of the largest contiguous LiDAR surveys recorded for archaeological research in the Maya Lowlands to date. Our review of over 150 publications and unpublished reports, which detail the use of LiDAR data in Maya Lowlands, has documented 26 individual surveys designed for archaeological research that constitute 18 contiguous regions of 100 km2 or greater (Table 1; see also Canuto et al. Reference Canuto, Estrada-Belli, Garrison, Houston, Acuña, Kováč, Marken, Nondédéo, Auld-Thomas, Castanet, Chatelain, Chiriboga, Drápela, Lieskovský, Tokovinine, Velasquez, Fernández-Díaz and Shrestha2018; Inomata et al. Reference Inomata, Fernandez-Diaz, Triadan, Mollinedo, Pinzón, Hernández, Flores, Sharpe, Beach, Hodgins, Diaz, Luna, Chávez, Jiménez and Díaz2021), demonstrating the importance of regional-scale surveys in Maya archaeology. In these regional studies, LiDAR has facilitated mapping of settlement observations and cultural features, and enabled detailed environmental, geological, geomorphological, and hydrological interpretation.
Selected large-scale LiDAR surveys in the Maya Lowlands. Included are contiguous surveys greater than 100 km2 in size, designed for Maya archaeological research. Not included in this list are very large, but low-resolution surveys recorded in Mexico, primarily for terrain analysis, environmental studies, and emergency planning (Inomata et al. Reference Inomata, Fernandez-Diaz, Triadan, Mollinedo, Pinzón, Hernández, Flores, Sharpe, Beach, Hodgins, Diaz, Luna, Chávez, Jiménez and Díaz2021; Instituto Nacional de Estadística, Geografía e Informática 2022). Also not included is the G-LiHT survey, a set of discontinuous profiles across the Yucatan Peninsula and Chiapas recorded by NASA and designed for the analysis of terrestrial ecosystems (Cook et al. Reference Cook, Corp, Nelson, Middleton, Morton, McCorkel, Masek, Ranson, Ly and Montesano2013; Hutson et al. Reference Hutson, Dunning, Cook, Ruhl, Barth and Conley2021; Inomata et al. Reference Inomata, Fernandez-Diaz, Triadan, Mollinedo, Pinzón, Hernández, Flores, Sharpe, Beach, Hodgins, Diaz, Luna, Chávez, Jiménez and Díaz2021; Schroder et al. Reference Schroder, Murtha, Golden, Hernández, Scherer, Morell-Hart, Zambrano, Broadbent and Brown2020).

Eagle Mapping conducted the LiDAR survey of the southern MCKB, under contract with FARES, in two phases (Phase I: 2015; Phase II: 2018), using the Riegl LMS-Q1560 system and a Riegl LMS Q780 scanner at nominal altitudes of 550 m and 650 m. The Riegl systems used a scan angle of 58 degrees. The light-beam divergence was 0.25 mrads and the nominal pulse density was 20 pulses/m2. Because of weather conditions, the Phase II survey was recorded at lower levels, requiring more flight lines, at a lower pulse density of 15 pulses/m2. The swath width was 513–741 m, with an overlap of 55–70 percent. The average density of total returns (including vegetation) was 48.39 points/m2 in Phase I and 39.64 points/m2 in Phase II, while the ground return density (Grtn) was 2.18 points/m2 in Phase I and 2.95 Grtn/m2 in Phase II. The LiDAR point data were delivered to FARES in LAS 1.2 in 500 m2 tiles. Post processing of the Phase I survey with Rapidlasso's LASTools software provided a ground density return of 5.2 Grtn/m2. The overall accuracy of both surveys is +/− 15 cm horizontal and +/− 30 cm vertical. QuickTerrain Modeler was used to create bare-earth digital elevation model (DEM) and digital terrain models (DTM) with a 0.5 m resolution. Once the LiDAR-derived DEM was generated, we produced different surface and visualization models to interpret archaeological features, including hillshade with different light positions. Hillshade models have been widely applied in archaeology in tropical environments to enhance, detect, and define cultural remains (A.S.Z. Chase et al. Reference Chase, Chase, Chase, Masini and Soldovieri2017; Chase et al. 2014; Dunning et al. Reference Dunning, Hernández, Beach, Carr, Griffin, Jones, Lentz, Luzzadder-Beach, Reese-Taylor and Šprajc2019; Evans et al. Reference Evans, Fletcher, Pottier, Chevance, Soutif, Tan, Im, Ea, Tin, Kim, Cromarty, De Greef, Hanus, Bâty, Kuszinger, Shimoda and Boornazian2013; Golden et al. Reference Golden, Scherer, Schroder, Murtha, Morell-Hart, Diaz, Álvarez, Firpi, Agostini, Bazarsky, Clark, Van Kollias, Matsumoto, Recinos, Schnell and Whitlock2021; Horn and Ford Reference Horn and Ford2019; Rosenswig and López-Torrijos Reference Rosenswig and López-Torrijos2018; Šprajc et al. Reference Šprajc, Dunning, Štajdohar, Gómez, López, Marsetič, Ball, Góngora, Olguín, Esquivel and Kokalj2021; Thompson Reference Thompson2020). To generate visualizations and interpret archaeological features, we used several software programs, including RVT, ArcMap, GlobalMapper, Quick Terrain Modeler, and QGIS.
Settlement distribution
The LiDAR survey revealed an extraordinary density and distribution of Maya sites concentrated in the MCKB, many of them linked directly or indirectly by a vast causeway network (Figure 2). Using hillshade models derived from a LiDAR DEM, at present 775 ancient Maya settlements (defined as an architectural cluster) have been identified within the southern lowland MCKB, of which 581 are unnamed (Figure 3, Table 2). An additional 189 ancient Maya settlements of varying sizes were identified within the geomorphological borders of the southern MCKB, including the upland karst landscape along the Mirador Anticline, for a total of 964 settlements (of all periods), of which 645 are unnamed as yet. An additional 52 known sites are located on the Campeche side, but without the benefit of contiguous LiDAR, with the exception of dispersed areas in Campeche, Mexico (see Brewer et al. Reference Brewer, Carr, Dunning, Walker, Hernandez, Peuramaki-Brown and Reese-Taylor2017; Reese-Taylor Reference Reese-Taylor, Freidel, Chase, Dowd and Murdock2017; Schroder et al. Reference Schroder, Murtha, Golden, Hernández, Scherer, Morell-Hart, Zambrano, Broadbent and Brown2020; Šprajc Reference Šprajc2020; Šprajc et al. Reference Šprajc, Dunning, Štajdohar, Gómez, López, Marsetič, Ball, Góngora, Olguín, Esquivel and Kokalj2021). Varying scales and structural densities are dependent partially on the bajo landscapes (see also Canuto Reference Canuto and Auld-Thomas2021). A settlement that was thought to be relatively small, on a small elevation surrounded by large bajos, has proven to be much larger in size when direct links, such as intrasite causeways, dams, dikes, canals, common reservoirs, and common bajo utilizations, were detected between the site center and its dependent peripheries. When settlements are determined to be dependent peripheries of larger polities, and defined by bajo borders or arroyos with contemporary occupation and architecture, then a total of at least 417 centers, consisting of cities, towns, and villages with demarcated boundaries, have been identified to date within the MCKB polygon (Figure 3; Supplementary Figure 2). The definition of these terms is a thorny issue, and scholars have attempted to define them for years (e.g., Smith Reference Smith, Fernández-Götz and Krausse2016, Reference Smith2020), with wildly variant results for population and settlement distributions based on definition and numbers of residences, the contemporaneity of structures, and family sizes per residence (Rice and Puleston Reference Rice, Puleston and Ashmore1981:144). A Mesoamerican “city” has been previously defined as “a semi-urban center of at least 4000–5000 people” (Clark Reference Clark, Traxler and Sharer2016:124). A “town” could be considered as a conglomerate of residences and public structures that would have had 1000–3000 inhabitants, while a “village” would be less than 1000 inhabitants. Architecturally, a “city” would be represented by large groups of residential and public architecture, while a “town” would be a much sparser collection of residences and reduced public/ceremonial architecture, and a “village” is defined as a social grouping of residences with at least one or less ceremonial/public structure.
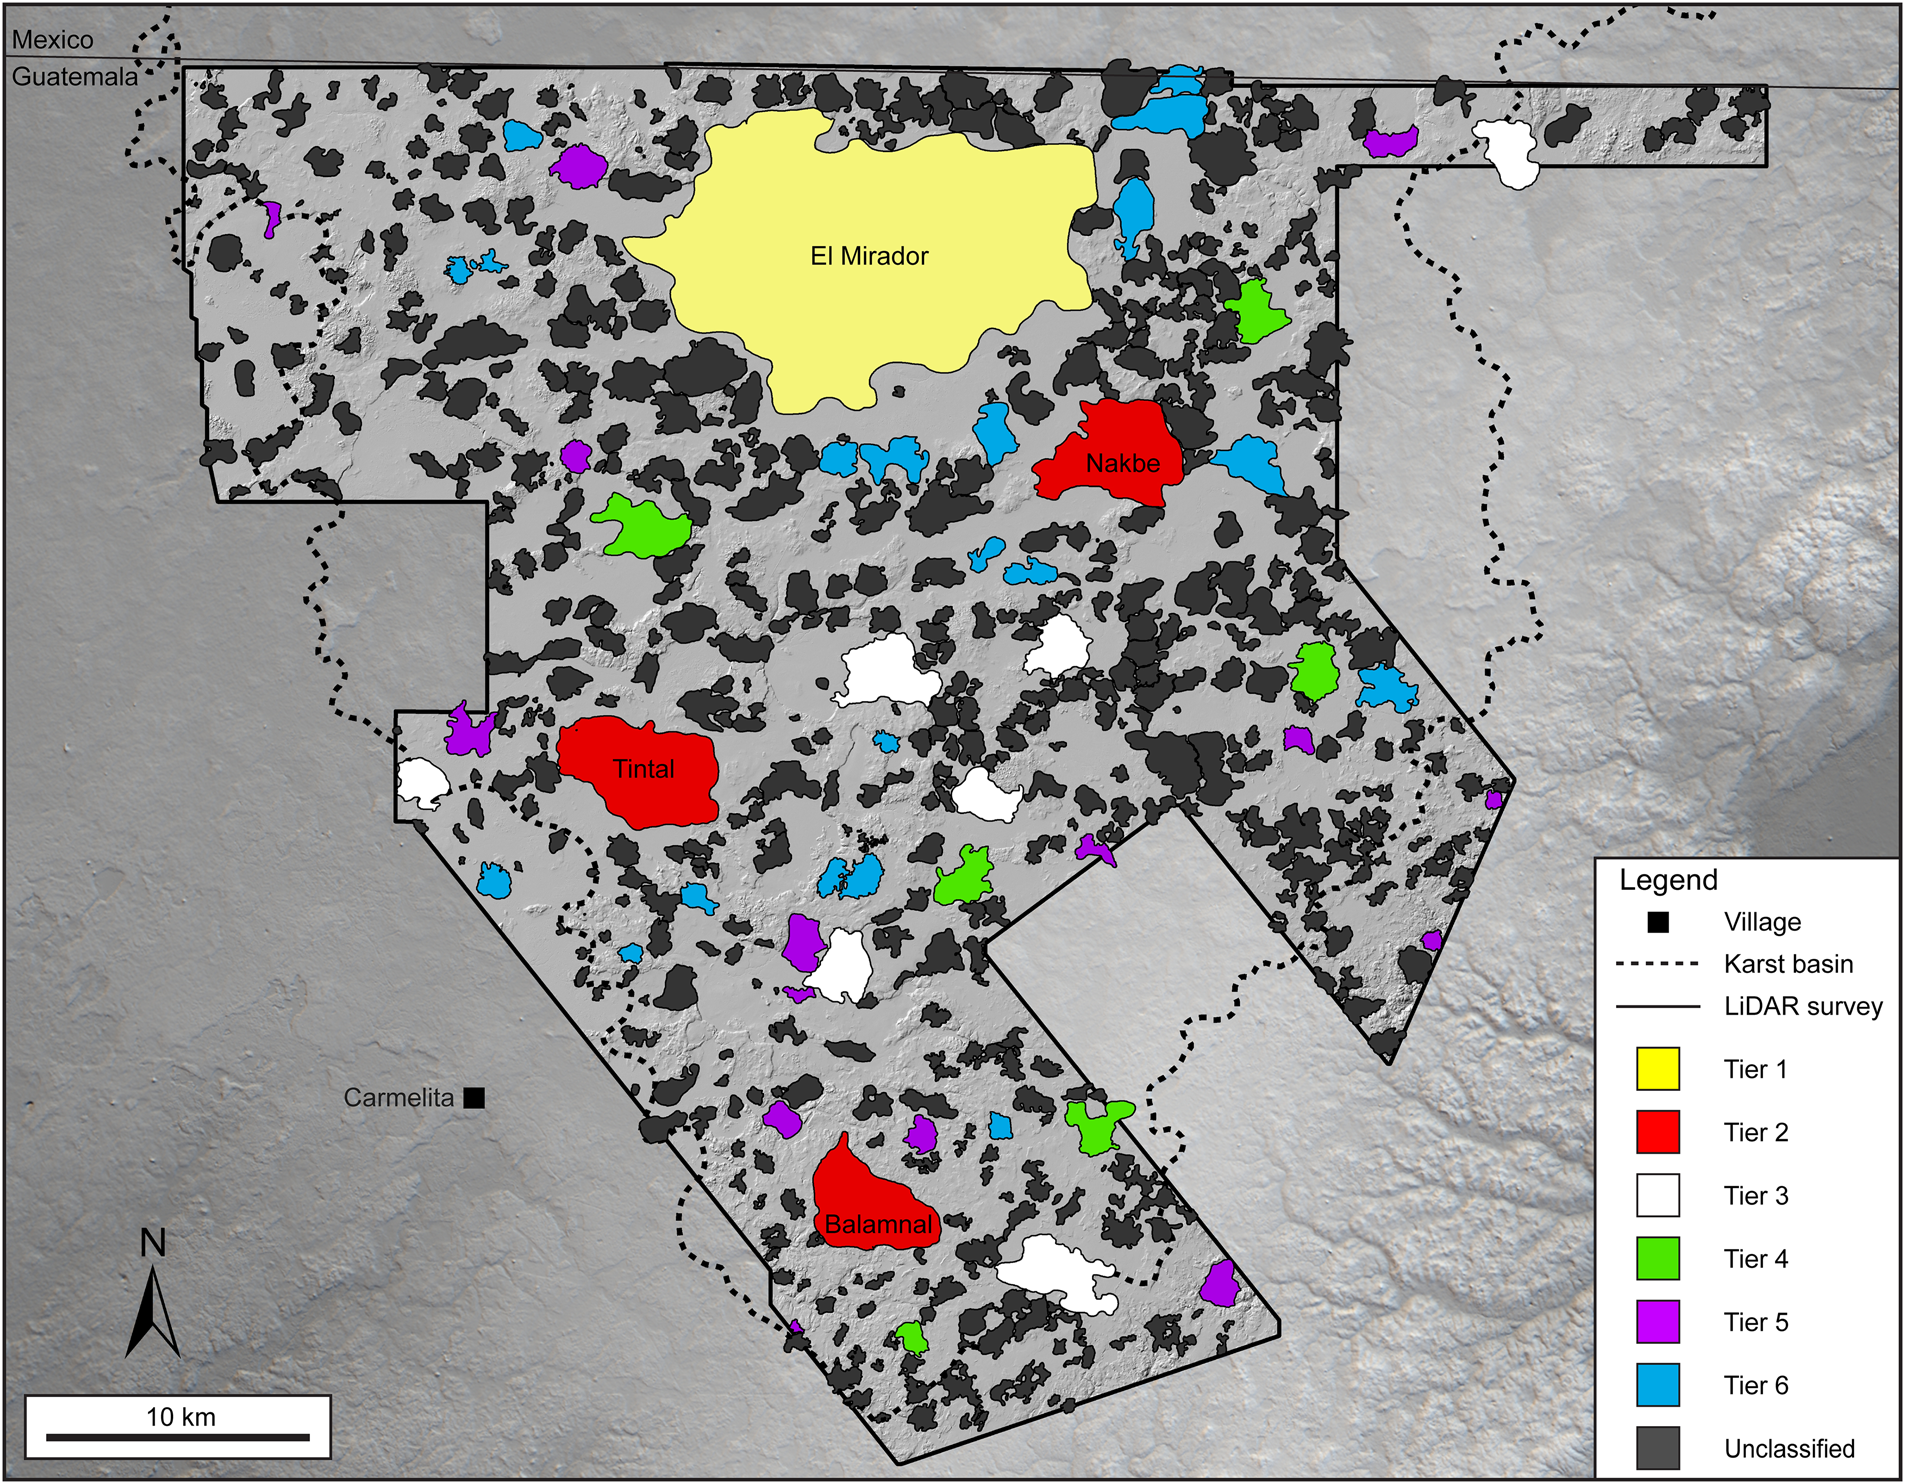
Site center map of the southern MCKB. Polygons represent cohesive site centers identified through GIS analyses of LiDAR, near-infrared data, and ground surveys throughout the southern half of the MCKB. Individual centers may consist of several settlements as suburbs or peripheral sites that are closely affiliated. Polygon colors are proposed tier levels. Digital elevation: ALOS World 3D (AW3D30), Japan Aerospace Exploration Agency (https://www.eorc.jaxa.jp/ALOS/en/aw3d30/), and FARES LiDAR.
Settlement density in the southern MCKB.

To further complicate issues, the Mirador Basin Project has identified an astonishing presence of “invisible” house mounds, with packed earthen floors, postholes, and Preclassic pottery in situ, but with no surface indications of architecture (Johnston et al. Reference Johnston, Hansen, Balcárcel and Morales-Aguilar2015; Paine Reference Paine, Hansen, Morales-Aguilar, Suyuc-Ley and Balcárcel-Villagran2019, Reference Paine, Hansen, Suyuc-Ley, Morales-Aguilar and Balcárcel2020; Paine and Hansen Reference Paine and Hansen2018; Paine et al. Reference Paine, Brunelle, Marconi, Hansen, Morales-Aguilar, Suyuc-Ley and Balcárcel-Villagran2018a, Reference Paine, Johnston, Hernández and Hansen2021; see also Chase Reference Chase, Culbert and Rice1990; Pyburn Reference Pyburn, Culbert and Rice1990). We are unprepared to tackle this issue until enough sampling has been conducted to provide a statistically valid algorithm that would allow a refinement of Preclassic population estimates in the MCKB. In this article, we have preferred to define site sizes as “tiers” with specific spatial qualities, numbers of monumental structures, and volumetrics of contemporary buildings and/or platforms. Larger sites, most of which are contemporaneous based on test excavations, are linked by an extensive causeway network that establishes a premise for early sophistication of socio-economic processes that gave rise to cultural complexity (Hansen Reference Hansen, Hansen and Suyuc-Ley2016a, Reference Hansen, Traxler and Sharer2016b, Reference Hansen, Chacon and Mendoza2017; Hansen et al. Reference Hansen, Suyuc-Ley, Guenter, Morales-Aguilar, Hernández, Balcárcel, Masson, Freidel and Demarest2020; Hernández-Salazar Reference Hernández-Salazar2021; Hernández et al. Reference Hernández, Schreiner, Morales-Aguilar, Arroyo and Salinas2013, Reference Hernández, Schreiner, Hansen, Morales-Aguilar, Ortega G., Mauricio, Hansen and Suyuc-Ley2016; Morales-Aguilar and Castanet Reference Morales-Aguilar, Castanet, Nondédéo, Michelet, Hiquet and Garrido2017). All the causeways previously detected with surface exploration mapping, testing and trenching excavations, and, later, with LiDAR were plotted in different bare-earth models to better understand how the Maya built their causeway system to consolidate a powerful state-level society during the Middle and Late Preclassic periods (see Causeways, below).
Years of field mapping, combined with LiDAR data and decades of archaeological research, have revealed a hierarchy of contemporaneous Preclassic settlements in sites with ceremonial characteristics, large, monumental architecture, and residential densities within the MCKB (Figures 4 and 5; Table 3). Others have attempted the identification of a tiered site hierarchy based on plaza counts, house styles, palaces, platforms, and surface area (e.g., Adams Reference Adams1990; Adams and Jones Reference Adams and Jones1981; Wright and Johnson Reference Wright and Johnson1975:270, 281). Additional tiers of sites, not noted in this article, include residential groups with no ceremonial or “public” architecture, such as that noted previously by Hammond in his identification of the nine tiers of Late Classic Belize (Hammond Reference Hammond and Graham1975). The various settlement tiers in the MCKB were identified by variations in (1) the surface area of sites with monumental architecture larger than 12 m high; (2) the presence, consistent sizes, and numbers of ceremonial/public architecture, such as pyramids, E-Groups and triad groups; (3) the volume of artificial contemporaneous constructions within a 1 km2 area identified as a site or civic center with volumetrics, a concept previously suggested (Adams and Jackson Adams Reference Adams and Jackson Adams2003), but not applied (but see Stanton et al. Reference Stanton, Ardren, Barth, Fernandez-Diaz, Rohrer, Meyer, Miller, Magnoni and Pérez2020); (4) the presence of intrasite and intersite causeways; (5) the number of Preclassic residence platforms; (6) the presence of ballcourts; (7) logistics facilities, including reservoirs and terrace systems; and (8) the presence of defensive constructions.
Monumental architecture map of the southern MCKB with ballcourts, E-Groups, triadic complexes, causeways, pyramids, and modern villages. Background color represents terrain elevation with lowest elevations in light blue-green, gradually increasing to higher elevations in browns, and highest elevations in white. Digital elevation data: ALOS World 3D (AW3D30), Japan Aerospace Exploration Agency (https://www.eorc.jaxa.jp/ALOS/en/aw3d30/), and FARES LiDAR.

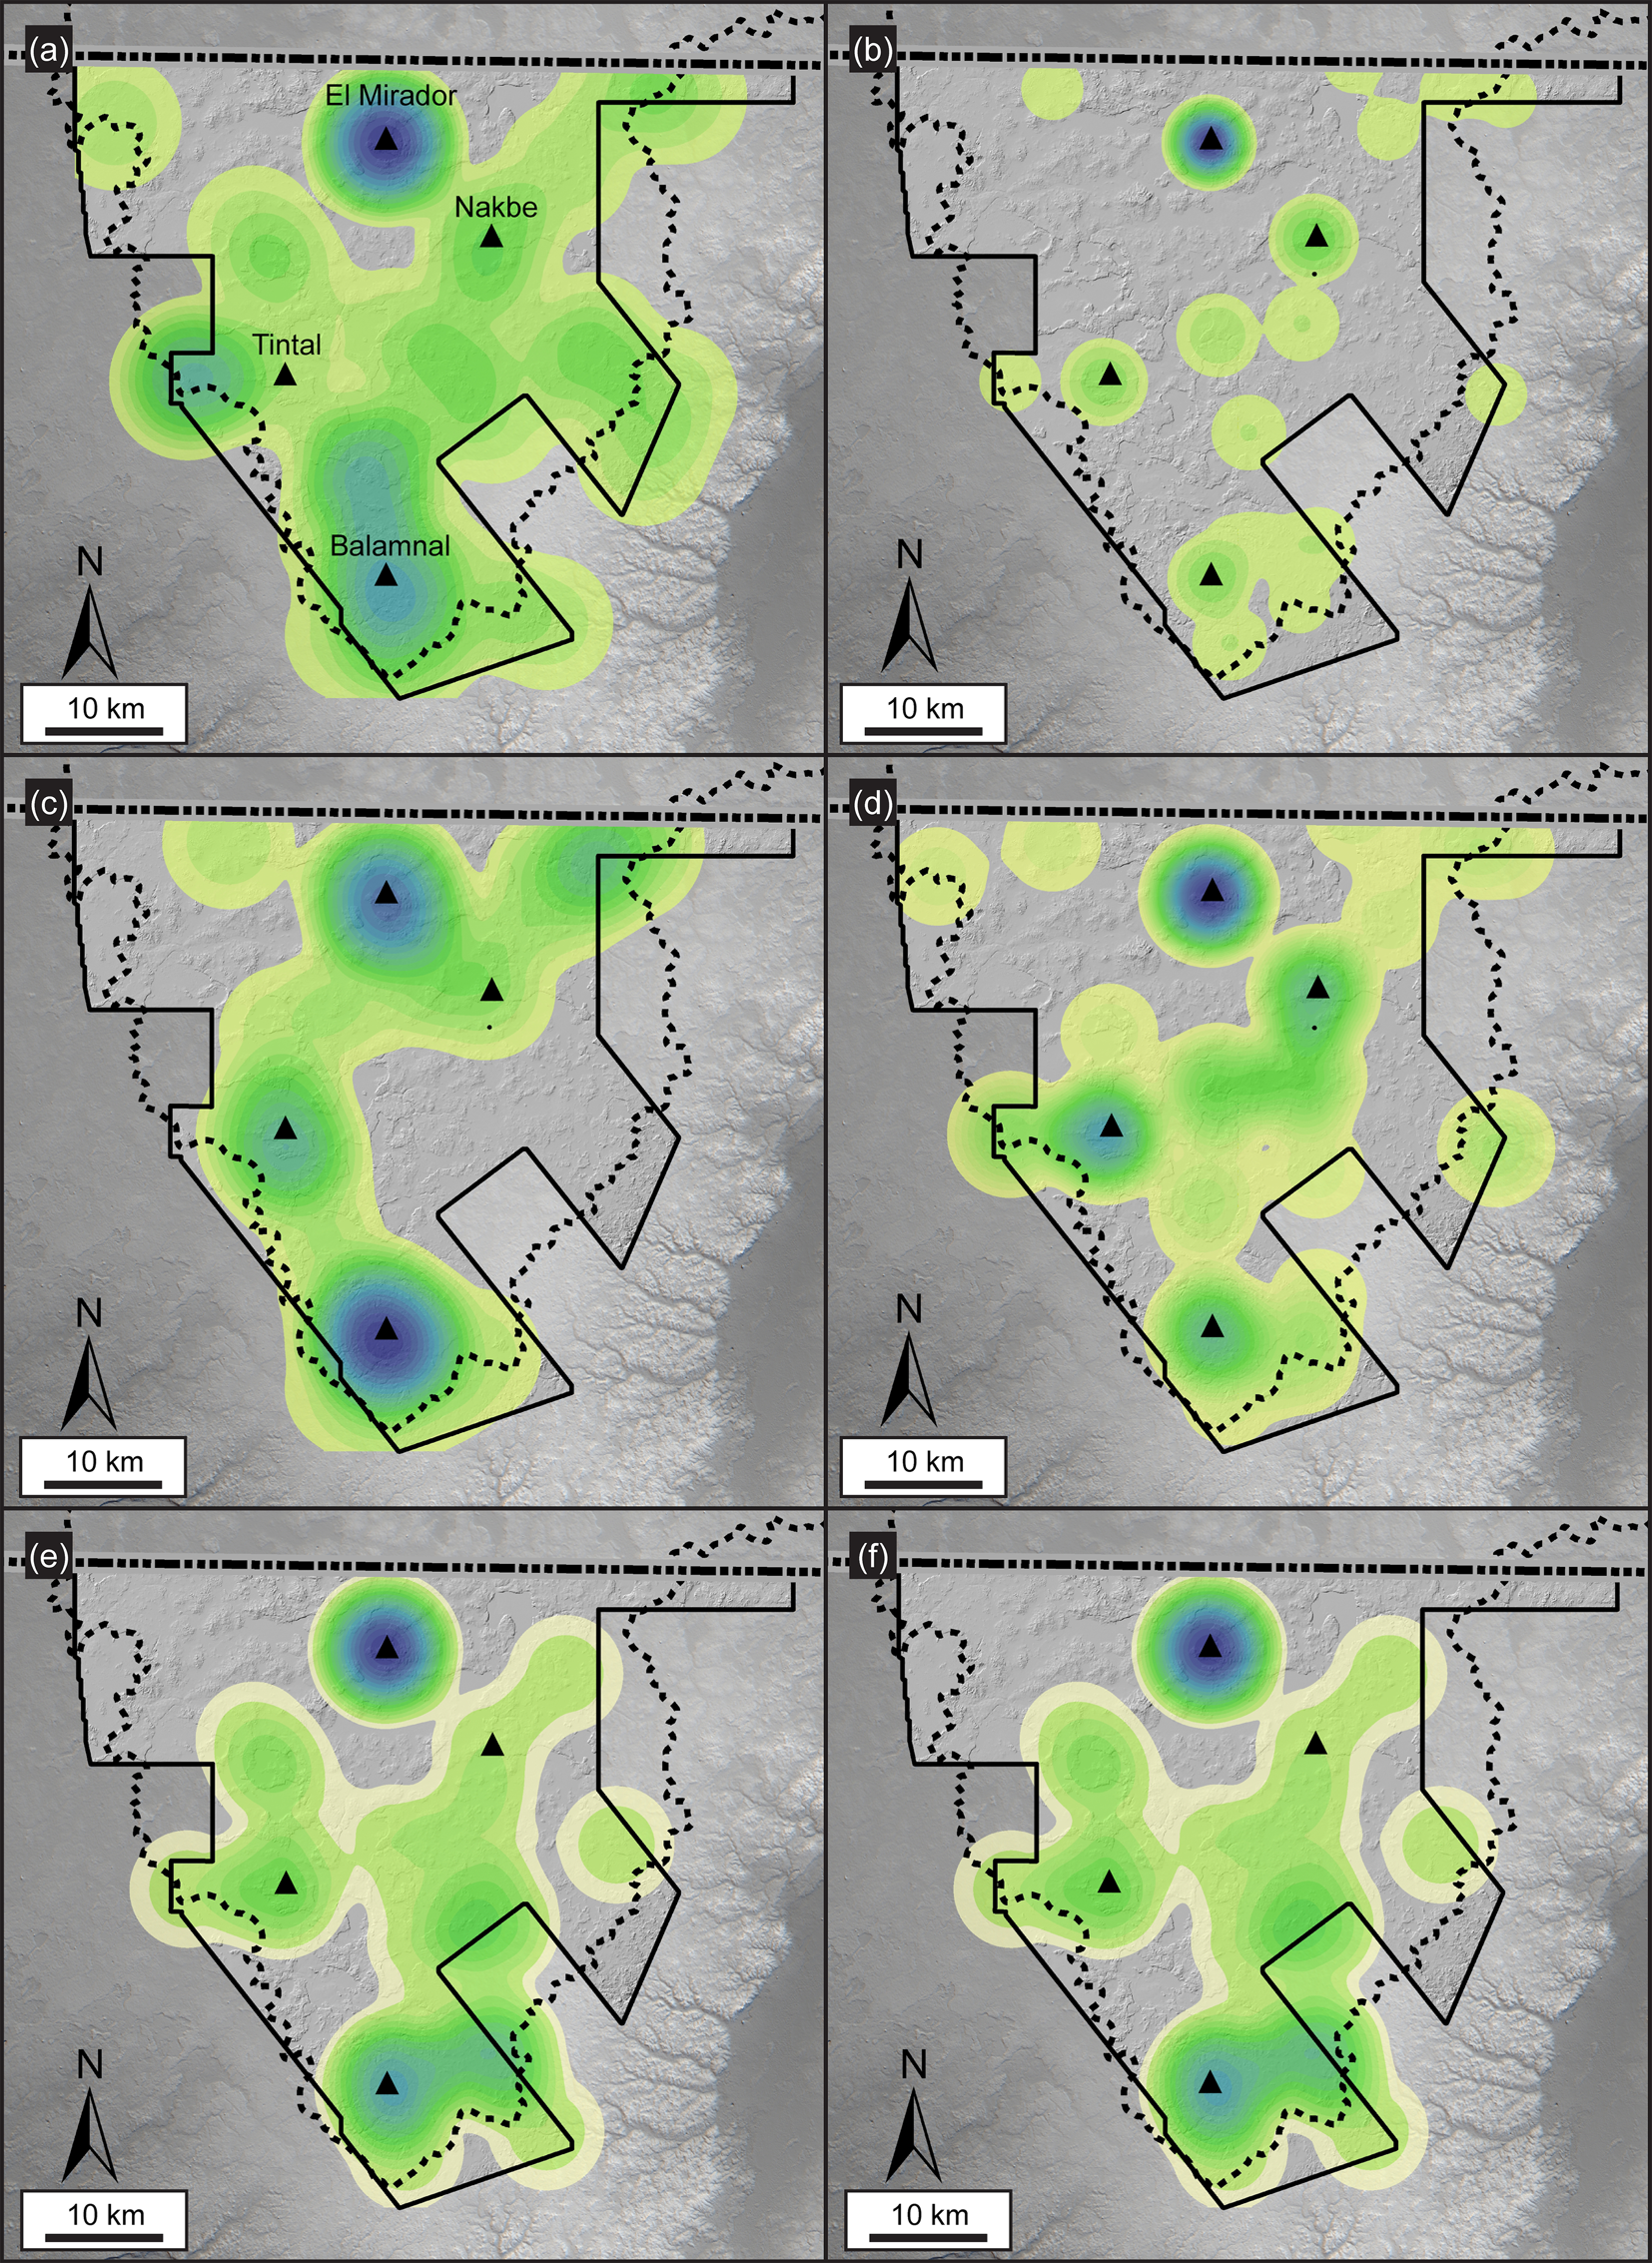
Density analyses of monumental features in the southern MCKB, showing (a) E-Groups, (b) triadic complexes, (c) intersite causeways, (d) intrasite causeways, (e) ballcourts, and (f) large reservoirs. The density scale shows low architectural density in yellow, varying moderate density in shades of green, and high architectural density in blue. Digital elevation: ALOS World 3D (AW3D30), Japan Aerospace Exploration Agency (https://www.eorc.jaxa.jp/ALOS/en/aw3d30/), and FARES LiDAR.
Surface area of Preclassic sites and monumental metrics for randomly selected sites in Tiers 1–6 in the MCKB.
The diachronic changes in site rank and status reveal changes of the political, economic, and social status of sites through time. The largest sites varied chronologically: Nakbe, Wakna, El Pesquero, Xulnal, El Mirador, Kunal, Yaxnohcah, and Balamnal have a strong presence in the Middle Preclassic period (ca. 900–400 b.c.). Sites such as El Mirador, Tintal, Nakbe, and Balamnal became even more dominant by the early Late Preclassic period (ca. 300 b.c.), indicating fluctuating fortunes of various centers through time (Hansen et al. Reference Hansen, Suyuc-Ley, Guenter, Morales-Aguilar, Hernández, Balcárcel, Masson, Freidel and Demarest2020; Morales-Aguilar Reference Morales-Aguilar2021; Reese-Taylor et al. Reference Reese-Taylor, Hernández, Esquivel, Monteleone, Uriarte, Carr, Acuña, Fernandez-Diaz, Peuramaki-Brown and Dunning2016).
By the late Middle Preclassic and early Late Preclassic periods, El Mirador became the dominant site, with monumental platforms, pyramids, agricultural terraces, water collection mechanisms, raised fields, E-Group and triadic architectural constructions, massive causeways, and a high demographic density as part of a network of allied sites with a nucleated power structure throughout the geographical confines of the MCKB (see Hansen and Guenter Reference Hansen, Guenter, Fields and Reents-Budet2005). The civic center of the site, together with its subordinate suburbs, populated affiliated bajos, residential architecture, and monumental architecture, covers 132 km2, making it the largest center in the basin, comparable to the post-LiDAR area of sites such as Caracol, at 177–317 km2 (e.g., Chase and Cesaretti Reference Chase and Cesaretti2018; Chase and Chase Reference Chase, Chase, Freidel, Chase, Anne S and Murdock2017; Chase et al. Reference Chase, Chase, Awe, Weishampel, Iannone, Moyes, Yaeger and Kathryn Brown2014a:214–216, Reference Chase, Reese-Taylor, Fernandez-Diaz and Chase2016) or pre-LiDAR data at Tikal, at 120 km2 (Culbert et al. Reference Culbert, Kosakowsky, Fry, Haviland, Patrick Culbert and Rice1990) to 165 km2 (Lentz et al. Reference Lentz, Dunning and Scarborough2015:287). The surrounding terrace systems, bajo field systems, and outlying residential compounds would make El Mirador even larger, but the natural borders of bajos, plus the structural format of sites in the basin, suggests a certain autonomy under the overall hegemony of El Mirador.
Part of this area includes several adjacent bajos, which were incorporated specifically in the site size because of extensive ancient modifications, including the presence of residential architecture (Dahlin et al. Reference Dahlin, Foss, Chambers and Matheny1980), raised fields, “chinampa-like” structures, canals, and other artificial modifications within the bajo areas directly affiliated with the civic center (see below). LiDAR revealed similar modifications in the bajos of adjacent areas (e.g., Beach et al. Reference Beach, Luzzadder-Beach, Krause, Guderjan, Valdez, Fernandez-Diaz, Eshleman and Doyle2019).
LiDAR site definitions and boundary identifications
LiDAR remote sensing in tropical forests has become a useful tool for detection of archaeological remains through the application of a GIS-based approach (Canuto et al. Reference Canuto, Estrada-Belli, Garrison, Houston, Acuña, Kováč, Marken, Nondédéo, Auld-Thomas, Castanet, Chatelain, Chiriboga, Drápela, Lieskovský, Tokovinine, Velasquez, Fernández-Díaz and Shrestha2018; Chase et al. Reference Chase, Chase, Weishampel, Drake, Shrestha, Clint Slatton, Awe and Carter2011, Reference Chase, Chase, Awe, Weishampel, Iannone, Moyes, Yaeger, Kathryn Brown, Shrestha, Carter and Diaz2014b; Evans et al. Reference Evans, Fletcher, Pottier, Chevance, Soutif, Tan, Im, Ea, Tin, Kim, Cromarty, De Greef, Hanus, Bâty, Kuszinger, Shimoda and Boornazian2013; Ford et al. Reference Ford, Bihr, Morales, Arroyo, Salinas and Rojas2014; Garrison et al. Reference Garrison, Houston and Firpi2019; Inomata et al. Reference Inomata, Triadan, Pinzón and Aoyama2019, Reference Inomata, Triadan, Vázquez López, Fernandez-Diaz, Omori, Bauer, Hernández, Beach, Cagnato, Aoyama and Nasu2020, Reference Inomata, Fernandez-Diaz, Triadan, Mollinedo, Pinzón, Hernández, Flores, Sharpe, Beach, Hodgins, Diaz, Luna, Chávez, Jiménez and Díaz2021; Rosenswig and Lopez-Torrijos Reference Rosenswig and López-Torrijos2018; Rosenswig et al. Reference Rosenswig, Lopez-Torrijos, Antonelli and Mendelsohn2013). Our extensive previous archaeological surveys carried out before LiDAR acquisition were used to support our interpretation of archaeological features observed on LiDAR data. One of the common problems in Lowland Maya archaeology has been the identification of site boundaries and borders (Adams and Jones Reference Adams and Jones1981:301; Culbert et al. Reference Culbert, Kosakowsky, Fry, Haviland, Patrick Culbert and Rice1990; Drápela et al. Reference Drápela, Kováč, Lieskovský, Straka, Peschl, Arroyo, Salinas and Álvarez2016). LiDAR data covering the contiguous area in the southern MCKB have offered the opportunity to refine these details. For example, our criteria for site definitions consisted of individual settlements that were found to have intrasite causeways, contemporaneous architecture of consistent forms, and/or shared subsistence facilities or constructions which articulated with a site homogeneity that was absent with other sites. In this study, remote-sensing methods have been applied to determine site limits using geographical characteristics. This was combined with the natural topography of the area to provide identifiable circumscribed borders, such as bajos, civales, or arroyos, to settlements which appear now to have been part of the same site. This allowed surface area determinations of specified sites with chronological similarities, and many have been confirmed by mapping survey, salvage of looters’ trenches and test pits, and horizontal architectural excavations at 56 separate sites conducted on a regional scale by the Mirador Basin Project.
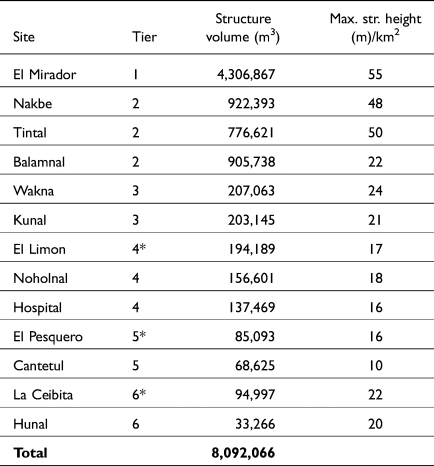
Using LiDAR data and analyses, combined with surface mapping and archaeological excavations, we propose a six-tiered settlement hierarchy for sites with monumental architecture established by the Middle Preclassic and Late Preclassic periods (Figure 6). This six-tiered settlement hierarchy is consistent with the use of four-tiered settlement data elsewhere in the world to suggest the existence of a more complex or “state-level” governance (Wright and Johnson Reference Wright and Johnson1975). This hierarchy was derived by the surface area of the site epicenters, the associated number of major buildings, platforms, plazas, and agricultural and hydraulic features, as determined by archaeological data and calculations of the volume of the built environment of contemporaneous architecture (construction and/or utilization). The selected examples are not comprehensive, but indicative of site sizes (Figure 4). The presence of dense settlements and centers of varying sizes within the MCKB and its surrounding natural frame indicates a prodigious growth and development in the Middle and Late Preclassic periods of Maya occupation (Figures 2 and 3). The tiered layers of sites were established through the analysis of topography for natural site boundaries, as well as the concentration and distribution of Preclassic structures, numbers and sizes of plazas, public and residential structures, platforms, intrasite causeways, E-Groups, ballcourts, the number of dominant triadic structures, chronological contemporaneity, and architectural volumetrics (Figures 5a–5f; Tables 3 and 4). In addition, the uniformity of the testing strategy for tier identification which could be applied to any Maya site would be to identify an area of 1 km2 and determine the volumetrics of construction fill of contemporaneous architecture within the area. Based on those criteria, we suggest that the largest site in the MCKB is El Mirador, which represents Tier 1, covering an area of 132 km2, with monumental architecture greater than 15 m high. This area included several surrounding bajos because of the presence of low residential architecture throughout them (e.g., Dahlin et al. Reference Dahlin, Foss, Chambers and Matheny1980; Hernández et al. Reference Hernández, Schreiner, Morales-Aguilar, Hansen, Arroyo, Salinas and Álvarez2019), and the extensive raised fields immediately associated with the civic center in the Bajo La Jarilla (Hansen et al. Reference Hansen, Forsyth, Woods, Hansen, Schreiner, Titmus, Bey and Brown2018a, Reference Hansen, Morales-Aguilar, Schreiner, Hernández, Arroyo, Méndez-Salinas and Ajú-Álvarez2018b; Figure 7). It is even possible that the civales/bajos within the civic center of El Mirador were densely populated with “stilt” communities, or elevated wooden residential platforms, judging by the presence of Preclassic slipped and utilitarian ceramics found in numerous test pits throughout the bajos (e.g., Dahlin et al. Reference Dahlin, Foss, Chambers and Matheny1980; Hernández et al. Reference Hernández, Schreiner, Morales-Aguilar, Hansen, Arroyo, Salinas and Álvarez2019; Jacob Reference Jacob, Laporte, Escobedo and de Brady1994; Johnston et al. Reference Johnston, Hansen, Balcárcel and Morales-Aguilar2015; Paine et al. Reference Paine, Brunelle, Marconi, Hansen, Morales-Aguilar, Suyuc-Ley and Balcárcel-Villagran2018a, Reference Paine, Hansen, Morales-Aguilar and Johnston2018b). Even excluding the bajos within the confines of the site (37.93 km2, or 28.64 percent), the upland area with Preclassic monumental and residential architecture is 94.51 km2, or 71.36 percent of the suggested site area. El Mirador is also composed of a periphery with large areas of residential structures connected by a causeway network. The associated bajos were highly exploited by the Maya during the Preclassic period. Raised fields, large reservoirs, and canals were constructed in the wetland system and were key elements in Preclassic agrarian and water management strategies. Large numbers of E-Groups, triadic pyramids, and other complexes at El Mirador, in addition to the presence of carved monuments depicting rulers (see Table 3; e.g., Hansen Reference Hansen, Boxt and Dillon2012a:155, Reference Hansen, Traxler and Sharer2016b:382, 386, 394–397, 409; Hansen and Guenter Reference Hansen, Guenter, Fields and Reents-Budet2005; Hansen et al. Reference Hansen, Forsyth, Woods, Hansen, Schreiner, Titmus, Bey and Brown2018a:160; Justeson and Mathews Reference Justeson and Mathews1983), represent a high concentration of political power in the Maya Lowlands during Preclassic times. Combined architectural mass in a 1 km2 sample of our Tier 1 site civic center was calculated in two ways: (1) computer generations of volume, using programs of ArcGIS Pro, Global Mapper, and QGIS; (2) geometrical mathematical calculations using total station contour measurements for platform volumes, and truncated and pointed pyramidal superstructures which amounted to a calculated minimum of 4,809,310 m3 of construction fill for contemporaneous structures for the 1 km2 of the West Group of El Mirador. Calculations of the mass of architecture using three separate programs provided an approximate volumetric estimate of approximately 4,306,867 m3 (Global Mapper), in the selected 1 km2 at the site.
Graph of the monumental architectural features in the southern MCKB showing the various normalized levels of consistency of settlement hierarchies.

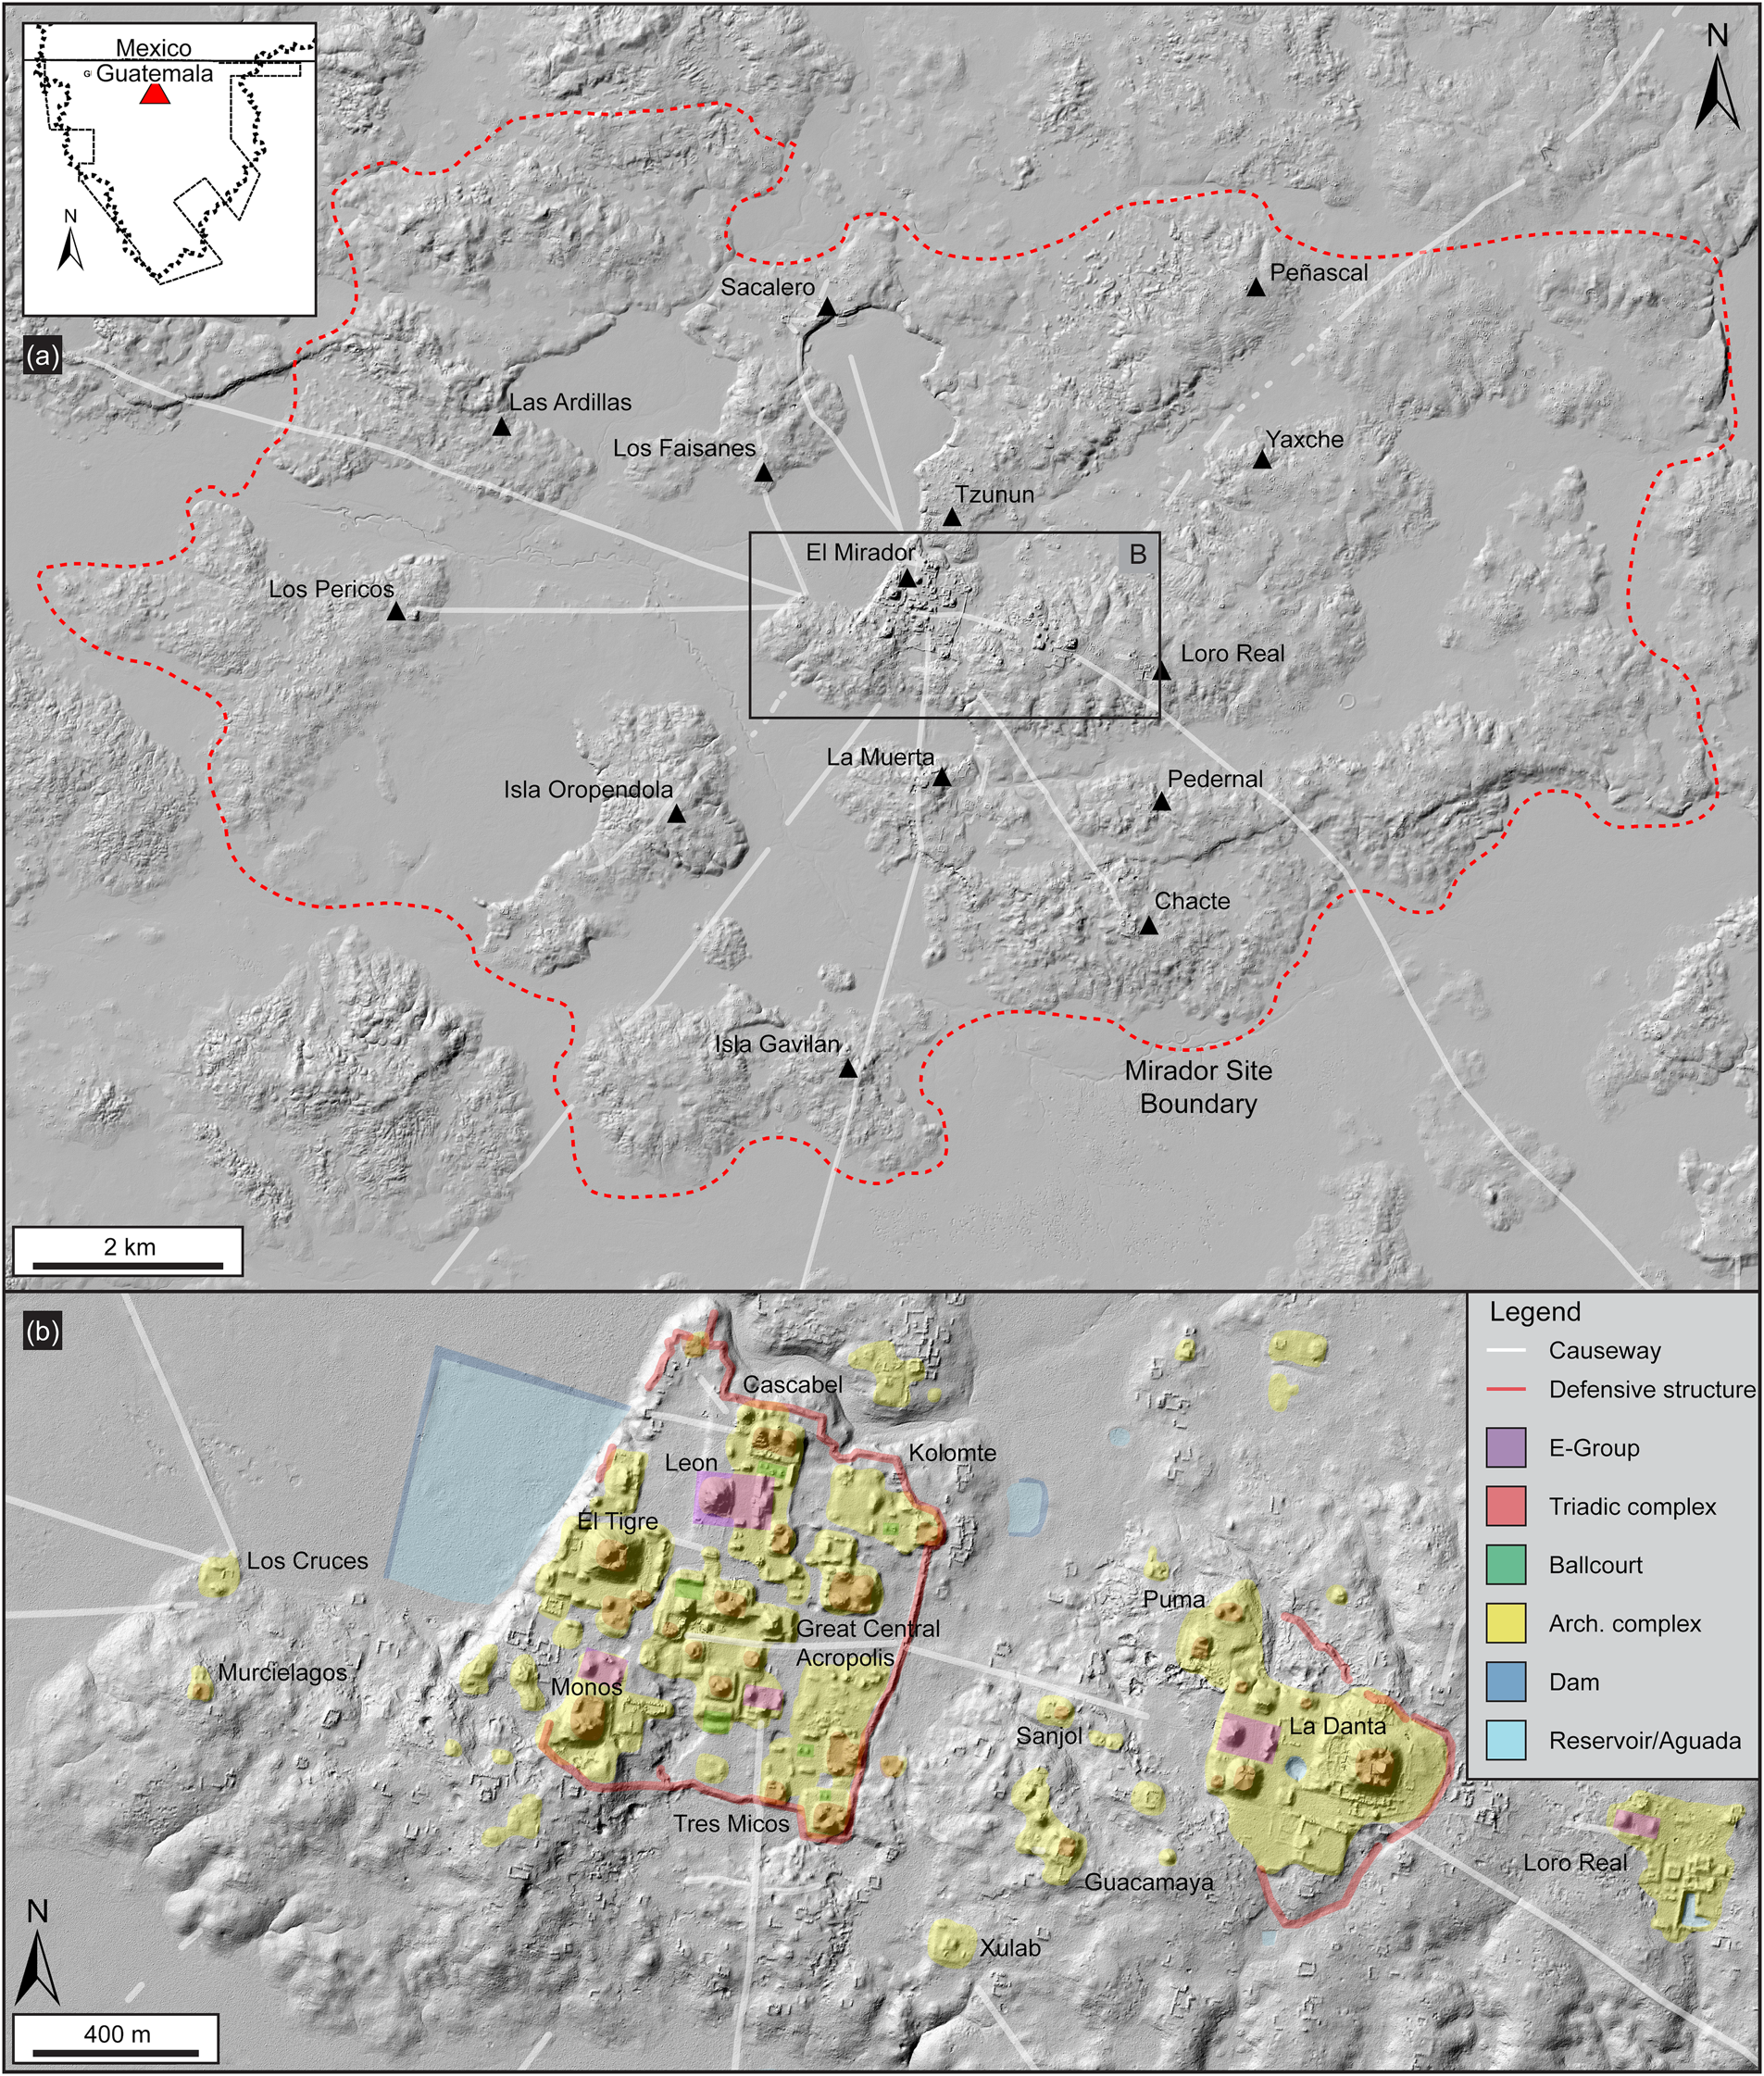
(a) Example of a Tier 1 site center, El Mirador. Structures range between 15 and 72 m high in the areas indicated. The area of the site is indicated by the dotted red line and associated suburbs of the city are connected by intrasite causeways. Monumental architecture and intrasite causeways indicate that the site covers an area of 132 km2. (b) The volumetrics of 1 km2 of the civic center, consisting primarily of the walled West Group of the site, exceed 4,000,000 m3.
Sample of volumetric evaluations of a 1 km2 area for selected sites. Global Mapper was the program used for the majority of volumetrics in this article.
* Volumetrics, architectural morphology, and site surface area require additional testing for confirmation of tier category.
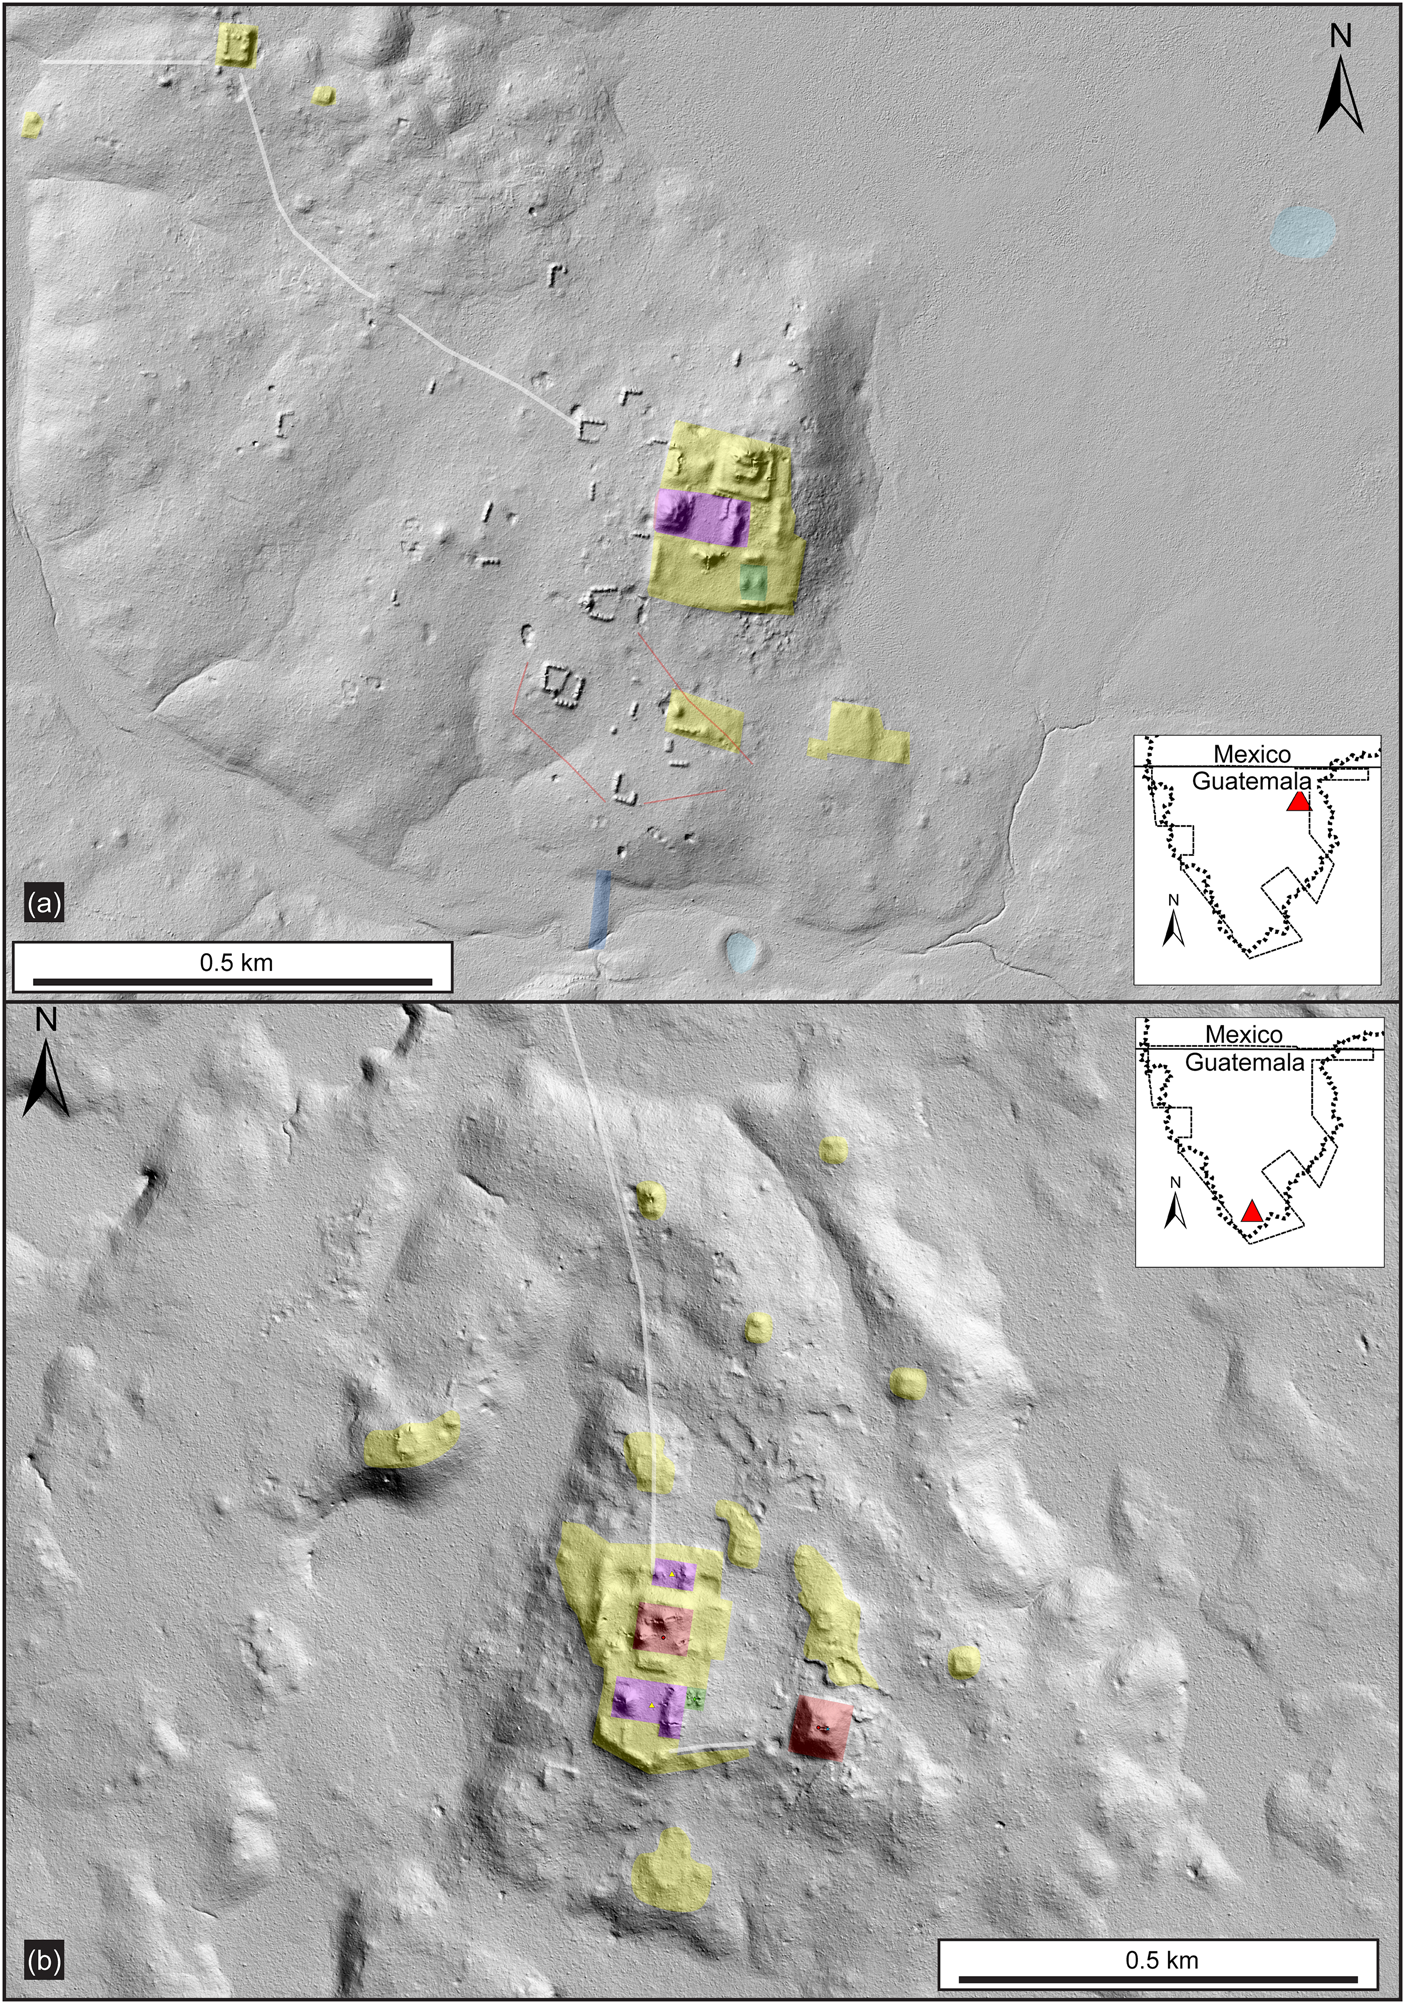
The Tier 2 sites, such as Tintal, Balamnal, and Nakbe, have a surface area ranging between 13 and 19 km2 (Figure 8), but some of the features described above are less frequent or absent. The presence of fewer large reservoirs and carved monuments suggests a different level of political organization. Nevertheless, all of the Tier 2 sites show monumental architecture up to 50 m in height and causeway networks. Tier 2 sites have a 1 km2 mass of contemporaneous artificial construction, ranging from 922,392 m3(Global Mapper) to 945,678 m3 (QGIS) at Nakbe, 776,620 m3 (Global Mapper) to 781,645 m3 (QGIS) at Tintal, and 905,737 m3 (Global Mapper) to 941,633 m3 (QGIS) at Balamnal.
LiDAR images of example Tier 2 sites: (a) Tintal, with structures between 20 and 50 m high, numerous platforms, and intersite and intrasite causeways; and (b) Nakbe, with a surface area of 13–19 km2, and volumetrics of a 1 km2 sample exceeding 906,000 m3. Color codes for the shaded image are provided in the legend shown in Figure 7b.
Tier 3 sites include centers such as El Pesquero, Wakna, Porvenir, Uaymil, Xulnal, and others with civic centers with surface areas ranging between 2.7 and 8.0 km2 (Figure 9). Tier 3 sites are smaller in surface area than Tier 2 sites, but differ from Tier 4 sites because of the larger size and greater abundance of monumental architecture, with at least five structures ranging from 8 to 20 m in height within the civic centers. All Tier 3 sites have E-Groups, but the sizes and scales of the eastern platforms are 150–200 m in length. All Tier 3 sites have intrasite causeways which link architectural complexes within the civic centers, indicating an administrative and settlement distribution hierarchy. Computer volumetrics of Tier 3 sites range between 200,000 and 300,000 m3/km2, based on Global Mapper calculations.
LiDAR images of example Tier 3 sites: (a) Wakna, with a surface area of 7.4 km2; and (b) El Pesquero, with a surface area of 7.7 km2 and at least five structures that exceed 12 m in height. However, El Pesquero has volumetrics of 81,516 m3 of construction fill, which could place it as a Tier 5 site, pending additional investigation. Color codes for the shaded image are provided in the legend shown in Figures 6 and 7b.

Tier 4 sites include centers such as Noholnal, El Civalon, La Union, and El Hospital, with an average surface area between 1.01 and 4 km2 (Figure 10). These sites differ from Tier 5 sites in that they generally have more triadic structures (2+), usually at least one ballcourt, and intrasite causeways to link various architectural groups with the civic centers. Computer-generated volumetrics estimated these tiers at between 137,000 m3 (Hospital), 156,000 m3 (Noholnal), and sites up to approximately 200,000 m3 of contemporaneous constructions within the 1 km2 selected.
LiDAR images of examples of Tier 4 sites: (a) El Hospital, with an area of 3 km2 and a 1 km2 architectural volumetrics of 137,469 m3; and (b) Noholnal, with an area of 3 km2 and a 1 km2 structural volume of 156,601 m3. These tiers have sophisticated, large Preclassic complexes, platforms, and causeways. Color codes for the shaded image are provided in the legend shown in Figures 6 and 7b.
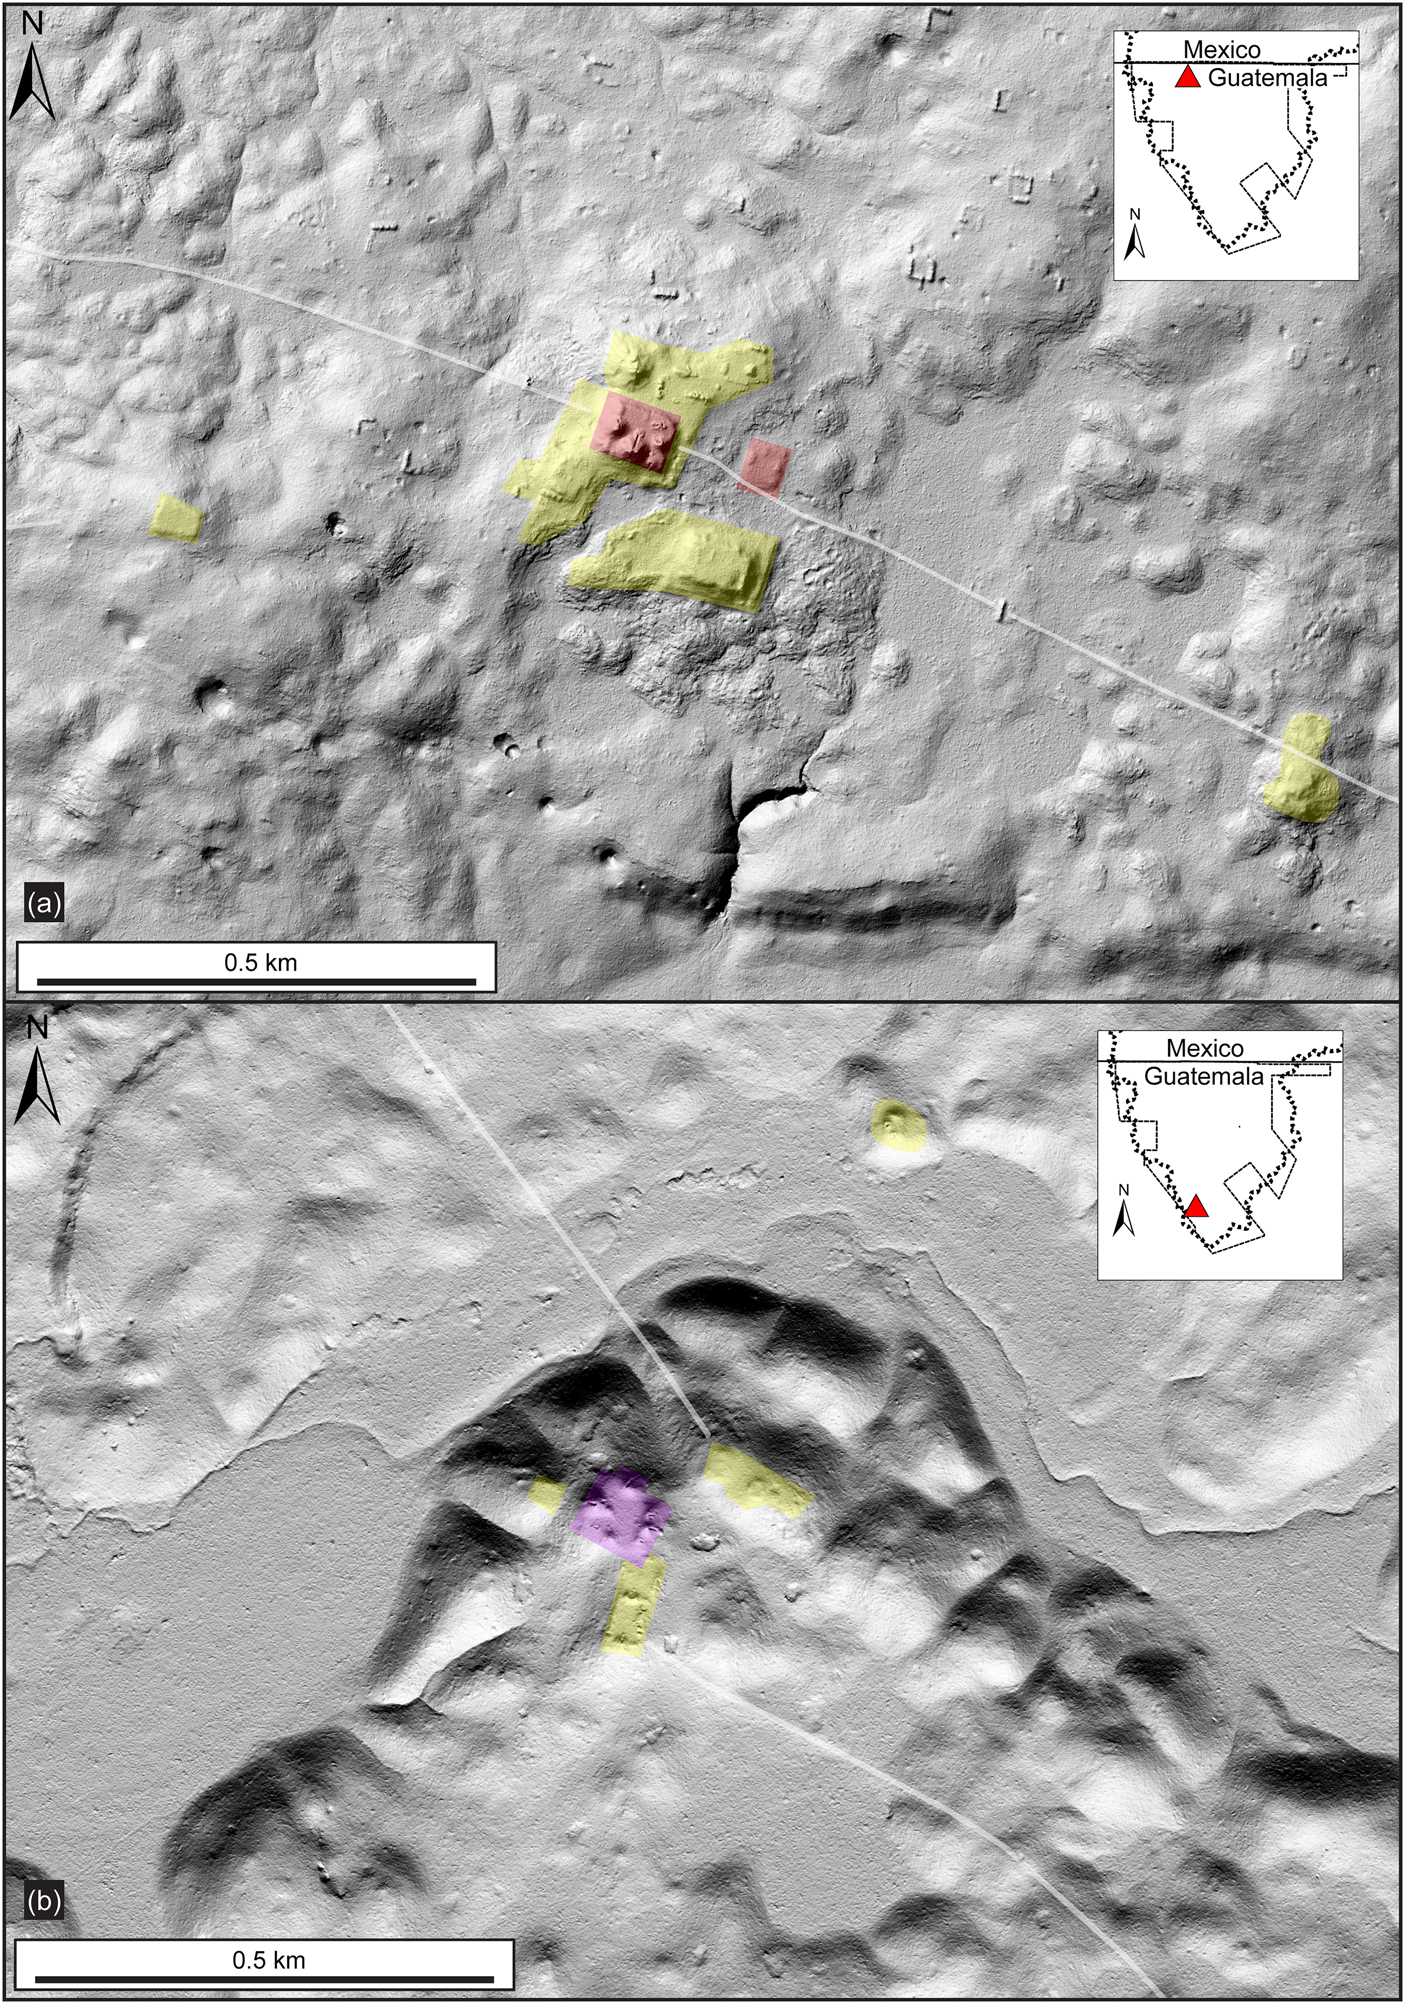
Tier 5 sites include La Tortuga, Naranjito, Los Torres, Cantetul, and La Pailona, with a surface area of 1.2–3.04 km2 (Figure 11). All Tier 5 sites have E-Groups, in spite of the diminished surface area of the civic centers of the sites and computer-generated volumetrics (Global Mapper) of 68,000 m3 (Cantetul) to about 100,000 m3 (El Pesquero).
LiDAR images of examples of Tier 5 sites: (a) El Limon covers an area of 2.5 km2, but has volumetrics of 194,189 m3/km2, making it a candidate for a Tier 4 classification, pending further investigations; (b) the site of Cantetul covers an area of 1.30 km2, with volumetrics of 68,224 m3/km2. Color codes for the shaded image are provided in the legend shown in Figures 6 and 7b.
Examples of Tier 6 sites include Las Ilusiones, La Ceibita, Hunal, El Karstico, La Florida, Hunbe, and Noholtun, with surface areas between 0.16 and 1.5 km2 (Figure 12). Only one of the Tier 6 sites has an E-Group, but all of these sites have at least one monumental structure that exceeds 12–22 m in height. Sites such as Oxkinal, located on the western margin of the MCKB consists solely of an E-Group. Sites such as La Ceibita and Hunal have a massive single pyramid, with a volume of about 33,000–95,000 m3, but no other monumental buildings. Randomly selected examples of site hierarchies are listed in Table 3, with a sample of volumetrics listed in Table 4.
LiDAR images of examples of Tier 6 sites: (a) La Ceibita, which covers an area of 1.0 km2, but has volumetrics of 94,997 m3, which could place the site in a Tier 5 category, pending further investigation. Several residential groups at the site were not included in calculations because of inconsistent contemporaneity with the larger architecture; (b) Hunal, which covers 0.7 km2 and has volumetrics of 33,265 m3/km2. Note the single monumental structures at each site, of 22 m and 20 m high, respectively, with little additional associated architecture. Color codes for the shaded image are provided in the legend shown in Figures 6 and 7b.

We applied a Kernel density method in ArcGIS Pro to analyze the spatial patterns of E-Groups, triadic complexes, intersite causeways, intrasite causeways, ballcourts, and large reservoirs (Figure 5). As a result, six different models show hotspots of concentration of these features. The main hotspot is located at El Mirador, representing the largest cityscape in the southern MCKB. Another important hotspot is represented at Balamnal, demonstrating its sociopolitical influence in the region during the Preclassic period.
New perceptions of the MCKB settlements via LiDAR
Our documentation of hundreds of archaeological sites in the MCKB of northern Guatemala challenges the old notion of sparse early human occupation in the Maya Lowlands, particularly in the Preclassic period (Fox Reference Fox1977:40; Fry Reference Fry1969; Haviland Reference Haviland1965:19; Sanders and Webster Reference Sanders and Webster1988; Thompson Reference Thompson1954:50). The presence of dense settlements within the natural confines of the MCKB indicates prodigious growth and unusual cultural dynamics in the Middle and Late Preclassic periods of Maya occupation. Our preliminary six-tiered settlement and administrative hierarchy of ceremonial sites in the Preclassic period, as identified by excavations conducted over several decades in the MCKB (Figure 5) is indicative of a general uniformity of site morphology in this region. While the Late Classic (a.d. 600–900) presence in the southern MCKB is limited to smaller residential settlements, with the exception of the sites of Naachtun, Porvenir, Tamazul, La Pailona, and Lechugal (on the Guatemalan side), and Uxul, Calakmul, and Pared de los Reyes on the Mexican side, a wider range of tiered hierarchy seems to be found in the Preclassic sites. The consistency of architectural forms and patterns, ceramics, sculptural art, architectural patterns, and unifying causeway constructions within a specified geographical territory suggests a centralized political, social, and economic organic solidarity among the occupants (Hansen and Suyuc-Ley Reference Hansen, Suyuc-Ley and Michelet2011). This is not to imply either the reduced or enhanced political importance of the centers, however, since sites like Xulnal are located in Tier 3 due to the restricted area of the civic center surrounded by large bajos. Clearly, it was an important social and economic hub, based on the number of E-Groups (three), with at least three intrasite causeways, large early architecture, and defensive or restricted access moats. It is also one of the few sites in the basin with a north–south orientation, while most other early sites have an east–west orientation.
The magnitude of the labor in the construction of massive platforms, palaces, dams, causeways, and pyramids dating to the Middle and Late Preclassic periods throughout the MCKB suggests a power to organize thousands of workers and specialists, ranging from lime producers, mortar and quarry specialists, lithic technicians, architects, logistics and agricultural procurement specialists, and legal enforcement and religious officials, all operating under a political and ideological homogeneity. The social, economic, and ideological branches of cultural complexity within a demarcated geographic territory are suggested by differential causeway accessibility. The varied sites within the MCKB are a testament to regional public programs, such as E-Groups, monumental ceremonial architecture, including triadic complexes, intersite causeways, intrasite causeways, ballcourts, reservoirs, dams, canals, terraces, and raised fields (Figures 4–6). Residential architecture within large sites demonstrates a marked inequality of size and sophistication of architecture and the presence, or lack, of imported commodities (e.g., Hansen Reference Hansen, Traxler and Sharer2016b:362–369).
The consistent architectural construction techniques (stone, mortar, stucco, and architectural art), and both utilitarian and ceremonial artifacts in the Middle Preclassic period, plus the innovation of large triadic architecture throughout the area by the beginning of the Late Preclassic period, imply a formation and institutionalization of a unified religious ideology (Coe Reference Coe, Jones and Kautz1981; Durkheim Reference Durkheim1915; Keatinge Reference Keatinge, Jones and Kautz1981; Weber Reference Weber and Fischoff1956). We have yet to identify gridded sites, such as the Middle Preclassic site of Nixtun Ch'ich' (Pugh and Rice Reference Pugh and Rice2017; Pugh et al. Reference Pugh, Nieto and Zygadło2019), which suggests the independent nature of the formation of sociopolitical complexity by this early period. Agricultural terracing has been identified by LiDAR and surface excavations in nearly all areas of the southern MCKB, similar to the Classic period terracing identified at Caracol, Belize (Chase and Chase Reference Chase and Chase1998; Chase et al. Reference Chase, Chase, Awe, Weishampel, Iannone, Moyes, Yaeger and Kathryn Brown2014a:214ff.) and Naachtun (Morales-Aguilar, personal communication 2021), as well as the Preclassic terraces at Nakbe and El Mirador (Hansen Reference Hansen, Boxt and Dillon2012a, Reference Hansen, Traxler and Sharer2016b, Reference Hansen, Chacon and Mendoza2017; Hansen et al. Reference Hansen, Bozarth, Jacob, Wahl and Schreiner2002, Reference Hansen, Forsyth, Woods, Hansen, Schreiner, Titmus, Bey and Brown2018a, Reference Hansen, Morales-Aguilar, Schreiner, Hernández, Arroyo, Méndez-Salinas and Ajú-Álvarez2018b; Martínez Hidalgo et al. Reference Martínez Hildalgo, Hansen, Jacob, Howell, Laporte, Escobedo and de Suasnavar1999). Terraces and sites appear to decrease near the natural borders of the basin, but it may be possible to determine the effects of such extensive populations in the Preclassic on subsequent populations and contemporary rainforest canopy (Hightower et al. Reference Hightower, Butterfield and Weishampel2014). The agricultural and logistical capacity to accommodate large Preclassic populations required a marshalling of labor, on an industrial scale perhaps, for the architectural construction, planting, weeding, watering, and harvesting of the terrace crops.
The monumental architecture, major platforms, complexes known as E-Groups (see below), and associated causeways (see below) were formed by the late Middle Preclassic period, and subsequent constructions were built with up to 1.5 million–2.8 million m3 of fill in a single structure in the Late Preclassic period (Hansen Reference Hansen, Boxt and Dillon2012a, Reference Hansen, Traxler and Sharer2016b; Hansen et al. Reference Hansen, Forsyth, Woods, Hansen, Schreiner, Titmus, Bey and Brown2018a; Suyuc-Ley and Hansen Reference Suyuc-Ley, Hansen, Arnauld and Breton2013). Massive triadic pyramidal structures, such as the pyramid of Tigre at El Mirador, measuring 145 × 150 × 55 m has similar counterparts in at least 12 major sites in the southern MCKB, and similar constructions are noted at Yaxnohcah, Calakmul, and probably Balakbal in Campeche, indicating the magnitude of the contemporaneous labor conscription. Estimates for the construction of Danta are between 6 and 10 million person-days of labor, depending on the volume that might be affected by an undulating bedrock surface (Hansen et al. Reference Hansen, Forsyth, Woods, Hansen, Schreiner, Titmus, Bey and Brown2018a:185). The quantity and density of contemporaneous constructions in the MCKB allow an understanding of the labor, ideological consistency, and uniformity of construction materials invested in, and on, the monumental architecture (E. Hansen et al. Reference Hansen, Hansen, Derrick, Laporte and Escobedo1995, Reference Hansen, Rodriguez-Navarro, Hansen, Vandiver, Druzik, Merkel and Stewart1996, Reference Hansen, Wallert, Derrick, Vandiver, Druzik, Merkel and Stewart1997; Hansen et al. Reference Hansen, Suyuc-Ley, Guenter, Morales-Aguilar, Hernández, Balcárcel, Masson, Freidel and Demarest2020; Schreiner Reference Schreiner, Laporte, de Suasnavar and Arroyo2001, Reference Schreiner2002, Reference Schreiner, Mejía, Hansen and Suyuc-Ley2009, Reference Schreiner2021).
The evidence for complex social, economic, and political organizations and the emergence of a hierarchical sociopolitical structure with institutions of kingship allow the testing of models and hypotheses (Hansen Reference Hansen, Traxler and Sharer2016b, Reference Hansen, Chacon and Mendoza2017). The formation of such hierarchical power structures has anthropological implications that are best observed via diachronic and synchronic perspectives on a regional basis (Haas Reference Haas1982:216).
Monumentality of ritual and religious architecture, ballcourts, causeways, and water collection systems
E-Groups
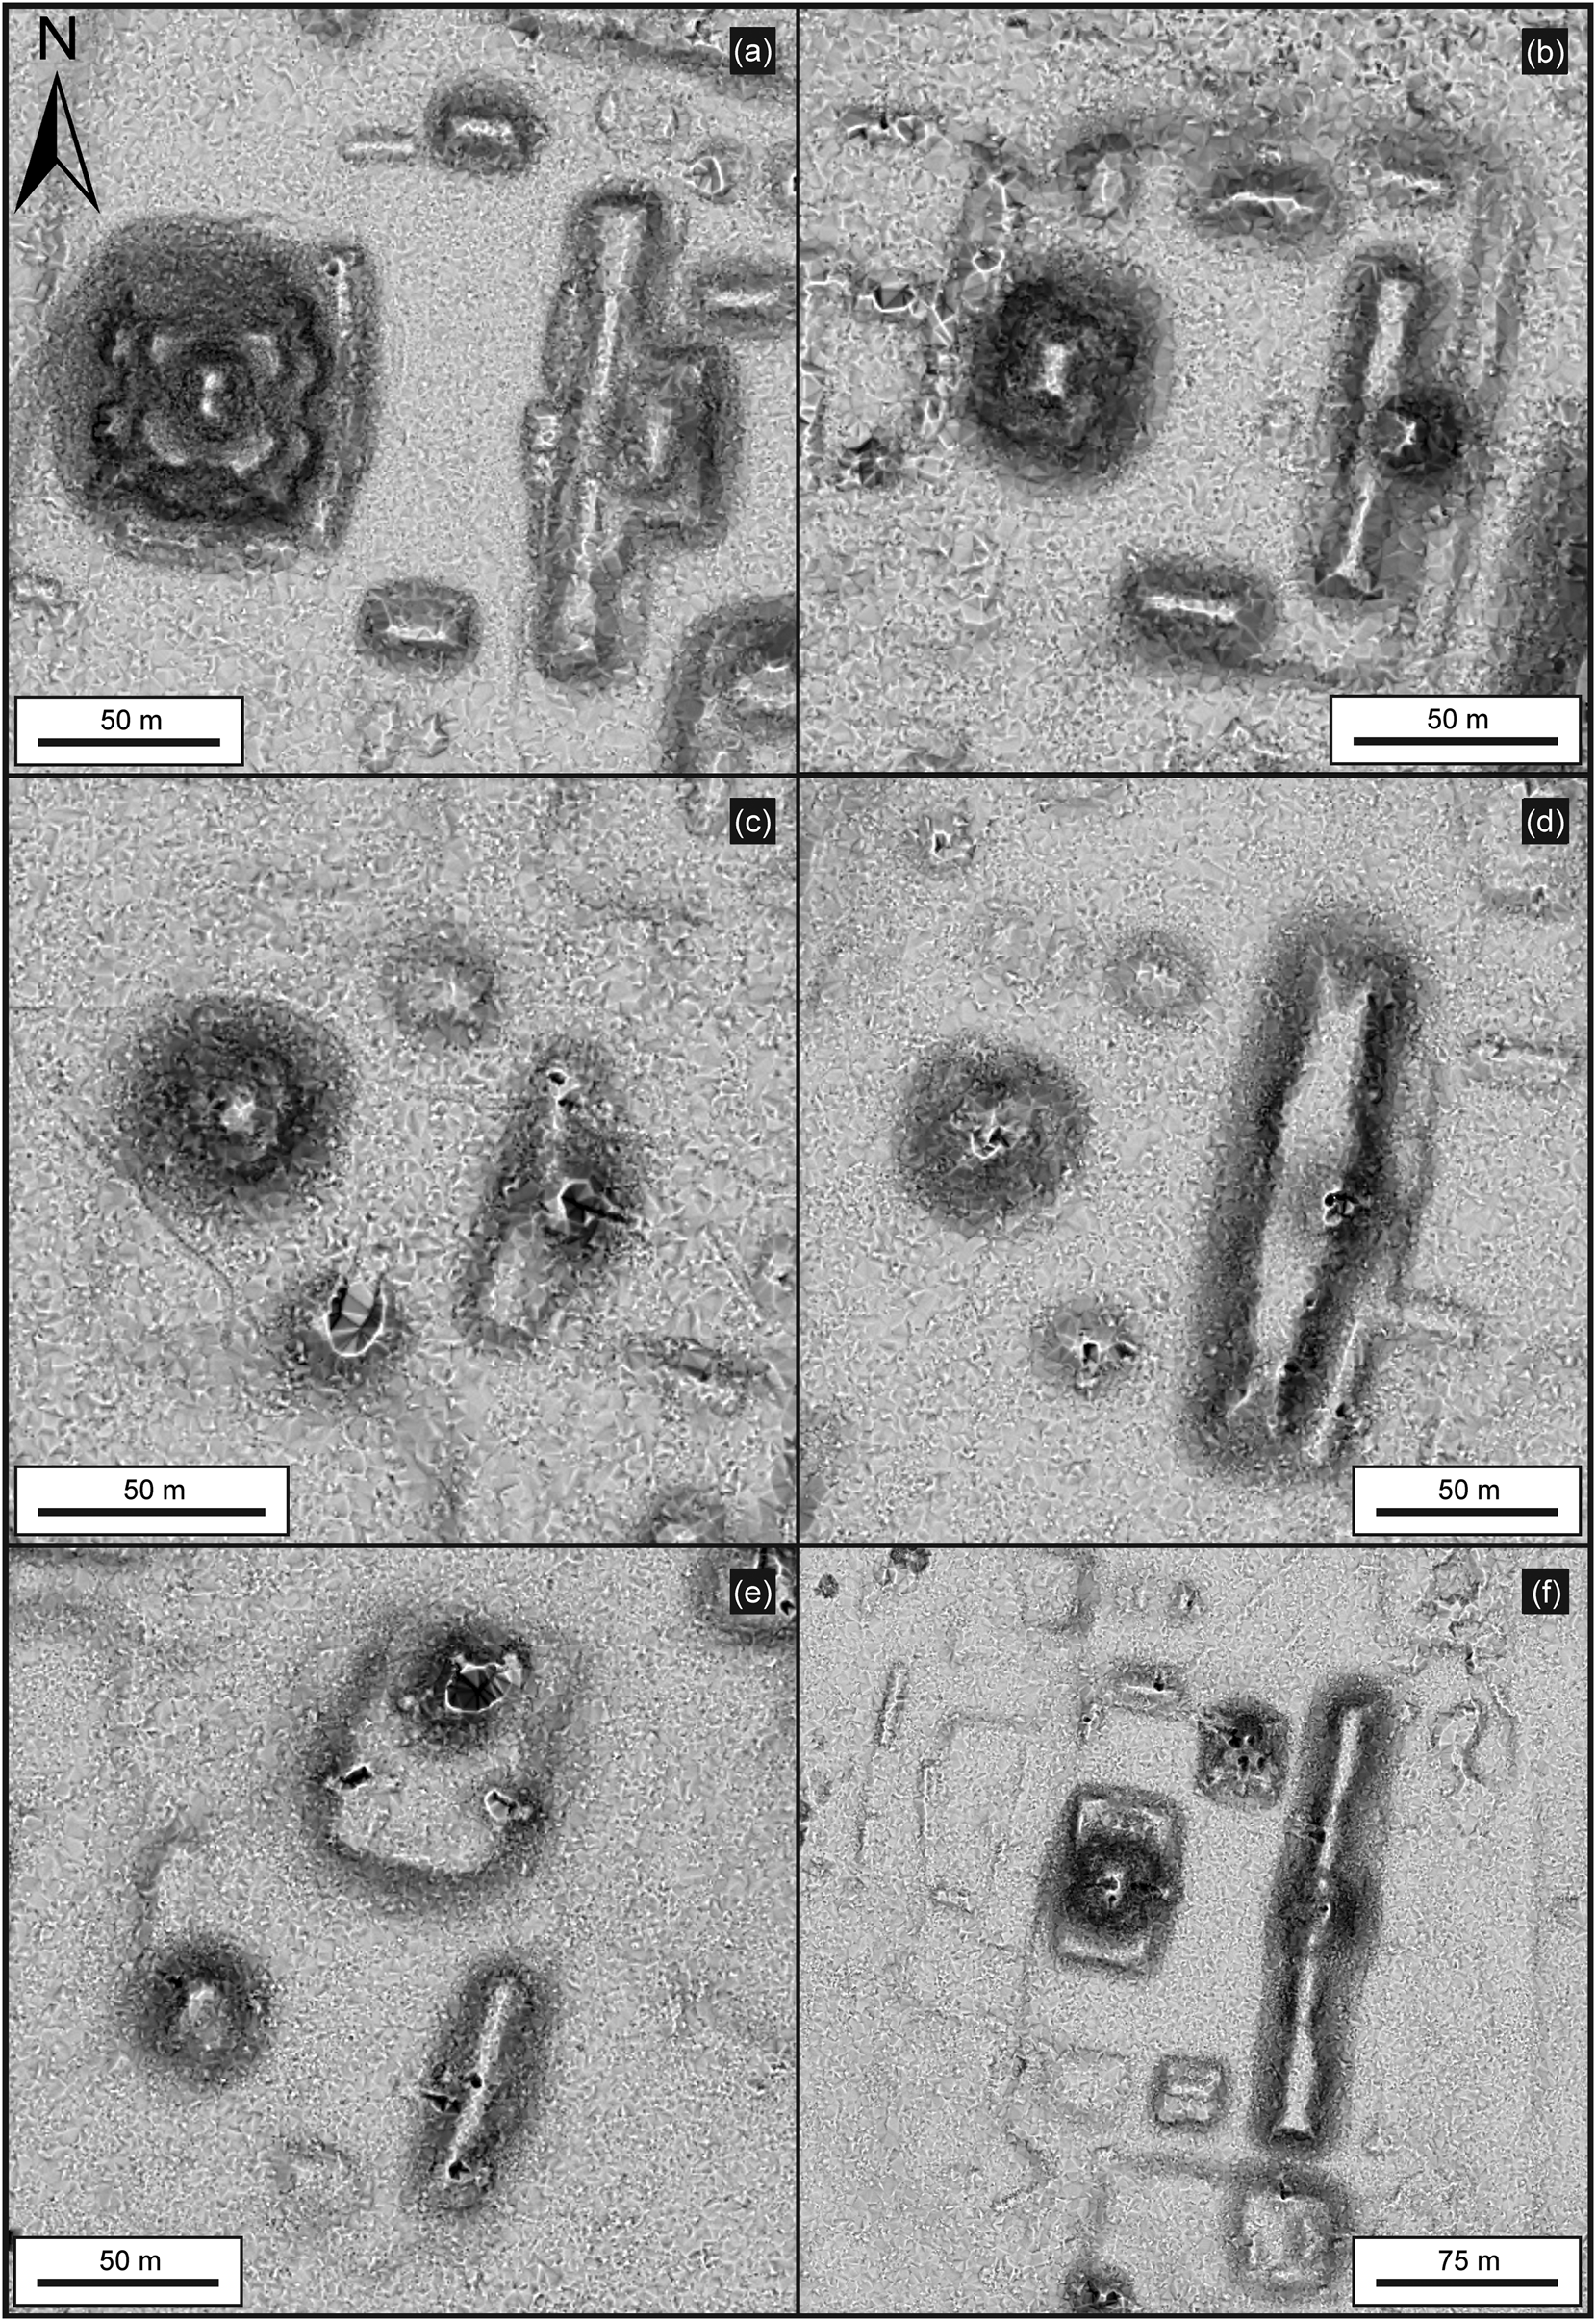
Primary sites of the MCKB have structures built for ceremonial or religious ideology (e.g., Demarest and Conrad Reference Demarest and Conrad1992). LiDAR analyses have facilitated the identification of more structural complexes known as E-Groups. These architectural complexes are of a consistent form, with a dominant pyramid on the west and an elongated north–south platform on the east of a plaza group, and were purported to be associated with solstice and equinox alignments, as first identified in Group E at Uaxactun in the 1920s (Blom Reference Blom1924:218; Doyle Reference Doyle2012; Freidel Reference Freidel, Jones and Kautz1981; Freidel et al. Reference Freidel, Chase, Dowd and Murdock2017; Hansen Reference Hansen and Houston1998:63–70; Ruppert Reference Ruppert, Hay, Linton, Lothrup, Shapiro and Vaillant1940:222). However, these assessments are not reliable (see Aveni and Hartung Reference Aveni, Hartung and Aveni1989; Šprajc Reference Šprajc2021a, Reference Šprajc2021b). They had important ritual and ceremonial functions in early Maya and Mixe-Zoque sites and are the earliest consistent architectural group format in the Maya Lowlands (Chase and Chase Reference Chase, Chase and Grube1995, Reference Chase, Chase, Freidel, Chase, Anne S and Murdock2017:32; Hansen Reference Hansen and Houston1998:63–64; Inomata Reference Inomata, Freidel, Chase, Dowd and Murdock2017; Inomata et al. Reference Inomata, Triadan, Aoyama, Castillo and Yonenobu2013, Reference Inomata, Triadan, Vázquez López, Fernandez-Diaz, Omori, Bauer, Hernández, Beach, Cagnato, Aoyama and Nasu2020). While there is debate over the origins of E-Groups (see Clark and Hansen Reference Clark, Hansen, Inomata and Houston2001; Hansen Reference Hansen and Powis2005:55; Inomata Reference Inomata, Freidel, Chase, Dowd and Murdock2017), there is no doubt that this architectural format was developed and utilized in the Middle Preclassic period throughout the Maya Lowlands (Doyle Reference Doyle2012, Reference Doyle2013; Estrada-Belli Reference Estrada-Belli, Freidel, Chase, Dowd and Murdock2017; Estrada-Belli et al. Reference Estrada-Belli, Jeremy Bauer and Chavez2003a, Reference Estrada-Belli, Grube, Wolf, Gardella and Guerra-Librero2003b; Hansen Reference Hansen1992, Reference Hansen and Houston1998, Reference Hansen and Trejo2000; Morales-Aguilar Reference Morales-Aguilar2021). E-Groups are common throughout the MCKB (e.g., Hansen Reference Hansen and Houston1998:69–70; and Figures 4 and 13), but vary in quantity and size. Analysis of LiDAR imagery has located at least 30 centers in the southern MCKB, which altogether have 42 E-Group complexes (Figure 13). A Tier 1 site such as Mirador has eight E-Groups, while Tier 2 sites like Balamnal have at least two E-groups, and “end of the road” tertiary sites such as Noholnal and Noholtun, located to the south and southwest of Balamnal, have two and one E-Group complexes, respectively. The size of the site, though, seems to be irrelevant, since E-Groups are found in all identified tiers of site size. Some Tier 6 sites like Oxkinal consist of little other than the structures of an E Group. While El Mirador has perhaps the largest western structure of any E-Group in the Basin, with the Leon structure at 33 m in height (Figure 13a), the elongated eastern structure at Wakna is probably the largest, at 210 m in length (Figure 13f). The E-Group complex in the East Group at Nakbe (Figure 13b) is among the earliest in the MCKB, with construction and occupation dating from 900–600 b.c. (Figure 14). Ceramics from excavations at El Pesquero, Balamnal, Wakná, Kunal, Xulnal, and El Mirador suggest that those E-Groups are contemporaneous.
LiDAR images of selected E-Groups in the MCKB: (a) Leon Group, El Mirador; (b) Nakbe, Grupo Oriental; (c) Group A, Xulnal; (d) Group A, Balamnal; (e) Group A, El Pesquero; and (f) Zapote Group, Wakna.
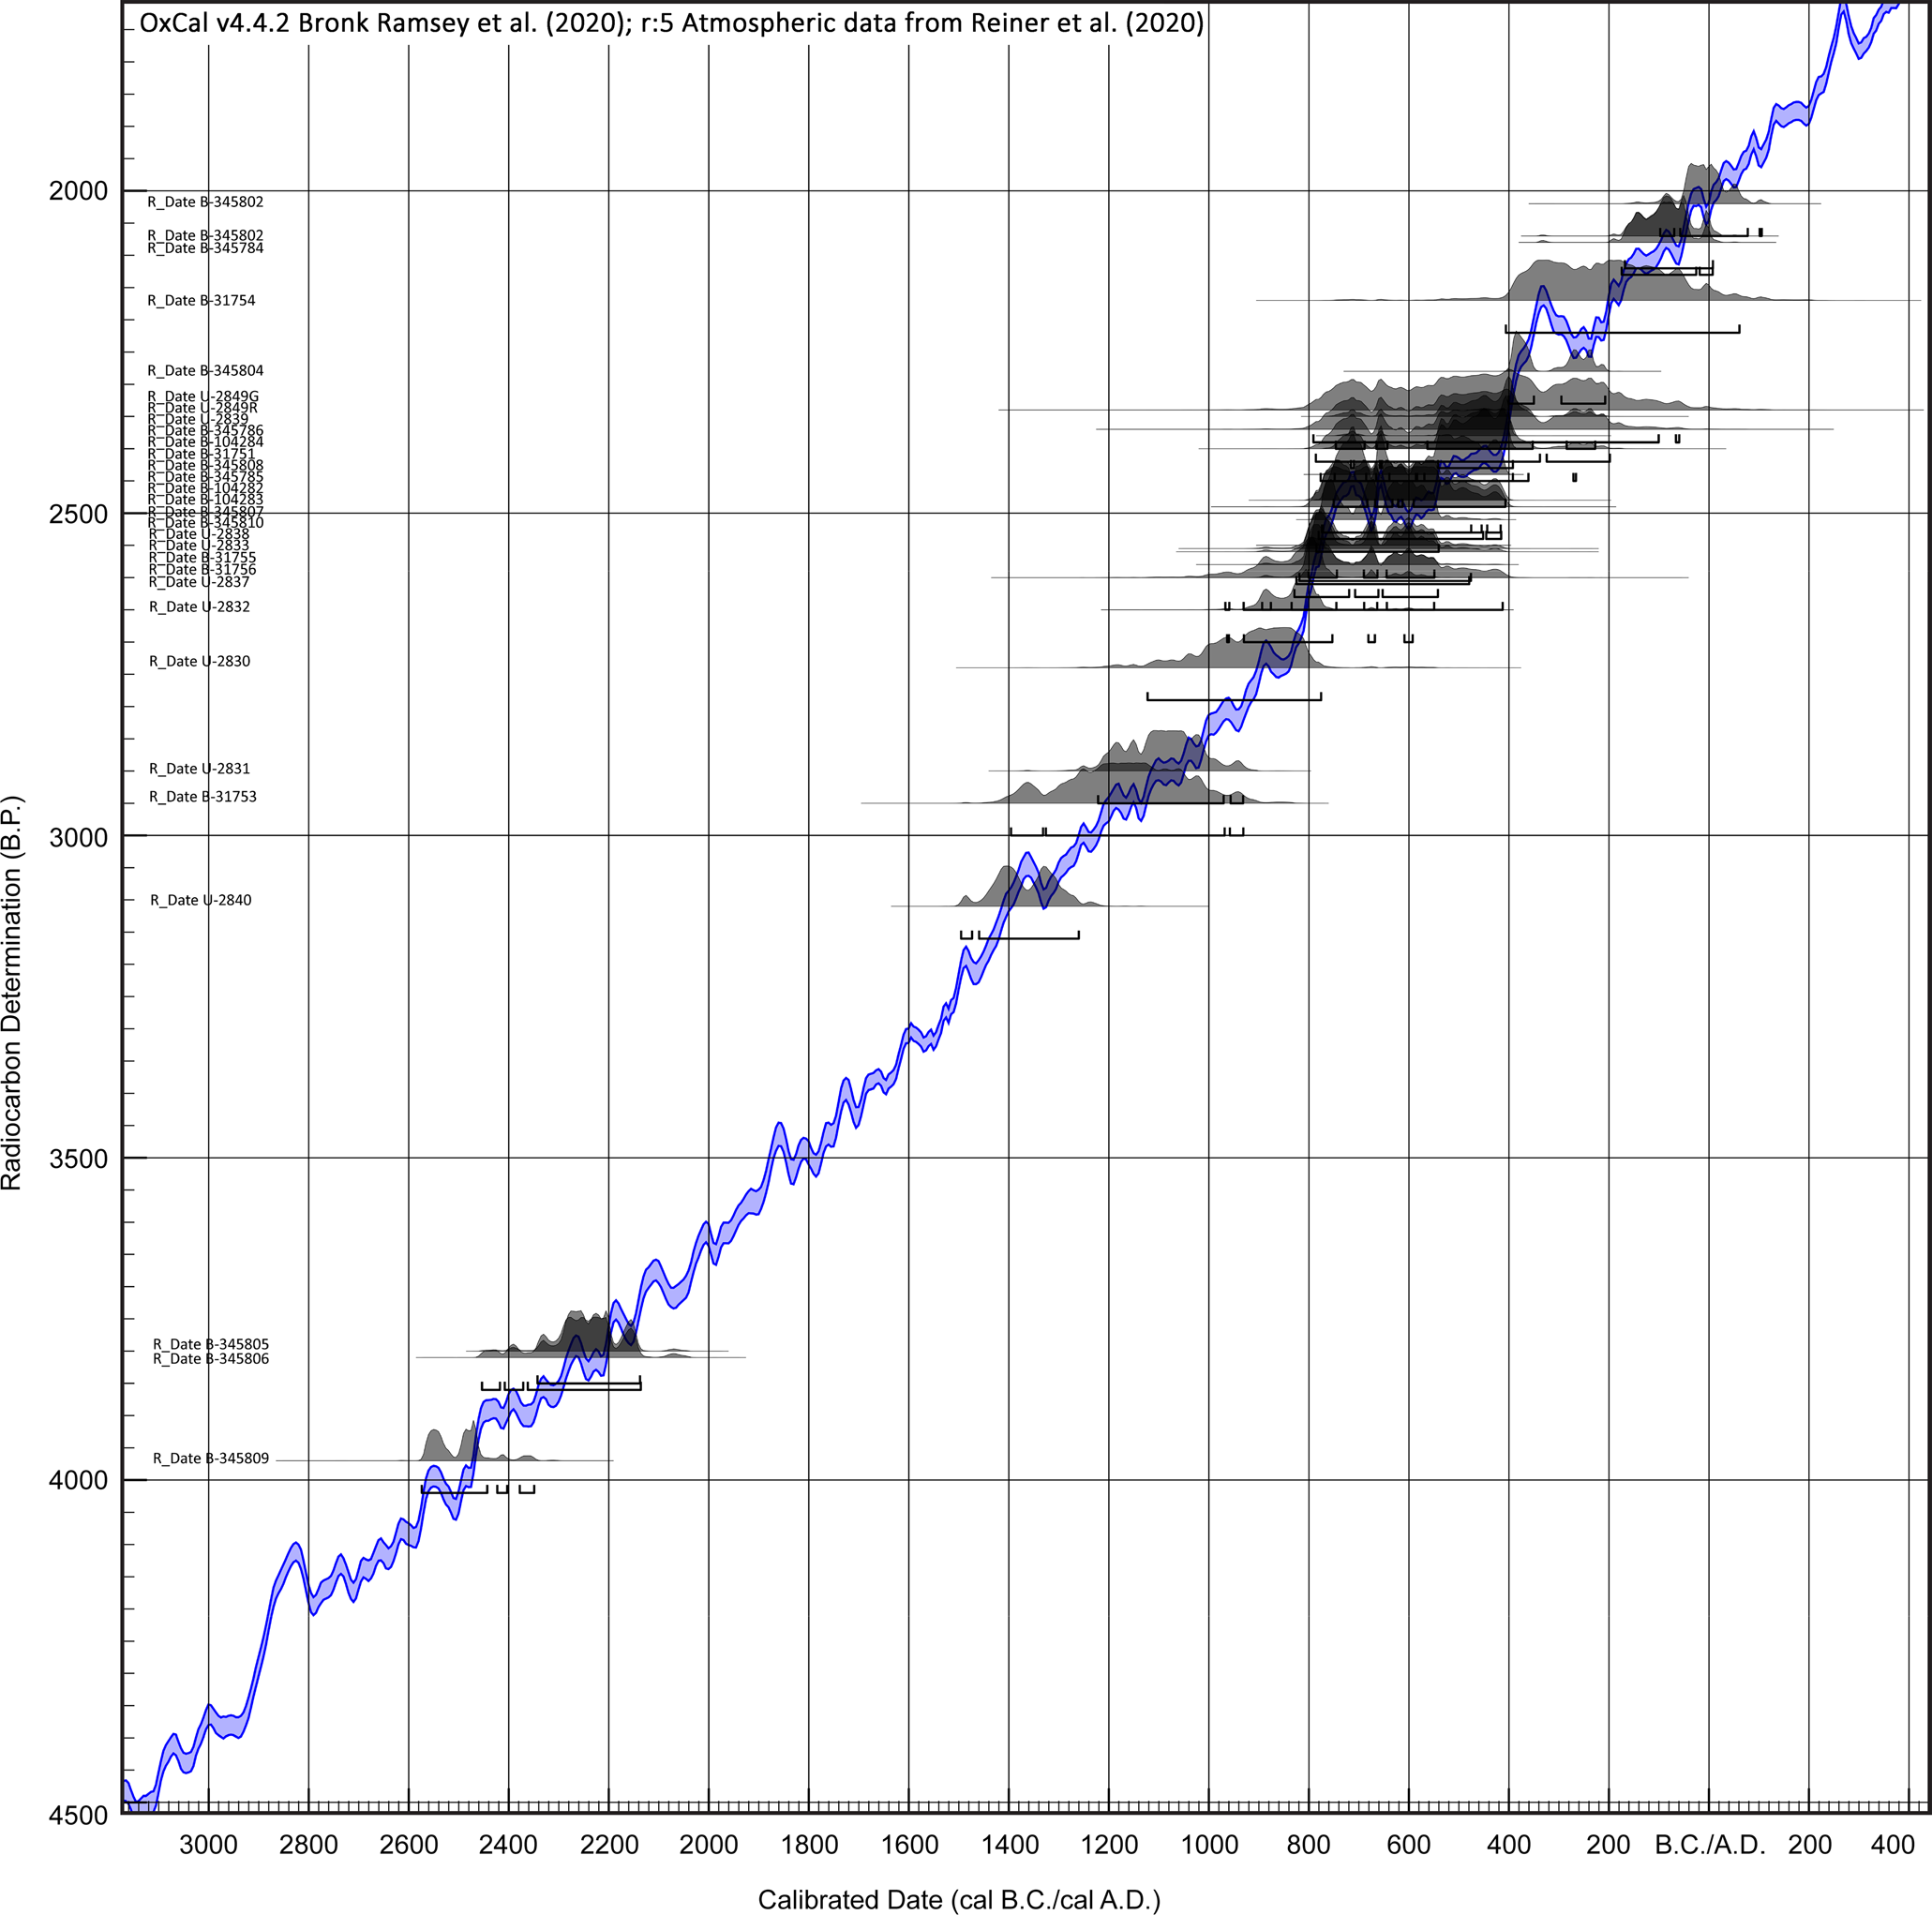
Graph of radiocarbon C-14 dates stratigraphically aligned in a Bayesian scale associated with Operation 51 C, a major excavation at the base of Structure 51, an E-Group in the East Group at Nakbe, with a heavy cluster of dates between ca. 1200 and 500 b.c.in a 2-sigma range. The earliest dates are from burned posts in postholes in the bedrock in front of the structure and are consistent with early dates from the cores extracted from lakes on the western edge of the MCKB (OxCal v. 4.4.2, Bronk Ramsey et al. Reference Bronk Ramsey, Heaton, Blackwell, Reimer, Reimer and Scott2020; atmospheric data: Reimer et al. Reference Reimer, Austin, Bard, Bayliss, Blackwell, Bronk Ramsey, Butzin, Cheng, Edwards, Friedrich, Grootes, Guilderson, Hajdas, Heaton, Hogg, Hughen, Kromer, Manning, Muscheler, Palmer, Pearson, van der Plicht, Reimer, Richards, Scott, Southon, Turney, Wacker, Adolphi, Büntgen, Capano, Fahrni, Fogtmann-Schulz, Friedrich, Köhler, Kudsk, Miyake, Olsen, Reinig, Sakamoto, Sookdeo and Talamo2020).
Triadic architecture
The vast majority of the largest architecture throughout the MCKB is a triadic configuration, a “dominant structure flanked by two, inward-facing smaller mounds” (Figures 15a–15f; see Freidel Reference Freidel1979; Graham Reference Graham1967:45–46; Hansen Reference Hansen1990:171ff., Reference Hansen and Houston1998:77–78, Reference Hansen and Trejo2000, Reference Hansen, Hansen and Suyuc-Ley2016a, Reference Hansen, Traxler and Sharer2016b, Reference Hansen, Chacon and Mendoza2017). While no triadic structures are yet known from the Middle Preclassic period, the format appears suddenly and ubiquitously throughout the entirety of the MCKB by the early Late Preclassic period (ca. 350–300 b.c.). The triadic pattern is possibly related to an early cosmology of “three hearth stones of Maya creation” (Tedlock Reference Tedlock1996:236, n72). The Late Preclassic Tigre pyramid in the West Group at El Mirador (Figure 16a) was estimated, based on replication experiments by the Mirador Basin Project and others, to have been constructed at a minimum of 2,803,595–5,000,000 person days of labor (Erasmus Reference Erasmus1965; Hansen Reference Hansen and Lynch1982, Reference Hansen1984, Reference Hansen1990:215; Hansen et al. Reference Hansen, Forsyth, Woods, Hansen, Schreiner, Titmus, Bey and Brown2018a; Sidrys Reference Sidrys and Sidrys1978:159).
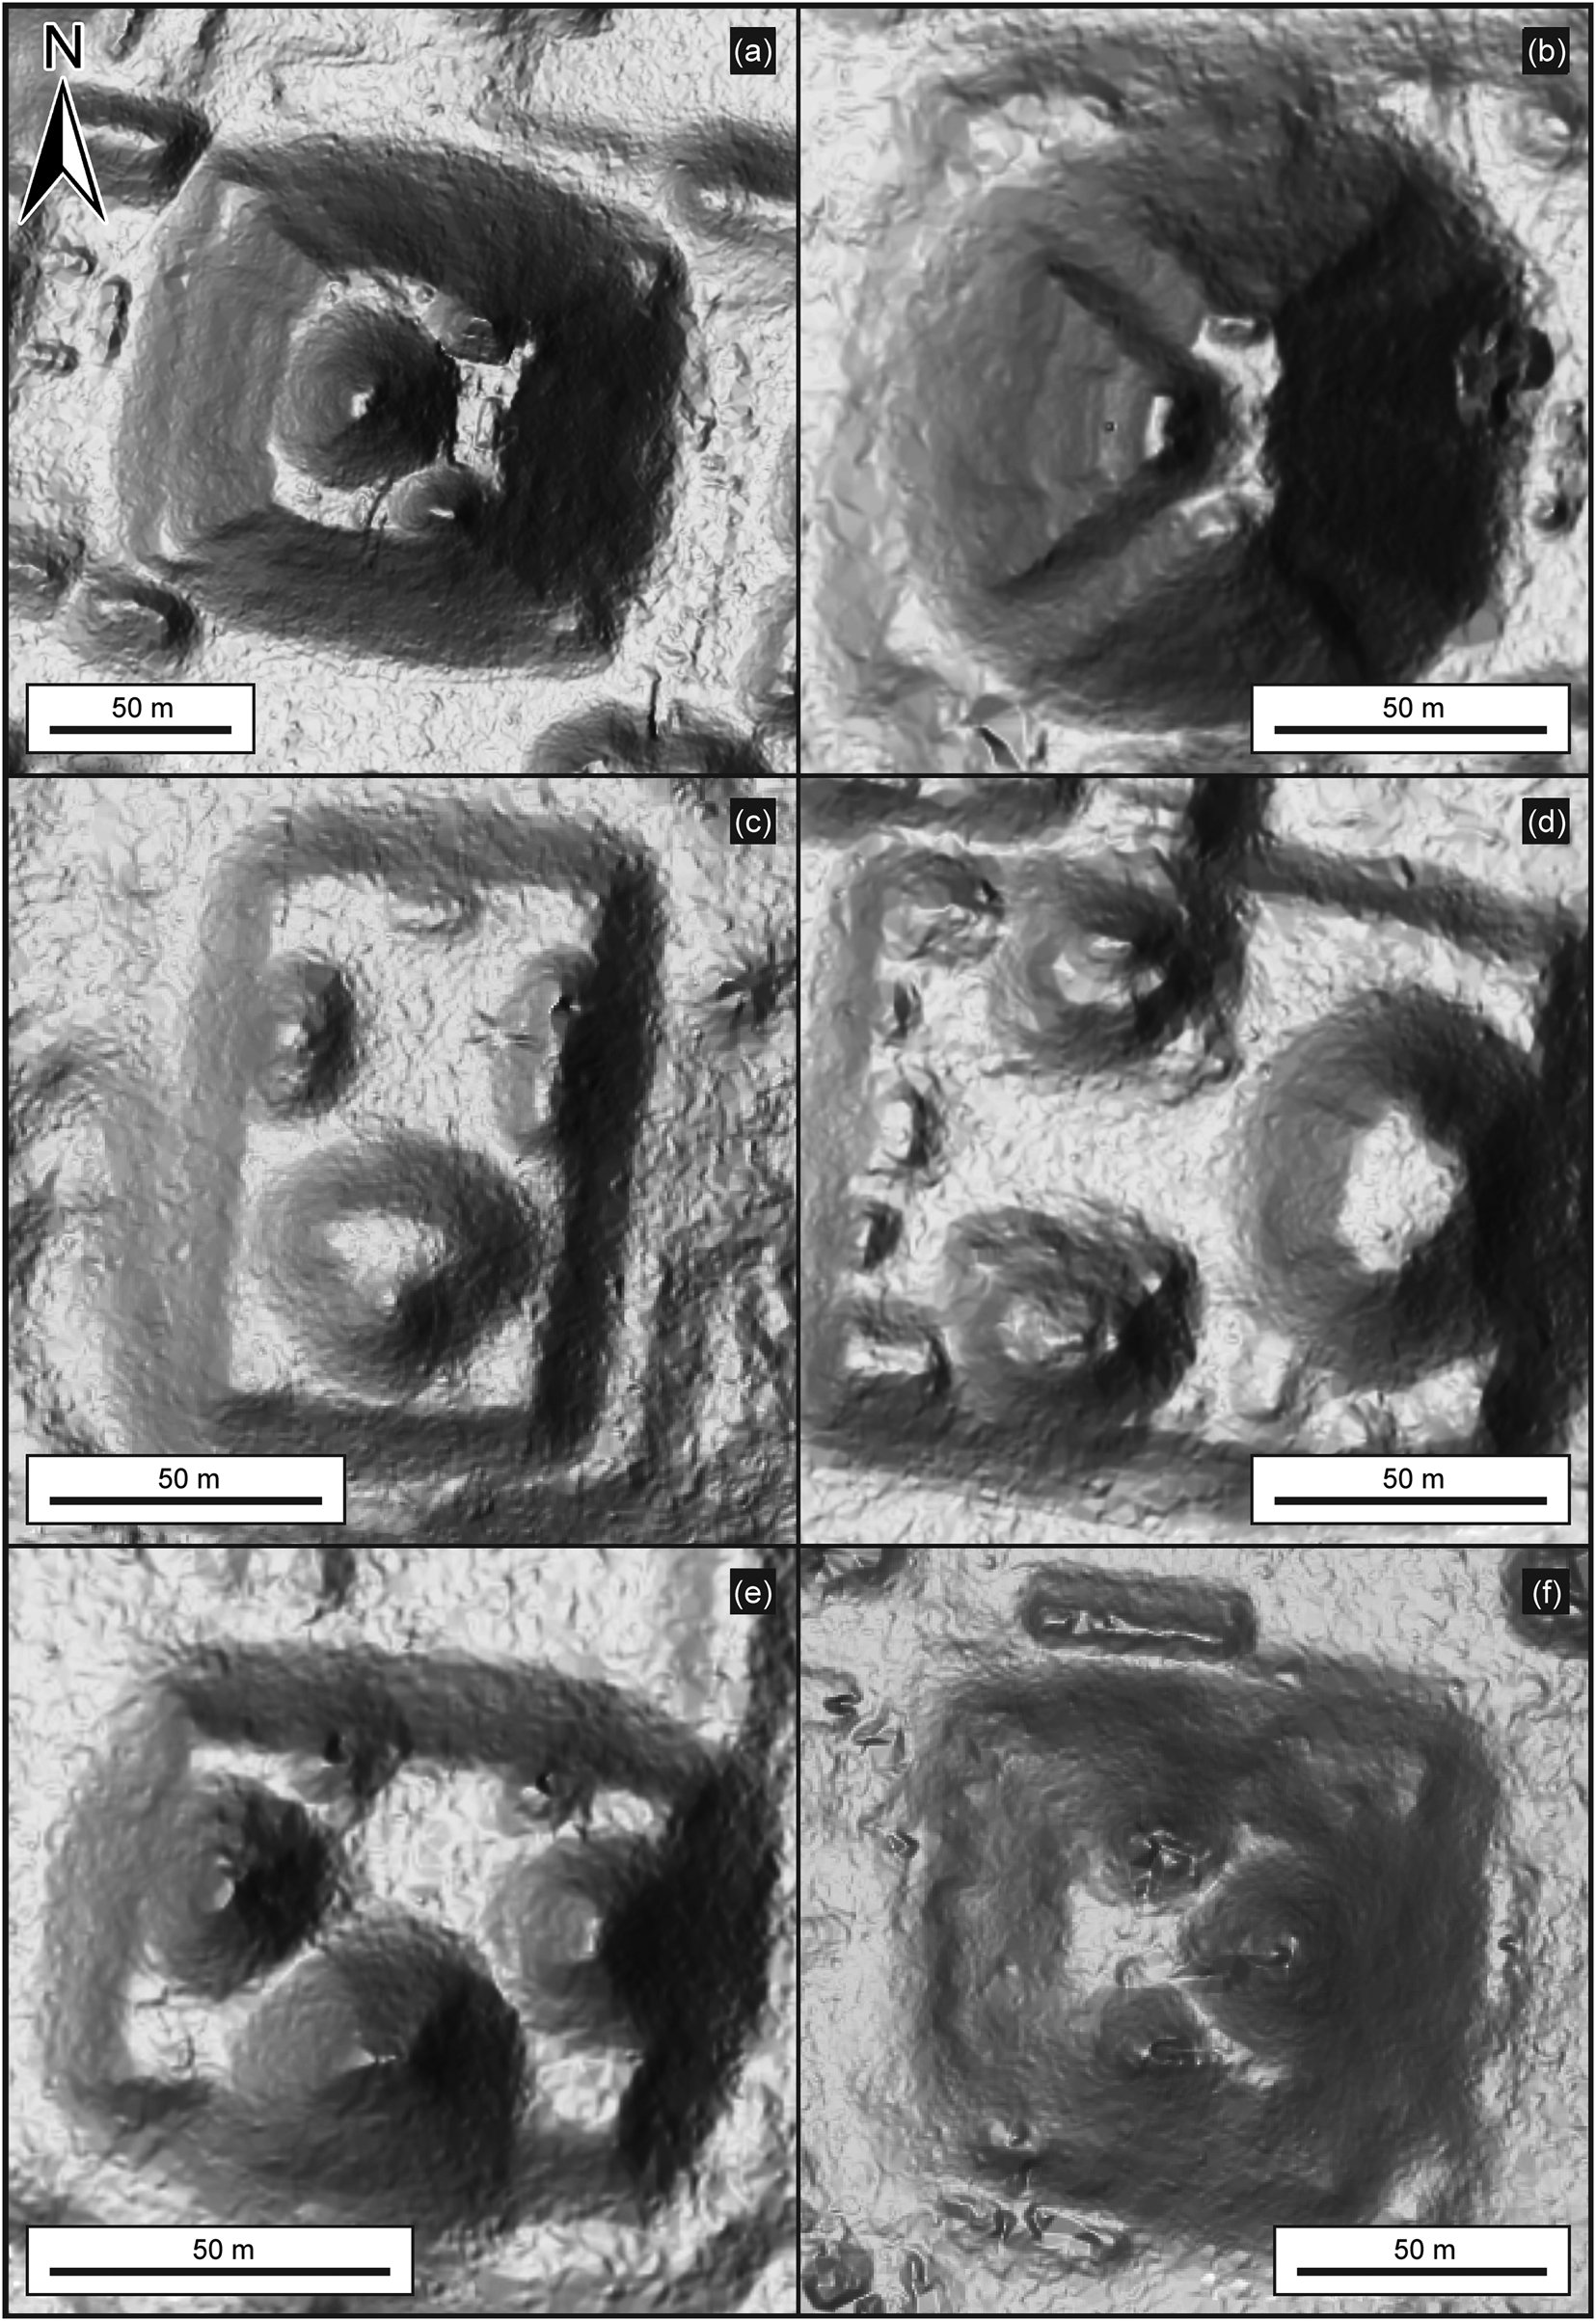
LiDAR images of selected triadic monumental structures in the MCKB: (a) Tigre Pyramid, El Mirador; (b) Structure 1, Nakbe; (c) Xulnal, South Acropolis; (d) Grupo Chicharras, El Mirador; (e) Tres Micos, El Mirador; and (f) El Pavo, Tintal.
Triadic structures in El Mirador: (a) LiDAR image showing triadic structures in the civic center of El Mirador (Tigre pyramid is the largest in this section of the city); (b) LiDAR 3D view showing the pyramidal complex of La Danta, located on the east side of the civic center at El Mirador.
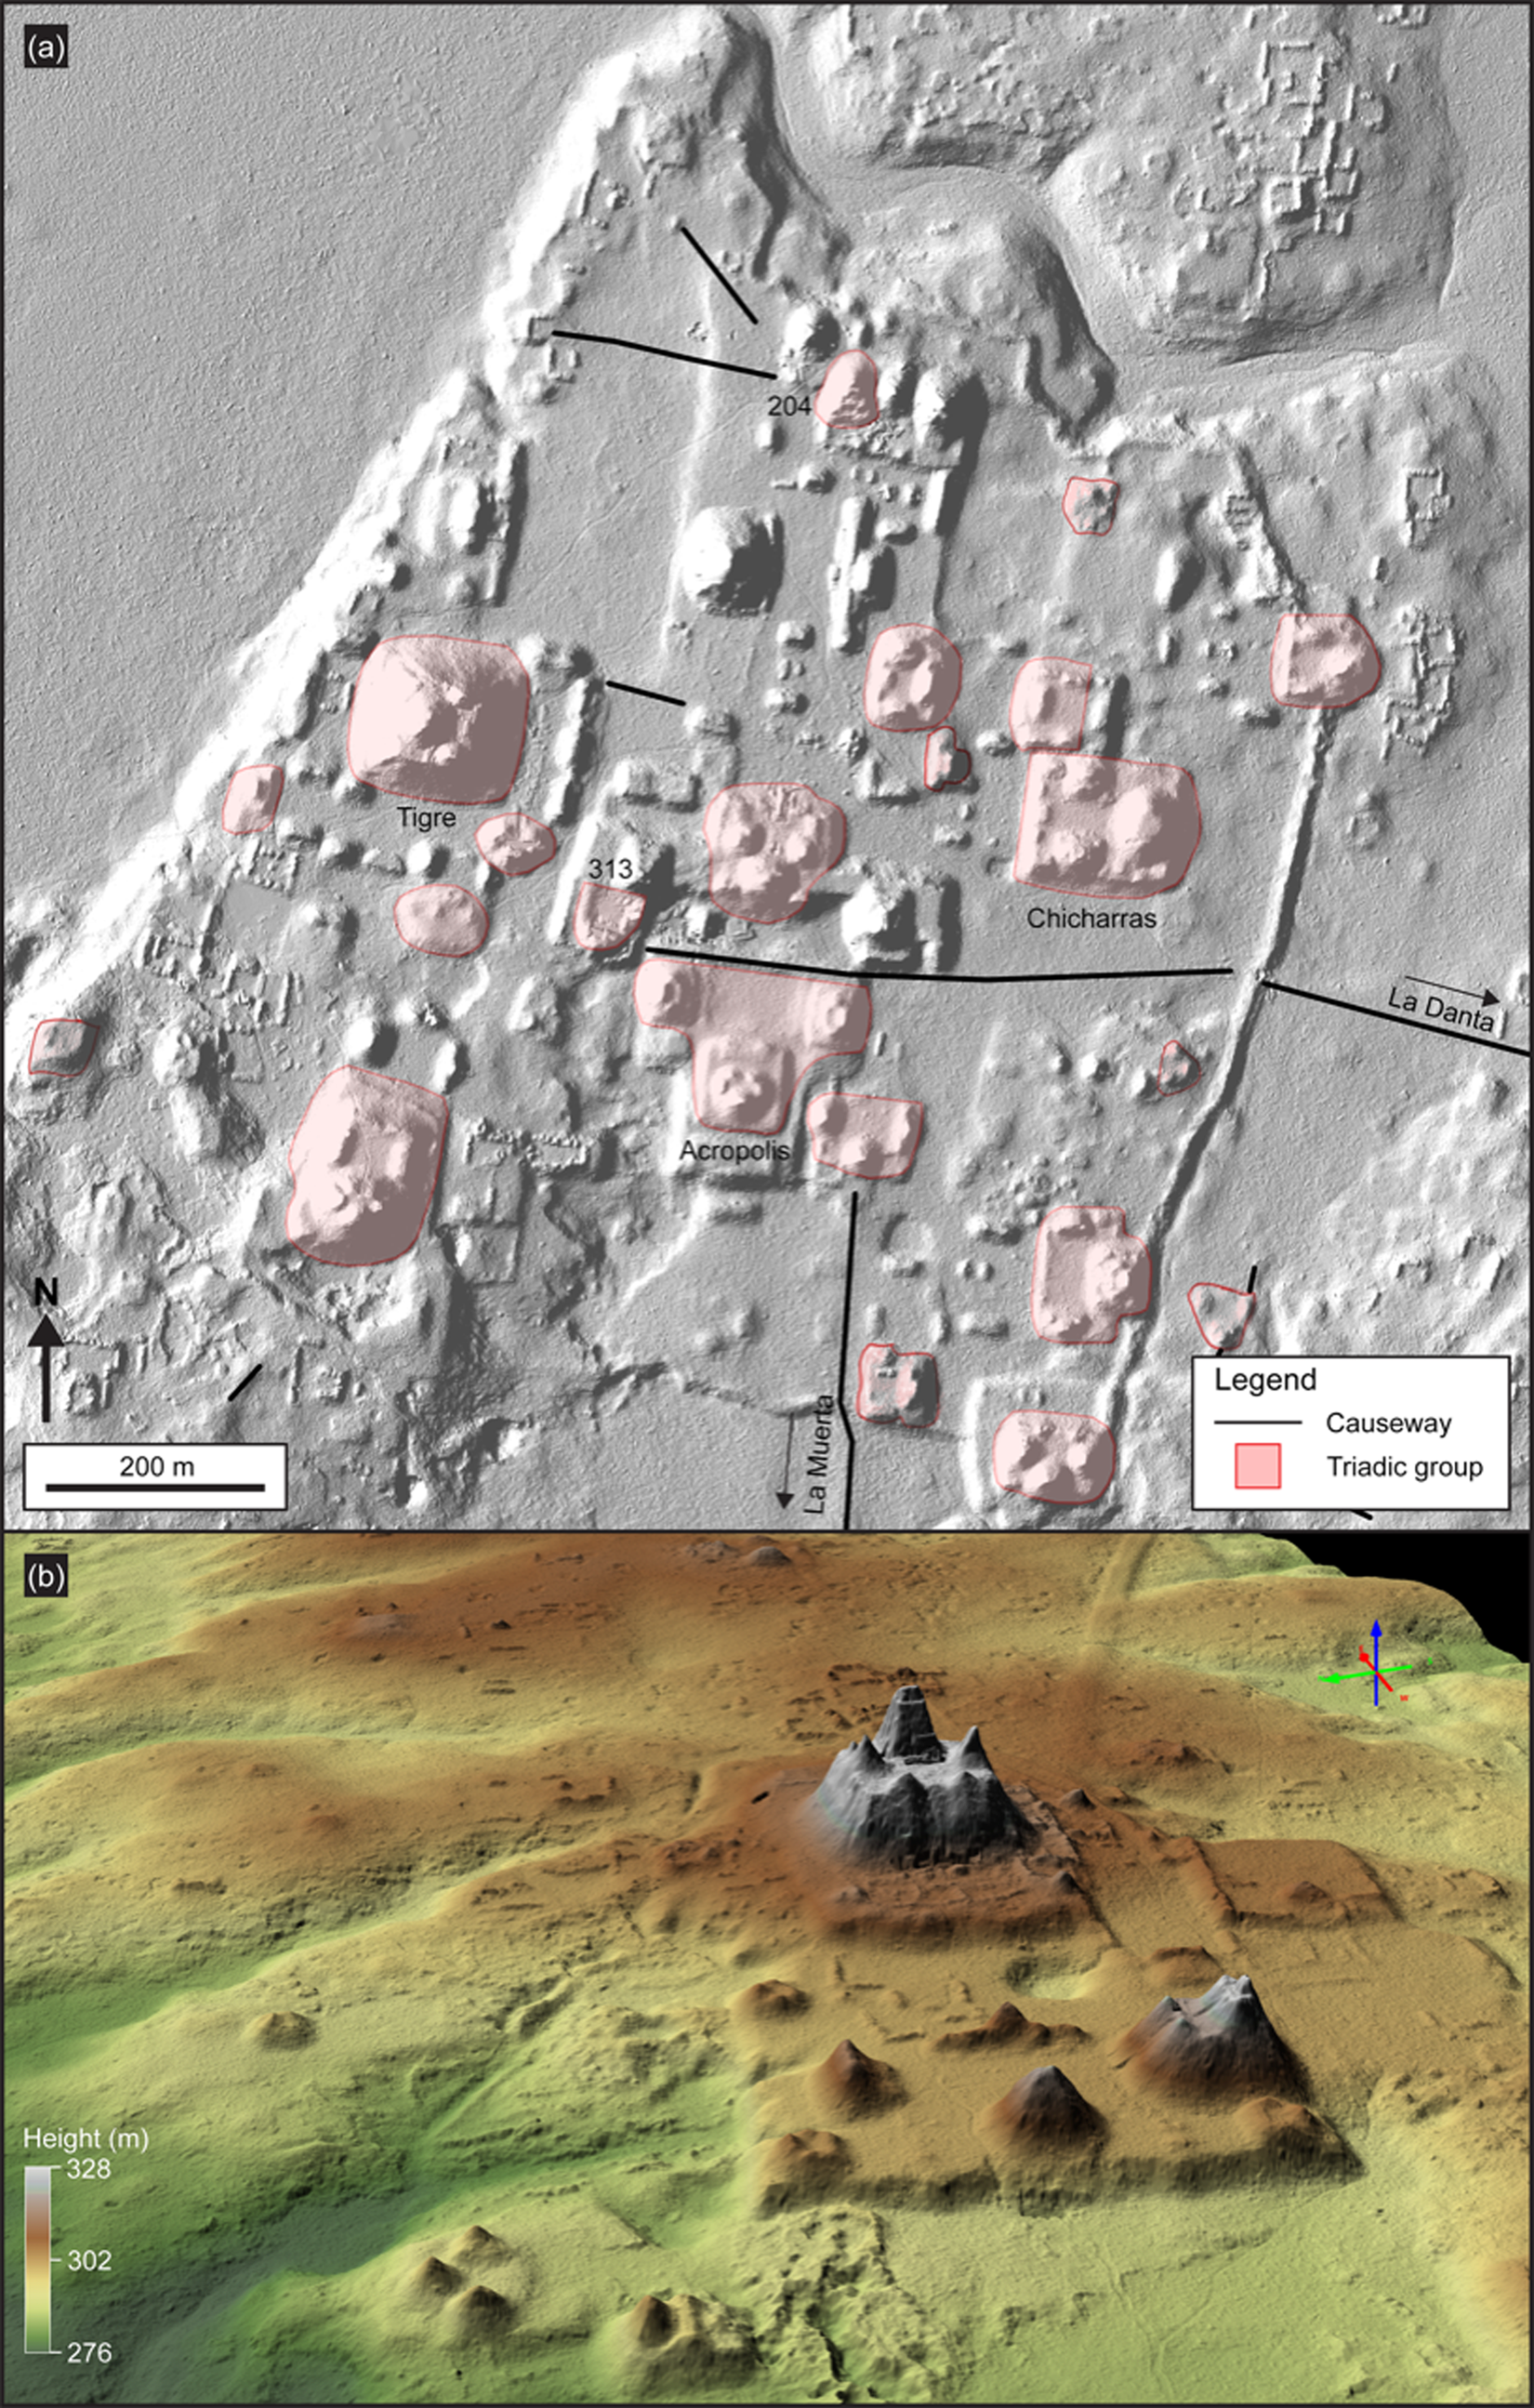
The pyramid of Danta (Figure 16b) located on the east side of the civic center of El Mirador consists of three continuous elevated platforms, with a major triadic group on the summit of the third platform and measures 600 × 320 × 72 m in height, and a possible volume of 2,816,016 m3 of fill, pending additional excavations in the primary platform of the structure (Hansen and Suyuc-Ley Reference Hansen, Suyuc-Ley and Michelet2011; Hansen et al. Reference Hansen, Forsyth, Woods, Hansen, Schreiner, Titmus, Bey and Brown2018a:184; Suyuc-Ley and Hansen Reference Suyuc-Ley, Hansen, Arnauld and Breton2013). Based on our calculations, the building has a surface covering of 205,508 limestone blocks at an average size of 1.30 × 0.45 × 0.40 m, requiring 158 workers continually for five years to quarry the stones, based on our detailed experiments in the field (Hansen et al. Reference Hansen, Forsyth, Woods, Hansen, Schreiner, Titmus, Bey and Brown2018a:182–186; Woods and Titmus Reference Woods, Titmus, Laporte and Escobedo1994, Reference Woods, Titmus, Robertson, Macri and McHargue1996). Depending on the natural configurations of the bedrock below the structure, the entire building could have had as much as 6,000,000 to 10,000,000 person-days of labor, exceeding the capacity of polities of lower hierarchical political and economic status, and suggesting a high level of organization as the sociopolitical and economic patron of such prodigious growth (Hansen et al. Reference Hansen, Forsyth, Woods, Hansen, Schreiner, Titmus, Bey and Brown2018a:185). This is consistent with the patterns of Preclassic platforms and monumental constructions, as identified in other areas of the Maya Lowlands (Inomata et al. Reference Inomata, Triadan, Aoyama, Castillo and Yonenobu2013, Reference Inomata, Triadan, Vázquez López, Fernandez-Diaz, Omori, Bauer, Hernández, Beach, Cagnato, Aoyama and Nasu2020, Reference Inomata, Fernandez-Diaz, Triadan, Mollinedo, Pinzón, Hernández, Flores, Sharpe, Beach, Hodgins, Diaz, Luna, Chávez, Jiménez and Díaz2021). Inomata and colleagues (Reference Inomata, Triadan, Aoyama, Castillo and Yonenobu2013, Reference Inomata, Triadan, Vázquez López, Fernandez-Diaz, Omori, Bauer, Hernández, Beach, Cagnato, Aoyama and Nasu2020, Reference Inomata, Fernandez-Diaz, Triadan, Mollinedo, Pinzón, Hernández, Flores, Sharpe, Beach, Hodgins, Diaz, Luna, Chávez, Jiménez and Díaz2021) have argued that such monumental constructions at Aguada Fenix and Carmelita in Tabasco, Mexico may have been constructed by societies with less complexity compared with the Olmec neighbors of San Lorenzo and La Venta. We suggest that such observations may be premature. There are reasons to suspect that the early sites of Tabasco may not be Maya, and they may be more aligned politically and economically with the Olmec (see also Rosenswig Reference Rosenswig2021b). Extensive experimental data conducted by the Mirador Basin Project suggests that the labor requirements for the construction of Preclassic Maya monumental architecture were also high, requiring a greater diversity and specialization, especially in constructions with quarried limestone blocks, lime cement, sascab quarries, mortar preparation, water collection and utilization, and quarried limestone fill (Hansen Reference Hansen, Traxler and Sharer2016b; Hansen et al. Reference Hansen, Forsyth, Woods, Hansen, Schreiner, Titmus, Bey and Brown2018a; Schreiner Reference Schreiner, Laporte, de Suasnavar and Arroyo2001, Reference Schreiner2002, Reference Schreiner, Mejía, Hansen and Suyuc-Ley2009, Reference Schreiner2021; Woods and Titmus Reference Woods, Titmus, Laporte and Escobedo1994, Reference Woods, Titmus, Robertson, Macri and McHargue1996).
Ballcourts
The sites in the MCKB have a combined total of at least 30 ballcourts that are scattered throughout the system (Figure 4), with 26 associated with Middle and Late Preclassic architecture. Several excavated examples, such as the one at Tintal, is one of the larger ballcourts in the MCKB, but the final version dates to the Late Classic period (Balcárcel et al. Reference Balcárcel, Hansen, Morales-Aguilar and Velásquez2021). The ballcourts located in the MCKB show two parallel structures, often in a north–south axis, and are approximately 10–20 m long. The site of El Mirador has seven presumed ballcourts, consisting of four small ones and three possible larger courts in the Great Central Acropolis at the site. The presence of a royal throne, specialized ceremonial sunken plazas, elaborate cosmological iconography, reservoirs and hydraulic systems, and massive platforms and constructions suggests that the Great Central Acropolis may have been the seat of power of Preclassic rulers at the site (Hansen Reference Hansen, Traxler and Sharer2016b:397–400).
Causeways
One of the crowning achievements of the Middle and Late Preclassic Maya was the construction of a dendritic system of causeways throughout the entirety of the MCKB (Hansen et al. Reference Hansen, Suyuc-Ley, Guenter, Morales-Aguilar, Hernández, Balcárcel, Masson, Freidel and Demarest2020; Hernández Reference Hernández, Lopez, Hansen and Suyuc-Ley2008; Hernández-Salazar Reference Hernández-Salazar2021; Hernández and Schreiner Reference Hernández, Schreiner, Suyuc-Ley and Hansen2006; Hernández et al. Reference Hernández, Schreiner and Wahl2007, Reference Hernández, Schreiner, Morales-Aguilar, Arroyo and Salinas2013, Reference Hernández, Schreiner, Hansen, Morales-Aguilar, Ortega G., Mauricio, Hansen and Suyuc-Ley2016, Reference Hernández, Schreiner, Morales-Aguilar, Hansen, Arroyo, Salinas and Álvarez2019; and Figures 17 and 18). While causeways were known to have existed throughout the Maya area (e.g., Benavides-Castillo Reference Benavides-Castillo1981; Bennett Reference Bennett1930; Chase and Chase Reference Chase and Chase2001; Cobos and Winemiller Reference Cobos and Winemiller2001; Folan Reference Folan and Trombold1991; Gómez Reference Gómez, Laporte and Escobedo1996; Hutson and Welch Reference Hutson and Welch2021; Kurjack Reference Kurjack1977; Maldonado-Cárdenas Reference Maldonado-Cárdenas1979; Shaw Reference Shaw2001, Reference Shaw2008; Villa Reference Villa R.1934) and the MCKB (e.g., Graham Reference Graham1967:41–47), the scope and scale of the features are now fully evident with the airborne LiDAR, supported by satellite imagery and GIS software.
Digital elevation map of El Mirador with causeways and reservoirs. Major causeways from the civic center of El Mirador show the extent and nature of the vast intrasite and intersite networks. Primary causeways extend from Danta pyramid northeast into Campeche, Mexico (Yaxnohcah?), and southeast to Nakbe. Other intersite causeways extend from the Central Acropolis south to Tintal, and from the Las Cruces Group northwest to El Limón and Paxbán. Intrasite causeways connect the civic center to neighboring suburbs of Sacalero, Los Faisanes, Chacté, Los Pericos, La Muerta, Yaxché, Las Ardillas, and others. Background color represents terrain elevation with lowest elevations in light blue and gradually increasing to highest elevations in browns and white.

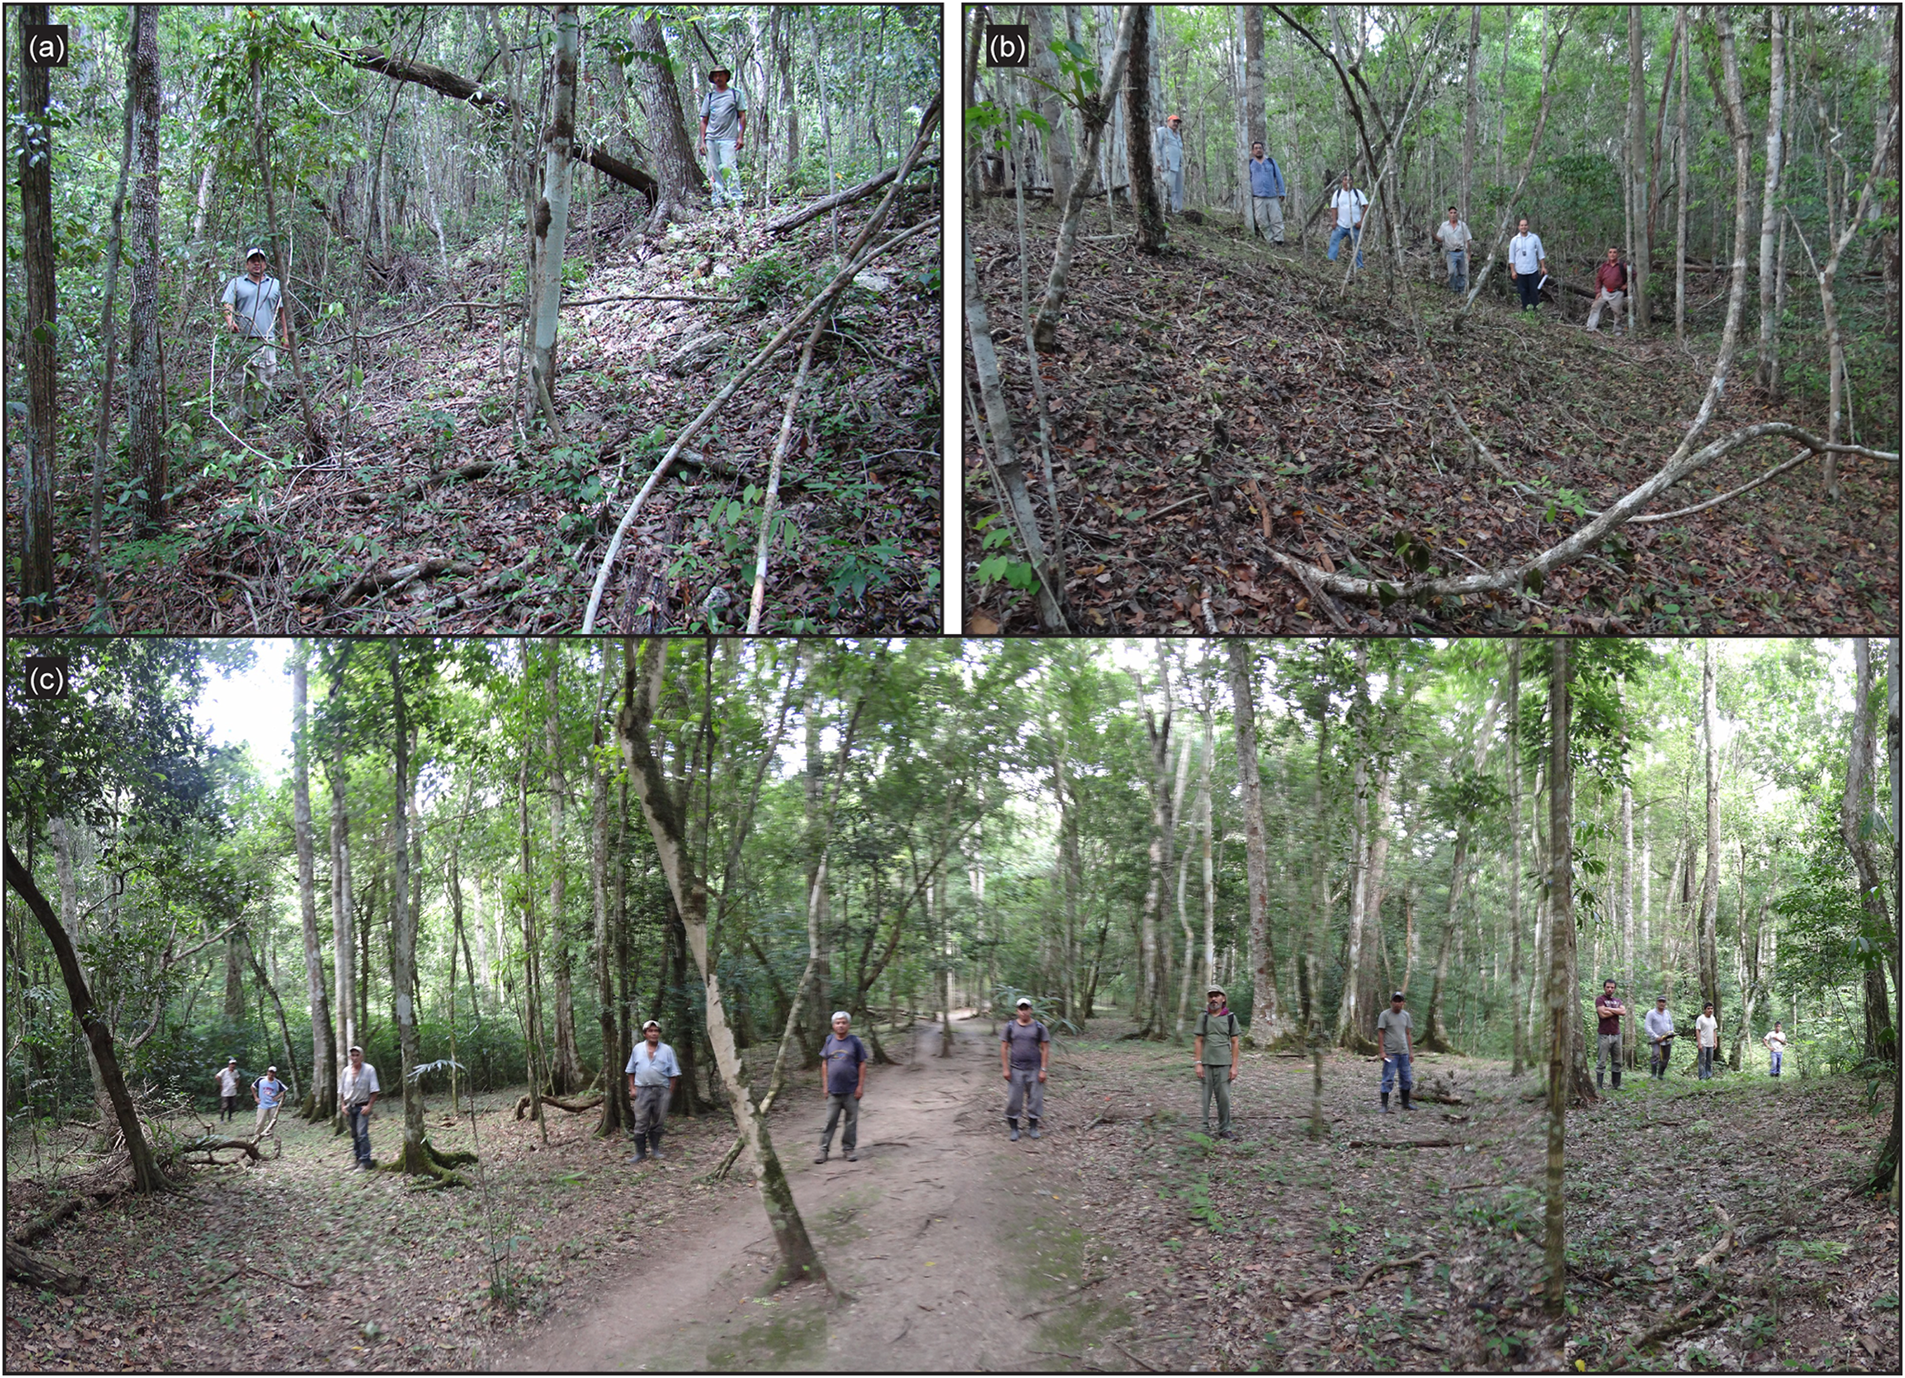
Photographs of several MCKB intersite causeways: (a) edge of the Mirador–Nakbe causeway; (b) the Mirador–Tintal causeway, showing the relative heights normal for the elevated intersite causeways; (c) the Jade causeway in Tintal is 40 m wide, typical of the Preclassic causeways in the MCKB.
LiDAR mapping in the southern MCKB has revealed a network of at least 133.22 km of intersite and 38.23 km of intrasite Preclassic noh be (“big road”) or chibal be (“large lineage road”) causeways (Bolles and Folan Reference Bolles and Folan2001). An additional 3.89 km could be added if the site destination platforms are included. The mapped Preclassic intrasite causeways indicate intracommunity connectivity and integration. Preclassic causeways are easily distinguished from Classic period causeways by the width of the features and the lack of low stone walls or parapets along the edges. All Late Classic causeways are defined by the presence of low parapets on each side of the causeway. Only 12.13 km of Classic period causeways are found throughout the entirety of the Southern Basin, and none of them are intersite, indicating the vast differences in demographic density and administrative process between the two periods. The majority of Preclassic causeways have a locus at El Mirador, with 12 intrasite causeways and five major intersite causeways. The intrasite causeways measure 9–40 m wide, while the intersite causeways range from 28 to 40 m wide. There are at least 11 suburban residential areas (dense groups in the peripheral regions), directly linked by intrasite causeways to the civic center of El Mirador (Hansen et al. Reference Hansen, Suyuc-Ley, Guenter, Morales-Aguilar, Hernández, Balcárcel, Masson, Freidel and Demarest2020; Hernández-Salazar Reference Hernández-Salazar2021:23; Morales-Aguilar et al. Reference Morales-Aguilar, Douglas Mauricio, Hernández, Arroyo, Salinas and Paiz2015; and Figure 17). Large intersite causeways include the Paixban causeway, which extends to the northwest of Mirador to the sites of El Limon and Paixban. This causeway is 30–40 m wide and 2–4 m high, and extends 21 km before reaching the limits of our LiDAR survey. Another previously undetected causeway (Campeche causeway) extends from Danta pyramid to the northeast for more than 12 km, and crosses into the state of Campeche, Mexico. This feature is 30–40 m wide and 2–4 m high, and extends 7.4 km to a semi-rectangular aperture in the terrain of the natural topography before continuing on another 2.3 km to the northeast Mexican border. There is a likely possibility that this causeway extends towards Yaxnohcah or Chicanticanal in Campeche, and not Calakmul, as purported earlier (Folan et al. Reference Folan, Hau, Marcus, Frank Miller and Heredia2001:296–297). At present, there is no indication on LiDAR data of a causeway between El Mirador and Calakmul, which is logical considering the differences in contemporaneity of the sites, even though Calakmul does have some Preclassic occupation and at least one monumental substructure.
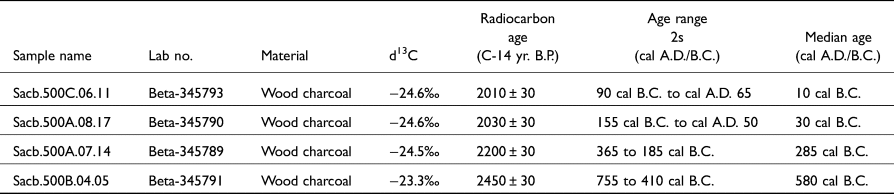
An important causeway (Mirador–Nakbe causeway) extends from the southeast corner of the second platform of Danta pyramid, 13 km to the site of Nakbe. This causeway varies between 0.5 m and 5 m in height (Figure 18a) and is 35–40 m in width. Another, the Tintal–Mirador causeway, extends to the southwest of El Mirador and is 40 m wide, 1.0–4.5 m in height, and 24 km long to Tintal (Figures 18b and 18c). It unites the Central Acropolis at Mirador with the Henequen and Mano de Leon Groups at Tintal. Furthermore, it has a mid-course directional change to the west from the original line of sight on the large pyramid at the site of La Ceibita, suggesting that the construction origin of the causeway was from El Mirador. Excavations on this causeway revealed a series of C-14 dates (Table 5), ceramics, and a consistent sequence that places the initial construction possibly as early as the late Middle Preclassic period, but certainly by the beginning of the Late Preclassic period (Figure 19; Hernández-Salazar Reference Hernández-Salazar2021:152–154, 60 ff.; Hernández et al. Reference Hernández, Schreiner, Hansen, Morales-Aguilar, Ortega G., Mauricio, Hansen and Suyuc-Ley2016; Schreiner and Hernández Reference Schreiner, Hernández, Mejía, Hansen and Suyuc-Ley2009; Schreiner et al. Reference Schreiner, Hernández, Wahl and Hansen2015).
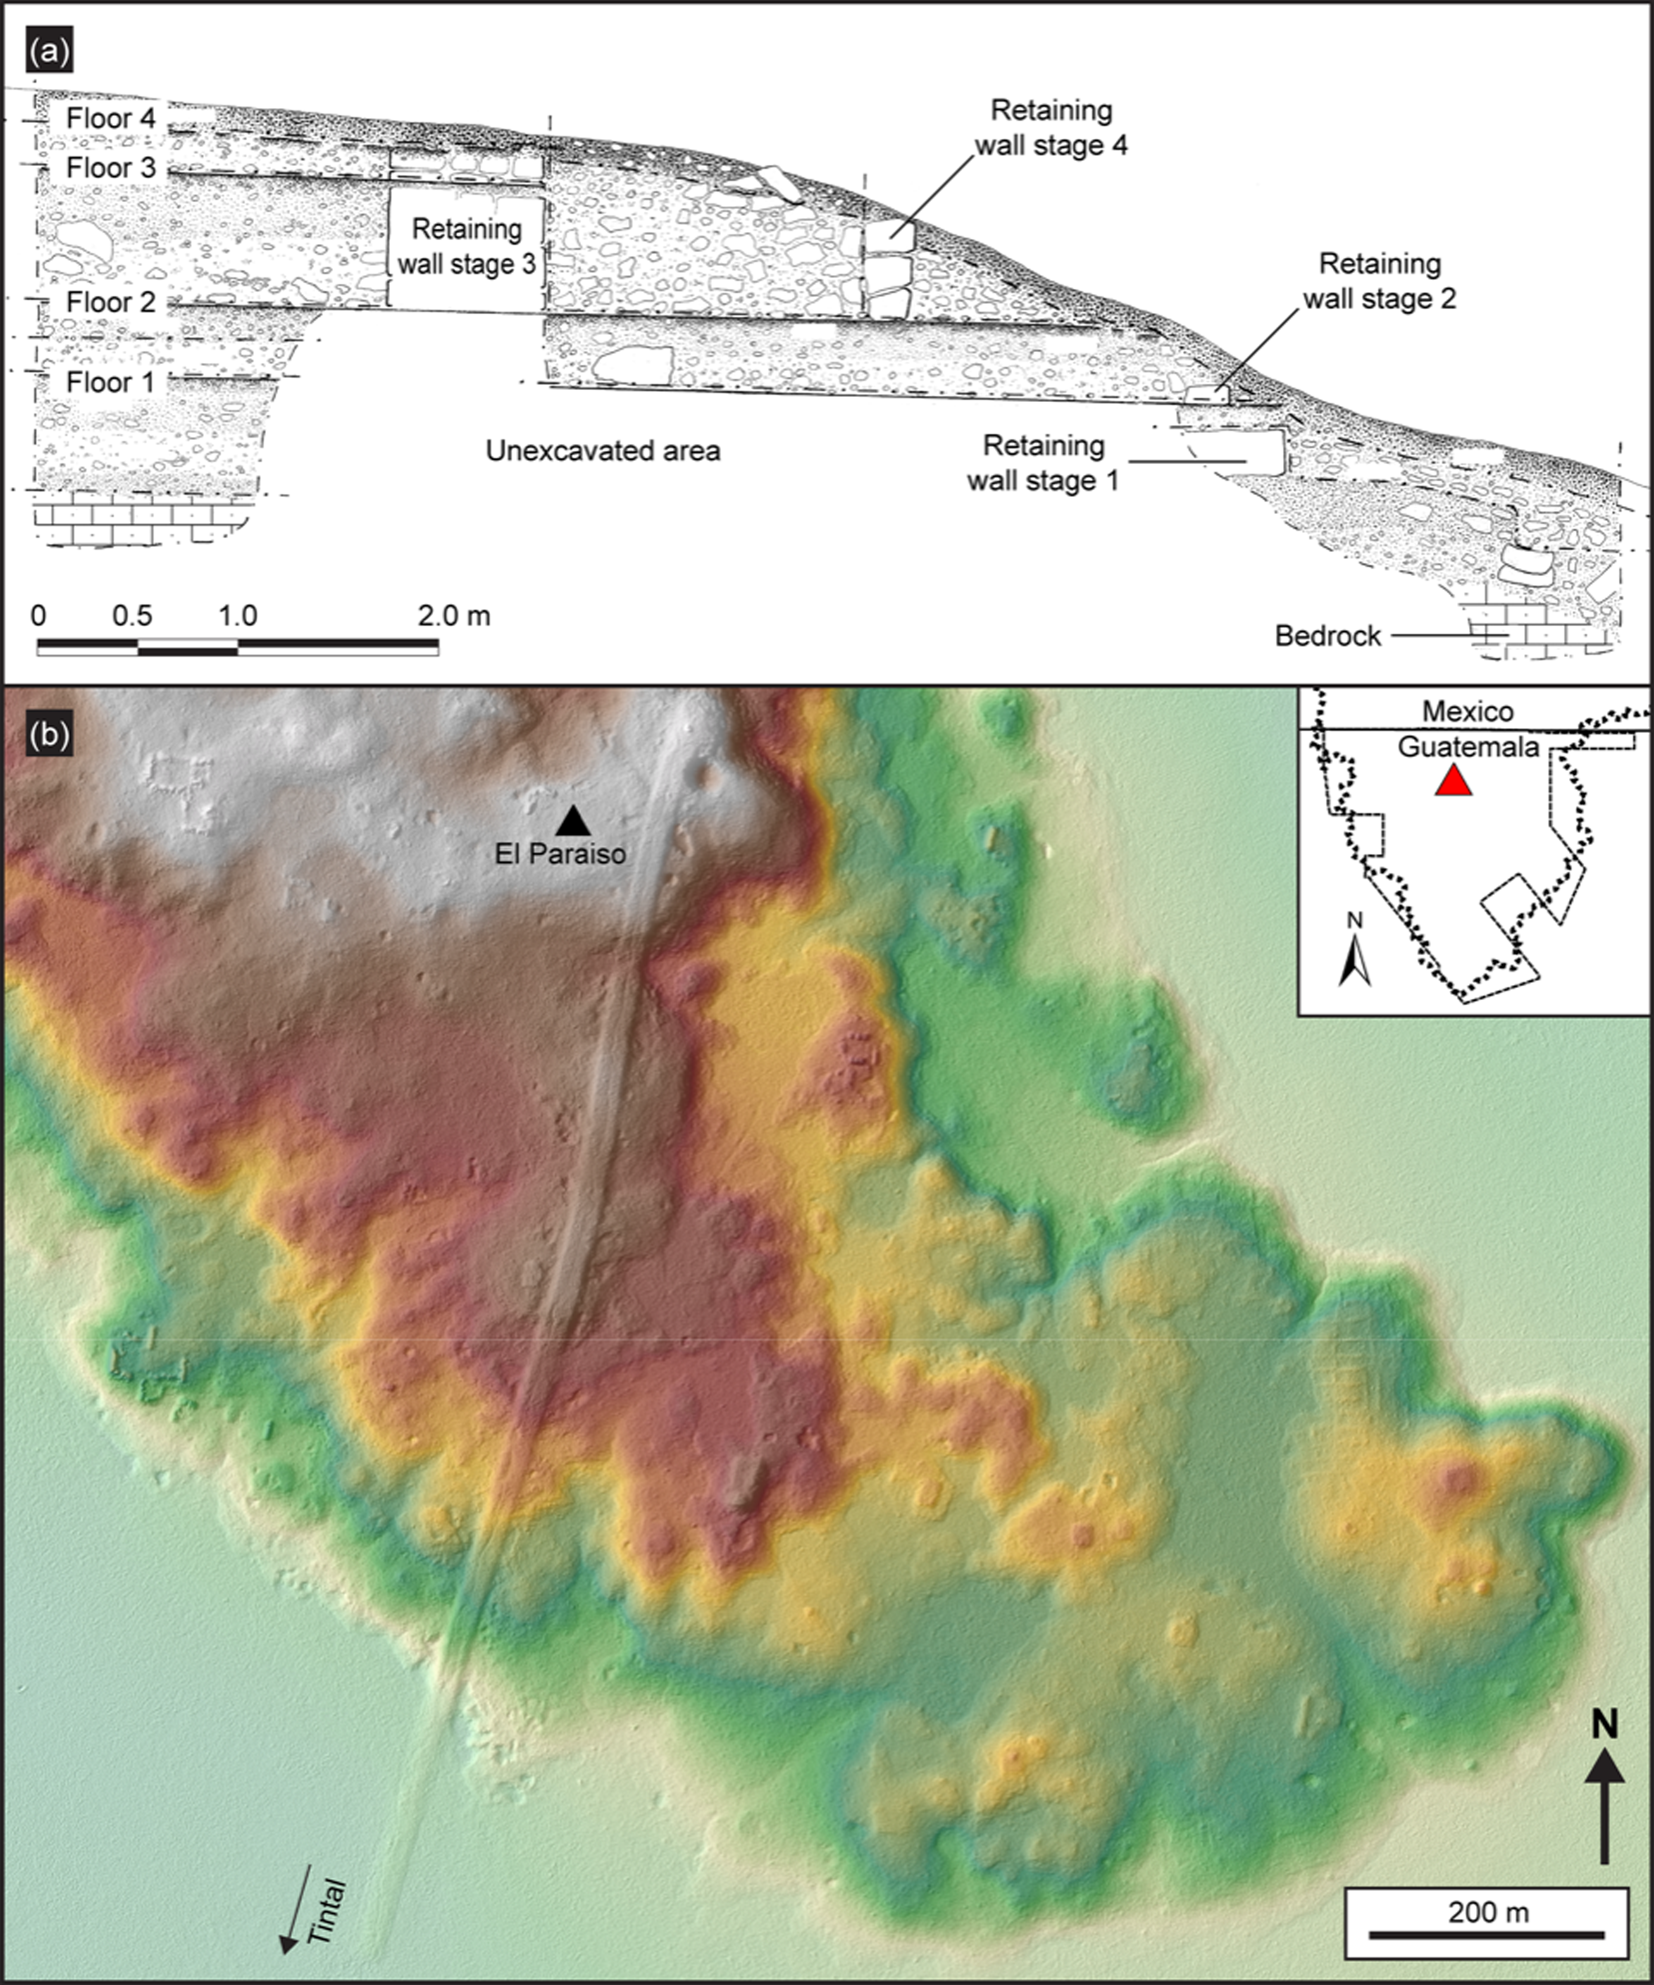
Detailed LIDAR image of the Mirador–Tintal causeway: (a) profile of Op. 500-A, excavation of the Mirador–Tintal causeway, showing the stratigraphic sequences of the construction phases with four floors (after Hernández-Salazar Reference Hernández-Salazar2021:129; Hernández et al. Reference Hernández, Schreiner, Morales-Aguilar, Arroyo and Salinas2013:950); (b) LiDAR image of Gavilan “El Paraiso” Island in the Bajo Carrizal, located south of El Mirador, showing the large Preclassic causeway. Background color represents terrain elevation with lowest elevations in light blue and gradually increasing to highest elevations in browns and white.
C-14 dates from the Tintal–Mirador Causeway (Hernández Reference Hernández-Salazar2021:152–154). Radiocarbon years were calibrated to calendar years using Calib 7.0 (Stuiver and Reimer Reference Stuiver and Reimer1993) and the IntCal13 dataset (Reimer et al. Reference Reimer, Bard, Bayliss, Beck, Blackwell, Ramsey, Buck, Cheng, Edwards, Friedrich, Grootes, Guilderson, Haflidason, Hajdas, Hatté, Heaton, Hoffmann, Hogg, Hughen, Kaiser, Kromer, Manning, Niu, Reimer, Richards, Scott, Southon, Staff, Turney and van der Plicht2013).
Calculations of the volume of the Tintal–Mirador causeway, based on excavations, determined that the Preclassic Maya used as much as 10,000 m3/km of lime plaster and lime reinforced fill for elevated sections of the causeway. Schreiner and Hernández also determined that up to 40,000 m3/km of tzaal stone (a soft, porous limestone of nearly pure calcium carbonate, with 2 percent montmorillonite clay) was used on the combined volume of the four sequential renovations of the causeway (Hansen Reference Hansen, Janetski, Gurr and Nielson-Grimm2012b:263–264; Hansen et al. Reference Hansen, Forsyth, Woods, Hansen, Schreiner, Titmus, Bey and Brown2018a; Schreiner Reference Schreiner, Laporte, de Suasnavar and Arroyo2001, Reference Schreiner2002, Reference Schreiner2021; Schreiner and Hernández Reference Schreiner, Hernández, Lopez, Hansen and Suyuc-Ley2008, Reference Schreiner, Hernández, Mejía, Hansen and Suyuc-Ley2009; Schreiner et al. Reference Schreiner, Hernández, Wahl and Hansen2015). Such consumption required the burning of great amounts of limestone and wood, with large labor requirements to make the quicklime for the lime plaster of the surfaces and substrate materials (Hansen Reference Hansen, Janetski, Gurr and Nielson-Grimm2012b; Hansen et al. Reference Hansen, Forsyth, Woods, Hansen, Schreiner, Titmus, Bey and Brown2018a, Reference Hansen, Suyuc-Ley, Guenter, Morales-Aguilar, Hernández, Balcárcel, Masson, Freidel and Demarest2020; Hernández et al. Reference Hernández, Schreiner, Morales-Aguilar, Arroyo and Salinas2013, Reference Hernández, Schreiner, Hansen, Morales-Aguilar, Ortega G., Mauricio, Hansen and Suyuc-Ley2016; Schreiner Reference Schreiner, Laporte, de Suasnavar and Arroyo2001, Reference Schreiner2002, Reference Schreiner2021). On wetland stretches, the causeway lime use was closer to 5000 m3/km, with the technical innovation of lime and clay mixtures that controlled moisture-induced heaving of available expansive clay base substrates (Schreiner Reference Schreiner2021).
The Tintal–Mirador causeway diverged at the site of Tintal to form another important causeway (Tintal–Ceibita causeway), 25–30 m wide, which extended 5 km to the southeast from the site, connecting directly to the monumental pyramid at the site of La Ceibita (Hernández-Salazar Reference Hernández-Salazar2021:72). The primary causeway (Tintal–Balamnal causeway) continued from Tintal in a southerly direction for approximately 3 km before curving to the southeast and running parallel with the natural karst border of the MCKB for 17 km, to the site of Balamnal (Figure 20). It is clear from the size, distribution, and quantity of major structures that Balamnal was one of the most important centers in the MCKB, with dominant E-Groups in the center of the site, and a series of elevated intrasite and intersite causeways, 15–20 meters wide, that extended to lower tiered sites in a dendritic format (Hansen et al. Reference Hansen, Suyuc-Ley, Guenter, Morales-Aguilar, Hernández, Balcárcel, Masson, Freidel and Demarest2020; see Chase and Chase Reference Chase and Chase2001:276–280 for a similar Classic period system at Caracol). The primary causeway (Tintal–Balamnal causeway) comes from Tintal to the northwest. Another elevated causeway, the Noholtun causeway, extends 5 km to the southwest to the site of Noholtun. The Noholnal causeway extends 5.5 km from Balamnal to the south to the site of Noholnal. The Pesquero causeway extends 7.5 km to the east and southeast to the site of El Pesquero, and yet another, the Union causeway, extends 9.5 km to the northeast to the site of La Union. The smaller outlier sites may have served as frontier stations for the MCKB, and no causeways have yet been observed that extend beyond the Mirador Anticline on the north, east or southeast or the low, residual karst hills on the west that form the natural borders of the basin.
LiDAR images of the newly discovered site of Balamnal. Background color for the map and the six insets represents terrain elevation with lowest elevations in blue and gradually increasing to highest elevations in reddish brown. Six causeways extend outwards from the site center: (a) a primary intersite causeway from Tintal; (b) intersite causeway to the site of La Unión; (c) an intrasite causeway connects a palace compound with the site center; (d) causeway to the site of El Pesquero; (e) intersite causeway to the peripheral site of Noholtún; (f) intersite causeway to the site of Noholnal.
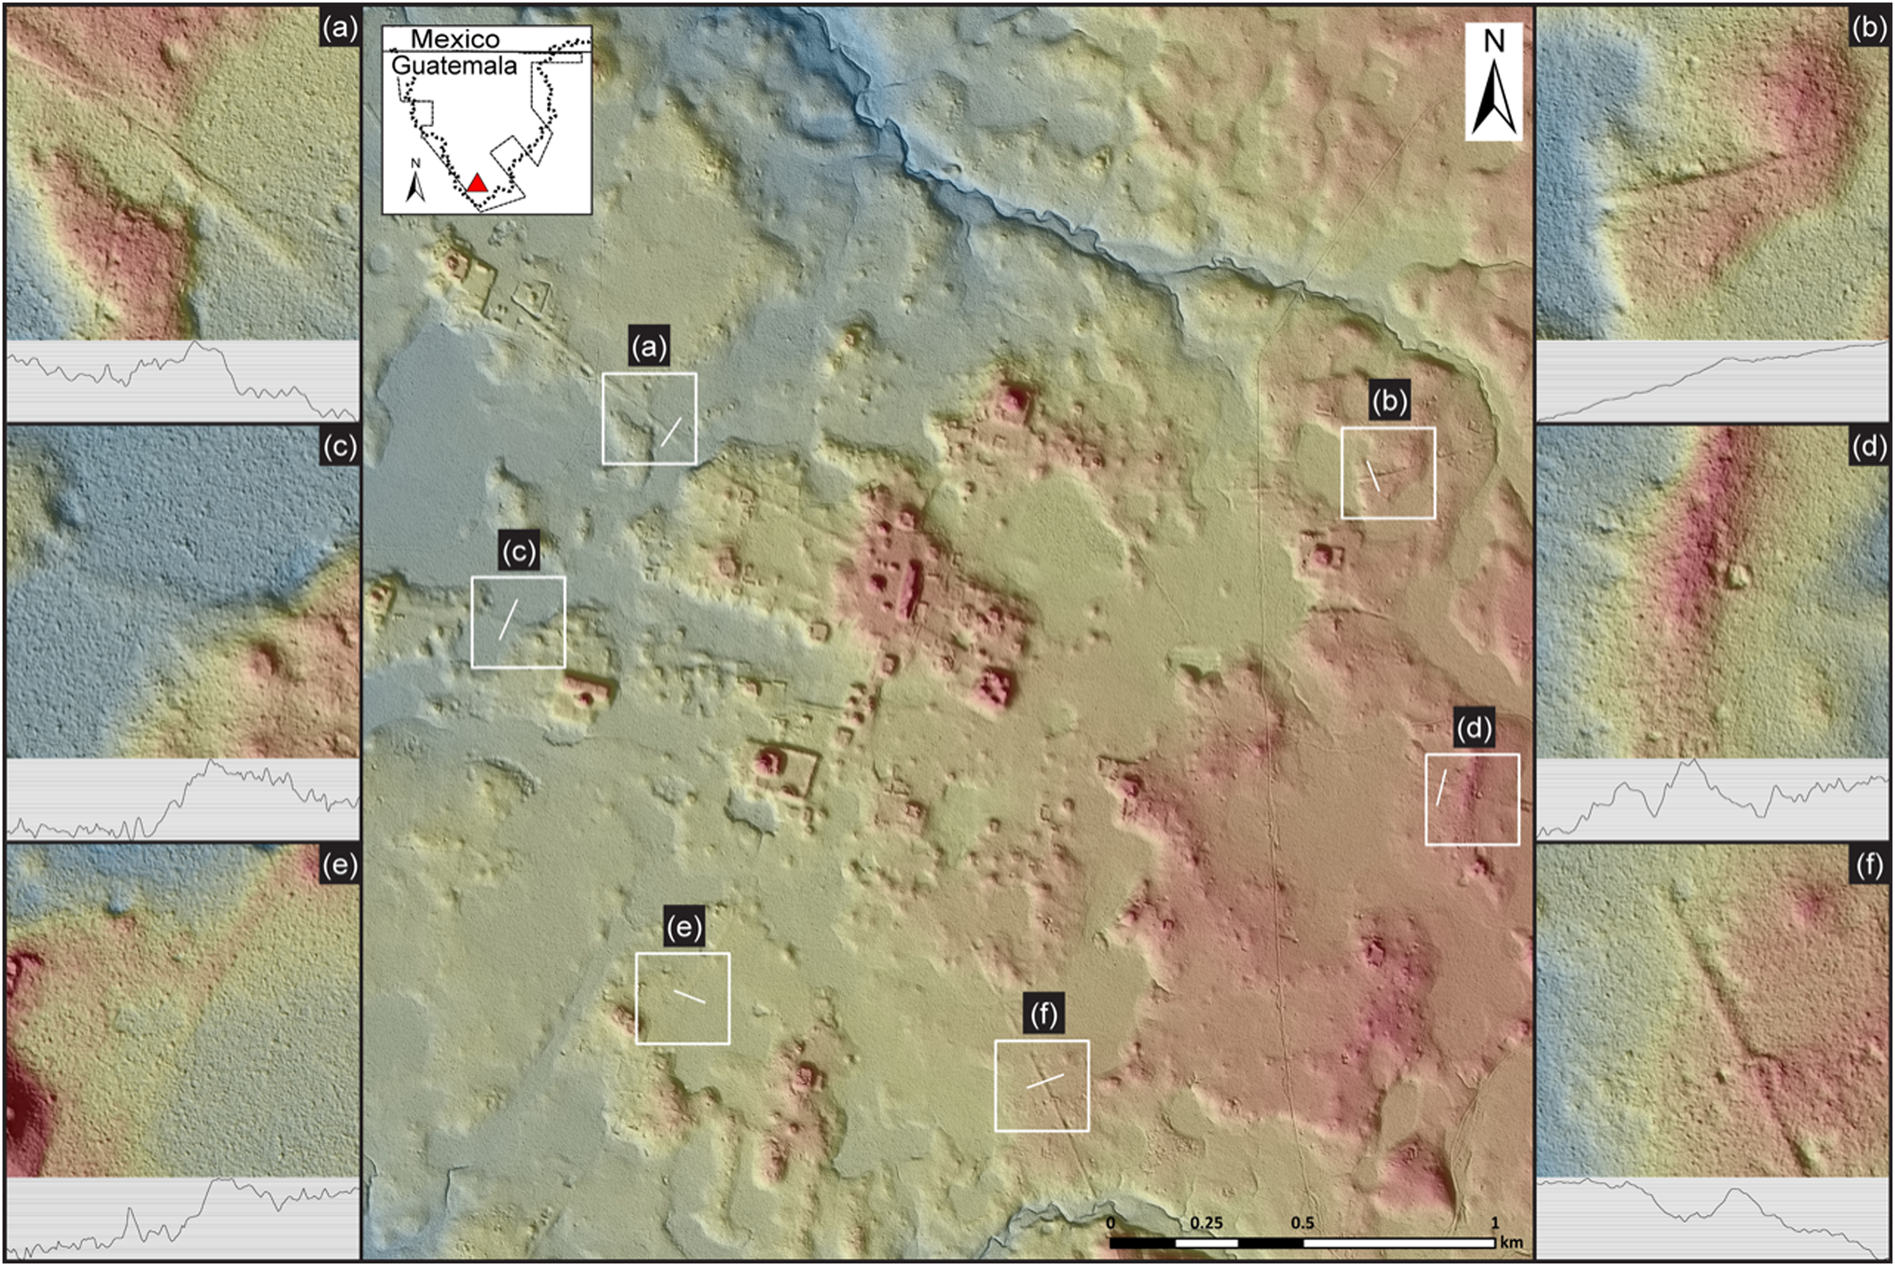
Excavations at both Balamnal and El Pesquero have located up to seven sequential floors in the plazas of the E-Group complexes, with the lower levels dating to the Middle Preclassic period (Mejía Reference Mejía, Laporte, Arroyo and Mejía2008, Reference Mejía, Arroyo, Escobedo, Hazard, Melendez and Girón2012; Mejía et al. Reference Mejía, Valle, Castañeda, Hernández, Laporte, Arroyo and Mejía2007, Reference Mejía, Aguilar, Cotom, Iwamoto, Portillo, Arroyo, Palma and Aragón2010). The unification of these sites, directly and indirectly, with the Tier 1 site of El Mirador via the causeway network suggests an administrative centralization and an autochthonous development of economic and political power indicative of a complex authority at kingdom (and state) level.
Water management: Reservoirs
The LiDAR survey in the MCKB system has provided new insights into the control of water. The MCKB has no perennial rivers or lakes, aside from mature marshes on a small scale (civales), requiring the ancient Maya to construct large reservoir systems for water collection and rainwater management (see Chase and Cesaretti Reference Chase and Cesaretti2018 for similar observations in Caracol and Tikal, as well as Nakum; Źrałka and Koszkul Reference Źrałka and Koszkul2015). LiDAR data located 195 artificial water reservoirs (termed aguadas by locals, although naturally occurring aguadas are rarely found in the basin) and a series of monumental reservoir systems designed for large water capture and control in the southern half of the MCKB. Other scholars have contributed to understanding water management strategies within the MCKB (Brewer Reference Brewer2017; Brewer et al. Reference Brewer, Carr, Dunning, Walker, Hernandez, Peuramaki-Brown and Reese-Taylor2017; Parry Reference Parry2007; Seefeld Reference Seefeld2013, Reference Seefeld2017) and such studies can be substantially refined with LiDAR. Strategies at El Mirador between 300 and 100 b.c. included the conversion of sunken ceremonial plazas into water collection reservoirs, such as those in the Great Central Acropolis at El Mirador and the construction of lime cement pools for water capture (Argyle Reference Argyle, Lopez, Hansen and Suyuc-Ley2008, Reference Argyle, Mejía, Hansen and Suyuc-Ley2009, Reference Argyle, Mejía, Hansen and Suyuc-Ley2010; Argyle and Hansen Reference Argyle and Hansen2010, Reference Argyle, Hansen, Hansen and Suyuc-Ley2015, Reference Argyle, Hansen, Hansen and Suyuc-Ley2016:135–140). Subsistence strategies included the construction of a variety of reservoirs and the construction of dams and canals by the Middle and Late Preclassic periods (Hansen et al. Reference Hansen, Bozarth, Jacob, Wahl and Schreiner2002; Hernández et al. Reference Hernández, Schreiner, Morales-Aguilar, Arroyo and Salinas2013, Reference Hernández, Schreiner, Morales-Aguilar, Hansen, Arroyo, Salinas and Álvarez2019:462–463; Morales-Aguilar et al. Reference Morales-Aguilar, Douglas Mauricio, Hernández, Arroyo, Salinas and Paiz2015; Schreiner et al. Reference Schreiner, Hernández, Wahl and Hansen2015), all of which exceeded the capacities of lower administrative levels. The Preclassic reservoir system at the base of the escarpment in the West Group at El Mirador held an estimated 336,653 m3 of water in a defined area of 224,435.41 m2. Four other major reservoirs at the site (excluding aguadas) had a combined estimated capacity (via Hydrology Toolset) of an additional 374,490.53 m3 (Table 6). The volume of reservoirs was calculated with ArcGIS Pro Hydro tool. Storage Capacity, Fill, and Pixel Editor tools were performed using LiDAR DEM with an arbitrary depth of 1 m (based on prior excavations) to obtain the volumetrics of the reservoirs.
Formal reservoir areas and capacities at El Mirador, Nakbe, and Tintal.
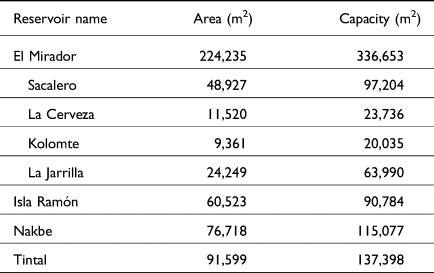
The primary dam for the Bajo La Jarrilla was constructed across a narrow stretch of bajo between the civic center of El Mirador and the suburb of La Muerta, measuring more than 400 m long, 3 m high, and 50 m wide in its current state, forming a reservoir containing at least 166,468 m3 of water (Figure 21). The Mirador–La Muerta causeway was directly attached to the dam along its western edge. Excavations of the dam recovered 184 ceramic sherds, 97 percent dating to the Middle Preclassic (ca. 600–400 b.c.) period (Hernández et al. Reference Hernández, Schreiner, Morales-Aguilar, Hansen, Arroyo, Salinas and Álvarez2019:462). A calibrated carbon sample (wood charcoal) from the lower levels of the causeway associated with the dam provided a possible 2σ date of 2450 30 B.P. (δ13C =−23.3%; 775–410 cal b.c.) with a median age of 580 cal b.c. (Beta 345791). Similar monumental water collection systems were located at the southern border of the Palma causeway at Nakbe, where a rectangular walled enclosure allowed capture and access of water.
Illustrations of the La Jarilla reservoir: (a) LiDAR 3D view of the Mirador–Tintal causeway and dams in the Bajo La Jarilla between the suburb of La Muerta and the civic center of El Mirador; (b) west–east profile of the La Jarilla reservoir, showing the dikes on both sides and the causeway. The reservoir, possibly constructed by 580 b.c. according to exclusive Middle Preclassic ceramics, and a single C-14 date may have been among the earliest such features in the MCKB.
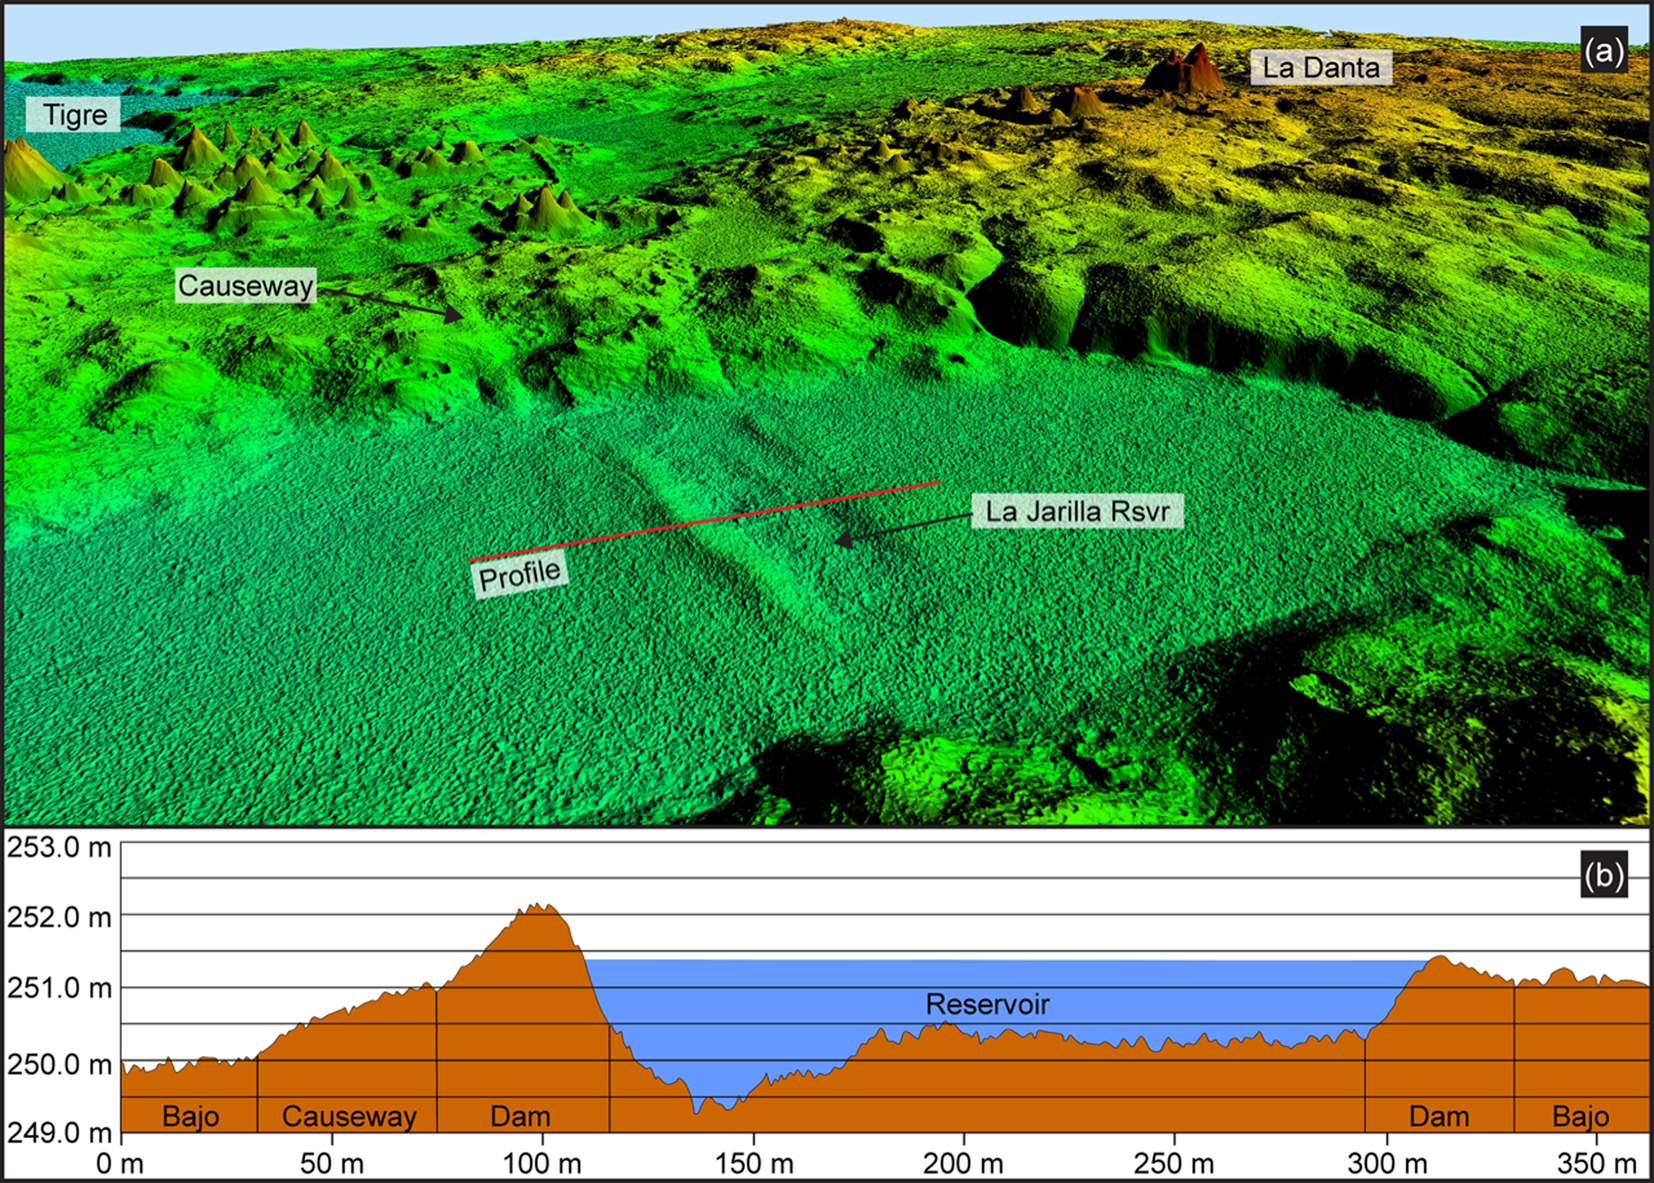
Final observations
The formation of a unified “kingdom” in the MCKB may have emerged as smaller entities were absorbed into a larger hegemony, an alternative model to that proposed by Clark for the Middle Preclassic kingdoms of the Western Maya Highlands (Clark Reference Clark, Traxler and Sharer2016). According to Clark, the “critical competition facing Middle Preclassic rulers was … nurtured … within the boundaries of their own domains” (Clark Reference Clark, Traxler and Sharer2016:223, editing Hansen). In the case of El Mirador, extraordinary economic, political, and social power was wielded at least by the Middle Preclassic period to form the networking of contemporaneous sites, welded together by an extraordinary web of large, dendritic causeway systems, a unified and homogeneous religious and political ideology, as portrayed first in E-Group compounds dating to the Middle Preclassic period, and modified by about 350–300 b.c. to include the large repertoire of triadic architectural complexes throughout the MCKB. We concur with Chase et al. (Reference Chase, Chase and Smith2009:181) that Mesoamerican polities seem to have been defined by relationships with the ruler, but in the MCKB the region seems to have included a territorial framework, since none of the large causeway systems extend beyond the natural borders of the Basin. The expansion and control of labor for such massive, contemporaneous monumental architectural groups suggests a unified power that could draw on labor and resources from throughout the entirety of the MCKB. Furthermore, the monumentality evident in the architecture of the MCKB is also found in contemporary cultures or antecedent societies in the Western Maya Lowlands or Gulf Coast areas (Inomata et al. Reference Inomata, Fernandez-Diaz, Triadan, Mollinedo, Pinzón, Hernández, Flores, Sharpe, Beach, Hodgins, Diaz, Luna, Chávez, Jiménez and Díaz2021; see also Rosenswig Reference Rosenswig2021b).
Contiguous, regional LiDAR studies of this southern half of the MCKB area have presently revealed 964 archaeological sites. Many of these settlements demonstrate a political/social/geographical relationship with other nearby settlements, which has resulted in the consolidation into at least 417 ancient cities, towns, and villages with identifiable site boundaries. A settlement and administrative hierarchy of at least six tiers is proposed for sites, based on surface area of the sites, numbers and densities of monumental architecture, and volumetric calculations of architecture extracted from geometric calculations and LiDAR data. The approximate volumetric assessments of construction fill within the civic center of a 1 km2 area with contemporary monumental architecture allows similar methodology to be applied in other areas of the Maya Lowlands, as a means of determining the sociopolitical and economic prowess of sites. Large-scale monumental architecture, consistent architectural formats, specific site boundaries, water management and collection facilities, and more than 177 km of elevated Preclassic causeways suggest a social and economic cohesion that exceed those of lesser polities during these periods and portray the strategies of governance in incipient kingdom-/state-like formation in the Middle and Late Preclassic periods of the MCKB.
The complex societies that emerged in the MCKB organized infrastructure to promote and reflect socio-economic organization and political power during the Preclassic period of Maya history. The peculiarity of dense demographic regions in the wetland bajos bolsters the hypothesis that an incipient state-level kingdom had been formed by these periods in an area that today would have been considered inhospitable for demographic and architectural expansion. This was a sequentially defined process that evolved to a tiered hierarchy of sites within a specific territorial area, possibly as an autochthonous process, but that may have been inspired by competitive ideologies, peer polity interactions, or other influences by other Highland or Lowland societies. The adoption and adaptation of “important ingredients to contemporaneous Mesoamerican social and political identities” provided the cultural foundations for later Maya and Mesoamerican states (Hansen Reference Hansen, Traxler and Sharer2016b:330). The contemporary and consistent architecture connected by the dendritic network of causeways within a geographically defined, congruent, natural, socio-economic, and political region is suggestive of a centralized political, economic, and/or ideological authority, which we believe to have emerged at El Mirador by the Middle Preclassic period and expanded by the beginning of the Late Preclassic period. Later patterns of dendritic networks of causeways elsewhere in Mesoamerica, such as Chichen Itza, Caracol, and the Basin of Mexico, suggest that the political and economic integration may have had antecedents such as those found in the MCKB. Major new cities have been found by this research, such as the great site of Balamnal, with archaeological excavations placed in the site (also known as “El Cedro”) by the Mirador Basin Project in 2008 and 2009 (Mejía et al. Reference Mejía, Aguilar, Cotom, Iwamoto, Portillo, Arroyo, Palma and Aragón2010), which was part of the unified settlements and causeways in the basin. New site boundaries and architectural group integrations (as noted by intrasite causeways) were identified, amplified, or modified due to LiDAR analyses as well.
LiDAR analyses have demonstrated the presence of dense concentrations of new and previously unknown contemporaneous sites, massive platform and pyramid constructions, including triadic groups, numerous E-Group complexes, causeway networks, ballcourts, and reservoirs that required vast amounts of labor and resources, amassed by a presumably centralized organization and administration. The skeleton of the ancient political and economic structure as a kingdom-state in the Middle and Late Preclassic periods has a tantalizing presence in the Mirador-Calakmul Karst Basin.
Acknowledgments
Appreciation is extended to the Ministerio de Cultura y Deportes of Guatemala (MICUDE, Contract DAJ 270-2018), the Dirección General del Patrimonio Cultural y Natural, and the Instituto de Antropología e Historia de Guatemala (IDAEH) for the authorizations and permits to carry out this research. Fieldwork in the southern Mirador-Calakmul Karst Basin was accomplished as part of the ongoing Mirador Basin Project, directed by Richard D. Hansen under the auspices of the Department of Anthropology of the University of Utah and the Department of Anthropology at Idaho State University, with financial assistance from many other private and public donors. We are thankful to the Dirección General de Aeronáutica Civil of Guatemala (Contracts DGAC/FA 1-2009, 016-2014) for the necessary flight permits and authorizations. ALOS Global Digital Surface Model (AW3D) digital elevation data, used for interpretation of the terrain and large-scale geological features, were provided by the Japan Aerospace Exploration Agency. Sentinel-2 multi-spectral data, including near-infrared bands, used for interpretation of hydrological features, were provided by the European Space Agency and the National Centre for Space Studies (CNES). LiDAR data were provided by FARES, the Mirador Conservation Fund, the National Geographic Society, and Eagle Mapping. We extend our appreciation to Jody Hansen, Dr. Robert Rosenswig and five anonymous reviewers for their comments and suggestions for improving this article. We extend our appreciation to the thousands of workers from the communities who have participated in the collection of much of these data and who have fostered a keen interest in the conservation of their unique cultural heritage. We appreciate and give thanks to the entire staff and personnel of the Mirador Basin Project, without whom none of this would have been possible.
Supplementary Material
To view supplementary material for this article, please visit https://doi.org/10.1017/S0956536122000244
Competing Interests
All authors have contributed to this article, and there are no competing or conflicts of interest among the authors.
Funding Statement
Funding for the research noted in this article was provided by the FARES Foundation, FARES-Guatemala, Pettit Foundation, Mirador Conservation Fund, Global Conservation, Mammel Foundation, Global Heritage Fund, Rosalinde and Arthur Gilbert Foundation, NAISA, Wolf Creek Foundation, Morgan Family Foundation, Moon Family Foundation, Jay I. Kislak Foundation, Peace, Love and Happiness Foundation, Selz Foundation, APANAC-Guatemala, Fundaselva Guatemala, National Geographic Society (Grant # SP 08-15 and SP-Garcia 18), U.S. Department of the Interior International Affairs Program, Victoria Earl-Mion Trust, Harry and Roberto Salter Foundation, Robert Berry, John Paul DeJoria, Dr. Nancy Furlotti, Adam and Chontal Green, John and Pat Hansen, Linda Pierce, Jeff Morgan, Joanna Miller, Darin Moon, Pitch and Cathy Johnson, Spencer Kirk, Francois and Nini Berger and family, Francois DuBois and family, Jose Maria Kong, Barby Pickett, and Peter Smith.


 Open access