

1. INTRODUCTION
In this work, the dispersion relation of electrostatic modes in relativistic plasmas is presented. The relativistic effects could be defined by the ratio of the rest energy to the thermal energy of particles, z s = m sc 2/T s where m s and T s are the mass and the temperature in energy units of particle specie s, respectively, and c is the speed of light. The validity of our model is restricted to wave phase velocities v φ = ω/k smaller than the electron thermal velocity 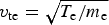 ${v_{{\rm te}}} = \sqrt {{T_{\rm e}}/{m_{\rm e}}} $, where ω and k are the frequency and the wavenumber of electrostatic modes.
Electrostatic and electromagnetic modes are plasma eigenmodes which have considerable importance in plasma physics and a great deal of attention has been paid to the study of these modes in various plasmas (classical, degenerate, relativistic…). Although they often exist in the form of small amplitude waves, they can also be driven with large amplitude by various linear and non-linear physical mechanisms. In this work, we are interested in electrostatic waves with small amplitude which can be accurately studied by the linear response theory. The spatiotemporal evolution of such plasma perturbations is studied about a global equilibrium.
In the literature, the electrostatic modes are investigated in the whole collisionality regime from the collisional regime defined in the wavenumber range kλ mfp << 1, to the collisionless one (kλ mfp >> 1) where λmfp is the particle mean free path of the plasma particles. In the collisional regime the damping of these modes occurs through collisions between particles, while in the collisionless regime, the damping takes place more subtly through the Landau damping mechanism. In the latter case, the waves are damped when they exchange energy with quasi-resonant particles whose velocity component along the propagation direction (x-axis) is very close to the phase velocity, that is, v x ≈ ω/k. This wave-particle energy is exchanged at the expense of the wave which is damped if the particle distribution function  $f\left( {\vec v} \,\right)$ has a negative derivative in the resonant region (df/dv x < 0).
In this work, we deal with relativistic plasmas defined by arbitrary values of z s. Such plasmas are for instance astrophysical plasmas (gamma-ray bursts, galaxy clusters, supernova shock…) and those produced in laboratories by high intensity laser pulses to achieve inertial confinement thermonuclear fusion. In addition, we restrict our analysis to collisionless plasma modes.
In non-relativistic plasmas, electrostatic waves have been studied extensively in the literature (Chen, Reference Chen1984; Krall & Trivelpiece, Reference Krall and Trivelpiece1973; Stix, Reference Stix1992). The dispersion relations of these electrostatic modes were established from the Vlasov equation, which describes collisionless plasmas at the microscopic level. The phase velocity v φ and the Landau damping rate γ L were numerically calculated as functions of kλ De and ZT e/T i, where λDe, is the electron Debye length, T e and T i the electron and ion temperature, and Z, the ion charge number. To our knowledge, the determination of v φ and γ L with respect to these two parameters is still an open problem in relativistic plasmas for low-frequency electrostatic waves. For high-frequency electrostatic (plasma waves) and electromagnetic modes recent work has been developed in Refs. (Fichtner & Schlickeiser, Reference Fichtner and Schlickeiser1995; Schlickeiser & Kneller, Reference Schlickeiser and Kneller1997; Melrose, Reference Melrose1999; Bergman & Eliasson, Reference Bergman and Eliasson2001; Podesta, Reference Podesta2008; Bers et al., Reference Bers, Shkarofsky and Shoucri2009; Schlickeiser, Reference Schlickeiser2010; Zhang et al., Reference Zhang, Wu, Zhou, Zhu and He2013; López et al; Reference López, Moya, Muñoz, Viñas and Valdivia2014) in the context of laser thermonuclear fusion. Our work is therefore an extension of these works to low-frequency spectrum.
This paper is organized as follows. In Section 2, we present the equations of the model and in Section 3, the dispersion relation of low-frequency electrostatic modes and analytic solutions are proposed. Section 4 is dedicated to the discussion of the numerical results and we summarize the main results obtained in this work in the last section.
2. EQUATIONS OF THE MODEL
To study the electrostatic modes in plasmas, the kinetic theory is the most appropriate approach used in the literature. This approach is self-consistent, that is, it overcomes the determination of closure relations as in the hydrodynamic equations. In particular, this theory accounts for the damping of electrostatic modes via wave-particle resonance mechanism. The kinetic equation used is the Vlasov equation (Bendib-Kalache et al., Reference Bendib-Kalache, Bendib and Matthieussent2004) that is adapted to describe collisionless plasmas. In contrast to the kinetic approach, in this work we use the hydrodynamic theory to study the electron gas in relativistic plasmas. It is well-known that fluid equations are simpler to use than the kinetic equations. The latter includes seven independent variables, namely the positions  ${\vec r_{\rm i}}$, the velocity ${\vec v_{\rm i}}$, and the time t, rather than only four ( ${\vec r_{\rm i}}$ and t) for the fluid equations. Further, to study collisionless plasma modes, the kinetic theory involves unavoidably pole integrals due to the wave-particle resonance which are complicated to calculate in the complex plane, whereas the fluid theory overcomes this difficulty since the approach is macroscopic. Thus, the fluid approach could simplify the calculations of the dispersion relations of the plasma modes and it constitutes a better alternative to the full kinetic treatment of the problem. For the electrons, the equations of the model are the three lower order hydrodynamic equations and for the ions we use the Vlasov equation. Both ion and electron equations are coupled to the Poisson equation. In addition, we assume that the ion gas is non-relativistic and therefore the contribution of ions to the dispersion relation is known in the literature. To study the dispersion relation of electrostatic waves we use as usual their perturbed form about plasma equilibrium. The non-perturbed form (Tsypin et al., Reference Tsypin, Galvão, Nascimento, Tsintsadze, Tsintsadze, Tendler and Neto1999) of the collisionless relativistic hydrodynamic equations is presented in Appendix A. Their perturbed expression about equilibrium in the spatial and temporal Fourier space (x ↔ k, t ↔ ω), can be deduced from Eqs. (A2)–(A4). For the density and momentum Eqs. (A2) and (A3), the results are straightforward:
 $$- i{\rm \omega} {\rm \delta} {n_{\rm s}} + ik{n_{{\rm 0s}}}{\rm \delta} {V_{\rm s}} = 0,$$
 $$\eqalign{& - i{\rm \omega} {m_{\rm s}}{n_{{\rm 0s}}}{G_{\rm s}}{\rm \delta} {V_{\rm s}} = - ik{n_{{\rm 0s}}}{\rm \delta} {T_{\rm s}} - ik{T_{{\rm 0s}}}{\rm \delta} {n_{\rm s}} \cr & - ik{\rm \delta} {\Pi _{\rm s}} + \displaystyle{{i{\rm \omega}} \over {{c^2}}}{\rm \delta} {q_{\rm s}} + {n_{{\rm 0s}}}{q_{\rm s}}{\rm \delta} E,} $$
where G = K 3(z e)/K 2(z e), K n(z e) being the modified Bessel function of nth order and z e = m ec 2/T e, the electron relativistic parameter. The other variables have their usual meaning, that is,  ${\rm \delta} {n_{\rm s}},\;{\rm \delta} {T_{\rm s}},\;{\rm \delta} {V_{\rm s}},\;{\rm \delta} \vec E,\;{\rm \delta} {\Pi _{\rm s}}$, and δq s represent the density, the temperature, the fluid velocity, the electric field, the stress tensor, and the heat flux, respectively. For the energy Eq. (A4) the first term in the left hand side requires some algebra. Its perturbed form is
 $${\rm \delta} \left[ {{n_{\rm e}}\displaystyle{d \over {dt}}\left( {{m_{\rm e}}{c^2}G} \right)} \right] = {n_{\rm e}}{m_{\rm e}}{c^2}\displaystyle{{dG} \over {d{z_{\rm e}}}}\left( { - {z_{\rm e}}\displaystyle{1 \over {{T_0}}}\displaystyle{{\partial {T_{\rm e}}} \over {\partial t}}} \right).$$
Using the recursive relations on the modified Bessel functions,
z edK 3/dz e + 3K 3 = −z eK 2 and z edK 2/dz e − 2K 2 = −z eK 3, we easily deduce dG/dz e = G 2 − 1 − 5/z eG. With the use of this transformation, the perturbed form of (A4) is readily obtained
 $$- i{\rm \omega} {h_{\rm s}}{n_{{\rm 0s}}}{\rm \delta} {T_{\rm s}} + ik{n_{{\rm 0s}}}{T_{{\rm 0s}}}{\rm \delta} {V_{\rm s}} = - ik{\rm \delta} {q_{\rm s}},$$
where  ${h_{\rm s}} = z_{\rm s}^2 \left( {1 - G_{\rm s}^2} \right) + 5{z_{\rm s}}{G_{\rm s}} - 1$. To be self-consistent we add to Eqs. (1)–(3), Poisson equation
 $$ik{\rm \delta} E = \displaystyle{1 \over {{{\rm \varepsilon} _0}}}\left( {{q_{\rm e}}{\rm \delta} {n_{\rm e}} + {q_{\rm i}}{\rm \delta} {n_{\rm i}}} \right).$$
 In Eqs. (1)–(4), the subscript s stands for electrons (e) and ions (i), the subscript 0 for the background physical quantities and the perturbed quantities are denoted by δX. We have supposed that the electric field is longitudinal, that is,  ${\rm \delta} \vec E\left( {x,t} \right)$ is along the x-axis and in the Fourier space the perturbed quantities stand as ${\rm \delta} X\sim \exp \left( { - i{\rm \omega} t + ikx} \right)$. The plasma is assumed at rest $\left( {{{\vec V}_{{\rm s0}}} = 0} \right)$ and its equilibrium state is defined by the electron Maxwell–Boltzmann–Jüttner equation, f MBJ(γ) (Jüttner, Reference Jüttner1911). His equilibrium function valid from the non-relativistic limit (z s → ∞) to the ultra-relativistic limit (z s → 0), is
 $${\,f_{{\rm MBJ}}}\left( p \right) = \displaystyle{{{n_{{\rm 0s}}}{z_{\rm s}}} \over {4{\rm \pi} m_{\rm s}^3 {c^3}{K_2}\left( {{z_{\rm s}}} \right)}}exp\left( { - {z_{\rm s}}{\rm \gamma} \left( p \right)} \right),$$
where p is the particle momentum and 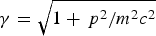 ${\rm \gamma} = \sqrt {1 + {\,p^2}/{m^2}{c^2}} $ is the Lorentz factor. In Eqs. (2) and (3) two closure relations are included, namely δΠs the x–x component of the stress tensor and, δq s, the x-component of the heat flux. The momentum and energy exchanges between electrons and ions due to the electron–ion collisions are not accounted for in the collisionless limit. In using the hydrodynamic approach the key of the problem is the determination of the closure relations which include purely kinetic effects. This has been performed in the previous work (Bendib-Kalache et al., Reference Bendib-Kalache, Bendib and Matthieussent2004) and the following expressions of the closure relations were derived as:
 $${\rm \delta} {\Pi _{\rm s}} = - {{\rm \eta} _{\rm s}}{m_{\rm s}}{n_{{\rm 0s}}}c\displaystyle{{ik} \over {\left \vert k \right \vert}} {\rm \delta} {V_{\rm s}} - {{\rm \alpha} _{{\rm Ts}}}{n_{{\rm 0s}}}{\rm \delta} {T_{\rm s}},$$
 $${\rm \delta} {q_{\rm s}} = - {K_{{\rm Ts}}}{n_{{\rm 0s}}}c\displaystyle{{ik} \over {\left \vert k \right \vert}} {\rm \delta} {T_{\rm s}} - {{\rm \alpha} _{{\rm Vs}}}{n_{{\rm 0s}}}{T_{{\rm 0s}}}{\rm \delta} {V_{\rm s}},$$
where,
 $${{\rm \eta}_{\rm s}} = \left[\!\! \matrix{\displaystyle{{{I_2}\left( {{I_3}I_0^2 - {I_4}I_0^3} \right) + {I_1}\left( {{I_4}I_0^4 - {I_3}I_0^3} \right)} \over {\left( {{I_1}{A_1} - {I_4}{A_2}} \right)}} \times \displaystyle{{{I_2}\left( {I_0^3 - I_0^1} \right) - {I_1}\left( {I_0^4 - I_0^2} \right)} \over {{{\left( {{I_1}{I_3} - {I_2}{I_4}} \right)}^2}}} - \hfill \cr \displaystyle{{{I_3}\left( {I_0^3 - I_0^1} \right) - {I_4}\left( {I_0^4 - I_0^2} \right)} \over {\left( {{I_1}{I_3} - {I_2}{I_4}} \right)}} \hfill} \!\!\right],$$
is the dimensionless viscosity coefficient,
 $${K_{{\rm Ts}}} = \displaystyle{2 \over {\rm \pi}} \displaystyle{{z_{\rm s}^3} \over {{K_2}\left( {{z_{\rm s}}} \right)}} \times \displaystyle{{{{\left( {{I_2}} \right)}^2} - {I_1}{I_5}} \over {\left( {{I_1}{A_1} - {I_4}{A_2}} \right)}},$$
is the dimensionless thermal conductivity,
 $${{\rm \alpha} _{{\rm Ts}}} = - \displaystyle{{z_{\rm s}^3} \over {3{K_2}\left( {{z_{\rm s}}} \right)}}\displaystyle{{{I_2}\left( {I_0^3 - I_0^1} \right) - {I_1}\left( {I_0^4 - I_0^2} \right)} \over {\left( {{I_1}{A_1} - {I_4}{A_2}} \right)}},$$
and
 $$\eqalign{&{{{\rm \alpha} _{{\rm Vs}}} = - {z_{\rm s}}\left[ { - {G_{\rm s}} - \displaystyle{{{I_2}\left( {{I_3}I_0^2 - {I_4}I_0^3} \right) + {I_1}\left( {{I_4}I_0^4 - {I_3}I_0^3} \right)} \over {\left( {{I_1}{A_1} - {I_4}{A_2}} \right)}}} \right.} \cr & \qquad \qquad \times \left. {\displaystyle{{{{\left( {{I_2}} \right)}^2} - {I_1}{I_5}} \over {{{\left( {{I_1}{I_3} - {I_2}{I_4}} \right)}^2}}} + \displaystyle{{{I_2}{I_3} - {I_4}{I_5}} \over {\left( {{I_1}{I_3} - {I_2}{I_4}} \right)}}} \right],} $$
are off-diagonal dimensionless transport coefficients. The coefficient (10) accounts for the temperature anisotropy and coefficient (11) corresponds to the convective heat transport. In Eqs. (8)–(11) we used the following notations,
 $$\eqalign{& {I_1} = {K_2}\left( {{z_{\rm s}}} \right)/{z_{\rm s}}{\rm,} \,{I_2} = {K_2}\left( {{z_{\rm s}}} \right)\left( { - 1 + {z_{\rm s}}{G_{\rm s}}} \right)/z_{\rm s}^2 {\rm,} \cr & {I_3} = {K_2}\left( {{z_{\rm s}}} \right)\left[ {1 + {z_{\rm s}} + \left( {3 - {z_{\rm s}}} \right){G_{\rm s}}} \right]/z_{\rm s}^2 {\rm,} \cr & {I_4} = {K_2}\left( {{z_{\rm s}}} \right)\left( {{z_{\rm s}}{G_{\rm s}} - 1 - {z_{\rm s}}} \right)/z_{\rm s}^2 {\rm,} \cr & \,{I_5} = {K_2}\left( {{z_{\rm s}}} \right)\left( {{z_{\rm s}} + 3{G_{\rm s}}} \right)/z_{\rm s}^2 {\rm,} \cr & {A_1} = \displaystyle{{{I_1}\left( {I_0^4 - I_0^3} \right) + {I_2}\left( {I_0^2 - I_0^3} \right)} \over {\left( {{I_1}{I_3} - {I_2}{I_4}} \right)}}{\rm,} \cr & {A_2} = \displaystyle{{{I_1}I_0^3 - {I_2}I_0^2} \over {\left( {{I_1}{I_3} - {I_2}{I_4}} \right)}}{\rm,} \,{\rm and} \cr & I_{\rm i}^j \left( {{z_{\rm s}}} \right) = \int_1^\infty {{x^i}{{\left( {{x^2} - 1} \right)}^j}\exp \left( { - {z_{\rm s}}x} \right)} dx.} $$
It is important to note that the transport coefficients (8)–(11) were derived from the stationary Vlasov equation. The validity of the present model is therefore restricted to small phase velocity with respect to the thermal velocity, that is, ω/k <v ts. In this range of validity, Eqs. (1)–(3) are the counterpart to the perturbed relativistic Vlasov equation
 $$-i{\rm \omega} {\rm \delta} f + \displaystyle{{{p_x}} \over {\rm \varepsilon}} ik{\rm \delta} f + {q_{\rm e}}{\rm \delta} E \displaystyle{{\partial {\rm \delta} f} \over {\partial {p_x}}} = 0,$$
since the closure relations (8)–(11) which include purely kinetic effects are exact expressions. Thus the dispersion relation could be calculated equivalently by using Eq. (12) or Eqs. (1)–(3). To our knowledge, this equivalence between kinetic and hydrodynamic treatments in collisionless plasmas was demonstrated for the first time by (Hammett & Perkins, Reference Hammett and Perkins1990) in non-relativistic plasmas.
3. RELATIVISTIC DISPERSION RELATION AND ANALYTIC SOLUTIONS
In this section, we deal with the dispersion relation of low-frequency electrostatic waves. We assume that the ions are non-relativistic (z i >> 1), while the electrons have arbitrary relativistic regime that is, they are defined for arbitrary values of the relativistic parameter z e. From Eqs. (1)–(4), (6) and (7), and the well-known non-relativistic plasma dispersion function for ions Z i(ω/kv ti), the derivation of the dielectric function is straightforward and it reads
 $$D\left( {{\rm \omega}, \vec k} \right) = 1 - \displaystyle{{{A_{{\rm ki}}}} \over {2{k^2}{\rm \lambda} _{{\rm Di}}^2}} - \displaystyle{{{A_{{\rm he}}}} \over {2{k^2}{\rm \lambda} _{{\rm De}}^2}}, $$
where
 $$\eqalign{& {A_{{\rm hs}}} = 2/\left[ {1 - 2{z_{\rm s}}{\rm \xi} _{\rm s}^2 {z_{\rm s}}{G_{\rm s}} - i\sqrt {2{z_{\rm s}}} {{\rm \xi} _{\rm s}}{z_{\rm s}}{{\rm \eta} _{\rm s}} + 2{z_{\rm s}}{\rm \xi} _{\rm s}^2 {{\rm \alpha} _{{\rm Vs}}}} \right. \cr & \qquad+ \left. {\displaystyle{{\sqrt {2{z_{\rm s}}} {{\rm \xi} _{\rm s}}\left( {1 - {{\rm \alpha} _{{\rm Vs}}}} \right)\left( {1 - {{\rm \alpha} _{{\rm Ts}}} + i\sqrt {2{z_{\rm s}}} {{\rm \xi} _{\rm s}}{K_{{\rm Ts}}}} \right)} \over {{h_{\rm s}}\sqrt {2{z_{\rm s}}} {{\rm \xi} _{\rm s}} + i{K_{{{\rm T}_{\rm s}}}}}}} \right],} $$
and
 $${A_{{\rm ks}}} = \displaystyle{{d{Z_{\rm s}}} \over {d{{\rm \xi} _{\rm s}}}}.$$
 The subscripts k and h stand for kinetic and hydrodynamic descriptions. In Eqs. (13)–(15) we used the normalized phase velocity  ${{\rm \xi} _{\rm s}} = {\rm \omega} /\sqrt 2 k{v_{{\rm ts}}}$ and we recall the expression of the plasma dispersion function (Fried & Conte, Reference Fried and Conte1961)
 $${Z_{\rm s}}\left( {{{\rm \xi} _{\rm s}}} \right) = \displaystyle{1 \over {\sqrt {\rm \pi}}} \int\limits_{ - \infty} ^{ + \infty} {\displaystyle{{exp\left( { - {x^2}} \right)} \over {x - {{\rm \xi} _{\rm s}}}}} dx.$$
For longitudinal electrostatic modes the dispersion relation is
 $$D\left( {{\rm \omega}, \vec k} \right) = 1 - \displaystyle{{{A_{{\rm ki}}}} \over {2{k^2}{\rm \lambda} _{{\rm Di}}^2}} - \displaystyle{{{A_{{\rm he}}}} \over {2{k^2}{\rm \lambda} _{{\rm De}}^2}} = 0,$$
and we should mention that it is valid for ξe < 1 and arbitrary values of ξi, kλ De, and kλ Di.
We can transform analytically Eq. (13) by limiting the spectrum to the phase velocity range, v ti << ω/k << v te. This limitation corresponds to the usual ion-acoustic and ion plasma waves with arbitrary kλ De and kλ Di. Performing a Taylor expansion of the electron and ion parts of Eq. (13) with the use of the ordering, ξe << 1 and ξi >> 1 we obtain the following real and imaginary parts of the dielectric function
 $$\eqalign{{D_{\rm r}}({\rm \omega}, k) &= 1 - \displaystyle{{{\rm \omega} _{{\rm pi}}^2} \over {{{\rm \omega} ^2}}}\left[ {1 + \displaystyle{3 \over {\rm \tau}} (1 + {k^2}{\rm \lambda} _{{\rm De}}^2 )} \right] \cr & \quad + \displaystyle{1 \over {{k^2}{\rm \lambda} _{{\rm De}}^2}} \left( {1 - \displaystyle{R \over {{k^2}{\rm \lambda} _{{\rm De}}^2}} \displaystyle{{{{\rm \omega} ^2}} \over {{\rm \omega} _{{\rm pe}}^2}}} \right),} $$
 $$\eqalign{ {D_{\rm i}}({\rm \omega}, k) = &\;\sqrt {\displaystyle{{\rm \pi} \over 2}} \displaystyle{{{\rm \omega} _{{\rm pi}}^2} \over {{k^3}C_{\rm s}^3}} \cr & \times {\rm \omega} \left[ {{{\rm \tau} ^{3/2}}exp\left( { - \displaystyle{1 \over 2}{\rm \tau} {\rm \mu} \,\displaystyle{1 \over {{k^2}{\rm \lambda} _{{\rm De}}^2}} \displaystyle{{{{\rm \omega} ^2}} \over {{\rm \omega} _{{\rm pe}}^2}}} \right) + \sqrt {\displaystyle{2 \over {{\rm \pi} {\rm \mu}}}} S} \right],} $$
where μ = m i/Zm e, τ = ZT e/T i, 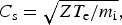 ${C_{\rm s}} = \sqrt {Z{T_{\rm e}}/{m_{\rm i}}}, $ and
 $$R({z_{\rm e}}) = \displaystyle{\matrix{K_{\rm T}^2 (1 - {G_{\rm e}}{z_{\rm e}} + {{\rm \eta} ^2}z_{\rm e}^2 ) + ({{\rm \alpha} _{\rm T}} - 1)({{\rm \alpha} _{\rm V}} - 1) \hfill \cr \times \;\left[ {(1 - G_{\rm e}^2 )z_{\rm e}^2 + (5{G_{\rm e}} + 2{\rm \eta} {K_{\rm T}}){z_{\rm e}} + {{\rm \alpha} _{\rm T}}({{\rm \alpha} _{\rm V}} - 1) - {{\rm \alpha} _{\rm V}}} \right] \hfill} \over {K_{\rm T}^2 {z_{\rm e}}}},$$
 $$S({z_{\rm e}}) = \displaystyle{{{\rm \eta} {K_{\rm T}}{z_{\rm e}} + ({{\rm \alpha} _{\rm T}} - 1)({{\rm \alpha} _{\rm V}} - 1)} \over {{K_{\rm T}}\sqrt {{z_{\rm e}}}}}, $$
are two coefficients that include relativistic contributions through G and the transport coefficients. Throughout this work we assume that the wavenumber k is real while the frequency is complex (ω = ωr + iωi). Within the approximation of a weak damped waves |ωi| ≪ωr, Eq. (17) becomes D r(ωr, k) = 0 and we get the analytic solution,
 $$\eqalign{ \displaystyle{{{\rm \omega} _{\rm r}^2} \over {{\rm \omega} _{{\rm pe}}^2}} = &\displaystyle{{{k^2}{\rm \lambda} _{{\rm De}}^2 (1 + {k^2}{\rm \lambda} _{{\rm De}}^2 )} \over {2R}} \cr & \times \left[ {1 - \sqrt {1 - \displaystyle{4 \over {{\rm \mu} {\rm \tau}}} R\left( {\displaystyle{{3(1 + {k^2}{\rm \lambda} _{{\rm De}}^2 ) + {\rm \tau}} \over {{{(1 + {k^2}{\rm \lambda} _{{\rm De}}^2 )}^2}}}} \right)}} \right].} $$
The damping rate of the electrostatic waves can be calculated from the relation D r(ωr, k) + iD i(ωr, k) = 0. The weak damping approximation |ωi| <<ωr yields at the first order,
 $${{\rm \omega} _{\rm i}} = - {D_{\rm i}}\left( {{{\rm \omega} _{\rm r}},k} \right)/\displaystyle{{\partial {D_{\rm r}}\left( {{{\rm \omega} _{\rm r}},k} \right)} \over {\partial {{\rm \omega} _{\rm r}}}},$$
which gives the expression
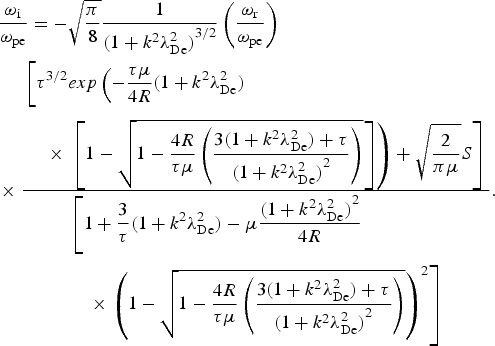 $$\eqalign{& \displaystyle{{{{\rm \omega} _{\rm i}}} \over {{{\rm \omega} _{{\rm pe}}}}} = - \sqrt {\displaystyle{{\rm \pi} \over 8}} \displaystyle{1 \over {{{(1 + {k^2}{\rm \lambda} _{{\rm De}}^2 )}^{3/2}}}}\left( {\displaystyle{{{{\rm \omega} _{\rm r}}} \over {{{\rm \omega} _{{\rm pe}}}}}} \right) \cr & \times \displaystyle{{\eqalign{&\bigg[ {{{\rm \tau} ^{3/2}}exp\left( { - \displaystyle{{{\rm \tau} {\rm \mu}} \over {4R}} (1 + {k^2}{\rm \lambda} _{{\rm De}}^2 )}\right.}\cr & \quad \times\left.{\left.{\left[ {1 - \sqrt {1 - \displaystyle{{4R} \over {{\rm \tau} {\rm \mu}}} \left( {\displaystyle{{3(1 + {k^2}{\rm \lambda} _{{\rm De}}^2 ) + {\rm \tau}} \over {{{(1 + {k^2}{\rm \lambda} _{{\rm De}}^2 )}^2}}}} \right)}} \right]} \right) + \sqrt {\displaystyle{2 \over {{\rm \pi} {\rm \mu}}}} S} \right]}} \over {\eqalign{&\left[ {1 + \displaystyle{3 \over {\rm \tau}} (1 + {k^2}{\rm \lambda} _{{\rm De}}^2 ) - {\rm \mu} \displaystyle{{{{(1 + {k^2}{\rm \lambda} _{{\rm De}}^2 )}^2}} \over {4R}}}\right.\cr & \quad \times \left.{{{\left( {1 - \sqrt {1 - \displaystyle{{4R} \over {{\rm \tau} {\rm \mu}}} \left( {\displaystyle{{3(1 + {k^2}{\rm \lambda} _{{\rm De}}^2 ) + {\rm \tau}} \over {{{(1 + {k^2}{\rm \lambda} _{{\rm De}}^2 )}^2}}}} \right)}} \right)}^2}} \right]}}}.}$$
 We can go a step further by limiting the analysis to ion acoustic waves in the spectrum range kλ De <<1 and to the ion plasma waves in the spectrum range  ${\rm \lambda} _{{\rm De}}^{ - 1}\! \lt\!\!\lt\, k \! \lt\!\!\lt\, {\rm \lambda} _{{\rm Di}}^{ - 1} $. We perform the corresponding Taylor expansion obtaining for the ion-acoustic waves
 $${\rm \omega} _{\rm r}^2 = {k^2}C_{\rm s}^2 \left( {1 + \displaystyle{3 \over {\rm \tau}}} \right),$$
 $$\displaystyle{{{{\rm \omega} _{\rm i}}} \over {{{\rm \omega} _{{\rm pe}}}}} = - \sqrt {\displaystyle{{\rm \pi} \over 8}} k{{\rm \lambda} _{{\rm De}}}\sqrt {\displaystyle{1 \over {\rm \mu}}} \displaystyle{{\left[ {{{\rm \tau} ^{3/2}}exp\left( { - \displaystyle{3 \over 2} - \displaystyle{{\rm \tau} \over 2}} \right) + \sqrt {\displaystyle{2 \over {{\rm \mu} {\rm \pi}}}} S} \right]} \over {\sqrt {1 + \displaystyle{3 \over {\rm \tau}}} \left[ {1 - \displaystyle{1 \over {\rm \mu}} R\left( {1 + \displaystyle{3 \over {\rm \tau}}} \right)} \right]}},$$
and for the ion plasma waves
 $${\rm \omega} _{\rm r}^2 = {\rm \omega} _{{\rm pi}}^2 \left( {1 + 3{k^2}{\rm \lambda} _{{\rm Di}}^2} \right),$$
 $$\eqalign{& \displaystyle{{{{\rm \omega} _{\rm i}}} \over {{{\rm \omega} _{{\rm pe}}}}} = - \sqrt {\displaystyle{{\rm \pi} \over 8}} k{{\rm \lambda} _{{\rm De}}}\sqrt {\displaystyle{1 \over {\rm \mu}}} \cr & \qquad\times \displaystyle{{\left[ {{{\rm \tau} ^{3/2}}\exp \left( { - \displaystyle{3 \over 2} - \displaystyle{1 \over {2{k^2}{\rm \lambda} _{{\rm Di}}^2}}} \right) + \sqrt {\displaystyle{2 \over {{\rm \pi} {\rm \mu}}}} S} \right]} \over {\sqrt {1 + 3{k^2}{\rm \lambda} _{{\rm Di}}^2} \left[ {{k^4}{\rm \lambda} _{{\rm De}}^4 - \displaystyle{1 \over {\rm \mu}} R\left( {1 + 3{k^2}{\rm \lambda} _{{\rm Di}}^2} \right)} \right]}}.} $$
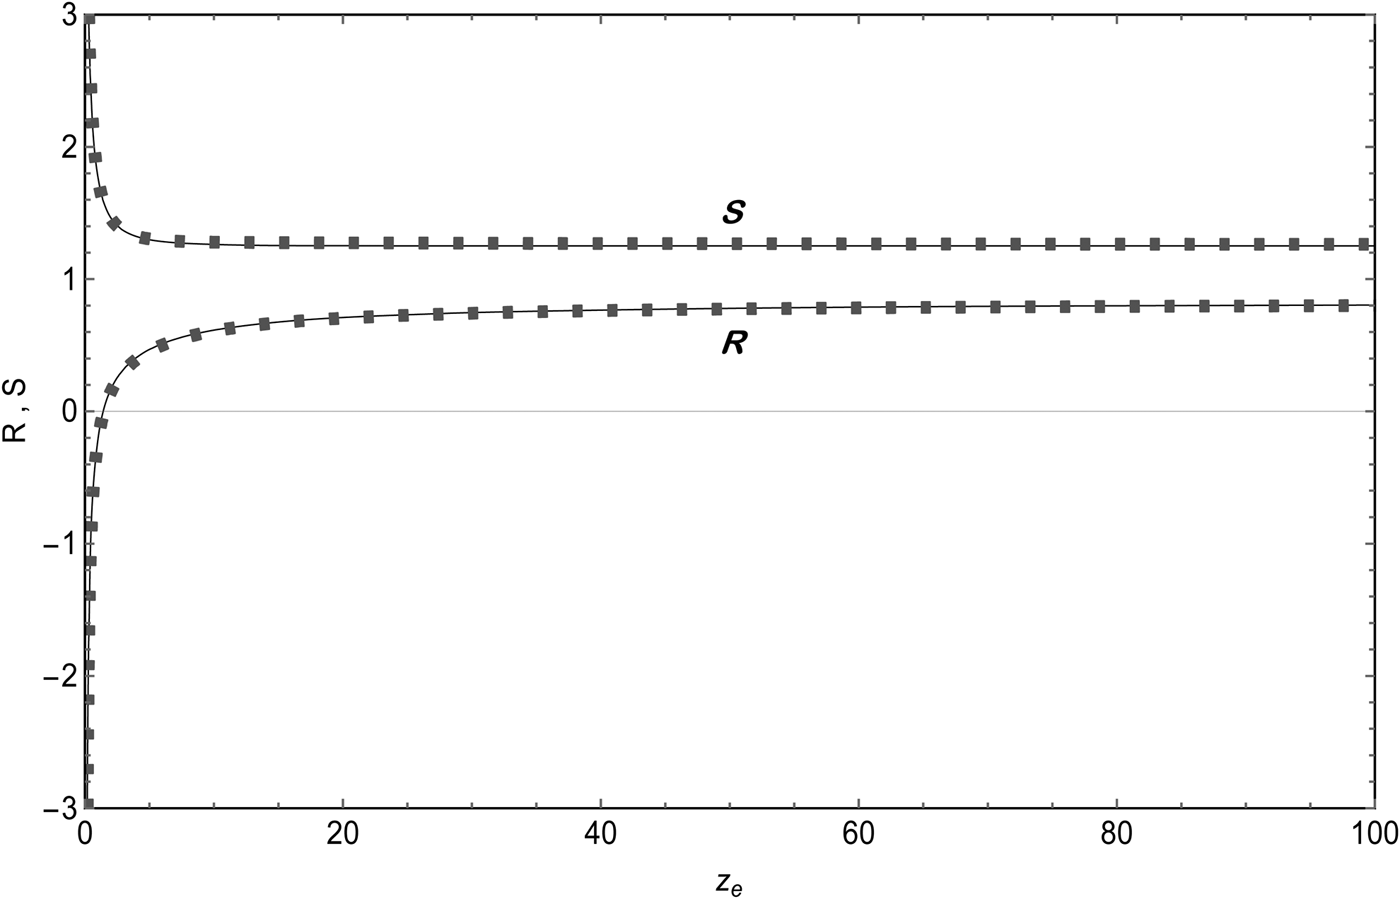
For practical purposes we propose numerical fits for the coefficients R and S involving the relativistic contributions
 $$R({z_{\rm e}}) = 0.83 - \displaystyle{{0.125} \over {{z_{\rm e}} + 0.03}} - \displaystyle{{2.21} \over {{z_{\rm e}} + 3.6}} - \displaystyle{{0.45} \over {{z_{\rm e}}}},$$
 $$S(z_{\rm e}) = 1.25 + \displaystyle{{1.6} \over {\sqrt {{z_{\rm e}}}}} - \displaystyle{{4.3} \over {{z_{\rm e}} + 3.75}} - \displaystyle{{10.6} \over {{z_{\rm e}} + 85.55}} - \displaystyle{{53.3} \over {{z_{\rm e}} + 945.5}}.$$
 The numerical fits of R and S by expressions (29) and (30) are obtained numerically with the quasi-Newton algorithm. The non-relativistic asymptotic values are analytically calculated, R(z e >>1) → 7π/12 − 1 ≈ 0.83 and  $S\left( {{z_{\rm e}} \gt\!\!\gt 1} \right) \to \sqrt {{\rm \pi} /2}$ $\approx 1.25$, and used also to build the numerical fits. In Figure 1 we represent these two coefficients as a function of z e. We have checked that they fit accurately the numerical results with a precision better than 5% in the range, 10−4 <z e <103.
4. NUMERICAL SOLUTIONS AND DISCUSSION
We have solved numerically in the complex plane (ωr, ωi) the dispersion relation (17). The results obtained are displayed in Figures 2 and 3.
1. First, we present in Figure 2, the numerical results in the non-relativistic limit. This limit is accurately reached for z e >100. We can see that the results are in good agreement with those obtained from the usual non-relativistic kinetic dispersion relation for longitudinal modes,
(31) $$1 - \displaystyle{1 \over {2{k^2}{\rm \lambda} _{{\rm Di}}^2}} \displaystyle{{d{Z_{\rm i}}} \over {d{{\rm \xi} _{\rm i}}}} - \displaystyle{1 \over {2{k^2}{\rm \lambda} _{{\rm De}}^2}} \displaystyle{{d{Z_{\rm e}}} \over {d{{\rm \xi} _{\rm e}}}} = 0.$$

(a) Normalized frequency (ωr/ωpe) as a function of the normalized wavenumber kλ De. The blue curve corresponds to the present numerical results, the dashed red curve to the non-relativistic results (Eq. 31). The Krall and Trivelpiece (green curve), Ichimaru (dotted curve), and McKinstrie et al. (orange curve) formulas are also represented. The plasma parameters are τ = 10 and z e = 1000. (b) Damping rate (− ωi/ωr) as a function of the normalized wavenumber kλ De. The blue curve corresponds to the present numerical results, the dashed red curve to the non-relativistic results (Eq. 31). The Krall and Trivelpiece (green curve), Ichimaru (dotted curve), and McKinstrie et al. (orange curve) formulas are also represented. The plasma parameters are τ = 10 and z e = 1000.

(a) Normalized frequency (ωr/ωpe) as a function of the normalized wavenumber kλ De. The blue curve corresponds to the present numerical results (Eq. 17), the dashed red curve to the analytical solution (Eq. 22) and the dotted curves to the approximate analytic solution (Eq. 25). The plasma parameters are τ = 10 and z e = 100, 30, and 0.3. (b) Damping rate (− ωi/ωr) as a function of the normalized wavenumber kλ De. The blue curves correspond to the present numerical results (Eq. 17), the dashed red curves to the analytical solution (Eq. 24) and the dotted curves to the approximate analytic solution (Eq. 26). The plasma parameters are τ = 10 and z e = 100, 30, and 0.3. (c) Normalized frequency (ωr/ωpe) as a function of the normalized wavenumber kλ De. The blue curve corresponds to the present numerical results (Eq. 17), the dashed red curve to the analytical solution (Eq. 22) and the dotted curves to the approximate analytic solution (Eq. 25). The plasma parameters are τ = 1 and z e = 100, 50, and 0.3. (d) Damping rate (− ωi/ωr) as a function of the normalized wavenumber kλ De. The blue (z e = 100, 50) and dashed red (z e = 0.3) curves correspond to the present numerical results (Eq. 17). The plasma parameters are τ = 1 and z e = 100, 50, and 0.3.
For ωr/ωpe, the numerical fits of Krall and Trivelpiece (Reference Krall and Trivelpiece1973) agree well with numerical results in the range kλ De <<1, whereas for ωi/ωr, large discrepancy is observed. Moreover the numerical fits of (Ichimaru, Reference Ichimaru1973; McKinstrie et al. Reference McKinstrie, Giacone and Startsev1999) are accurate for kλ De < 0.4. We should note that in Figure 2 we have used a large value of τ, for strongly isothermal plasmas and small Z, the difference between the numerical fits and the numerical results increases significantly.
2. For lower values of the relativistic parameter (z e < 100), the relativistic effects should be accounted for. We can see in Figure 3a that the contribution of the relativistic effects to the real part of the frequency ωr(kλ De) is not significant [typically for kλ De = 0.1, we have found that ωr/ωpe(z e = 0.1) ≈ ωr/ωpe(z e = 100) with a precision about 1%]. This weak difference is even less important when kλ De is increased. This behavior is corroborated by Eqs. (25) and (27) which shows that the dependence on z e is negligible.
For the damping rate of electrostatic waves (Fig. 3b) the relativistic effects are more significant only in strongly relativistic regime. We note that the relativistic effects tend to reduce the damping rate for weakly or moderately relativistic plasmas (typically for z e > 5). This reduction is however weak and it is even weaker for large ion charge number (τ >>1). This weak dependence on z e is due to the weak modification of the reduced electron Maxwell–Boltzmann–Jüttner function  ${F_{{\rm MBJ}}}\left( {{v_x}} \right) = \int_{ - c}^{ + c} {{\,f_{{\rm MBJ}}}\left( {\vec v\,} \right)d{v_y}d{v_z}} $ by the relativistic effects for small resonant velocities v x ≈ ω/k << v te. Besides in Figures 3a and 3b, the approximate analytic solutions (25) and (26) are also represented and we can observe the very good agreement with the numerical solutions.
In contrast, for strongly relativistic plasmas (z e < 5) the relativistic effects tend to increase the electrostatic mode damping. This can be explained by the contribution of the viscosity dissipative effects to the electron Landau damping which increases considerably when z e decreases. This could be explained by the behavior of the parameter S(z e) (see Fig. 1) which presents a minimum about z e ≈ 5. We can see that S(z e) decreases very slowly for decreasing z e in the moderate relativistic range and this makes clear the weak decreasing of the damping rate in this regime. From z e ≈ 5 it grows rapidly due to the rapid increase in the viscosity coefficient and correlatively this yields an increase of the damping rate in strongly relativistic range. In the article by Bers et al. (Reference Bers, Shkarofsky and Shoucri2009) the spectrum of electronic plasma waves in moderately relativistic plasmas is calculated. They found similar results for ωr(kλ De), that is, the relativistic effects do not significantly affect the real part of the dispersion relation. For the damping rate they found still the same behavior, that is, the damping rate decreases with decreasing z e. But in contrast to our results they found for these high-frequency modes an important reduction of the damping rate about one order of magnitude or more. Although it is not possible to compare the damping of high- and low-frequency electrostatic modes this difference could be partially explained by the slope of the electronic distribution function in the resonance region (proportional to the damping rate), which is significantly lower for low-frequency waves than for high-frequency waves.
To be more complete, we give also in Figures 3c and 3d a numerical application for electron–proton plasmas in global equilibrium (Z = 1, T e = T i) which could be more relevant for cosmic plasmas. The results show that the damping is particularly strong while the phase velocity is close to the previous results. We should note that in Figure 3d we do not represent the analytic results because they present a large discrepancy from the numerical solution since they are derived within |ωi/ωr| << 1, which is not fulfilled in this case.
The damping of low-frequency electrostatic waves is due to resonant interaction of waves with both ion and electron particles. Typically, the damping rate is proportional to ∂f(v x)MBJ e,i/∂v x and therefore for ions, the resonant particles v x ≈ ω/k >> v ti give very small contribution to the total damping rate. This is due to the exponentially small amount of particles in this velocity range. On the other hand for electrons, v x ≈ ω/k << v te, thus the number of resonant particles is more important but the damping is still small, though not exponentially, since the derivative of f MBJ e in this range of velocity is not significant. It results that the relative contribution of electrons and ions to the damping of electrostatic waves depend strongly on the plasma parameters (temperature, density…). We have found that the damping through electrons is generally negligible. However for large values of τ and in the range kλ De << 1, the damping through electrons prevails over the one through ions and this result does not depend on the relativistic parameter z e.
3. We are now interested on waves of very small phase velocity such as ω/k << v ti. In this case, we just remark that our hydrodynamic formalism works well for electrons than ions. We have solved analytically Eq. (13) with the use of the conditions ξe << 1 and ξi << 1 and found the expression for the longitudinal dielectric function
(32)$$D\left( {{\rm \omega}, k} \right) \approx 1 + \displaystyle{1 \over {{k^2}{\rm \lambda} _{{\rm Di}}^2}} + \displaystyle{1 \over {{k^2}{\rm \lambda} _{{\rm De}}^2}}. $$

This shows that these modes are dramatically damped. In this static limit the electrostatic field is screened within a radius equal to the well-known Debye length as in non-relativistic plasmas.
4. In this sub-section, we deal with the polytropic index and the fluid damping rate in relativistic plasmas. We can recast Eqs. (2) and (3) into one equation by eliminating the perturbed temperature, obtaining
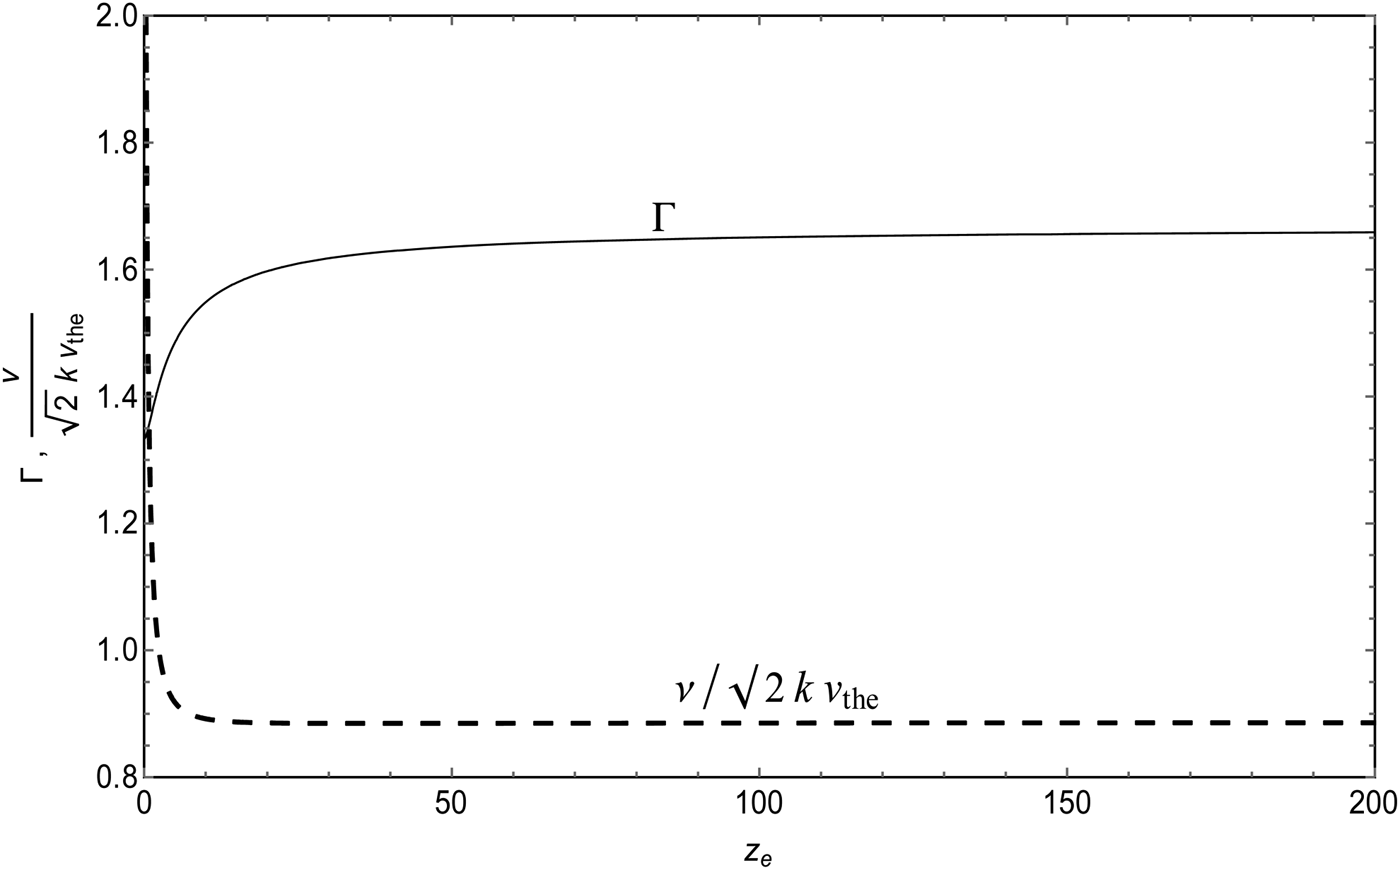
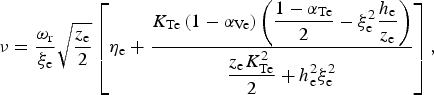
(33)where$$- i{\rm \omega} {G_{\rm e}}{\rm \delta} {V_{\rm e}} = - ik\displaystyle{{{T_{{\rm 0e}}}} \over {{m_{\rm s}}{n_{{\rm 0e}}}}}\Gamma {\rm \delta} {n_{\rm e}} - {\rm \nu} {\rm \delta} {V_{\rm e}} + \displaystyle{{{q_{\rm e}}} \over {{m_{\rm e}}}}{\rm \delta} E,$$(34)is the relativistic polytropic index and$$\Gamma = 1 + \displaystyle{{2{\rm \xi} _{\rm e}^2 {{\rm \alpha} _{{\rm Ve}}}} \over {{z_{\rm e}}}} + \displaystyle{{{\rm \xi} _{\rm e}^2 \left( {1 - {{\rm \alpha} _{{\rm Ve}}}} \right)\left[ {K_{{\rm Te}}^2 + {h_{\rm e}}\left( {1 - {{\rm \alpha} _{{\rm Te}}}} \right)} \right]} \over {\displaystyle{{{z_{\rm e}}K_{{\rm Te}}^2} \over 2} + h_{\rm e}^2 {\rm \xi} _{\rm e}^2}}, $$(35)is the fluid collisionless damping rate. We present in Figure 4 the polytropic index as a function of the normalized phase velocity ξe for three values of z e. First, whatever the relativistic state, the isothermal value defined for ξe → 0 is recovered, that is, Γ = 1, and when z e decreases, Γ increases. Furthermore, we have checked numerically that the dependence of the fluid damping rate on ξe is negligible. Its value corresponds approximately to the stationary value:$${\rm \nu} = \displaystyle{{{{\rm \omega} _{\rm r}}} \over {{{\rm \xi} _{\rm e}}}}\sqrt {\displaystyle{{{z_{\rm e}}} \over 2}} \left[ {{{\rm \eta} _{\rm e}} + \displaystyle{{{K_{{\rm Te}}}\left( {1 - {{\rm \alpha} _{{\rm Ve}}}} \right)\left( {\displaystyle{{1 - {{\rm \alpha} _{{\rm Te}}}} \over 2} - {\rm \xi} _{\rm e}^2 \displaystyle{{{h_{\rm e}}} \over {{z_{\rm e}}}}} \right)} \over {\displaystyle{{{z_{\rm e}}K_{{\rm Te}}^2} \over 2} + h_{\rm e}^2 {\rm \xi} _{\rm e}^2}}} \right],$$${\rm \nu} \left( {{{\rm \xi} _{\rm e}} = 0} \right)/\sqrt 2 k{v_{\rm t}} = 0.89$ for z e = 100 and z e = 30, and ${\rm \nu} \left( {{{\rm \xi} _{\rm e}} = 0} \right)/\sqrt 2 k{v_{\rm t}} = 2.1$ for z e = 0.3.




Polytropic index Γ as a function of the normalized phase velocity ξe for the three values of z e:z e = 100 (blue curve), z e = 30 (dashed red curve), and z e = 0.3 (green curve).
In Figure 5 we represent the fluid damping rate as a function of the relativistic parameter z e. We have checked numerically that ν(z e) admits a flat minimum about z emax = 35.6. This explains the variation of ωi with respect to z e. We have also calculated analytically the asymptotic limits and we found that in the ultra-relativistic limit the damping tends to  ${\rm \nu} \left( {{z_{\rm e}} \to 0} \right) \to ({\rm \pi} /2\sqrt 2 )(1/\sqrt {{z_{\rm e}}} )$, whereas in the opposite limit it tends to ${\rm \nu} \left( {{z_{\rm e}} \to \infty} \right) \to 29\sqrt {\rm \pi} /60$. These two limits agree well with the numerical results. Moreover we just remark that the damping rate (35) vanishes as it should if the dissipative terms, that is, the viscosity ηe and the thermal conductivity K Te, are dropped.
Polytropic index Γ in the adiabatic approximation (Eq. 36) (solid curve) and fluid damping rate  ${\rm \nu} /\sqrt 2 k{v_{{\rm te}}}$(dashed curve) as a function of z e.
Let us now neglect in Eq. (34) the transport coefficients  ${K_{{{\rm T}_{\rm e}}}},{{\rm \eta} _{\rm e}},{{\rm \alpha} _{{\rm Ve}}},$ and αTe. This leads to the adiabatic approximation since the thermal flux vanishes. In this case, the polytropic index becomes
 $$\Gamma \left( {{z_{\rm e}}} \right) = 1 + 1/{h_{\rm e}}\left( {{z_{\rm e}}} \right),$$
as shown in Figure 5. For increasing z e, the polytropic index increases from the ultra-relativistic value Γ(z e → 0) = 4/3 to the non-relativistic one Γ(z e → ∞) = 5/3. We thus recover the well-known results reported in the literature. We should mention that expression (36) derived in the present work from the fluid-kinetic theory was also derived by Synge (Reference Synge1957), but with different approach based on the relativistic equilibrium statistical mechanics in Minkowsky space.
5. SUMMARY
In this work, a collisionless dispersion relation of low-frequency electrostatic waves is derived in relativistic plasmas. The electron gas is described with the fluid approach using the three conservative equations of particle, momentum, and energy together with the collisionless closure relations derived in Bendib-Kalache et al. (Reference Bendib-Kalache, Bendib and Matthieussent2004). Due to their large mass energy the ions are assumed non-relativistic and therefore this particle species is described by the standard plasma dispersion function Z i(ξi). Analytic solutions of the dispersion relation are proposed for the ion-acoustic waves and ion plasma waves. The numerical results show that the relativistic effects do not modify significantly the dispersion of the low-frequency electrostatic waves. In addition, in moderately relativistic regime the damping rate slightly decreases when relativistic effects increase. However in the highly relativistic regime the damping rate increases with relativistic effects. The relativistic polytropic index and the collisionless fluid damping rate were also derived and the asymptotic non-relativistic and ultra-relativistic limits are recovered as well as the well-known adiabatic polytropic index of Synge (Reference Synge1957). In future inertial fusion plasmas the electron temperature could be moderately relativistic and we expect that the role of ion acoustic waves on the Brillouin backscattering instability should not be significant.
ACKNOWLEDGEMENTS
This work was supported by the Laboratory Electronique Quantique of Faculty of Physics of USTHB under Project CNEPRU 2015.
Relativistic hydrodynamic equations in unmagnetized plasmas
The hydrodynamic equations describe the spatio-temporal evolution of the macroscopic parameters and they are derived from the kinetic theory. For unmagnetized plasmas with a spatial inhomogeneity along the x-axis, the electron relativistic kinetic equation is
 $$\displaystyle{{\partial {\,f_{\rm e}}} \over {\partial t}} + \displaystyle{{{c^2}} \over {\rm \varepsilon}} {\,p_x}\displaystyle{{\partial {\,f_{\rm e}}} \over {\partial x}} + {q_{\rm e}}E\displaystyle{{\partial {\,f_{\rm e}}} \over {\partial {\,p_x}}} = {C_{{\rm ei}}}\left( {{\,f_{\rm e}},{\,f_{\rm i}}} \right) + {C_{{\rm ee}}}\left( {{\,f_{\rm e}},{\,f_{\rm e}}} \right),$$
where  ${\,f_{\rm e}}\left( {\vec p,x,t} \right)$ is the electron distribution function,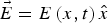 $\vec E = E\left( {x,t} \right)\hat x$ is the longitudinal electric field, $\vec p = {\rm \gamma} {m_{\rm e}}\vec v$ is the electron momentum, ε = γm ec 2 is the particle energy, $\vec v$ is the electron velocity, γ = (1 − v 2/c 2)−1/2 is the relativistic factor, and c is the speed of light. The right-hand side of Eq. (A1) accounts for the electron–ion and electron–electron collision operators, respectively. Their explicit forms are given for instance in Dzhavakhishvili and Tsintsadze (Reference Dzhavakhishvili and Tsintsadze1973). The three lower moments of Eq. (A1), are the well-known conservative equations for the particle, momentum and energy. First, let us introduce the standard definitions for the electron density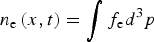 $n_{\rm e}\left( {x,t} \right) = \int f_{\rm e} d^{3}p$, the mean velocity ${\vec V}_{\rm e}\left( {x,t} \right) = \int {\vec v}f_{\rm e} d^{3}p / \int f_{\rm e}$ $d^{3}p$, and the temperature (in energy units) $T_{\rm e}\left( {x,t} \right) = mc^{2}(G -1) - \int \left( {{\rm \varepsilon} - mc^{2}}\right)f_{\rm e} d^{3}p / \int f_{\rm e} d^{3}p$, where G = K 3(z e)/K 2(z e), K n(z e) being the modified Bessel function of nth order and z e = m ec 2/T e, the relativistic parameter. We assume that the mean velocity is along the x-axis and is non-relativistic (V e/c << 1). The relativistic effects are therefore included only in the random part of the velocity, through the temperature T e. Dropping the collisional operators in Eq. (A1), multiplying this equation by 1, $\vec p$ and (ε − mc 2), and integrating over the momentum, we readily obtain the following collisionless relativistic equations
 $$\displaystyle{{\partial {n_{\rm e}}} \over {\partial t}} + \displaystyle{{\partial {n_{\rm e}}{V_{\rm e}}} \over {\partial x}} = 0,$$
 $$\eqalign{& {n_{\rm e}}\displaystyle{d \over {dt}}\left( {{m_e}G{V_{\rm e}}} \right) = - \displaystyle{{\partial {P_{\rm e}}} \over {\partial x}} - \displaystyle{{\partial {\Pi _{xx}}_{\rm e}} \over {\partial x}} + {n_{\rm e}}{q_{\rm e}}E \cr & - \displaystyle{1 \over {{c^2}}}\displaystyle{\partial \over {\partial t}}\left( {{V_{\rm e}}{\Pi _{xx{\rm e}}} + {q_{x{\rm e}}}} \right) - \displaystyle{1 \over {{c^2}}}\displaystyle{\partial \over {\partial x}}\left( {2{V_{\rm e}}{q_{x{\rm e}}}} \right),}$$
 $$\eqalign{& {n_{\rm e}}\displaystyle{d \over {dt}}\left( {{m_{\rm e}}{c^2}G} \right) - {n_{\rm e}}\displaystyle{{d{T_{\rm e}}} \over {dt}} - {T_{\rm e}}\displaystyle{{d{n_{\rm e}}} \over {dt}} = - \displaystyle{{\partial {q_{x{\rm e}}}} \over {\partial x}} \cr & - {\Pi _{xx}}_{\rm e} \displaystyle{{\partial {V_{\rm e}}} \over {\partial x}} - \displaystyle{1 \over {{c^2}}}\displaystyle{\partial \over {\partial t}}\left( {{V_{\rm e}}{q_{x{\rm e}}}} \right) - \displaystyle{{2{V_{\rm e}}{q_{x{\rm e}}}} \over {{c^2}}}\displaystyle{{\partial {V_{\rm e}}} \over {\partial x}} \cr & - \displaystyle{1 \over {{c^2}}}\left( {{\Pi _{xx}}_{\rm e} {V_{\rm e}} + {q_{x{\rm e}}}} \right)\displaystyle{{\partial {V_{\rm e}}} \over {\partial t}},}$$
where (d/dt) = (∂/∂t) + (V e∂/∂x), 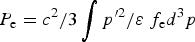 $P_{\rm e} = c^{2}/3 \int p^{\prime 2}/{\rm \varepsilon} \;f_{\rm e}d^{3}p$ is the isotropic particle pressure, $\Pi_{xx{\rm e}} = c^{2} \int 1/{\rm \varepsilon} ( p^{\prime}_{x} p^{\prime}_{x} - p^{\prime 2}/3 ) f_{\rm e}d^{3}p$ is the x–x component of the stress tensor and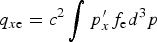 $q_{x{\rm e}} = c^{2} \int p^{\prime}_{x} f_{\rm e} d^{3}p$ is the x-component of the heat flux, where the prime denotes the rest frame of the electron gas. To derive Eqs. (A2)–(A4) we performed the Lorentz transformations p i = S ikp′k + γ/c 2V iε′ and ${\rm \varepsilon} = {\rm \gamma} ( {\rm \varepsilon}^{\prime} + {\vec V}_{\rm e} \cdot {\vec p}^{\prime})$, where $S_{\rm ik} = {\rm \delta}_{\rm ik} + ( {\rm \gamma} - 1)V_{\rm ei} V_{\rm ek}/V_{\rm e}^2$. Equations (A2)–(A4) are collisionless hydrodynamic equations and the transport quantities q xe and Πxxe are closure relations that one has to compute in the collisionless limit as functions of the hydrodynamic variables n e, V e, and T e. The resulting equations, coupled to the Poisson equation are self-consistent set of equations. As far as we know, the collisionless relativistic closure relations q xe and Πxxe are derived only for perturbed plasmas with respect to equilibrium.