


1. Introduction
Health insurers face a fundamental temporal mismatch. The costs of preventive interventions are incurred immediately, while the benefits, such as reduced morbidity, lower claims and reduced mortality accrue over years or decades. This mismatch creates systematic underinvestment in prevention, even when the long-term actuarial case is compelling (Baicker et al., Reference Baicker, Cutler and Song2010). Policyholders exhibit the same temporal bias, discounting future health benefits heavily relative to immediate costs.
If the economics are considered, a single hospitalisation for diabetic ketoacidosis costs £10,000–£20,000 (NHS England, 2023), yet medication adherence rates for statins fall to approximately 50% within one year of initiation (Lemstra et al., Reference Lemstra2012). Cardiovascular disease generates over £9 billion in annual NHS spending. The actuarial question is not whether prevention has value, as the clinical evidence for this is overwhelming, but rather how to quantify and price the behavioural interventions that make prevention actionable.
Behavioural economics identifies predictable cognitive biases including present bias, loss aversion and status quo bias that cause individuals to make choices inconsistent with their long-term interests. These biases can be leveraged to design interventions, often called nudges (Thaler & Sunstein, Reference Thaler and Sunstein2008), that guide individuals toward healthier behaviours without restricting choice.
Despite this evidence, actuaries lack a formal mechanism to translate behavioural effects into pricing-ready claims adjustments. Existing approaches, such as health economics programme evaluations that stop at effect sizes and wellness vendor ROI claims that conflate correlation with causation, do not produce outputs compatible with actuarial pricing, reserving, or capital standards. This paper proposes the Behavioural Adjustment Factor (BAF) to fill that gap. The BAF is a multiplicative construct that decomposes reach, efficacy, clinical translation, and durability into a single adjustment factor suitable for condition-specific claims projections, with uncertainty quantified throughout for Solvency II compatibility.
No prior actuarial framework, to the author’s knowledge, decomposes behavioural intervention impact into this form. Health economics programme evaluations assess cost-effectiveness but do not produce pricing factors. Vendor wellness ROI models typically conflate disease management and lifestyle effects, lack component-level decomposition, and cannot map to Solvency II capital requirements or satisfy Actuarial Profession Standard (APS) X2 documentation requirements. The BAF addresses each of these limitations.
The remainder of this paper develops and applies the BAF framework. Section 2 outlines the research methodology. Section 3 reviews the evidence base. Section 4 develops the BAF framework with a worked example. Section 5 examines condition-specific applications. Section 6 addresses ethical considerations. Section 7 proposes pilot studies. Section 8 discusses implications for actuarial practice. Section 9 addresses limitations. Section 10 concludes. Pricing actuaries will find the BAF formula, worked example, and net pricing impact (Section 4) most immediately applicable; reserving actuaries should attend to the durability modelling and 3-Year Rule; and product designers and regulatory stakeholders will find the ethical framework (Section 6) and pilot roadmap (Section 7) most relevant.
2. Research Methodology
The research employs a structured synthesis-to-framework approach: a systematic review of empirical evidence followed by the construction of an applied actuarial model grounded in that evidence. The evidence base is drawn from peer-reviewed randomised controlled trials (RCTs) published in leading journals, including the New England Journal of Medicine, Health Affairs, and the Journal of the American College of Cardiology. Studies were selected for methodological rigour, sample size (≥200), and relevance to insurer-actionable interventions. All monetary values have been converted to GBP (at USD 1.25 per GBP).
A formal meta-analysis was considered but judged to be impracticable given the heterogeneity of endpoints across studies. The parameter ranges presented are derived from structured qualitative synthesis with explicit inclusion criteria rather than from formal pooling. The multiplicative structure was selected over aggregate approaches because it isolates the contribution of each stage, enabling actuaries to update individual parameters as new evidence emerges without re-estimating the entire model. Alternative approaches considered but discounted include aggregate wellness ROI modelling (rejected for conflating disease and lifestyle management effects) and difference-in-differences designs that are quasi-experimental methods comparing the change in outcomes over time between a treatment group and a control group, netting out pre-existing trends to isolate the causal effect of an intervention (rejected as requiring insurer-held claims data not publicly available for initial calibration). Parameter distributions (Beta, Log-normal, Gamma) are assigned to each component to enable Monte Carlo simulation for uncertainty quantification compatible with Solvency II capital requirements.
3. Literature Review
3.1 Core Behavioural Principles
Traditional economic theory assumes rational utility maximisation. The empirical reality is starkly different as medication non-adherence affects 40–60% of patients with chronic conditions (Osterberg & Blaschke, Reference Osterberg and Blaschke2005). Three cognitive biases are most relevant, drawing on work recognised by the Nobel Memorial Prize in Economic Sciences awarded to Richard Thaler in 2017 (Royal Swedish Academy of Sciences, 2017). These are present bias, loss aversion and status quo bias. Individuals with present bias disproportionately weight immediate costs relative to future benefits. A patient may understand that taking medication reduces heart attack risk in ten years, but the immediate inconvenience looms larger. Interventions providing immediate rewards can counteract this. Under loss aversion losses loom larger than equivalent gains, typically by 2:1 (Kahneman & Tversky, Reference Kahneman and Tversky1979). Deposit contracts, where participants risk their own money, prove more effective than equivalent rewards among those who accept them. Individuals with status quo bias stick with default options. Changing from opt-in to opt-out enrolment can double participation rates without altering the underlying choice set (Madrian & Shea, Reference Madrian and Shea2001).
3.2 Evidence from Randomised Controlled Trials
3.2.1 Financial Incentives for Smoking Cessation
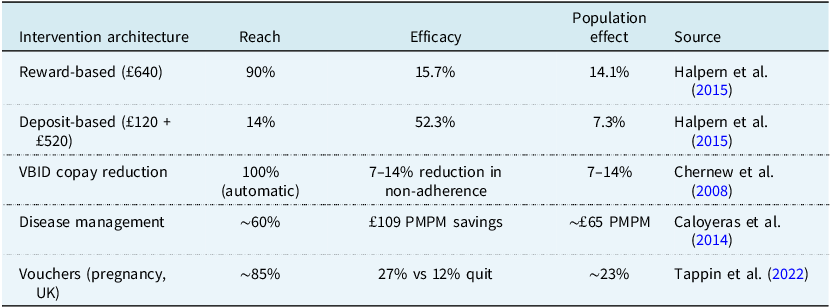
Volpp et al. (Reference Volpp2009) randomised 878 employees to financial incentives totalling £600 versus information alone. Quit rates at 9–12 months were 14.7% versus 5.0% (adjusted odds ratio (OR) 3.16; p < 0.001), implying ROI of approximately 7:1. Halpern et al. (Reference Halpern2015), in a five-arm RCT with 2,538 participants, reveal the reach–efficacy frontier (Table 1).
The reach–efficacy frontier. PMPM denotes per member per month

Table 1 Long description
The table compares different intervention architectures for population effect, reach, and efficacy in health-related studies. It includes five rows and four columns. The columns are labeled Intervention architecture, Reach, Efficacy, and Population effect. The rows detail specific interventions: Reward-based, Deposit-based, VBID copy reduction, Disease management, and Vouchers (pregnancy, UK). Each row provides data on the reach percentage, efficacy percentage or savings, and population effect percentage. Notable trends include the highest reach for VBID copy reduction at 100 percent automatic and the highest efficacy for Deposit-based interventions at 52.3 percent. The population effect varies, with Disease management showing savings of approximately 65 pounds per member per month.
Sources: Halpern et al. (Reference Halpern2015), Chernew et al. (Reference Chernew2008), Caloyeras et al. (Reference Caloyeras2014), Tappin et al. (Reference Tappin2022).
The reach–efficacy frontier presents insurers with a strategic optimisation problem: reward-based programmes maximise population impact; deposit-based programmes maximise per-participant ROI; Value-Based Insurance Design (VBID) copay reductions maximise automatic coverage. Mitchell et al. (Reference Mitchell2023), in a network meta-analysis of financial incentives for physical activity, corroborate the finding that incentive architecture matters more than incentive magnitude. The BAF framework makes this strategic choice explicit rather than resolving it.
UK evidence from Tappin et al. (Reference Tappin2022; CPIT III), randomising over 1,000 pregnant smokers across multiple NHS sites to standard Stop Smoking Services versus services, plus up to £400 in vouchers, contingent on biochemically verified abstinence, provides the strongest direct UK calibration anchor. Quit rates at end of pregnancy were 26.8% versus 12.3% (adjusted OR 2.78, 95% CI 1.94–3.97), with effects persisting at 6–12 months post-partum. National Institute for Health and Care Excellence (NICE)-aligned evaluations show the incentives are highly cost-effective, even allowing for substantial post-partum relapse. Critically for equity (Section 6), the results were broadly consistent across Index of Multiple Deprivation quintiles.
3.2.2 Medication Adherence and Value-based Insurance Design
Chernew et al. (Reference Chernew2008) studied VBID copay reductions of approximately 50% for five chronic medication classes. Adherence increased 7–14% versus controls with identical disease management, demonstrating that copay reductions and disease management are complements, not substitutes. The BETTER-BP trial (Dodson et al., Reference Dodson2025) randomised 400 hypertension patients to mHealth incentive lotteries, achieving twice the adequate adherence rate (71% versus 34%; RR 2.04; 95% CI 1.58–2.63). Notably, this adherence gain did not produce a statistically significant systolic blood pressure reduction (−6.7 versus −5.8 mmHg, p ≈ 0.62), underscoring that efficacy (E, the behavioural change conditional on participation) and clinical translation (C, the claims reduction per unit of behavioural change) must be treated as distinct parameters rather than assumed to move together. Separately, meta-analyses of digital adherence interventions in high-income settings report pooled adherence improvements of approximately 10–23 percentage points (Thakkar et al., Reference Thakkar2016), providing a digital baseline against which lottery-based interventions sit at the upper end of the plausible efficacy range.
3.2.3 The Disease versus Lifestyle Distinction
Caloyeras et al. (Reference Caloyeras2014) reported seven years of PepsiCo data with 22,204 matched pairs. Disease management achieved £109 per member per month (PMPM) savings, 29% hospital admission reduction, and ROI of 3.78:1. Lifestyle management showed no significant savings and ROI of 0.48:1. The “wellness saves money” narrative must be disaggregated in that disease management works but lifestyle management does not reliably translate to claims savings.
In summary, the evidence supports five intervention archetypes with distinct actuarial profiles: (i) disease management for existing chronic conditions (ROI 3.78:1; high confidence); (ii) financial incentives for smoking cessation (ROI 5:1–7:1 per quitter; moderate UK transferability with direct CPIT III evidence); (iii) VBID copay reductions for medication adherence (7–14% reduction in non-adherence; moderate transferability); (iv) preventive screening nudges via defaults and reminders (10–20pp uptake increase; strong UK transferability); and (v) general lifestyle wellness (ROI 0.48:1; no reliable claims savings). This hierarchy structures the BAF confidence intervals and tiered ROI expectations.
3.3 UK Calibration and Generalisability
The evidence base is drawn predominantly from US-based studies. This section clarifies which BAF components can currently be informed by UK evidence. In respect of reach, UK RCTs consistently demonstrate material uptake increases. A cluster RCT of behaviourally informed NHS Health Check invitations increased uptake from 18.2% to 30.0% (Sallis et al., Reference Sallis2016). Hafner et al. (Reference Hafner, Pollard and Van Stolk2018), analysing over 400,000 Vitality participants, found that loss-framed incentives produced a 34% sustained activity increase over 24 months. In respect of efficacy, UK primary care datasets (CPRD, QResearch, OpenSAFELY) provide evidence. Boonmanunt et al. (Reference Boonmanunt2023), synthesising 35 RCTs, found deposit contracts achieved RR 1.63 with post-intervention persistence. In respect of clinical translation there is strong UK evidence via NICE guidance and QOF-linked outcomes. NHS App pilots and opt-out enrolment designs show directionally consistent effects across a range of preventive services (NHS Digital, 2023). In respect of claims impact there is limited public evidence, but Vitality (2024) reports that highly engaged members claim approximately 28% less than less-engaged members. In respect of durability there is limited UK-specific evidence beyond 24 months, and this is the primary gap requiring insurer-led pilots.
3.3.1 Transportability Approach
To translate international RCT estimates into UK PMI priors, trial effect estimates for Reach and Efficacy are reweighted by observable demographics (age band × comorbidity count × postcode-level deprivation tercile) to a reference UK PMI distribution. Where microdata are unavailable, two bounding scenarios are presented, a “younger/healthier” reweight and an “older/more comorbid” reweight, to show plausible directional shifts. Insurers can replace the reference weights with their own member distribution.
4. The BAF Framework
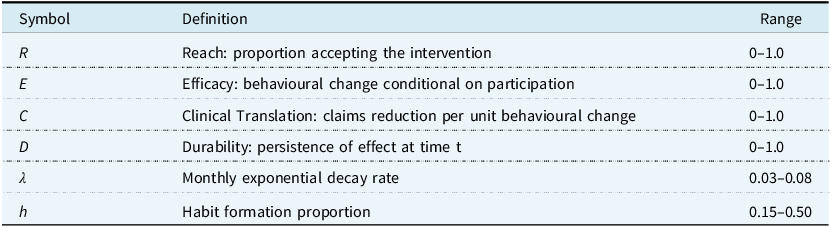
This section develops the BAF framework: defining components, justifying the multiplicative structure, formalising durability, presenting confidence intervals, specifying stochastic distributions, and demonstrating application through a worked hypertension example. Table 2 defines the notation used throughout.
 $${\rm BAF} = 1 - (R \times E \times C \times D)$$
 $${\rm{Adjusted\ Claims}} = {\rm{Baseline\ Claims}} \times {\rm{BAF\;}}$$
BAF framework notation

Table 2 Long description
A table with three columns labeled Symbol, Definition, and Range. The Symbol column lists variables such as R, E, C, D, λ, and h. The Definition column describes each symbol’s meaning, such as Reach, Efficacy, Clinical Translation, Durability, Monthly exponential decay rate, and Habit formation proportion. The Range column provides the possible values for each symbol, such as 0-1.0 for most symbols and specific ranges for λ and h.
In equation (1), each component maps to a distinct evidence domain. Equation (2) shows how the resulting factor is applied to baseline claims. The framework is appropriate for condition-specific projections and wellness-embedded pricing; it is inappropriate for aggregate wellness loading or short-term (<3-year) lifestyle projections.
The Clinical Translation component (C) warrants specific comment, as it represents the most heterogeneous stage. C maps behavioural change to claims reduction through a condition-specific dose–response function. Because the marginal health benefit of additional adherence typically diminishes once a patient approaches clinical targets, the recommended base case adopts a non-linear diminishing-returns specification: C(Δ) = α 0 × (1 − exp(−γ × Δ)), where Δ is the adherence gain in percentage points, α0 is the maximum attainable claims reduction at full adherence, and γ controls the curvature. This form is biologically plausible. For hypertension, the relationship between blood pressure reduction and cardiovascular events follows a log-linear gradient (Lewington et al., Reference Lewington2002). Chen et al. (Reference Chen2022), in a meta-analysis of 402,201 patients, report that a 20pp increase in cardiovascular medication adherence is associated with 8% lower CV events and 30% lower MI, which provides an empirical anchor for α0. The linear approximation C ≈ α × Δ should be retained as an upper-bound sensitivity case. For hypertension (37pp adherence gain), the non-linear form yields C ≈ 0.45–0.55 versus 0.60 under linearity. The functional form of C should vary by condition: for cardiovascular adherence, the diminishing-returns specification is recommended as the base case; for general wellness and lifestyle interventions, the linear form should be retained, since effect sizes are typically small and operate within the approximately linear portion of the dose–response curve; for diabetes (HbA1c-driven), a threshold-saturation model is biologically plausible but calibration requires individual-level claims-linked HbA1c data not yet available in the UK PMI context.
A design choice warrants explanation. The framework maintains four components, even though current evidence often supports calibration of E×C as a single composite. Maintaining the four-component structure ensures that, as claims-linkage data accumulate from insurer-led pilots, actuaries can update E and C independently and can identify where in the causal chain a programme underperforms.
4.1 What Actuaries Uniquely Contribute
The BAF delivers distinctive actuarial value: it translates to pricing and reserving standards (not just programme evaluation); its confidence intervals support Solvency II capital calculations; it integrates with existing IBNR, trend, and large claims processes; it addresses adverse selection from voluntary participation; and it provides the assumption documentation structure required by APS X2 (IFoA, 2016).
4.2 Multiplicative Structure
The BAF represents a sequential causal pipeline. An intervention must be accepted, must change behaviour, must translate clinically, and must persist. Each component is defined conditionally on the previous stage, so the product represents a valid factorisation. If any stage fails, the overall effect is zero. This mirrors standard actuarial decompositions of exposure, frequency, and severity.
Interactions can arise and in practice durability may depend on initial efficacy intensity, and high-reach programmes may exhibit different decay profiles. To address this, Monte Carlo simulation propagates correlated uncertainty via a Gaussian copula, confidence intervals are calibrated from end-to-end evaluations, and the framework targets condition-specific application rather than portfolio-wide aggregation.
4.3 The 3-Year Rule
Claims savings from behavioural interventions in chronic disease typically require over 36 months to materialise. This paper formalises this lag as “The 3-Year Rule,” synthesising findings from Caloyeras et al. (Reference Caloyeras2014), who found cost differences became statistically significant only after Year 3. An important exception is that acute post-event (secondary prevention) adherence interventions may show savings within 12–18 months. Pilots of less than 24 months should use intermediate endpoints. Pricing should not assume immediate impact.
4.4 Durability and Effect Decay
Effect persistence is modelled with a habit formation component structurally analogous to ultimate improvement factors in mortality projection:
 $${\rm{Effect}}\left( {\rm{t}} \right) = {\rm{Effec}}{{\rm{t}}_{{\rm{initial}}}} \times [(1 - h) \times {e^{ - \lambda t}} + h]$$
where λ is the monthly decay rate and h is the habit formation proportion. The Durability component D in the BAF formula is D(t) = (1 − h) × e −λt + h.
The practical impact is substantial. Under base assumptions (λ = 0.05, h = 0.30), effect retention at 24 months is 51%. Under pessimistic assumptions (λ = 0.08, h = 0.15), retention falls to 27%. In plain terms, a nudge that initially reduces cardiovascular claims by £100 PMPM would, under base assumptions, still save £51 PMPM at the two-year mark; but under pessimistic assumptions only £27 PMPM. The entire viability of a behavioural intervention programme can therefore turn on durability parameters for which UK specific evidence is thinnest.
Critically, habit formation varies systematically by intervention mechanism. Deposit/commitment contracts show the highest persistence (h ≈ 0.35–0.50), supported by Boonmanunt et al. (Reference Boonmanunt2023) finding that only deposit contracts maintain statistically significant post-intervention effects. Loss-framed incentives show h ≈ 0.30–0.45, consistent with the findings of Hafner et al. (Reference Hafner, Pollard and Van Stolk2018) that 34% sustained activity increase at 24 months. Reward-based incentives show lower persistence (h ≈ 0.15–0.30), with Halpern et al. (Reference Halpern2015) showing that reward arms have faster decay. Default/opt-out nudges show the highest persistence (h ≈ 0.40–0.55) due to status quo bias. VBID copay reductions (h ≈ 0.20–0.35) are contingent on benefit design persistence. Evidence from the Vitality Habit Index (Vitality and LSE, 2024) suggests that durability may also vary by age cohort, with older (65+) chronic-disease cohorts exhibiting higher effective habit formation than younger adults under similar incentive designs, a finding with direct pricing relevance for PMI. These ranges are inferred from study-level persistence patterns rather than directly estimated; calibrating h for specific mechanisms is a priority for the pilot studies proposed in Section 7.
4.4.1 Durability Stress Scenario
Under h = 0.10 and λ = 0.10 (rapid decay), D (24 months) = 0.18, the hypertension BAF rises to 0.94. This confirms that the programme is not viable under rapid decay. This is not likely but establishes the durability floor below which the business case breaks down.
4.5 BAF Confidence Intervals and Stochastic Modelling
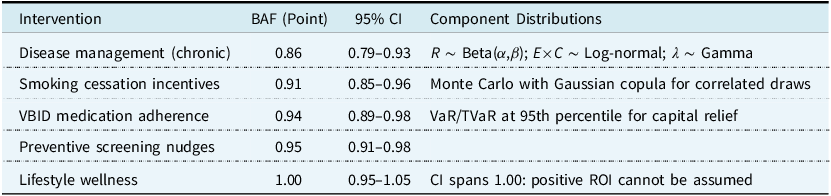
Point estimates overstate certainty. Table 3 presents BAF ranges alongside stochastic distribution specifications for Solvency II capital modelling.
BAF estimates, confidence intervals, and stochastic modelling approach

Table 3 Long description
The table presents data on BAF estimates, confidence intervals, and stochastic modeling approaches for various interventions. It includes five rows and three columns. The columns are labeled Intervention, BAF (Point), 95% CI, and Component Distributions. The interventions listed are Disease management (chronic), Smoking cessation incentives, VBID medication adherence, Preventive screening nudges, and Lifestyle wellness. Each row provides the BAF point estimate, the 95% confidence interval, and the stochastic modeling approach used. Notable trends include the highest BAF estimate for Lifestyle wellness at 1.00 with a confidence interval spanning 0.95 to 1.05, indicating positive ROI cannot be assumed. The lowest BAF estimate is for Disease management (chronic) at 0.86 with a confidence interval of 0.79 to 0.93.
Notes: BAF < 1.00 = claims reduction. Ranges derived from end-to-end programme evaluations. Where end-to-end evidence is unavailable, ranges reflect the author’s actuarial judgement informed by component-level evidence making the synthesis evidence-informed rather than evidence-based in the strict sense. (See Appendix B for evidence strength ratings by parameter.)
For external communication (board presentations, regulatory submissions, policyholder disclosures), actuaries may wish to present a deliberately wider “public conservative” interval that incorporates transferability uncertainty not fully reflected in the evidence-based CI. Table 4 presents both intervals side by side.
Evidence and public conservative confidence intervals by intervention (illustrative)

Table 4 Long description
The table compares evidence and public conservative confidence intervals by intervention, showing four interventions and their respective intervals. The interventions listed are Disease management, Smoking cessation, VBID adherence, and Lifestyle wellness. Each intervention has a BAF point, Evidence CI, Public CI, and a Widening rationale. Disease management has a BAF point of 0.86, Evidence CI of 0.79-0.93, Public CI of 0.75-0.95, and a Widening rationale of Case-mix plus claims translation. Smoking cessation has a BAF point of 0.91, Evidence CI of 0.85-0.96, Public CI of 0.82-0.96, and a Widening rationale of Relapse plus UK prevalence. VBID adherence has a BAF point of 0.94, Evidence CI of 0.89-0.98, Public CI of 0.86-0.98, and a Widening rationale of Formulary plus copay differences. Lifestyle wellness has a BAF point of 1.00, Evidence CI of 0.95-1.05, Public CI of 0.90-1.10, and a Widening rationale of No assumed savings.
Notes: Public conservative CI widens the evidence CI by approximately 3–5 percentage points to accommodate cross-jurisdictional transferability, claims-translation uncertainty, and population mix variation. The lifestyle public CI explicitly spans 1.10, signalling that net costs (not savings) remain plausible. Insurers with access to UK claims data should calibrate their own widening factors.
For the hypertension worked example (Section 4.6), illustrative parameterisations are: R ∼ Beta(81, 9) centring on 0.90; E × C ∼ Lognormal(μ = −0.92, σ = 0.15) centring on 0.40; λ ∼ Gamma(shape = 6.25, scale = 0.008) centring on 0.05. A minimum of 10,000 Monte Carlo iterations is recommended. Sensitivity runs should introduce correlation structures. Recommended scenarios include ρ(E, D) ∈ {−0.3, 0, +0.3, +0.6} and ρ(R, E) ∈ {−0.3, 0, +0.3} imposed via a Gaussian copula. Illustrative simulation results confirm robustness. Under moderate negative ρ(R, E) = −0.3, the 95th-percentile BAF rises by approximately 0.02–0.03 from the independence case.
4.5.1 Illustrative Solvency II Mapping
Suppose a UK PMI insurer writes £100m in health premium with cardiovascular claims comprising 15% (£15m). The hypertension BAF point estimate of 0.82 applied to the targeted subpopulation (20% of CV members enrolled) yields an expected claims saving of £0.54m. The BAF VaR95 of 0.89 gives a conservative reduction of £0.33m. The difference (£0.21m) represents the additional capital buffer required if the intervention underperforms - a statement directly compatible with Solvency II capital requirements. Note that this illustration deliberately uses the optimistic BAF (0.82) to make the capital mechanics visible; for initial pricing, actuaries should substitute the Prudent Default range of 0.91–0.93 per Section 4.6.1.
4.5.2 Net Pricing Impact
To embed the BAF in a pricing formula:
 $${\rm{BA}}{{\rm{F}}_{{\rm{Net}}}} = {\rm{BAF}} - \left( {{\rm{Programme\ Cost}} \div {\rm{Target\ Claims\ Base}}} \right)$$
If BAFNet > 1.0, the programme costs more than the savings it produces, giving a simple go/no-go check.
In practice, programme costs are not deterministic. The costs per-member vary with uptake rates, incentive redemption, and platform scaling, while claims savings are uncertain and lagged. For full integration with the Monte Carlo framework, actuaries should model programme costs as a distribution (e.g., Gamma or Normal, parameterised from vendor contracts and historical programme data) and draw costs jointly with BAF components in each simulation iteration, producing a BAFNet distribution rather than a point estimate. This is particularly important for go/no-go decisions at the pessimistic tail, where cost overruns and BAF underperformance may coincide.
4.6 Worked Example: Hypertension Adherence Nudge
This example demonstrates how a seemingly large behavioural effect becomes a modest claims adjustment once population reach, clinical translation, and effect decay are applied.
Consider a reward-based mHealth lottery (per BETTER-BP; Dodson et al., Reference Dodson2025) for hypertensive PMI members:
Reach: 90% (reward-based acceptance per Halpern et al., Reference Halpern2015).
Efficacy: 37 percentage point adherence increase (71% versus 34% in BETTER-BP).
4.6.1 Clinical Translation
Two bounding scenarios illustrate why the E/C distinction matters. Indeed, the BETTER-BP trial itself demonstrates the distinction in operation. Optimistic (E×C = 0.40): if the 37pp adherence gain translates to clinical outcomes in line with epidemiological dose-response gradients (that is, approximately 0.5 mmHg per 1pp adherence, 18.5 mmHg SBP reduction, and weighted 40% CV claims reduction Lewington et al., Reference Lewington2002; Chen et al., Reference Chen2022) the resulting BAF is 0.82 (18% claims reduction). This scenario should be treated as a stylised upper-bound sensitivity rather than a clinically observed expectation at population scale, and is appropriate only if the underlying adherence gain translates into sustained BP control. Conservative (E×C = 0.15–0.20): this is consistent with the BETTER-BP finding that adherence gains did not produce significant blood pressure reduction in-trial, and the well-documented gap between surrogate endpoint improvements and downstream event reduction in short-horizon trials, yielding BAF = 0.91–0.93, or approximately 7–9% claims reduction at the base durability assumption. This conservative scenario, the Prudent Default, is recommended for initial pricing and reserving until UK claims-linkage data are available. A UK-adjusted mid-case (E×C = 0.30, applying a 25% haircut for prescribing patterns and GP gatekeeping) yields BAF ≈ 0.86 (14% reduction, net savings ∼£20 PMPM). The plausible actuarial range is therefore BAF = 0.82–0.93.
4.6.2 Durability
h = 0.3, λ = 0.05 → 51% effect retention at 24 months.
BAF calculation: Optimistic: BAF = 1 − (0.90 × 0.40 × 0.51) = 0.82; 95% CI 0.71–0.89. Conservative: BAF = 1 − (0.90 × 0.17 × 0.51) = 0.92. For initial pricing and reserving, the conservative scenario is the recommended default.
Interpretation: Baseline cardiovascular claims of £500 PMPM would adjust to £410–£470 PMPM for the intervention cohort, a reduction of £30–£90 PMPM against programme costs of approximately £50 PMPM. Table 5 illustrates durability sensitivity.
Sensitivity of hypertension BAF to durability assumptions (R = 0.90, E×C = 0.40). Net savings = (£500 − Adj PMPM) − £50 programme costs. The rapid decay scenario establishes a quantitative floor: the BAF signals ‘do not proceed’ unless h ≥ 0.15

Table 5 Long description
The table presents four scenarios for hypertension benefit-adjusted factor (BAF) sensitivity to durability assumptions. It includes columns for scenario names, h values, lambda values, D values at 24 months, BAF values, and net savings. The scenarios are Pessimistic, Base case, Optimistic, and Rapid decay. Each row provides specific values for these parameters. The Pessimistic scenario shows a net loss of 1 Pounds per member per month (PMPM), while the Base case and Optimistic scenarios show net savings of 42 Pounds PMPM and 84 Pounds PMPM, respectively. The Rapid decay scenario shows a net loss of 18 Pounds PMPM. The table highlights how different assumptions about durability affect the net savings and BAF values.
5. Applications
5.1 Preventive Screening
Increasing colorectal screening from 45% to 57% shifts detection toward earlier stages. Stage I treatment costs £15,000–£20,000 versus £100,000+ for Stage IV (NICE, 2020), giving an indicative BAF of 0.92–0.95 for colorectal claims over 5 years. Annual diabetic retinal exams detect retinopathy before vision loss (NHS Diabetic Eye Screening Programme, 2023), with early treatment costing £1,000–£2,000 versus £20,000+ for advanced disease.
5.2 Chronic Disease Management
According to Caloyeras et al. (Reference Caloyeras2014), disease management generates ROI of 3.78:1. The UK Prospective Diabetes Study Group (1998) demonstrated that intensive blood-glucose control reduced diabetes-related complications by 12% and microvascular endpoints by 25%, establishing the causal pathway from adherence to claims reduction. The 29% hospital admission reduction is the single most powerful claims impact figure in the evidence base, affecting both frequency and severity development in reserving.
5.3 Mental Health (Emerging)
Treatment adherence rates for depression and anxiety are notably low (40–50%). Recent meta-analyses suggest mHealth nudges may yield 5–10pp adherence improvements, although the evidence base is less mature (Goldberg et al., Reference Goldberg2022).
5.4 Directional UK PMI Categories
Cardiovascular claims are the highest-confidence BAF application (high per-event severity, strong adherence-to-event evidence). Diabetes-related claims span routine management and complications, with the 29% admission reduction providing the clearest frequency signal. Musculoskeletal claims present a more complex application with wider uncertainty bands pending condition-specific data.
6. Ethical Considerations
Behavioural interventions raise ethical questions that actuaries must address in product governance documentation, framed through the IFoA’s public interest duty and the FCA’s Consumer Duty (PS22/9, effective July 2023).
6.1 Autonomy and Transparency
Nudges preserve freedom of choice, but three principles are proposed: transparency (members know interventions are deployed); genuine optionality (easy opt-out); and alignment of interests.
6.2 Actuarial Fairness and Selection Risk
If a pricing model already uses “disease management participation” as a rating factor, applying a BAF would double-count savings. Actuaries must document which effects are captured in underwriting versus BAF adjustments. For separating causal impact from self-selection, three approaches are recommended: intention-to-treat estimates from randomised encouragement trials (highest rigour, consistent with the evidence hierarchy in NICE, 2013); propensity-score stratification matching on pre-intervention claims trajectories; or applying the BAF at its 95th-percentile worst-case value as a conservative default.
6.3 Equity and Differential Response
Tudor Hart’s (Reference Tudor Hart1971) inverse care law, that the availability of good medical care tends to vary inversely with the need for it, has an uncomfortable commercial analogue. Behavioural nudge programmes are most easily adopted by members who least need them: higher-income, higher-literacy, lower-comorbidity individuals with the disposable income to commit deposits and the cognitive bandwidth to respond to incentive framing. The members with the highest chronic disease burden and the greatest potential for claims reduction are, on average, those least likely to participate.
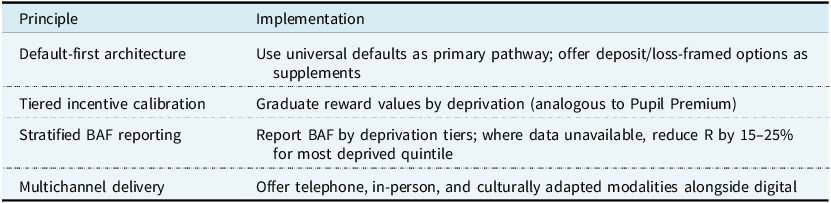
Halpern et al. (Reference Halpern2015) found that deposit-based nudges, the highest-efficacy mechanism, exhibited approximately 20% lower uptake in lower socioeconomic groups. Michie et al. (Reference Michie2009) found financial incentive programmes disproportionately attracted participants with greater health literacy. Hart’s original concern was supply-side distribution of healthcare services; the parallel here operates on the demand side, through differential uptake of voluntary programmes. The underlying equity concern is the same: those with the greatest need benefit least, even though the mechanism differs. Default-based mechanisms tell a different story. Madrian and Shea (Reference Madrian and Shea2001) demonstrated that automatic enrolment nearly eliminated participation gaps across income quintiles. Without deliberate design safeguards, BAF-based pricing produces a cross-subsidy flowing in the wrong direction. Non-participants bear a proportionately larger share of costs, and non-participation correlates with deprivation. The FCA’s Consumer Duty (PS22/9) requires firms to deliver good outcomes for all retail customers. A programme that systematically excludes lower-income members raises questions across the Duty’s price-and-value and products-and-services outcomes. Table 6 proposes design principles for equitable implementation
Design principles for equitable BAF implementation

Table 6 Long description
The table presents design principles for equitable BAF implementation, structured with two main columns: Principle and Implementation. The table has four rows, each detailing a specific principle and its corresponding implementation strategy. The principles include default-first architecture, tiered incentive calibration, stratified BAF reporting, and multichannel delivery. Under default-first architecture, the implementation suggests using universal defaults as the primary pathway and offering deposit or loss-framed options as supplements. Tiered incentive calibration involves graduating reward values by deprivation, analogous to the Pupil Premium. Stratified BAF reporting recommends reporting BAF by deprivation tiers, reducing R by 15-25% for the most deprived quintile where data is unavailable. Multichannel delivery involves offering telephone, in-person, and culturally adapted modalities alongside digital options. The table aims to address equity concerns in BAF implementation, ensuring good outcomes for all retail customers as required by the FCAs Consumer Duty.
Actuaries should track participation and outcomes by deprivation quintile annually. Where the participation ratio (bottom quintile : top quintile) falls below 0.60, a threshold at which illustrative pricing simulations indicate the cross-subsidy from non-participants exceeds approximately 5% of baseline premium, triggering material fairness concerns under Consumer Duty, the pricing actuary should flag this in the Actuarial Function Report and recommend design modifications. An amber threshold at 0.60–0.75 should trigger targeted outreach and channel diversification. A red threshold below 0.60 should trigger suspension of differential pricing pending design review. To operationalise this monitoring beyond the participation ratio, actuaries should also track early attrition rates by deprivation quintile as a leading indicator, since differential attrition can erode equity even where initial uptake is balanced; and interim behavioural endpoints (adherence rates, screening completion) by quintile, which are observable within 6–12 months and do not require waiting for the 3-Year Rule claims horizon to detect inequitable programme effects. This is consistent with the IFoA’s Ethical Charter commitment to consider the public interest implications of actuarial work.
A deeper tension remains unresolved. If the most effective interventions (deposit contracts, loss-framed incentives) systematically exclude lower-SES members, and if the most equitable interventions (defaults, VBID) have lower per-participant efficacy, the actuary faces a genuine trade-off between maximising population health impact and maximising ROI. Whether the actuary’s duty under the FCA’s Consumer Duty and the IFoA’s public interest obligation requires prioritising equity over marginal efficiency gains is a question that this paper notes rather than resolves. It is an appropriate subject for future IFoA professional guidance on behavioural intervention pricing.
7. Pilot Study Design
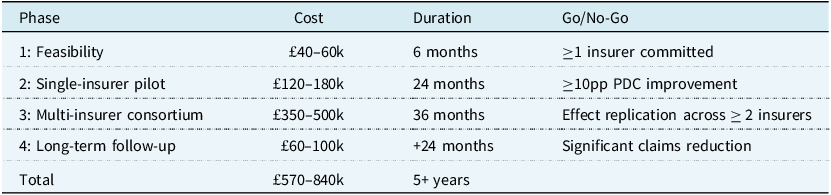
The framework’s principal calibration gaps are best closed through a phased, milestone-based research programme with explicit go/no-go criteria. Table 7 summarises the proposed programme and its total indicative investment of £570,000–£840,000. The target population comprises members with chronic conditions and proportion of days covered (PDC) below 80%. A minimum of approximately 1,600 members per study arm (treatment and control, i.e., approximately 3,200 total) is required to detect a 5pp improvement with 80% power (two-proportion z-test, baseline p 0 = 0.50, α = 0.05); see Appendix A for the underlying calculation. Duration is 18 months active plus 6-month follow-up; per the 3-Year Rule, full claims impact requires longer observation. The control group receives identical disease management without behavioural enhancement.
Phased research programme with success criteria. Each phase delivers specific calibration outputs: Phase 2 calibrates R and E; Phase 3 provides sample sizes for C; Phase 4 generates longitudinal evidence for D. The primary objective of the £570k–£840k investment is to replace international proxies with UK-calibrated α parameters – the principal gap identified in Section 9

Table 7 Long description
A table outlines a phased research program with success criteria. The table has four rows and five columns, including headers for Phase, Cost, Duration, and Go/No-Go criteria. Phase 1 focuses on feasibility with a cost of 40 to 60 thousand pounds and a duration of 6 months, requiring one insurer committed. Phase 2 involves a single-insurer pilot with a cost of 120 to 180 thousand pounds over 24 months, aiming for a 10 percentage point improvement in PDC. Phase 3 is a multi-insurer consortium with a cost of 350 to 500 thousand pounds over 36 months, focusing on effect replication across two insurers. Phase 4 includes long-term follow-up with a cost of 60 to 100 thousand pounds over 24 months, targeting significant claims reduction. The total investment ranges from 570 to 840 thousand pounds over 5 years.
The recommended primary design is a randomised encouragement trial with intention-to-treat (ITT) analysis. All eligible members are randomised to receive or not receive an invitation to participate, and outcomes are analysed by randomisation assignment regardless of actual uptake. This yields unbiased estimates of the average effect of being offered the programme (the policy-relevant parameter for pricing). As robustness checks, actuaries should apply difference-in-differences (DiD) with propensity-score-matched controls using pre-intervention claims trajectories, and instrumental variable (IV) estimation using randomised encouragement as the instrument to estimate the local average treatment effect among compliers.
The UK health system has already delivered large-scale, multi-site behavioural trials closely analogous to the pilots proposed here. CPIT III randomised over 1,000 pregnant smokers across multiple NHS trusts. London’s cervical screening programme sent GP-endorsed SMS to hundreds of thousands of women (NHS England, 2023b). Vitality’s partnership with RAND enrolled over 400,000 members across three countries. These precedents confirm the logistical requirements are challenging but within demonstrated capability.
7.1 Key Operational Considerations
Effective BAF calibration requires linking behavioural data with claims outcomes requiring insurer-integrated platforms or data sharing agreements compliant with UK GDPR. Deposit-based programmes require members to commit personal funds, which may face regulatory and reputational challenges. Reward-based and VBID programmes face lower consent barriers. mHealth interventions require digital platforms capable of real-time data capture and integration with insurer administrative systems. If BAF-adjusted pricing leads to differential premiums based on programme participation, insurers should ensure compliance with equalities legislation and early regulatory engagement is recommended.
8. Implications for Actuarial Practice
Adoption of the BAF would shift actuarial practice in several respects. Pricing actuaries would move from static trend assumptions to intervention-conditional projections. Reserving actuaries would model behavioural decay in IBNR, with the 29% admission reduction affecting frequency development. Programme evaluators would assess ROI at condition level, with the disease/lifestyle distinction becoming standard. Product designers would embed nudge architecture into benefit design, with VBID structures and incentive timing becoming actuarial parameters. Stop-loss actuaries would recognise that the BAF affects large claim probability disproportionately, since the interventions target precisely the high-cost chronic conditions that drive excess loss development. Equally important, the BAF provides a rigorous basis for declining vendor proposals. A programme producing a BAF indistinguishable from 1.00 can be rejected on transparent, documented grounds rather than subjective scepticism.
Tiered ROI expectations should guide investment: disease management at 3.5:1–4.0:1 (high confidence), targeted behavioural incentives at 5.0:1–7.5:1 (requiring proper design), and general lifestyle wellness at 0.5:1–1.5:1 (should not be assumed positive).
Where data permit, actuaries should estimate BAF parameters stratified by age band, comorbidity count, and socioeconomic segment, rather than applying a single portfolio-wide adjustment. As BAF-adjusted projections accumulate experience, insurers should implement ex-post validation by comparing predicted BAF-adjusted claims to realised claims on a quarterly or annual basis, with persistent deviations triggering parameter re-estimation through Bayesian updating of the Monte Carlo priors.
The BAF supports dynamic reserving under Solvency II by incorporating behavioural uncertainty into capital requirements. For UK PMI, where NHS interactions influence private claims (e.g., delayed NHS care driving PMI utilisation), the BAF can model nudge effects on waiting list avoidance, reducing claims volatility. UK calibration is primarily constrained by claims translation rather than behavioural response reinforcing the case for insurer-led pilots rather than undermining the framework itself.
9. Limitations and Future Research
The BAF is presented as a structuring tool for actuarial judgement, not a fully calibrated model. There is some efficacy calibration risk. RCT parameters reflect controlled conditions, real-world deployment may yield lower effect sizes due to implementation variability and differences in participant motivation. As a practical rule, actuaries should haircut RCT effect sizes by 20–40% when using them as pricing priors; say, 20% for automated mHealth platforms with high fidelity and 40% for complex multi-component programmes. The wellness industry has a documented tendency to overstate ROI through historical controls, regression to the mean, and conflation of correlation with causation (Mattke et al., Reference Mattke2013). The BAF counters this by requiring RCT-grade evidence and component-level decomposition. Most of the current evidence originates from US employer-sponsored insurance, where benefit design and cost structures differ materially from UK PMI. The framework is structurally valid but parametrically provisional until UK data are incorporated. Participants in behavioural RCTs are typically younger, more educated, and more health-literate than the general insured population and subgroup analyses reinforce the need for stratified BAF application. The multiplicative structure may understate tail risk where multiple components deteriorate simultaneously. If the interaction between efficacy and durability is sub-multiplicative, the framework would overstate claims-reduction potential. This model risk should be disclosed under APS X2 requirements, with explicit statement of the conditions under which the multiplicative assumption is expected to hold. Table 8 summarises the US-to-UK parameter adjustment direction.
Illustrative US-to-UK parameter adjustment. Values are indicative pending UK pilot calibration (see Section 9)

Table 8 Long description
The table presents data on detectable effect, sample size per arm, and feasibility for different endpoints in a study. It includes four rows and four columns. The columns are labeled Endpoint, Detectable effect, n per arm, and Feasibility. The rows detail specific endpoints: Adherence with a detectable effect of 5 percentage points (0.50 to 0.55) and a sample size of 1,565 per arm, marked as feasible; Adherence with a detectable effect of 10 percentage points (0.50 to 0.60) and a sample size of 388 per arm, also marked as feasible; Claims (PMPM) with a 5 percent (approximately 20 pounds) detectable effect and a sample size of 2,510 per arm, marked as marginal; and Claims (PMPM) with a 7 percent (approximately 28 pounds) detectable effect and a sample size of 1,280 per arm, marked as feasible.
Research priorities include: UK claims-translation calibration through insurer-led pilots (the principal gap is the α parameter mapping behavioural change to PMI claims); multi-insurer consortia modelled on the US Health Care Cost Institute or ABI data-sharing frameworks for adequately powered claims-level studies; BAF extensions for mental health, musculoskeletal conditions, and high-cost specialty therapies (GLP-1 receptor agonists, PCSK9 inhibitors); integration with value-based care contracts as UK PMI moves toward outcomes-linked reimbursement; and development of IFoA professional guidance establishing documentation standards for BAFs in pricing and reserving.
10. Conclusions
This paper has introduced the BAF, to the best of current knowledge, the first actuarial framework to decompose behavioural intervention impact into evidence-grounded, Solvency II-compatible components. The BAF is structurally sound and ready for piloting with conservative UK priors. It should be understood as a structuring device for disciplined evidence generation and actuarial judgement rather than a fully calibrated pricing tool.
The evidence is compelling but nuanced. Disease management generates robust returns (ROI 3.78:1, 29% hospital admission reduction). Lifestyle management does not reliably produce savings and the BAF’s value lies equally in providing a disciplined mechanism for declining investment in programmes that do not meet the evidentiary threshold. The reach–efficacy frontier creates strategic choices. The 3-Year Rule warns against premature evaluation. The worked example demonstrates that a large behavioural effect (37pp adherence gain) produces a modest claims adjustment (BAF 0.82–0.93) once reach, clinical translation, and decay are applied.
The IFoA, insurers, and the actuarial profession are called upon to:
-
• Adopt the BAF framework for evaluating behavioural programmes, replacing aggregate wellness ROI claims with condition-specific, evidence-based adjustments;
-
• Fund the milestone-based pilot beginning with a £40–60k feasibility study, with durability parameters as the highest-priority calibration target; and
-
• Develop professional guidance on integrating BAFs into pricing and reserving standards.
These conclusions carry important caveats. The evidence base is predominantly US-sourced, the durability parameters carry material uncertainty, and selection effects in voluntary programmes remain difficult to isolate from causal impact. The framework should be treated as structurally sound but parametrically provisional until UK insurer-led pilots provide calibration data.
The broader vision is of actuaries evolving from passive pricers of risk to active shapers of health outcomes designing interventions, quantifying impact, and embedding behavioural architecture into products. The potential for insurers, for members, and for population health is substantial. The question is whether the profession will invest in generating that evidence and embrace the opportunity to shape risk, and not to merely measure it.
Acknowledgements
The author is grateful to the Institute and Faculty of Actuaries for the opportunity to develop this work through The Big Pitch programme. Any errors remain the author’s own.
Appendix A. Statistical Power Calculations
Table A1 reports the minimum sample size per arm required to detect specified effect sizes at α = 0.05 (two-sided) and 80% power. Modest behavioural endpoints can be detected within a single insurer; claims-level effects require multi-insurer consortia.
Minimum sample size per arm (α = 0.05 two-sided, power = 0.80). Claims detection at Δ < 7% requires multi-insurer consortia

Table A1 Long description
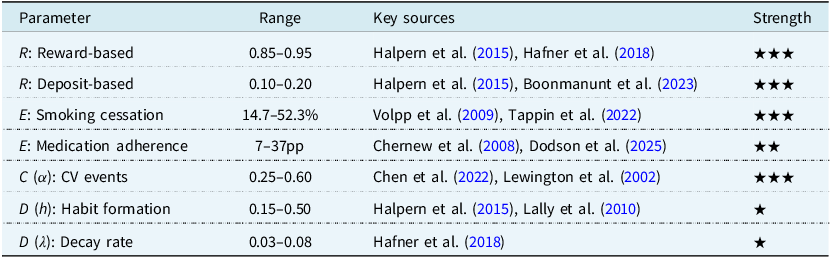
The table presents the minimum sample size per arm required to detect specified effect sizes at a significance level of 0.05 (two-sided) and 80% power. It includes parameters such as reward-based, deposit-based, smoking cessation, medication adherence, cardiovascular events, habit formation, and decay rate. The table has five columns: Parameter, Range, Key sources, Strength, and notable trends. For example, reward-based parameters range from 0.85 to 0.95, while deposit-based parameters range from 0.10 to 0.20. Smoking cessation shows a range of 14.7 to 52.3 percent, and medication adherence ranges from 7 to 37 parts per thousand. Cardiovascular events have a range of 0.25 to 0.60, habit formation ranges from 0.15 to 0.50, and decay rate ranges from 0.03 to 0.08. The strength of the parameters is indicated by star ratings.
Appendix B. Evidence Strength Ratings
Table B1 sets out the evidence-strength rating system used to grade each BAF parameter throughout this paper. Insurers should prioritise primary data collection for parameters rated ★ (Limited), as these carry the greatest model risk under the BAF.
Evidence strength: ★★★ = Strong (multiple RCTs, consistent); ★★ = Moderate; ★ = Limited. Insurers should prioritise generating data for ★-rated parameters

Table B1 Long description
The table titled ‘Table B1’ outlines the evidence-strength rating system used to grade each BAF parameter. It includes four phases: Feasibility, Single-insurer pilot, Multi-insurer consortium, and Long-term follow-up. Each phase lists the associated cost, duration, and go/no-go criteria. The costs range from 40000 to 500000 British pounds, with durations from 6 months to over 5 years. The go/no-go criteria include commitments from insurers, percentage improvements, effect replication, and significant claims reduction. The total cost ranges from 570000 to 840000 British pounds over 5 or more years. The table emphasizes prioritizing primary data collection for parameters rated as Limited, as these carry the greatest model risk under the BAF.
Appendix C. UK Evidence at a Glance
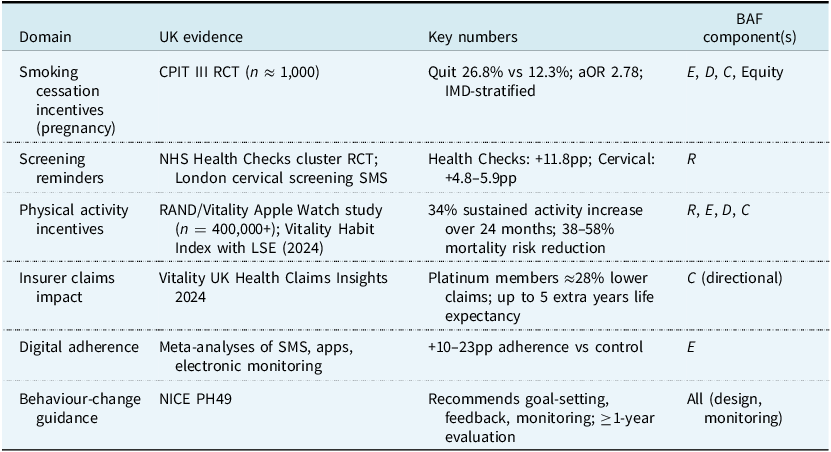
Table C1 collates the UK-specific evidence informing each BAF component, noting study design, headline finding and applicability to PMI populations. Where UK evidence is sparse, the table flags the dependence on US transportability adjustments described in Section 3.3.
UK evidence at a glance

Table C1 Long description
The table presents UK evidence for different health interventions across six domains: smoking cessation incentives during pregnancy, screening reminders, physical activity incentives, insurer claims impact, digital adherence, and behavior-change guidance. It includes details on study designs, key findings, and the applicability of each intervention to PMI populations. The table highlights specific studies such as the CPIT III RCT for smoking cessation, NHS Health Checks for screening reminders, and RAND/Vitality studies for physical activity incentives. Key numbers and BAF components are also listed, providing a comprehensive overview of the evidence base for each intervention.





 Open access

