




Introduction
In ecology, a major challenge in recent decades has been understanding changes in community composition and global biodiversity (Williams et al. Reference Williams, Hobday, Falconi, Hero, Holbrook and Capon2020, Ricciardi et al. Reference Ricciardi, Iacarella, Aldridge, Blackburn, Carlton and Catford2021). However, transporting research teams and equipment to remote or impacted areas can present substantial logistical and financial barriers, limiting access to these systems. To reduce these constraints and minimize disturbance, researchers increasingly prioritize novel and accessible data sources for studying community composition, abundance and biodiversity that reduce the costs, organismal stress and carbon emissions associated with travel.
The use of film footage originally collected for non-scientific purposes highlights the potential of unconventional data sources for describing an animal community and ecological patterns. For example, remotely operated vehicle footage originally collected for oil and gas infrastructure inspections has been used to characterize benthic community composition (McLean et al. Reference McLean, Partridge, Bond, Birt, Bornt and Langlois2017, Thomson et al. Reference Thomson, Fowler, Davis, Pattiaratchi and Booth2018), or footage of a bicycle race has been to assess long-term trends in tree leafing and flowering phenology (De Frenne et al. Reference De Frenne, Van Langenhove, Van Driessche, Bertrand, Verheyen and Vangansbeke2018). Exploring these unconventional data sources is increasingly important for expanding the spatial and temporal scope of ecological research, particularly in systems or time periods for which traditional data are limited or unavailable. These data sources may reduce researcher-associated carbon emissions, improve access to remote sites and provide novel opportunities for ecological analysis.
Television shows and motion pictures have been used previously as a history research tool (Hughes-Warrington Reference Hughes-Warrington2007, Al-Surmi Reference Al-Surmi2012), but there has been little use of these resources in ecological research. Traditional animal and nature documentaries common on internet streaming services and television networks can provide insights into biomes, climates, natural processes and organisms, but they also have drawbacks (Jones et al. Reference Jones, Thomas-Walters, Rust and Veríssimo2019, Aitchison et al. Reference Aitchison, Aitchison and Devas2021). The footage of organisms or ecosystems may not be sufficiently representative of the conditions involved, and producers, directors and editors often highlight particular organisms of special interests, characteristics or behaviours (Howlett et al. Reference Howlett, Lee, Jaffé and Lewis2023). These programmatic decisions balance education, biodiversity and audience entertainment, again leading to an interpretation that may not be reflective of the ecosystem or the organism’s behaviour (Woodford Reference Woodford2003, Snaddon et al. Reference Snaddon, Turner and Foster2008, Schlegel & Rupf Reference Schlegel and Rupf2010, Jones et al. Reference Jones, Thomas-Walters, Rust and Veríssimo2019, Howlett et al. Reference Howlett, Lee, Jaffé and Lewis2023). Additionally, these programmes are rarely filmed in the same location multiple times, which limits the ability to establish a time series to assess changes over time. An ideal television programme for ecological research would limit selection bias of target organisms and be filmed at the same location over multiple years. Even if television programmes fulfil the previously mentioned requirements, there are potential limitations in analyses and challenges in how these programmes might be used to advance ecological understanding. These challenges highlight the need for alternative and indirect data sources that were not originally intended for ecological research but may nonetheless provide useful biological information. Such inadvertent data sources may expand access to remote systems, reduce researcher-associated impacts and offer new opportunities for ecological inference.
Through historical ecology and biodiversity lenses, non-documentary television (NDTV) footage represents a potentially valuable but underexplored data source. Through this investigative study, we evaluated the utility of NDTV footage recorded in natural settings as a tool for remotely characterizing community composition and biodiversity. Our objectives were to (1) provide a general summary of the animals observed within the selected NDTV time series and (2) identify limitations of and key considerations for using these data in ecological and conservation research.
Accomplishing these objectives highlights both the potential and issues of utilizing NDTV footage as a tool for studying community composition and biodiversity from ecological and conservation perspectives. To our knowledge, this represents one of the first systematic evaluations of NDTV as a quantitative ecological data source. This study provides a framework for future research using media-derived datasets, offers a general summary of the organisms observed in this medium and demonstrates how such approaches can expand access to ecological information while requiring that careful attention is given to inherent biases and limitations. We hope that this work not only serves as a starting guide for projects evaluating NDTV or similar media but also inspires other ecologists to be creative in exploring unconventional sources of data to address ecological questions.
Methods
To evaluate the potential limitations and considerations of using NDTV programmes in ecological research, we examined the CBS TV show Survivor. Survivor has been described as ‘the greatest social experiment on television’ and has been previously used in sociological and psychological research (Wilson et al. Reference Wilson, Robinson and Callister2012, Hanson Reference Hanson2017, Karlan Reference Karlan2017), but its ecological dimensions have not been previously analysed. Seasons 33–46 were filmed consecutively in the Mamanuca Islands (Fiji; Appendix S3, Fig. S1), a region characterized by high biodiversity (Kinch et al. Reference Kinch, Anderson, Richards, Talouli, Vieux, Peteru and Suaesi2010, Woinarski Reference Woinarski2010, Keppel et al. Reference Keppel, Morrison, Meyer and Boehmer2014) and identified as a priority for conservation research due to the vulnerability of insular systems and endemic species to climate change (Olson et al. Reference Olson, Farley, Patrick, Watling, Tuiwawa and Masibalavu2010, SPREP 2012, Jupiter et al. Reference Jupiter, Mangubhai and Kingsford2014, Keppel et al. Reference Keppel, Morrison, Meyer and Boehmer2014). Filming occurred from April 2016 through June 2023, excluding 2020 due to the COVID-19 pandemic, providing a 7-year temporal extent of community composition and biodiversity data.
While the show’s storylines and competitions may be presented in chronological order, animal footage is unlikely to follow filming chronology. Instead, NDTV wildlife footage used in scene transitions is probably selected during post-production from a repository of B-roll captured before, during and after filming. Excluding 2020, two NDTV seasons were released annually from 2016 to 2023, filmed sequentially over c. 2 months each (April/May and June/July). Because footage was shared between these back-to-back seasons (C Crowder, personal observation 2025), data were pooled by calendar year, with footage generally collected between April through July treated as a single sampling event spanning c. 4 months. The geographical origin of wildlife footage was verified using visible landmarks, production features unique to the filming location and regional species distributions. We additionally assessed whether wildlife footage was reused across years and found no evidence of interannual reuse. Additional details are available in Appendix S1.
Data collection and classifications
Animals appearing in the show were first identified by broad taxonomic categories: amphibians, reptiles, birds, fishes, invertebrates or mammals. Individuals were then classified into one of 30 taxonomic sub-categories, including frogs, toads, birds of prey, foraging or shore birds, rays, reef fishes, sharks, lobsters, ants, bees/wasps, beetles, butterflies/moths, flies/gnats/dragonflies, jellyfish, octopus/cuttlefish, sea stars, crabs, shellfish/barnacles, spiders, worms, bats, dolphins, goats, rats, whales, lizards, snakes and turtles. An ‘other bugs’ sub-category was used for insects that did not fit into the listed groups, and an ‘unknown flying’ sub-category was used for invertebrates observed flying but not identifiable to a specific group. When distance, lighting or image quality prevented identification to these levels, individuals were classified to the lowest taxonomic level possible, with unidentifiable organisms placed into an ‘unknown’ sub-category. For footage containing large numbers of individuals, abundance was estimated using proportional counts. For example, if c. 50% of individuals in a shot could be clearly counted, the total abundance was estimated by doubling the counted subset.
Animals were identified to the lowest possible taxonomic level, with species-level identification as the primary goal. Published literature as well as the International Union for Conservation of Nature (IUCN) Red List of Threatened Species website were reviewed for any designation as an invasive species or an IUCN Red List classification (International Union for Conservation of Nature 2024). A full list of resources referenced in the identification process as well as additional details of identification procedures are available in the Supplementary Material (Appendix S1).
Animal appearances were also classified based on their relationship to the cast and the format of the show. Screen classifications included interactions with the cast (non-hunting or eating), being hunted or eaten by cast, scene or frame transitions and background appearances in which animals were present but not the focal subject. Theme song montages were included once per season when present, although not all seasons featured these montages. For each appearance, timestamps, a note if the footage had been displayed previously and display duration (rounded to the nearest second) were recorded. To ensure relevance to the filming location, only animals observed alive on screen were included in the analyses. Animals provided to the cast were excluded due to uncertainty regarding their origin, and no animals were counted during cast transportation to locations outside the primary filming area. Additionally, reunion and recap episodes were excluded, as they primarily consist of reused footage or studio-based discussions rather than on-location filming.
Diversity metrics and species accumulation
Several metrics were used to describe community composition. Community composition was described by summarizing the number of individuals per category, sub-category and taxon for each calendar year. Screen time for each category and sub-category was also recorded and partitioned by screen classification type.
The total amount of time that animal footage used throughout each year was measured. Since episode and season length varied by season and episode to episode, the percentage of time an animal was on the screen and the mean number of animals per hour of screen time was calculated using the total run time of each calendar year. Using the R package ‘vegan’, total abundance, species richness, as well as Shannon and Simpson diversity indices were calculated for each calendar year (Oksanen et al. Reference Oksanen, Blanchet, Kindt, Legendre, Minchin and O’Hara2022). We further parsed out data by all individuals observed, only individuals identified to the family, genus or species level, only terrestrial animals and only marine animals. Linear models were used to assess temporal trends, given the limited resolution of the dataset.
A taxa accumulation curve was developed utilizing occurrence data with individuals that could be identified to the family, genus or species level. This provides an estimate of the theoretical maximum number of taxa expected based on trends of species accumulation over the course of the 7 years considered within this study. The theoretical maximum number of taxa was calculated to be within 1% of the estimated asymptotic value using the R package ‘vegan’ (Oksanen et al. Reference Oksanen, Blanchet, Kindt, Legendre, Minchin and O’Hara2022).
Results
Appearance and screen time trends
Approximately 165 h and 14 min of footage were reviewed across 180 episodes of Survivor from Seasons 33 to 46, filmed between 2016 and 2023. The run times of seasons grouped by filming year varied but generally were similar (Appendix S3, Table S1). Throughout this time, 49 862 individuals were counted across 4017 s of cumulative observation time, where overlapping observations of multiple individuals from differing taxa were summed (Appendix S3, Table S1). When instead considering unique-presence intervals, defined as periods when at least one individual was visible on screen, regardless of any time overlap among differing taxa, the total duration of animal observation was 3956 s.
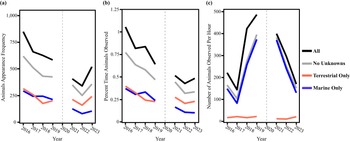
The frequency with which animal footage appeared in the show varied each year, with a total of 1685 instances in which animals were displayed. There was a mean of 114.28 (standard deviation (SD) = ±21.34) instances of animal footage per year across the 7 years considered. However, there was a steady decline of animal footage across all data groupings until 2023, when there was an increase in terrestrial animals observed in the footage (Fig. 1). Incorporating show run time, there was a similar relative decline in the percentage of time that animals were on screen over time (Fig. 1). The count of animals per hour was highest in calendar years 2018–2021 (Fig. 1); however, this observation was driven primarily by marine animals. This suggests that less animal footage was being used within the shows, but when animal footage was used, there were more individuals within that footage. This is best observed in seasons filmed in 2019, for which the percentage of animals on screen and total animal screen time were lower but the number of animals per hour was high (Fig. 1).
(a) The frequencies with which animals appeared on the screen for both seasons of Survivor filmed within the same year. This count is of appearances, not the abundances of the animals on the screen. (b) The percentage of screen time during which animals were observed for both seasons of Survivor in the same year. (c) The mean number of animals observed per 1 h of screen time. Please note the omission of 2020 (no series of Survivor filmed due to the COVID-19 pandemic) in the panels so as not to obscure observation of the trends.

Figure 1. Long description
Panel A: A line graph shows the frequencies with which animals appeared on the screen for both seasons of Survivor filmed within the same year. The x-axis represents the year from 2016 to 2023, and the y-axis represents the animal appearance frequency. The graph includes multiple lines representing different categories: All, No Unknowns, Terrestrial Only, and Marine Only. The trends show a general decline in animal appearances over the years. Panel B: A line graph illustrates the percentage of screen time during which animals were observed for both seasons of Survivor in the same year. The x-axis represents the year from 2016 to 2023, and the y-axis represents the percent time animals observed. Similar to Panel A, multiple lines represent different categories: All, No Unknowns, Terrestrial Only, and Marine Only. The trends indicate a decrease in the percentage of screen time with observed animals over the years. Panel C: A line graph displays the mean number of animals observed per hour of screen time. The x-axis represents the year from 2016 to 2023, and the y-axis represents the number of animals observed per hour. Multiple lines represent different categories: All, No Unknowns, Terrestrial Only, and Marine Only. The trends show fluctuations in the number of animals observed per hour, with notable peaks and declines over the years.
Animal identification and community composition
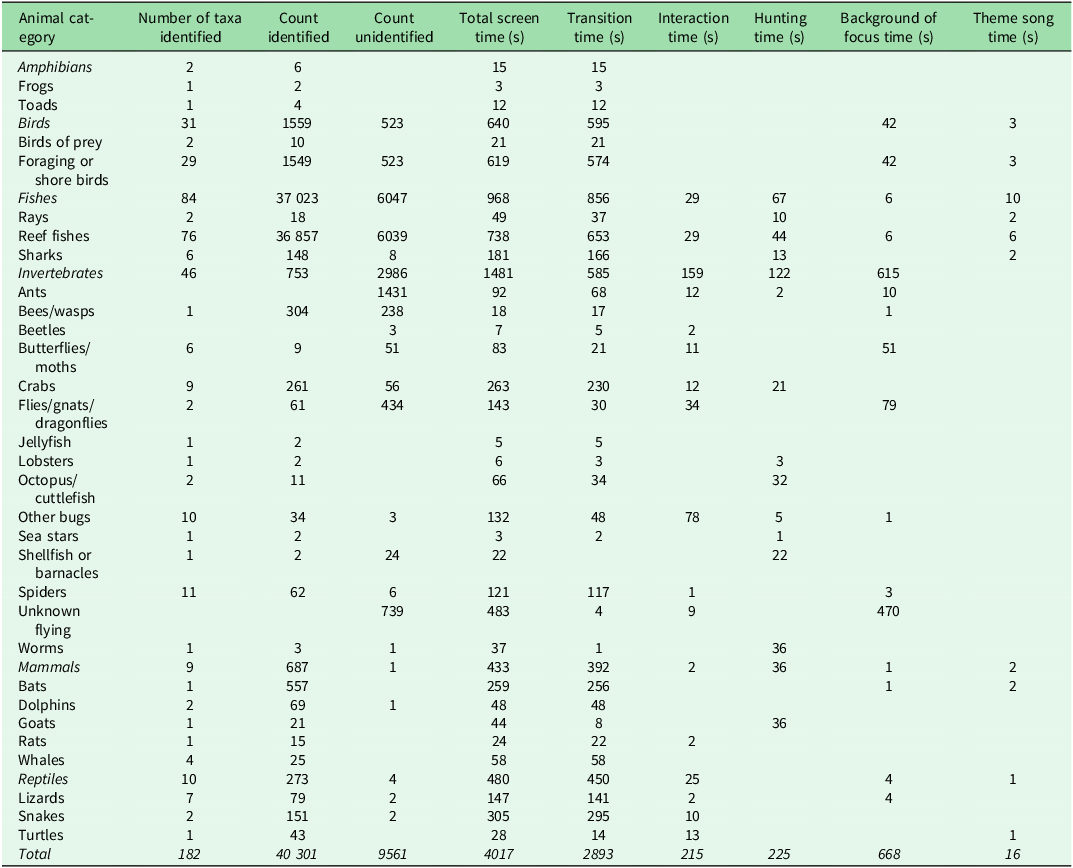
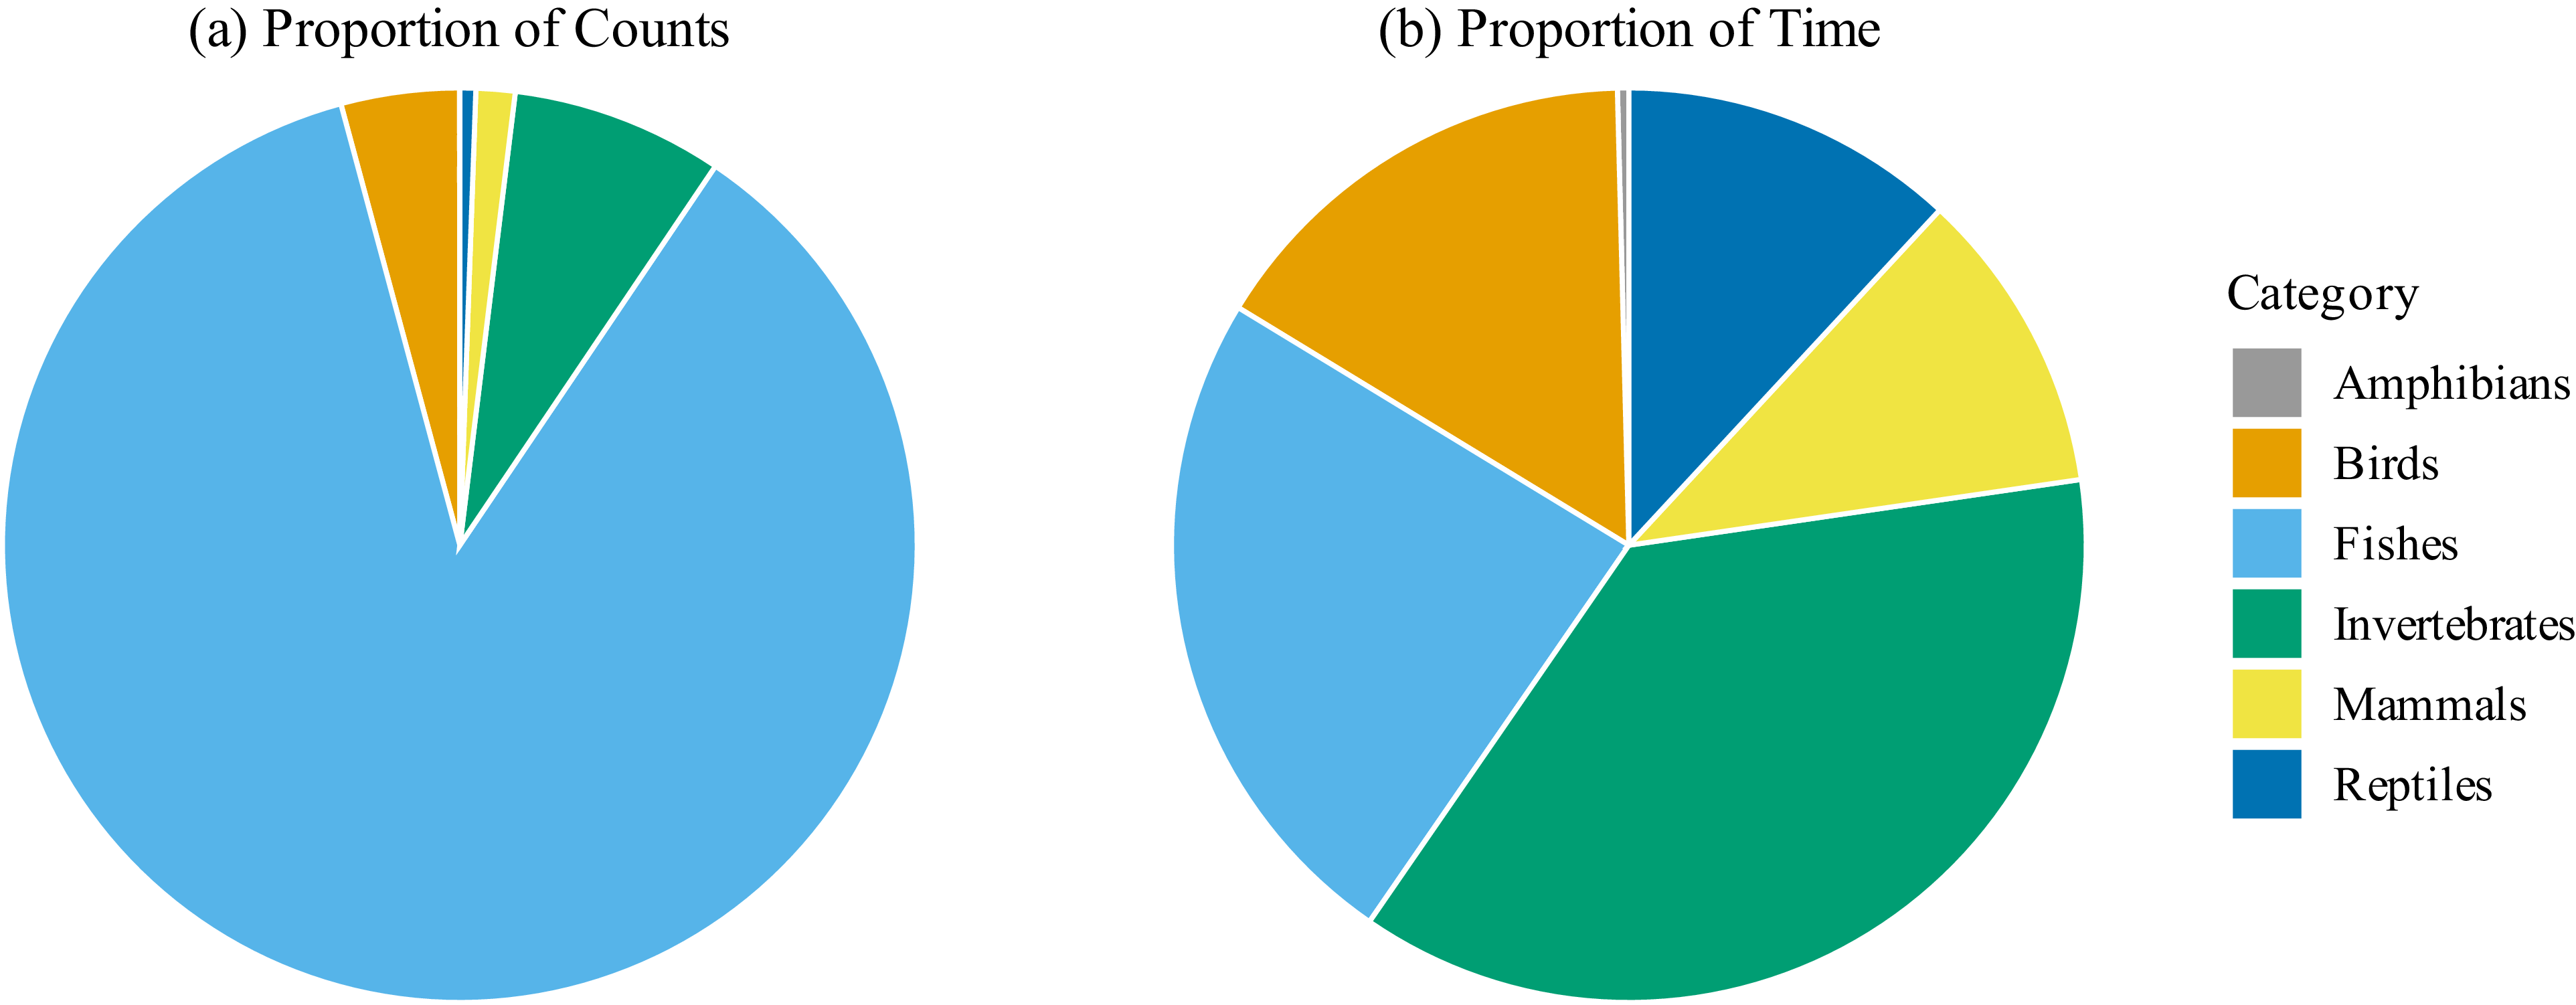
The estimated 49 862 individual animals observed consisted of 0.01% amphibians, 4.18% birds, 86.37% fishes, 7.50% invertebrates, 1.38% mammals and 0.56% reptiles (Table 1). The majority (72%) of time that animals were on screen was during scene/frame transition footage, representing 2893 out of 4017 s during which animals were displayed. The proportion of cumulative screen time devoted to each group was not proportional to its abundance observed in the footage: the distribution of cumulative screen time was 0.4% amphibians. 15.9% birds, 24.1% fishes, 36.9% invertebrates, 10.8% mammals and 11.9% reptiles (Fig. 2 & Table 1). Overall, fish were the most abundant group observed in the NDTV data. Invertebrates received the greatest overall screen time and were most frequently shown in background scenes, being hunted or consumed or interacting with contestants.
Counts of all individual animals identified down to the genus or species level. Individuals that could not be identified to the genus or species level are enumerated in the ‘Count unidentified’ column. The amount of time (in seconds) for each screen classification category and sub-category is provided for each animal by the type of footage captured.

Representation by broad animal category of (a) the proportion of total individual abundances and (b) the proportion of total screen time attributed to each group. Fishes dominated total abundance, whereas invertebrates and fishes accounted for the greatest proportion of screen time.

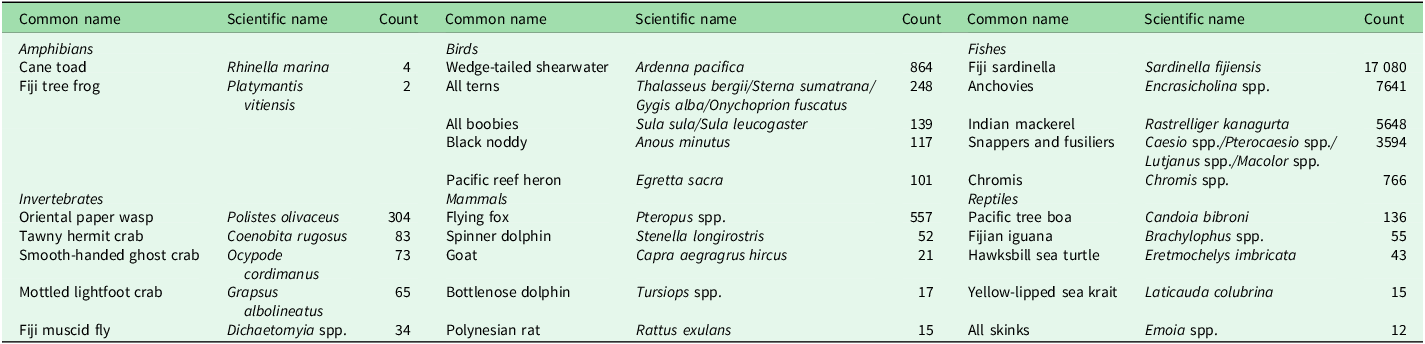
Of the 49 862 individuals observed, 40 301 individuals (80.8%) were identifiable to the family, genus or species level, representing 182 unique taxa. These taxa were composed of 2 amphibians, 31 birds, 84 fishes, 46 invertebrates, 9 mammals and 10 reptiles (Appendix S3, Fig. S2). The top five most abundant taxa for each animal grouping are shown in Table 2. All amphibians (n = 6) were identified as one of two species. The 9561 individuals that could not be clearly identified to a family, genus or species (Table 1) included 523 birds (5.5% of all unidentified; 25.1% of all birds), 6047 fishes (63.2% of all unidentified; 14.0% of all fishes), 1 mammal (<0.5% of all unidentified; 0.1% of all mammals), 4 reptiles (<0.5% of all unidentified; 1.4% of all reptiles) and 2986 invertebrates (31.2% of all unidentified; 79.8% of all invertebrates; Appendix S3, Fig. S3). Of the species identified, eight species were classified as invasive. Additionally, several species with IUCN Red List status were documented within the NDTV footage. There were two Data Deficient species, 99 taxa of Least Concern, 9 Near Threatened, 9 Vulnerable, 1 Endangered and 3 Critically Endangered species (Appendix S2). Summary data and IUCN Red List classifications for all identifiable taxa are available in the Supplementary Material (Appendix S2) as well as the online data repository (https://github.com/ChrisCrowderScience/Survivor-Manuscript).
Top five most abundant taxa identified to the genus level for each of the broader animal groupings. Where possible, taxonomically related species were grouped at the genus or family level (e.g. terns).
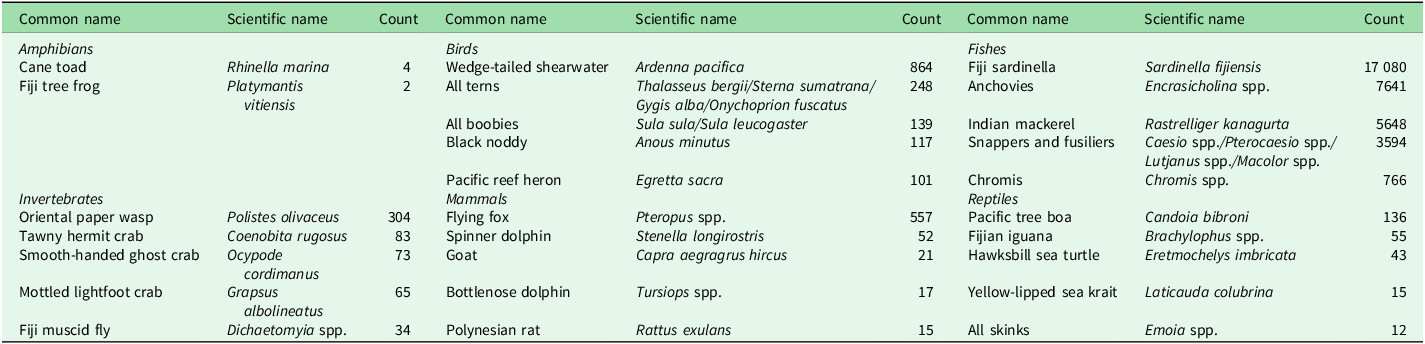
Table 2. Long description
The table is divided into six main categories: Amphibians, Birds, Fish, Invertebrates, Mammals, and Reptiles. Each category lists the common name, scientific name, and count of the top five most abundant taxa. For Amphibians, there are two rows with common names Cane toad and Fiji tree frog, scientific names Rhinella marina and Platymantis vitiensis, and counts 4 and 2 respectively. For Birds, there are five rows with common names Wedge-tailed shearwater, All terns, All boobies, Black noddy, and Pacific reef heron, scientific names Ardenna pacifica, Thalasseus bergii/Sterna sumatrana/Gygis alba/Onychoprion fuscatus/Sula sula/Sula leucogaster, Anous minutus, and Egretta sacra, and counts 864, 248, 139, 117, and 101 respectively. For Fish, there are five rows with common names Fiji sardinella, Anchovies, Indian mackerel, Snappers and fusiliers, and Chromis, scientific names Sardinella fijiensis, Encrasicholina spp., Rastrelliger kanagurta, Caesio spp./Pterocaesio spp./Lutjanus spp./Macolor spp., and Chromis spp., and counts 17080, 7641, 5648, 3594, and 766 respectively. For Invertebrates, there are five rows with common names Oriental paper wasp, Tawny hermit crab, Smooth-handed ghost crab, Mottled lightfoot crab, and Fiji muscid fly, scientific names Polistes olivaceus, Coenobita rugosus, Ocyode cordimanus, Grapsus albolineatus, and Dichaetomyia spp., and counts 304, 83, 73, 65, and 34 respectively. For Mammals, there are five rows with common names Flying fox, Spinner dolphin, Goat, Bottlenose dolphin, and Polynesian rat, scientific names Pteropus spp., Stenella longirostris, Capra aegagrus hircus, Tursiops spp., and Rattus exulans, and counts 557, 52, 21, 17, and 15 respectively. For Reptiles, there are five rows with common names Pacific tree boa, Fijian iguana, Hawksbill sea turtle, Yellow-lipped sea krait, and All skinks, scientific names Candoia bibroni, Brachylophus spp., Eretmochelys imbricata, Laticauda colubrina, and Emoia spp., and counts 136, 55, 43, 15, and 12 respectively.
Diversity metrics and species accumulation
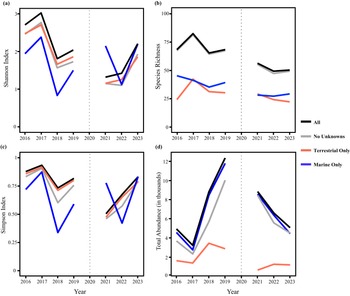
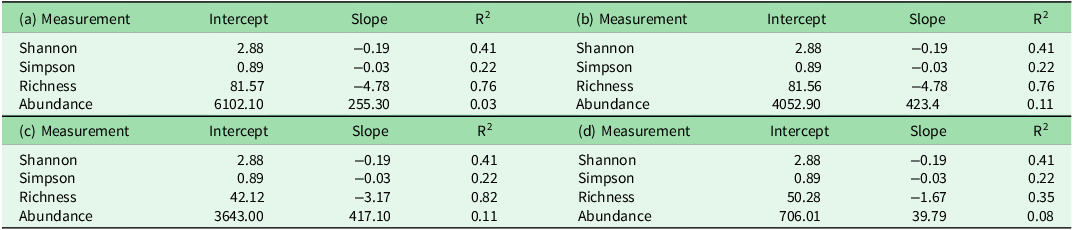
Diversity metrics indicate slight declines in Shannon and Simpson diversity indices and species richness at annual scales, with varying model fit (Fig. 3 & Table 3). Terrestrial Shannon and Simpson diversity values were generally higher than those for marine taxa (Fig. 3). In contrast, overall abundance increased marginally during the study period (Fig. 3 & Table 3). Marine animal abundance was higher than that of terrestrial animals. Marine abundance fluctuated, peaking in 2019, before declining to levels comparable to those observed in 2016 (Fig. 3 & Table 3), whereas terrestrial abundance remained lower and relatively more stable over time. Marine animal species richness was generally higher than terrestrial animal species richness (Fig. 3).
(a) Shannon index, (b) species richness, (c) Simpson diversity index and (d) total abundance for all animals, all but unknown animals, terrestrial animals only and marine animals only. Grouping these separately provides insights into variation in these metrics based on the environment and identification of these animals. Please note the omission of 2020 (no series of Survivor filmed due to the COVID-19 pandemic) in the panels so as not to obscure observation of the trends.

Linear model results for Shannon and Simpson diversity indices, species richness and abundance. Metrics were grouped by calendar year. Furthermore, the results were grouped by (a) all animals, (b) all but unknown, (c) terrestrial only animals and (d) marine animals only.

When utilizing unique species identification trends from the start of Season 33 in 2016 to the end of Season 46 in 2023, species richness was predicted to asymptote at c. 198 unique species (Appendix S3, Fig. S4). Our results suggest that the NDTV footage captured 93% of taxa during the study period. The number of sampling events required to capture the ‘missing’ 14 species to within 1% would be a total of 13.8 years of sampling. This would require an additional 6.8 years of sampling in addition to the existing 7 years of NDTV footage reviewed here, assuming episode length, number of episodes, amount of effort to collect NDTV footage, editing style and techniques used to gather animal footage remain relatively consistent with past seasons.
Discussion
Diversity trends and applicability of NDTV footage
The data derived here provide a limited view of the organismal community in the Mamanuca Islands of Fiji using a data source not previously considered in ecological research. The Shannon and Simpson indices (Fig. 3) exhibit substantial interannual variability. Linear model results suggest slight declines in diversity and an increase in relative abundance (Table 3); however, model fit for abundance was poor (R2 = 0.03–0.11), probably being a reflection of the distribution of relative abundance values through time (Fig. 3d). In the context of biodiversity loss in the South Pacific, the apparent declines observed in NDTV footage are broadly consistent with previous studies documenting regional biodiversity declines (Kier et al. Reference Kier, Kreft, Lee, Jetz, Ibisch and Nowicki2009, SPREP 2012, Fernández-Palacios et al. Reference Fernández-Palacios, Kreft, Irl, Norder, Ah-Peng and Borges2021). Declines in diversity (Table 3) could be attributed to a variety of factors, none of which could be measured or evaluated through these television observations. Given these limitations, the substantial interannual variability (Fig. 3) and the relatively short temporal scope of the dataset, we can discern no clear directional trend in diversity or abundance.
Given the limited resolution of the dataset, the scope for robust analyses of diversity and abundance trends is constrained. Additional contextual information would enable the application of more appropriate statistical approaches and improve the capacity to detect meaningful patterns despite observed variability. Accordingly, these results should be interpreted with caution, with emphasis placed on the limitations and quality of the data source rather than on ecological conditions. Considering the caveats associated with NDTV data (see the following subsection), we conclude that it is not currently appropriate to draw conclusions about changes in community composition or biodiversity from these data. Nevertheless, NDTV footage may hold value for future research under more controlled or well-contextualized conditions.
Considerations of abundance and temporal metrics
There are several relationships to note in the context of abundance and various temporal metrics. First, the decreasing frequency of animal footage occurrences (Fig. 1) and declining percentage of time during which animals appeared in the NDTV footage (Fig. 1) must be evaluated against the number of animals observed per hour (Fig. 1) and total abundance observed (Fig. 3). This will give insights into how various temporal measures may influence the appearance of abundance.
Selection bias and the use of animal footage to fill run-time needs, as observed in other forms of media, may further influence results derived from NDTV footage. For example, in the seasons filmed in 2018, the proportion of screen time featuring animals and the number of individuals observed were relatively high. This elevated screen time could increase overall animal counts as well as their apparent abundance and diversity. However, diversity indices for these seasons were relatively low because the footage disproportionately featured schooling fish, resulting in high abundance but low species diversity compared to seasons without such footage.
Differences between marine and terrestrial diversity metrics may reflect the types of animals shown in the footage. As previously mentioned, lower marine diversity metrics may be driven by footage of large, homogeneous schools of fish, which substantially increase the number of individuals observed while contributing relatively little to species diversity. Analysing terrestrial and marine organisms separately provides a more balanced understanding of species diversity within NDTV footage and helps identify potential sources of sampling bias.
Analysis of temporal and spatial data considerations
NDTV footage provides limited temporal and spatial metadata, constraining interpretation of observed patterns. Although Survivor was filmed consistently during the same months and in the same geographical region, the biotic community data extracted from footage were curated by editors rather than systematically sampled. Consequently, NDTV footage represents a selected subset of the local biotic community and should be interpreted as a first-order approximation of diversity trends over time.
The inability to track specific individuals may result in the inadvertent double-counting of individuals, particularly for species with limited distinguishing features. Resident animals near campsites or nesting areas may be filmed repeatedly across episodes or seasons without clear indication that individuals are distinct. The tagging or marking of individuals, even within a predetermined taxon of interest, would greatly increase the value of this dataset, as individuals’ movements could be evaluated against time and location data. Altogether, this information would increase the robustness of these data and allow researchers to start exploring potential topics such as individual/organismal distribution, relationships to specific habitat or physical features and migration/movement patterns.
Production and data collection considerations
Several aspects of NDTV production, collection and editing may influence observed patterns. When comparing aquatic and terrestrial footage, additional logistical challenges associated with filming underwater may introduce sampling bias. These challenges include the need for specialized skills (e.g., scuba experience), boats for transportation to offshore or reef locations and specialized filming and diving equipment. As a result, terrestrial organisms may be over-represented because they are easier to film without specialized equipment, planning or expertise. We further hypothesize that when filming marine organisms, production crews may dedicate effort over a predetermined period to capture as much aquatic footage in one event as possible, whereas terrestrial animal footage may be collected more incidentally during other filming activities. This difference in effort allocation could explain why marine animal abundance per hour and total marine abundance fluctuate over time, while terrestrial animal metrics remain relatively consistent (Figs 1 & 3).
There may also be an inherent bias towards filming more charismatic fauna in the context of abundance. Invertebrate abundance was under-represented when considering the worldwide ratio of invertebrate to vertebrate species, and invertebrates frequently appeared in the background when other events were the primary focus of filming (Table 1). However, invertebrates received the greatest proportion of screen time primarily due to their appearance in the background of footage (Fig. 2 & Table 1). This pattern may reflect a preference by film crews to focus on vertebrates or visually striking species that are perceived as more engaging to viewers. Similarly, there may be an inadvertent selection bias towards charismatic species or taxa believed to be notable based on the knowledge or personal preferences of the film or editing crew. This pattern parallels previous research showing that invertebrates are often under-represented in photographic datasets compared to their true abundance (Ruiz-Villar et al. Reference Ruiz-Villar, Morales-González and Morant2025). Selection bias towards charismatic species has been documented across multiple media contexts, where species are favoured due to aesthetic appeal, emotional impact or perceived interest, sometimes described as having a high ‘cuddle factor’ (Lorimer Reference Lorimer2007, Wilson et al. Reference Wilson, Procheş, Braschler, Dixon and Richardson2007, Jarić et al. Reference Jarić, Courchamp, Correia, Crowley, Essl and Fischer2020, Molhuizen et al. Reference Molhuizen, Beumer and Dorresteijn2025). In NDTV productions, this bias may be amplified because filming primarily focuses on human subjects, with wildlife footage used secondarily for thematic, production or narrative purposes. During data collection, editors appeared to use animals symbolically; for example, metaphors related to aggression or fear were often intentionally paired with footage of spiders, sharks or snakes.
Additional challenges arise from image quality in NDTV footage. Low lighting, distant subjects and the focus of the camera on human activity often limited the ability to identify organisms accurately, particularly for taxa requiring the confirmation of detailed morphological features for proper identification. This limitation was most pronounced for birds and invertebrates, many of which could only be identified to higher taxonomic levels. Improvements in filming technology through time may also influence detectability and improve taxonomic resolution.
Reviewing and extracting data from large volumes of NDTV footage is time intensive and may still provide only limited insights into community composition due to inherent filming and editing biases. On average, it took 2.5–3.0 min to process 1 min of footage, depending on factors such as the number of individuals on screen, image quality, animal movement and species rarity. Rare or difficult-to-identify animals often required more time for an identification decision. This resulted in 165 h and 14 min of strictly watching the footage and an additional estimated 420–450 h to process the footage. We believe that this was a substantial time investment to obtain these data compared to the quality of data yielded from a similar time investment within in situ surveys, observations or field sampling. With uncertainties regarding how well these data reflect real-world community composition and the limited applicability to ecological and conservation research, we consider this to be another reason as to why NDTV footage is currently not a particularly strong data source in ecological and conservation contexts.
The future of NDTV footage in ecology and conservation
Currently, several factors limit the use of NDTV footage in ecological and conservation research. Despite these limitations, there are several avenues through which NDTV footage could be expanded to enhance its utility in ecological and conservation contexts, including educational applications, emerging analytical technologies and integration with complementary biodiversity datasets (see Appendices S1 & S3 for additional examples, details, implementation considerations and figures).
First, NDTV footage may have value in educational settings. Such footage could serve as an engaging tool for practicing taxonomic identification using video observations of varying image quality and environmental conditions. While not a substitute for field-based training or work with preserved specimens, NDTV footage provides opportunities to expose students and trainees to a wide range of taxa and habitats that may otherwise be inaccessible. Beyond educational applications, integrating NDTV footage with complementary datasets and emerging technologies offers additional opportunities to enhance its relevance. Advances in camera technology may improve image quality and reduce the number of individuals that cannot be identified to taxonomic groups. Similarly, artificial intelligence (AI), particularly machine learning-based computer vision models, may help automate species detection and identification from video footage. These tools could substantially reduce the time required to process large volumes of footage while increasing consistency in taxonomic classifications. However, outputs from AI systems still require human validation to ensure accuracy, particularly for rare, cryptic or visually similar species.
Future research could also directly compare NDTV footage with established field-collected datasets to better understand how these data sources differ in their representation of ecological communities. Furthermore, the Survivor franchise and related programmes have been filmed across numerous international locations, creating opportunities for NDTV-based analyses in diverse ecological systems. Pooling NDTV footage with data from established monitoring programmes, citizen science platforms and other biodiversity databases may help offset biases inherent to any single source while enabling broader spatial and temporal analyses. While we remain cautious regarding its current applications, NDTV footage is limited as a standalone ecological data source. However, its value to ecological and conservation research may increase substantially when integrated with complementary datasets, emerging analytical tools and improved metadata describing footage collection.
Supplementary material
To view supplementary material for this article, please visit https://doi.org/10.1017/S0376892926100514.
Acknowledgements
We would like to express our great appreciation to Pedro F Quintana-Ascencio, Matthew Atkinson, David Jenkins and the three anonymous reviewers for their comments in helping to improve this manuscript.
Financial support
None.
Competing interests
The authors declare none.
Ethical standards
Not applicable.


 Open access

