


INTRODUCTION
Since the discovery of the AD 775 14C peak (M12) by Miyake (Miyake et al. Reference Miyake, Nagaya, Masuda and Nakamura2012), M12 has been confirmed, and its potential causes have been investigated by several groups. The potential causes of M12 include a solar proton event (SPE) (Melott and Thomas Reference Melott and Thomas2012; Thomas et al. Reference Thomas, Melott, Arkenberg and Snyder2013; Usoskin et al. Reference Usoskin, Kromer and Ludlow2013; Jull et al. Reference Jull, Panyushkina and Lange2014; Mekhaldi et al. Reference Mekhaldi, Muscheler and Adolphi2015), supernova (Miyake et al. Reference Miyake, Nagaya, Masuda and Nakamura2012), gamma ray burst (GRB) (Hambaryan and Neuhäuser Reference Hambaryan and Neuhäuser2013; Pavlov et al. Reference Pavlov, Blinov and Konstantinov2013), and normal periods of low solar activity (Neuhäuser and Neuhäuser Reference Neuhäuser and Neuhäuser2015). Alone, none of the abovementioned potential causes is sufficient to explain M12, but an SPE seems to have been a primary cause of M12. If M12 was caused by a supernova, there should be a residual candidate supernova in close proximity to the Earth (Miyake et al. Reference Miyake, Nagaya, Masuda and Nakamura2012). However, no supporting evidence for such a supernova has been found (Stephenson Reference Stephenson2015). Supernovae emit high-energy particles and gamma rays. The high-energy particles from supernovae have an abundant energy distribution. Hence, extended arrival times that span a minimum of at least 10 years should be observed (Gehrels et al. Reference Gehrels, Laird and Jackman2003; Dee et al. Reference Dee, Pope, Miles, Manning and Miyake2017). However, the M12 peak exhibits a sharp 1–2-year increase. Gamma rays from supernovae and GRBs have a very short duration, which implies that a rapidly rising 14C peak may occur. It has been shown that the M12 concentrations of the cosmogenic isotope 10Be measured in Antarctic ice were too high to have been produced by a GRB (Usoskin et al. Reference Usoskin, Kromer and Ludlow2013). Although the exact cause of M12 is still disputed, an SPE is considered a possible cause due to the 10Be/36Cl measured in polar ice cores (Mekhaldi et al. Reference Mekhaldi, Muscheler and Adolphi2015). However, more evidence is required to confirm an SPE as the cause of M12. Moreover, the 14C peaks in AD 993/994 (Miyake et al. Reference Miyake, Masuda and Nakamura2013) and 660 BC (Park et al. Reference Park, Southon, Fahrni, Creasman and Mewaldt2017) are similar to M12 and may have similar explanations.
Under the assumption that an abrupt increase in the production of 14C led to M12, the aim of this study was to estimate the occurrence time of the abrupt increase in 14C production based on a comparison of data measured in South Korea and Finland (Uusitalo et al. Reference Uusitalo, Arppe, Hackman and Helama2018). The occurrence time of the 14C spike production estimated by Güttler (Güttler et al. Reference Güttler, Adolphi and Beer2015) was between September AD 774 and September AD 775, whereas that obtained by Büntgen (Büntgen et al. Reference Büntgen and Lukas2018) was between June and August of AD 774. These two studies did not include the oxidation time of 14C in their estimations, so the estimated occurrence times of the abrupt increase in 14C production are at least a few months late, as the residence time of 14C ranges from one month to 5 years (Jaffe et al. Reference Jaffe1968; Robbins et al. Reference Robbins, Borg and Robinson1968; Weinstock Reference Weinstock1969; Weinstock and Niki Reference Weinstock and Niki1972; Volz et al. Reference Volz, Tönnissen, Ehhalt and Khedim1980; Logan et al. Reference Logan and Prather1981; Brenninkmeijer et al. Reference Brenninkmeijer and Manning1992; Daniel Reference Daniel1999). In this study, we investigated the oxidation time from a detailed analysis of a bomb peak, which differs from the methods used in previous studies. This oxidation time and the early rise in the Δ14C values in the latewood of AD 774, one year earlier than the AD 775 timing obtained by other researchers (Uusitalo et al. Reference Uusitalo, Arppe, Hackman and Helama2018), was considered to provide an estimate of the occurrence time of the abrupt increase in 14C production.
MATERIALS AND METHODS
The early- and latewood in tree rings (AD 762–776) of Zelkova serrata C.E. excavated from a burial site at Bangu-dong in Ulsan, South Korea (35°33′N, 129°20′E) (Figure 1), were prepared at the Tree-Ring Research Center of Chungbuk National University to provide measurement samples for Δ14C analysis (Figure 2). This burial site is situated in the region of the Asian monsoon; thus, the tree rings were under the influence of the Asian monsoon.
Map of the sampling site (red solid circle; Bangu-dong, Ulsan, Korea, 35°33′N, 129°20′E).

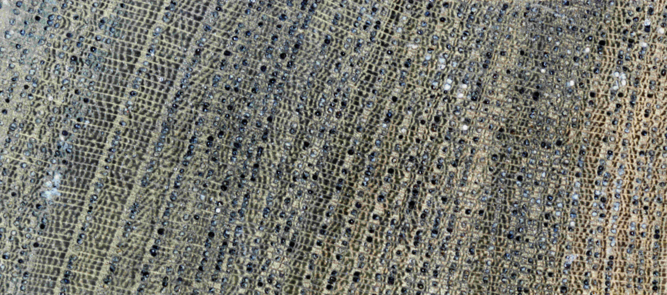
Cross-section scanning image of the experimental archaeological wood (Zelkova serrata).
Previous studies have confirmed that the δ18O chronology can be used in cross-dating for other tree species (Li et al. Reference Li, Nakatsuka and Sano2015; Seo et al. Reference Seo, Jeong and Sano2017) and applied to areas situated at a distance of approximately 1000 km from the origin (Baker et al. Reference Baker, Hunt and Clerici2015). Based on such findings, the Zelkova tree-ring δ18O time series was compared with the Japanese master δ18O chronology, which is the mean chronology of three local δ18O chronologies from Aomori (Thujopsis dolabrata var. hondae), Akita (Crypomeria Japonica), and Niigata (Zelkova serrata), located in northwest Japan. The Japanese master δ18O chronology ranged from AD 502 to 1595. The Zelkova tree-ring δ18O time series was cross-dated with the Japanese master δ18O chronology and completely overlapped with the Japanese master δ18O chronology, so that the first and last tree rings were successfully dated in AD 752 and 861, respectively (Choi Reference Choi2019). The dating results were decided based on the t-value (4.4), G-value (58%), and correlation coefficients (r = 0.40, p < 0.001) and also the synchronization strength between the Zelkova tree-ring δ18O time series and Japanese master δ18O chronology.
Zelkova serrata is a genus comprising six species of deciduous trees in the elm family Ulmaceae, which is native to southern Europe and southwest and eastern Asia (Bétrisey et al. Reference Bétrisey, Song and Kozlowski2018; Wikipedia). Early- and latewood from AD 762–776 were treated using the α-cellulose extraction method (Hua et al. Reference Hua, Barbetti and Zoppi2004). This method removes unwanted mobile materials such as gums, resins, fats, and waxes, leaving the α-cellulose behind. The samples were heated at 80°C for 6 hr in a mixed solution of 120 mL cyclohexane and 60 mL ethanol. The remains were repeatedly rinsed with ethanol and de-ionized water. Thereafter, the samples were treated with 150 mg NaClO2 and 1 M HCl at 100°C for 1–2 hr. The samples were then treated in a 12% NaOH solution with nitrogen gas bubbling at 60°C. Finally, the samples were neutralized with a 2 M HCl solution for 30 min and dried in an oven at 40°C. An elemental analyzer (EA) was used for combustion to produce CO2, which was then reduced to graphite. The 14C/12C and 13C/12C ratios of the samples were measured using the 1MV accelerator mass spectrometer (AMS) at the Korea Institute of Geoscience and Mineral Resources in Daejeon, South Korea (Hong et al. Reference Hong, Park, Sung, Woo, Kim, Choi and Kim2010). The Δ14C values of samples were calculated with oxalic II and background samples older than 100,000 years, which were measured together with unknown samples. To monitor the counting conditions, known samples (IAEA C7 and C8 reference materials) were measured approximately every 20 samples.
RESULTS AND DISCUSSION
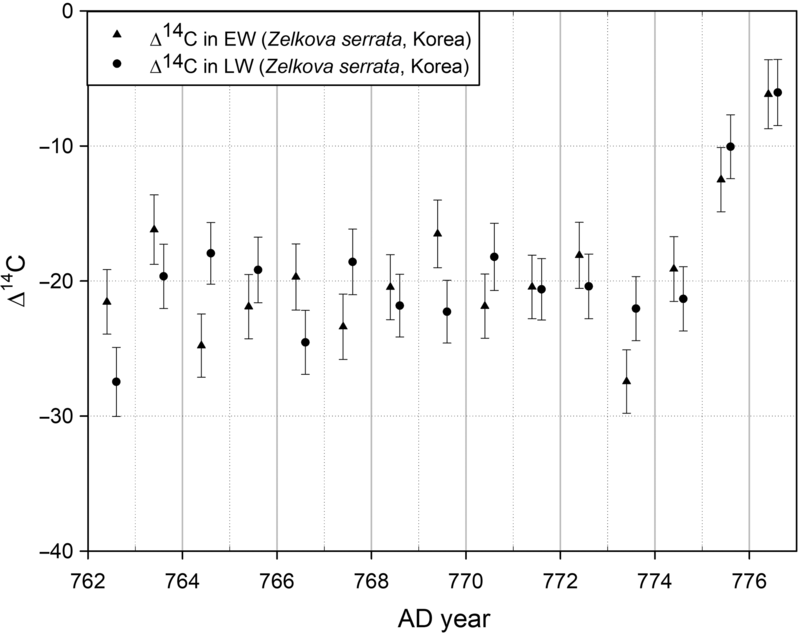
Figure 3 shows the Δ14C values of the early- and latewood in tree rings between AD 762 and 776. The results confirm the existence of the M12 event and suggest that the height of M12 was approximately 15‰, which is consistent with the results of previous studies (Miyake et al. Reference Miyake, Nagaya, Masuda and Nakamura2012; Uusitalo et al. Reference Uusitalo, Arppe, Hackman and Helama2018). No early rise in Δ14C in AD 774 early- or latewood was observed.
Δ14C of early- (solid triangles) and latewood (solid circles) in tree rings (Zelkova serrata) between AD 762 and AD 777 from Bangu-dong in Ulsan, Korea (35°33′N 129°20′E).
Analysis of Δ14C from AD 762–776 Early- and Latewood in South Korea
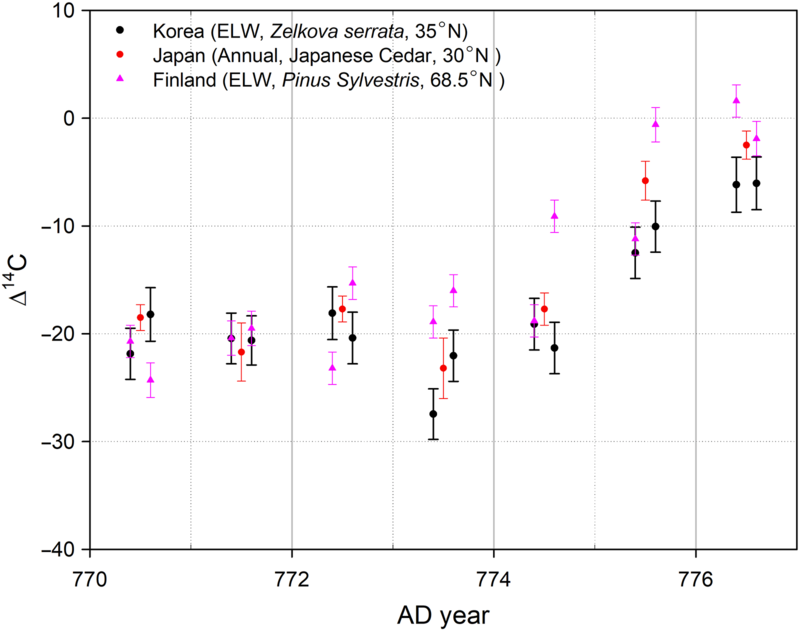
A comparison of our results to those of previous studies (Miyake et al. Reference Miyake, Nagaya, Masuda and Nakamura2012; Uusitalo et al. Reference Uusitalo, Arppe, Hackman and Helama2018) is shown in Figure 4. Although the results from Finland (68.5°N, 28.1°E) show a significant early rise in the latewood of AD 774 (Uusitalo et al. Reference Uusitalo, Arppe, Hackman and Helama2018), our results did not identify an early rise in the early- or latewood of AD 774. This comparison shows that the height of the early rise in the latewood in AD 774 was dependent on latitude because the amplitude of M12 increased in accordance with an apparent increase in the latitude of the sampling site (Büntgen et al. Reference Büntgen and Lukas2018). In previous studies (Jull et al. Reference Jull, Panyushkina and Lange2014; Büntgen et al. Reference Büntgen and Lukas2018; Uusitalo et al. Reference Uusitalo, Arppe, Hackman and Helama2018), the early rise of Δ14C in AD 774 was observed at high latitudes in Russia (67.5°N, 70.7°E) and Finland (68.5°N, 28.1°E).
Results from other researchers (Miyake et al. Reference Miyake, Nagaya, Masuda and Nakamura2012; Uusitalo et al. Reference Uusitalo, Arppe, Hackman and Helama2018) are compared with the present result (Korea, black solid circle). Δ14C of earlywood and latewood (Korea and Finland) were located in 0.4 and 0.6 of each year and Δ14C of annual tree ring (Japan, red solid circle) was located in 0.5 of each year. While the result from Finland (red solid triangle) shows a distinguished early rise in the latewood of AD 774, this result does not show any early rise in early and latewood of AD 774.
Estimation of the Half-Oxidation Time (HOT) of 14C Produced in the Troposphere
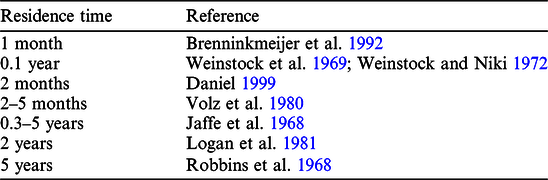
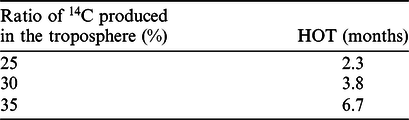
Of the 14C emitted by nuclear reactions, 95% is instantaneously oxidized into 14CO (Pandow et al. Reference Pandow, MacKay and Wolfgang1960; MacKay et al. Reference Mackay, Pandow and Wolfgang1963; Jöckel et al. Reference Jöckel, Brenninkmeijer, Lawrence and Siegmund2003). The residence time of CO in the atmosphere ranges approximately from 1 to 60 months, as shown in Table 1 (Jaffe et al. Reference Jaffe1968; Robbins et al. Reference Robbins, Borg and Robinson1968; Weinstock Reference Weinstock1969; Weinstock and Niki Reference Weinstock and Niki1972; Logan et al. Reference Logan and Prather1981; Volz et al. Reference Volz, Tönnissen, Ehhalt and Khedim1980; Brenninkmeijer et al. Reference Brenninkmeijer and Manning1992; Daniel Reference Daniel1999). The residence time of CO determined in studies from the 1990s, which are relatively recent, tended to be shorter, and CO levels are known to be affected by bacteria in soil (Duggin and Cataldo Reference Duggin and Cataldo1985).
Estimates of the residence time of CO in the atmosphere.
CO in the atmosphere is mainly oxidized into CO2, as follows (Volz et al. Reference Volz, Tönnissen, Ehhalt and Khedim1980):
 $$CO + OH \to CO_2 + H.$$
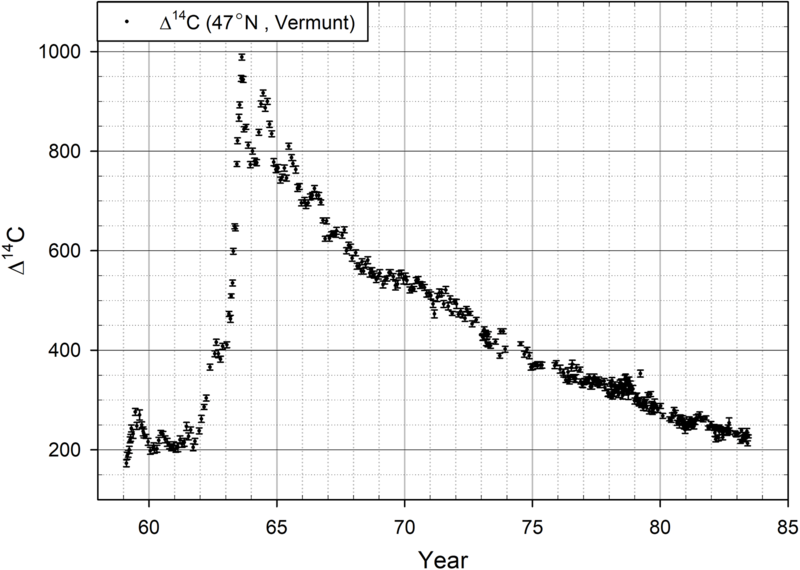
The oxidation time of 14C from nuclear reactions into 14CO2 can be used to define the occurrence time of the 14C spike using Δ14C values from tree rings. We attempted to calculate the oxidation time using peak 14C from the bomb peak (Hua et al. Reference Hua, Barbetti and Rakowski2013) because M12 can be considered similar to the increase in 14C due to nuclear testing, or the “bomb peak.” The bomb peak (main bomb peak) is a Δ14C peak that appeared in AD 1963 at Vermunt, Austria, as a result of nuclear waepon tests (47°N, Levin et al. Reference Levin, Kromer, Schoch-Fischer and Bruns1985), but Figures 5 and 6 show two small peaks that appeared in AD 1958 and AD 1962. The small bomb peak observed in August 1962 can be used to estimate the half-oxidation time (HOT) of 14C in the troposphere. The small bomb peak is composed of an initial increase of approximately 100‰ from October 1961 to February 1962, followed by another increase of approximately 100‰ from March to August 1962. The total height of this small bomb peak was approximately 200‰ (Figure 5). Nuclear test results from 1959 to 1963 are shown in Figure 5 (Johnston Reference Johnston2013). There were no nuclear tests by the Soviet Union or USA in 1959–1960. The Soviet Union conducted 74 nuclear tests above 48°N during September–November 1961, and the USA conducted 10 nuclear tests below 38°N during September–December 1961. This led to the conclusion that the initial increase in the small bomb peak measured at Vermunt, Austria, was mostly due to the Russian nuclear tests. From January to August 1962, the USA conducted 70 nuclear tests. However, the site of the nuclear tests was situated far from Vermunt, and most of the tests occurred in May–July 1962, and thus were too close to August and too far from Vermunt to have caused the second increase in the small bomb peak.
There is a small bomb peak from October in 1961 to February in 1962 (Levin et al. Reference Levin, Kromer, Schoch-Fischer and Bruns1985), and this small bomb peak can be compared to the early rise in M12. The small bomb peak is composed of an initial increase of approximately 100‰ from October 1961 to February 1962, followed by a second increase of approximately 100‰ from March to August 1962; the total height of this small bomb peak was approximately 200‰.
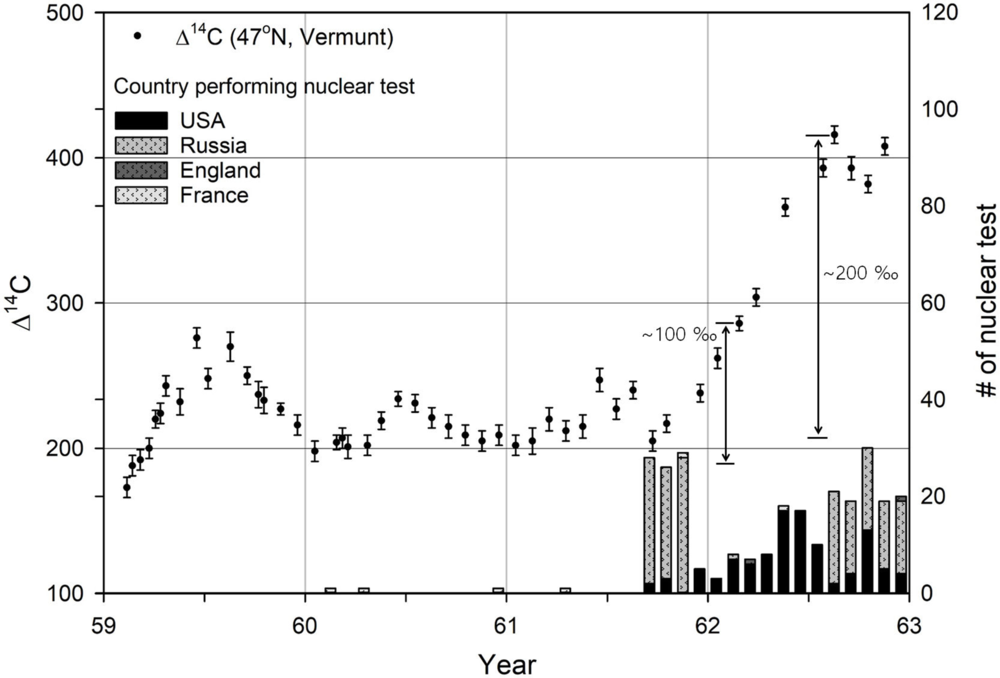
Δ14C in atmosphere at Vermunt (Levin et al. Reference Levin, Kromer, Schoch-Fischer and Bruns1985). This bomb peak was produced by atmospheric nuclear tests.
The observed small bomb peak can be used to estimate the HOT of 14C in the troposphere. There are two reasons for this. First, we assumed that the small bomb peak (October 1961 to February 1962) was only due to high-latitude nuclear tests in Russia; thus, the analysis and assumptions in the estimation of the HOT were relatively straightforward. Second, the initial increase in the small bomb peak occurred in autumn and winter, and was indicated by the 14C produced in the troposphere due to short dispersion time and absence of a spring seasonal effect; i.e., we can exclude the Brewer–Dobson circulation (“spring mixing” from the stratosphere to the troposphere from May to June). The 14C dispersion time at similar latitudes was therefore approximately 1–2 weeks, shorter than the HOT, which is known to range from 1 to 60 months (see Table 1). Hence, based on the small bomb peak, it is possible to estimate the HOT from a comparison between the initial increase with its small ratio of 14C oxidation, and the second increase, with a large ratio of 14C oxidation.
The height of the initial increase in the small bomb peak was estimated to be 100‰ in February 1962, as shown in Figure 5. The height of the initial increase was overestimated due to the seasonal decrease in Δ14C, and this initial increase required 4 months, from the time of the Soviet tests in October 1961 (the middle of a 3-month period of nuclear tests in 1961 in Russia) to February 1962, for the 100‰ increase to be observed. The second increase in the small bomb peak (height of 200‰), from March to August 1962, matched the Brewer–Dobson circulation model and was similar to the bomb peaks in 1963, 1964, and 1965, as shown in Figure 6. The second increase occurred during the time of the normal Brewer–Dobson circulation model. The total 14C produced by this small bomb peak could potentially increase Δ14C to 140‰ (70% of the total height [200‰] of the small bomb peak) for the entire Earth, similar to the main bomb peak (1000‰ at high latitudes and 700‰ in the equatorial range, making the average ~700‰). The amount of 14C corresponding to the initial increase in the small bomb peak due to tropospheric dispersion (Csb_T) was obtained from the following equation, under the assumption that the 14C production in the troposphere is 30% (Naegler and Levin Reference Naegler and Levin2006; Yang et al. Reference Yang, North and Romney2000) of the total 14C production (supplementary materials).
 $${C_{sb\_T}} = {{{H_{sb\_eq}}} \over {\left( {1 - {e^{\left( {{M_{sb}} \times \ln 2} \right)/{T_{1/2}}}}} \right)}} \times C \times T\left( {30\% } \right) = 51kg,$$
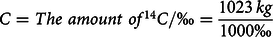 $$C = The\ amount\ of{}^{14}C/ \permil = {{1023\,\it kg} \over {1000\permil}}\hskip90pt$$
(Schimel et al. Reference Schimel and Houghton1996),
where Hsb_eq (140‰) represents 70% of the total height (200‰) of the small bomb peak. Similarly to the tendency of the main bomb peak, T (30%) represents the amount of 14C in the troposphere as a proportion of the total 14C, Msb (10 months) represents the time required for the total increase in the small bomb peak to occur (October 1961 to August 1962), and T1/2 (3.8 months) represents the HOT of 14C.
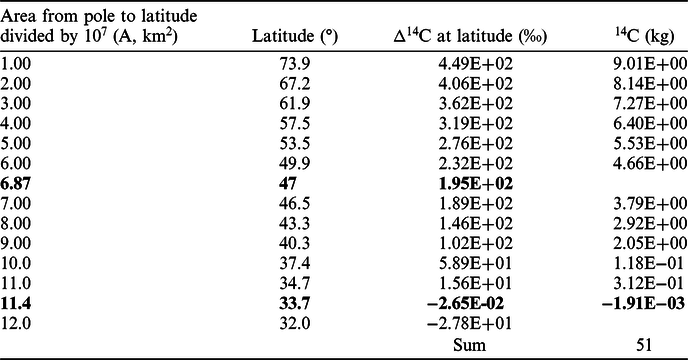
It was assumed that the 14C produced in the troposphere by nuclear tests was dispersed at 33.7°N (the lowest latitude of the 14C dispersion area for 4 months based on the 1.5 years for which the bomb peak was dispersed throughout the Earth; supplementary materials) in February 1962. The amount of Δ14C then increased linearly with latitude (as shown in Equation [3] and Table 2), the amount of Δ14C could be obtained at each latitude, and the Δ14C at 47°N (latitude of Vermunt, HE_1sb_FO), with full 14C oxidation, was obtained by equalizing Csb_T (based on an assumption of almost complete 14C oxidation) with the sum in Table 2 determined from the adjustment of B and C in Equation (3). The oxidation ratio of 14C for 4 months was obtained using Equation (4) (supplementary materials).
 $$\Delta {}^{14}C = - B \times A + C,$$
where A represents the area from the pole to the specified latitude divided by 107, and B(=492.3) and C(=43.3) are obtained from adjusting to equalize Csb_T with the sum of 14C in Table 2 (supplementary materials).
* HE_1sb_ FO
 $${{{H_{1sb}}} \over {{H_{E\_1sb\_FO}}}}\sim 51{\rm{\% }} = {}^{14}C\_Ox\_r{\rm{}}\left( {{}^{14}{\rm{C}}\,{\rm{oxidation\ ratio\ for \ 4\ months}}} \right),$$
where H1sb (100‰) represents the Δ14C height of the first increase in the small bomb peak (from October 1961 to February 1962), and HE 1sb FO represents the Δ14C height of the first increase in the small bomb peak with 14C full oxidation.
Δ14C and 14C amounts calculated based on the assumption of a linear increase with latitude according to Equation (3) and equalization of Csb_T with the sum presented below.
The HOT of 14C was calculated as approximately 3.8 months using iterations of Equation (5) and the calculation procedure presented in the supplementary materials:
 $${{{T_{1sb}}*LN\left( 2 \right)} \over {LN\left( {1 - {}^{14}C\_Ox\_r} \right)}} = {T_{1/2}}\left\;( {{\rm{half\ oxidation\ time\ of\ }}{}^{14}C} \right),$$
where T1sb (4 months) represents the duration of the first increase in the small bomb peak, and 14C_Ox_r (51%) represents the 14C oxidation ratio for T1sb (4 months).
Among the assumptions used during calculation of the HOT, the ratio of 14C production in the troposphere is sensitive to the value of HOT, so HOTs were recalculated while varying the ratios in the range of 25–35%, as shown in Table 3. HOTs were obtained in the range of 2–7 months and were estimated to be in the range of 1–7 months considering the recalculation and a relatively recent report by Bernninkmeijer et al. (Reference Brenninkmeijer and Manning1992).
HOTs were recalculated with variations of the ratio of 14C production in the troposphere in the range 25–35%. The HOT of 14C was calculated to range from 2 to 7 months.
It can be assumed that the 14C produced in the troposphere in AD 774 was dispersed to 49.1°N, which is the latitude of the average area between the Finnish and South Korean sampling locations. Given that there was no early rise in Δ14C in the latewood of AD 774 in South Korea, as opposed to in Finland, it can also be assumed that Δ14C increased linearly with latitude. Based on the HOT of 3.8 months and the above assumptions, Δ14C at the sampling location (68.5° N) in Finland (Figure 7) can be calculated by equalizing the sum of 14C amounts of the latitudes with OR_14CO2 of Equation (6), similar to obtaining HE 1sb FO (supplementary materials). The calculated Δ14C result, shown in Figure 7, can be checked against the “14C spike production time” sheet in the supplementary materials.
 $${\rm{OR}}\_{}^{14}C{O_2} = \,^{14}\!\!{C_{M12}} \times Tropos\_ratio \times \left( {1 - exp\left( { - \left( {T \times LN\left( 2 \right)} \right)/{T_{1/2}}} \right)} \right)$$
where 14 C M12 represents the total 14C produced in M12, Trospos_ratio (30%) represents the proportion of 14C produced in the troposphere, and T represents the time after the abrupt increase in the production of 14C.
Comparison of Δ14C measured in Finland with Δ14C (“14C spike production time” sheet in the supplementary materials) calculated according to various HOTs.

Estimation of Time of 14C Spike Production
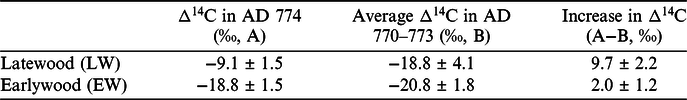
As shown in Table 4, which gives the Δ14C results of Finnish wood, the Δ14C increase in earlywood in AD 774 was 2.0 ± 1.2, and that of latewood was 9.7 ± 2.2 (Uusitalo et al. Reference Uusitalo, Arppe, Hackman and Helama2018). The Δ14C increase of earlywood in AD 774 was calculated from the difference between the amount of 14C in earlywood in AD 774 and the average Δ14C of earlywood from AD 770 to 773, whereas the Δ14C increase of latewood in AD 774 was calculated from the difference between the amount of 14C in latewood in AD 774 and the average Δ14C of latewood from AD 770–773.
Increases in Δ14C of earlywood (EW) and latewood (LW) in AD 774 (Uusitalo et al. Reference Uusitalo, Arppe, Hackman and Helama2018) were estimated. The increases in the Δ14C of EW and LW in AD 774 were calculated from the difference between the Δ14C values of EW and LW in AD 774 and the average Δ14C values of EW and LW from AD 770–773.
The onset date of cambium division and the length of the growing season vary from year to year as well as over a longer scale because tree phenology and climate variability (temperature) influence cell production and the calendar dates of early- and latewood formation. However, the tree ring width (TRW) of 2000-year tree rings does not show summer temperatures in Finland (Esper et al. Reference Esper and Frank2012) or certain other trends. Thus, although estimation from cambium division and xylem formation can still result in errors due to phenology and climate variability, we can attempt to estimate the onset times of early- and latewood, as well as the end time of latewood, of a Scots pine tree from AD 775 based on their times in recent Scots pine trees. The onset time of the earlywood of a Scots pine tree used for the measurement of M12 was June 11 ± 5; the onset time of latewood was July 10 ± 5, and the end time of latewood was August 26 ± 9 (Seo et al. Reference Seo, Salminen, Jalkanen and Eckstein2010, Reference Seo, Eckstein, Jalkanen and Schmitt2011; Cuny et al. Reference Cuny, Rathgeber, Frank and Fonti2015; supplementary materials). The onset time of earlywood of the Scots pine tree was defined as the onset time of the radial growth of earlywood; the onset time of latewood was defined as the onset time of the radial growth of latewood (Seo et al. Reference Seo, Salminen, Jalkanen and Eckstein2010, Reference Seo, Eckstein, Jalkanen and Schmitt2011). However, the end time of latewood was defined as the sum of the end time of the radial growth of latewood and the time lag (27 days) between the woody biomass production and xylem size increase (radial growth) in the boreal region, as woody biomass production proceeds after the end time of the xylem size increase (Seo et al. Reference Seo, Salminen, Jalkanen and Eckstein2010, Reference Seo, Eckstein, Jalkanen and Schmitt2011; Cuny et al. Reference Cuny, Rathgeber, Frank and Fonti2015).
The time required for trees to absorb CO2 from the air via photosynthesis and produce tree ring tissue via metabolism is approximately one month (Grootes et al. Reference Grootes, Farwell, Schmidi, Leach and Stuiver1989). Air mixing and the oxidation of 14C in the troposphere occur simultaneously; however, the oxidation of 14C proceeds at a significantly slower rate. Although the rate of air mixing between different latitudes is slower, the air mixing times at the sampling location in Finland and similar latitudes were considered negligible due to westerly winds. The Δ14C in the early- and latewood periods in Finland (Figure 7) noted in the preceding paragraph were calculated under the assumptions of a linear increase in Δ14C with an increase in latitude (supplementary materials), HOT, and a one-month delay between photosynthesis and metabolism. The Volz et al. Reference Volz, Tönnissen, Ehhalt and Khedim1980; χ2 values were obtained from the difference (divided by measurement error) between the Δ14C values of early- and latewood in Finland and the calculated Δ14C values.
 $$\chi ^2 = \left( \Delta ^{14}C_m - \Delta ^{14}C_c \right)_E^2 /\sigma _{m,E}^2 + \left( \Delta ^{14}C_m -\Delta ^{14}C_m\right)_L^2/\sigma _{m,L}^2$$
where m represents a Δ14C measurement in Finland, c represents a Δ14C calculation, Σ represents the error of Δ14C measurements in Finland, E represents early wood, and L represents late wood.
The occurrence time of the abrupt increase in 14C production was approximately mid-May (5.3 months) from a minimum χ2 value of 0.56. Although the occurrence time of the 14C spike obtained by Güttler et al. (Reference Güttler, Adolphi and Beer2015) was between September AD 774 and September AD 775, and that by Büntgen et al. (Reference Büntgen and Lukas2018) was between June and August of AD 774, the calculation in this study yielded an occurrence time of approximately mid-May (5.3 months) in AD 774, i.e., a few months earlier than the estimation by Büntgen. This difference can be attributed to the consideration of the oxidation times of 14C in this study.
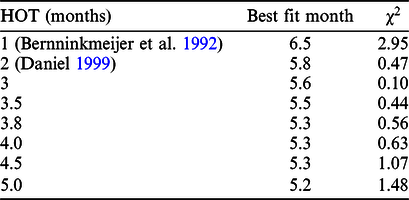
The value of HOT can vary from 1 to 6 months due to variation in the amount of 14C produced in the troposphere. The month of the abrupt increase in 14C with the lowest χ2 value for each HOT is presented in Table 5. This result indicates that the occurrence time of the abrupt increase in production of 14C was from late April to mid-June in AD 774. This is still a few months earlier than the estimation by Büntgen (Büntgen et al. Reference Büntgen and Lukas2018) and 10 months earlier than that made by Güttler (Güttler et al. Reference Güttler, Adolphi and Beer2015). These differences are mainly due to the lack of consideration of 14C oxidation time.
According to variations in HOT, the month of the abrupt increase in 14C with the lowest value of χ2 for each HOT is presented.
CONCLUSION
We measured Δ14C values for the early- and latewood tree rings of Zelkova serrata from AD 762–776 at Bangu-dong, Ulsan, South Korea, confirming the presence of M12 in a South Korean tree.
A comparison of the results obtained in this study and those from previous studies suggests that, in addition to the latitude dependence of the highest Δ14C values of M12 (Büntgen et al. Reference Büntgen and Lukas2018), the height of the early rise in Δ14C in AD 774 also varied according to latitude; we did not see an identifiable early rise in Δ14C in either the early- or latewood of AD 774 in South Korea, whereas a notable early rise in Δ14C in the latewood of AD 774 was observed at high latitudes (Finland).
The HOT of 14C produced in the air could be estimated by a detailed analysis of a small bomb peak from October AD 1961 to August AD 1962. The HOT of 14C was calculated to range from 2 to 7 months, based on analysis of a small bomb peak similar to M12 for the calculation of HOT, whereas the residence time of CO was estimated from sources and sinks of CO, although the residence time of CO and HOT were almost the same. From the estimated values of HOT, including another recent estimate (1 month, Brenninkmeijer et al. Reference Brenninkmeijer and Manning1992; Daniel Reference Daniel1999), and a comparison of Δ14C values calculated and measured in the early- and latewood periods in Finland, the occurrence time of the abrupt increase in 14C production was estimated to have occurred sometime during the period of late April to mid-June in AD 774.
ACKNOWLEDGMENTS
This research was supported by the Basic Research Project of the Korea Institute of Geoscience and Mineral Resources (KIGAM), funded by the Ministry of Science and ICT of South Korea. The English in this document has been checked by at least two professional editors, both native English speakers. For a certificate, please see: http://www.textcheck.com/certificate/L6W55i.
Supplementary material
To view supplementary material for this article, please visit https://doi.org/10.1017/RDC.2020.69


 Open access