

1. Introduction
Phillips (Reference Phillips1958) first found an inverse relationship between inflation and unemployment,Footnote 1 which has been verified by Samuelson and Solow (Reference Samuelson and Solow1960) shortly thereafter. Today, it is well-known that this relationship between inflation and unemployment crucially depends on the degree of anchoring of inflation expectations (Blanchard, Reference Blanchard2016; Ball and Mazumder, Reference Ball and Mazumder2019). If inflation expectations are strongly anchored in the sense that they correspond to the inflation target of the central bank,Footnote 2 there is a (temporary) relationship between inflation and unemployment. However, if inflation expectations are not anchored, the relationship solely exists between unemployment and the change in inflation (Blanchard, Reference Blanchard2016).Footnote 3 This underlines the importance of expectation building by market participants in this context. Therefore, the present study aims to shed further light on the way how expectations are made by professional forecasters and especially, whether they are in line with the concept of the Phillips curve. In doing so, we exploit the variation of expectations regarding inflation and unemployment across forecasters, over time and across different horizons given in the ECB Survey of Professional Forecasters, and we estimate an expectation-based version of the Phillips curve.
An increase in the degree of anchoring of inflation expectations is sometimes argued to result in a flattening of the slope of the Phillips curve (Jørgensen and Lansing, Reference Jørgensen and Lansing2019; Bundick and Smith, Reference Bundick and Smith2024; Barnichon and Mesters, Reference Barnichon and Mesters2021). Therefore, we explicitly account for the possibility of a nonlinear relationship between expectations regarding inflation and unemployment by considering the degree of anchoring of inflation expectations. For this purpose we apply a measure proxying the degree of anchoring by exploiting the information in both point and density forecasts for inflation taken from the ECB Survey of Professional Forecasters. In this context, we follow Czudaj (Reference Czudaj2023a) extending the approach proposed by Bems et al. (Reference Bems, Caselli, Grigoli and Gruss2021), which is based on three different features characterizing the degree of anchoring on an aggregate level, by considering six different features and by computing this measure on an individual level for each forecaster. When estimating our expectation-based version of the Phillips curve, we explicitly account for nonlinearity stemming from the degree of anchoring.
Furthermore, adding to the literature concerning spillovers between different dimensions of uncertainty (Klößner and Sekkel, Reference Klößner and Sekkel2014; Ter Ellen et al. Reference Ter Ellen, Verschoor and Zwinkels2019; Glas, Reference Glas2020; Caggiano et al. Reference Caggiano, Castelnuovo and Figueres2020; Thiem, Reference Thiem2020; Beckmann et al. Reference Beckmann, Davidson, Koop and Schüssler2023), we check whether an expectation-based relationship between inflation and unemployment also translates into an association between the uncertainties regarding inflation and unemployment. In doing so, we proxy these uncertainties by individual forecasters’ standard deviations derived from their distributional forecasts for inflation and unemployment. In addition, we also study the heterogeneity across forecasters and over time when considering both types of Phillips curve relationships.
Therefore, the contribution of the present study compared to the existing literature is threefold. First, we do not solely focus on point forecasts when assessing the consistency of professional forecasts with the concept of the Phillips curve, but we also take forecasts for the whole distribution in account. Second, we explicitly address the role of anchoring of inflation expectations for the estimation of an expectation-based Phillips curve relationship. Third, we assess a Phillips curve-based link between uncertainty regarding inflation and unemployment. Our findings suggest that professional forecasters act in line with the Phillips curve for lower forecast horizons but not for medium-run forecasts. The inclusion of the anchoring measure indicates some nonlinearity in the relationship. In addition, we also find the existence of a co-movement of the uncertainties regarding future inflation and unemployment according to the Phillips curve.
The remainder of the paper is organized as follows: The next section reviews the most relevant literature. Section 3 provides an in-depth description of our dataset, including the construction of different measures we are considering and of our empirical methodology. Section 4 presents and discusses our empirical findings, while Section 5 concludes.
2. Review of the literature
In a general sense, the present paper extends the literature, which examines the expectation building mechanism using survey forecast data while focusing on the behavior of economic agents, and/or the macroeconomic models they rely upon (Coibion and Gorodnichenko, Reference Coibion and Gorodnichenko2012, Reference Coibion and Gorodnichenko2015a; Bordalo et al. Reference Bordalo, Gennaioli, Ma and Shleifer2020; Czudaj, Reference Czudaj2022, Reference Czudaj2023b; Glas and Heinisch, Reference Glas and Heinisch2023). More specifically, the utilization of survey-based expectations data for the estimation of an expectation-based Phillips curve to study whether (professional) forecasters follow the concept of the Phillips curve when making their forecasts has already been considered in the previous literature. In this section, we briefly review the most closely related studies to make clear how the present study deviates from them.
In this vein, Dräger et al. (Reference Dräger, Lamla and Pfajfar2016) first compute the share of consumers in the University of Michigan survey of consumers, who form their expectations consistent with the Phillips curve in the sense that they expect increases in inflation corresponding with decreases in unemployment and vice versa. Then, they assess whether this share of consumers is affected by central bank communication or by the corresponding media reporting.
Fendel et al. (Reference Fendel, Lis and Rülke2011) use monthly data from the survey of professional forecasters conducted by Consensus Economics for the G7 economies to assess whether professionals form their expectations in line with the Phillips curve for the sample period from October 1989 to December 2007. Their study relies on fixed-event forecasts for the current and the next year and finds a negative relationship between unemployment and inflation for the short-run and/or the medium-run for all G7 economies except of Germany.Footnote 4 In addition, they also test for nonlinearity by the inclusion of the level of inflation uncertainty, a squared term for unemployment expectations, or a recession dummy. In this case, inflation uncertainty is proxied by the cross-sectional variance across forecasters, and therefore, actually is a measure of disagreement among forecasters, which does not necessarily correspond to the uncertainty of forecasters.Footnote 5 Rülke (Reference Rülke2012) extends this study to six Asian-Pacific countries.
Same as the present study, Frenkel et al. (Reference Frenkel, Lis and Rülke2011) also use data from the ECB Survey of Professional Forecasters for the sample period between 1999Q1 and 2010Q4 to reassess whether the expectation formation of professionals is in line with the Phillips curve after the global financial crisis by extending the regression model by a dummy variable for the crisis. They basically conclude that the global financial crisis has not changed the way how professional forecasters form their expectations. Casey (Reference Casey2020) extends this analysis by considering the surveys of professional forecasters of the ECB, the US Fed, and the Bank of England for a sample period until 2017 and by also focusing on estimates on an individual forecaster level. Clements (Reference Clements2024) also checks whether professional forecasters form the expectations in line with the Phillips curve by using U.S. Survey of Professional Forecasters data and estimating a hybrid Phillips curve for each individual forecaster while testing whether forecasters who started later to participate in the survey differ systematically from earlier participants.
To the best of our knowledge, none of the existing studies belonging to this strand of the literature has also considered the information inherent in density forecasts but solely rely on point forecasts. None of them has explicitly considered the role of anchoring as potential source of nonlinearity and none of them has assessed a Phillips curve based link between uncertainty regarding inflation and unemployment. The present study fills all these gaps. In addition, our sample period includes two recent interesting episodes: first, the period around 2014 and 2022 characterized by policy rates hitting the effective zero lower bound associated with low inflation rates (i.e., below the inflation target) and second, the period thereafter, in which inflation increased to historical levels and monetary policy has been tightened.
In addition, by relying on an individual measure of anchoring of inflation expectations, the present study also connects to the large literature studying whether inflation expectations are (de-)anchored using survey data, financial market data, or both (Gurkaynak et al. Reference Gürkaynak, Levin and Swanson2010; Jochmann et al. Reference Jochmann, Koop and Potter2010; Beechey et al. Reference Beechey, Johannsen and Levin2011; Galati et al. Reference Galati, Poelhekke and Zhou2011; Strohsal and Winkelmann, Reference Strohsal and Winkelmann2015; Scharnagl and Stapf, Reference Scharnagl and Stapf2015; Łyziak and Paloviita, Reference Łyziak and Paloviita2017; Natoli and Sigalotti, Reference Natoli and Sigalotti2018; Hachula and Nautz, Reference Hachula and Nautz2018; Buono and Formai, Reference Buono and Formai2018). Most recently, survey data have been used to construct anchoring measures (Grishchenko et al. Reference Grishchenko, Mouabbi and Renne2019; Bems et al. Reference Bems, Caselli, Grigoli and Gruss2021; Beckmann and Czudaj, Reference Beckmann and Czudaj2023; Czudaj, Reference Czudaj2023a). In the present paper, we especially follow Czudaj (Reference Czudaj2023a), who extends the approach proposed by Bems et al. (Reference Bems, Caselli, Grigoli and Gruss2021). The latter use survey data provided by Consensus Economics to construct an anchoring measure on an aggregated level for several economies based on three different metrics. Czudaj (Reference Czudaj2023a) considers six instead of three metrics characterizing the degree of anchoring and computes the measure on an individual forecaster level instead of using an aggregate for the economy as a whole. In addition, Czudaj (Reference Czudaj2023a) studies the association of the level of anchoring with expectations regarding the stance of monetary policy and different cost-push factors.
3. Data and empirical methodology
3.1 Data
3.1.1 Forecast survey data
The data have been collected from the ECB Survey of Professional Forecasters (SPF) for the quarterly sample period from 1999Q1 to 2023Q1. More precisely, we rely on individual fixed-horizon point forecasts and density forecasts for the inflation rate and the unemployment rate for the Euro Area. These forecasts have been made at the beginning of each quarter by various forecasters representing professional institutions (i.e., major banks and research institutes across the whole Euro Area). The fixed-horizon forecasts are provided for horizons of one-year-ahead, two-years-ahead, and five-years-ahead ( $h=1,2,5$
) and therefore allow a comparison between short-run expectations (
$h=1,2,5$
) and therefore allow a comparison between short-run expectations ( $h=1,2$
) and medium-run expectations (
$h=1,2$
) and medium-run expectations ( $h=5$
). Most of these professionals are probably familiar with the general concept of the Phillips curve and/or its economic foundation. Therefore, it appears to be interesting to study whether these professionals actually form their expectations regarding inflation and unemployment in line with the Phillips curve. The number of participating forecasters varies over the different waves of the survey between 30 and 61 within the considered sample period with a mean of about 42 forecasters and a total of 106 different institutions (see Figure A1).
$h=5$
). Most of these professionals are probably familiar with the general concept of the Phillips curve and/or its economic foundation. Therefore, it appears to be interesting to study whether these professionals actually form their expectations regarding inflation and unemployment in line with the Phillips curve. The number of participating forecasters varies over the different waves of the survey between 30 and 61 within the considered sample period with a mean of about 42 forecasters and a total of 106 different institutions (see Figure A1).
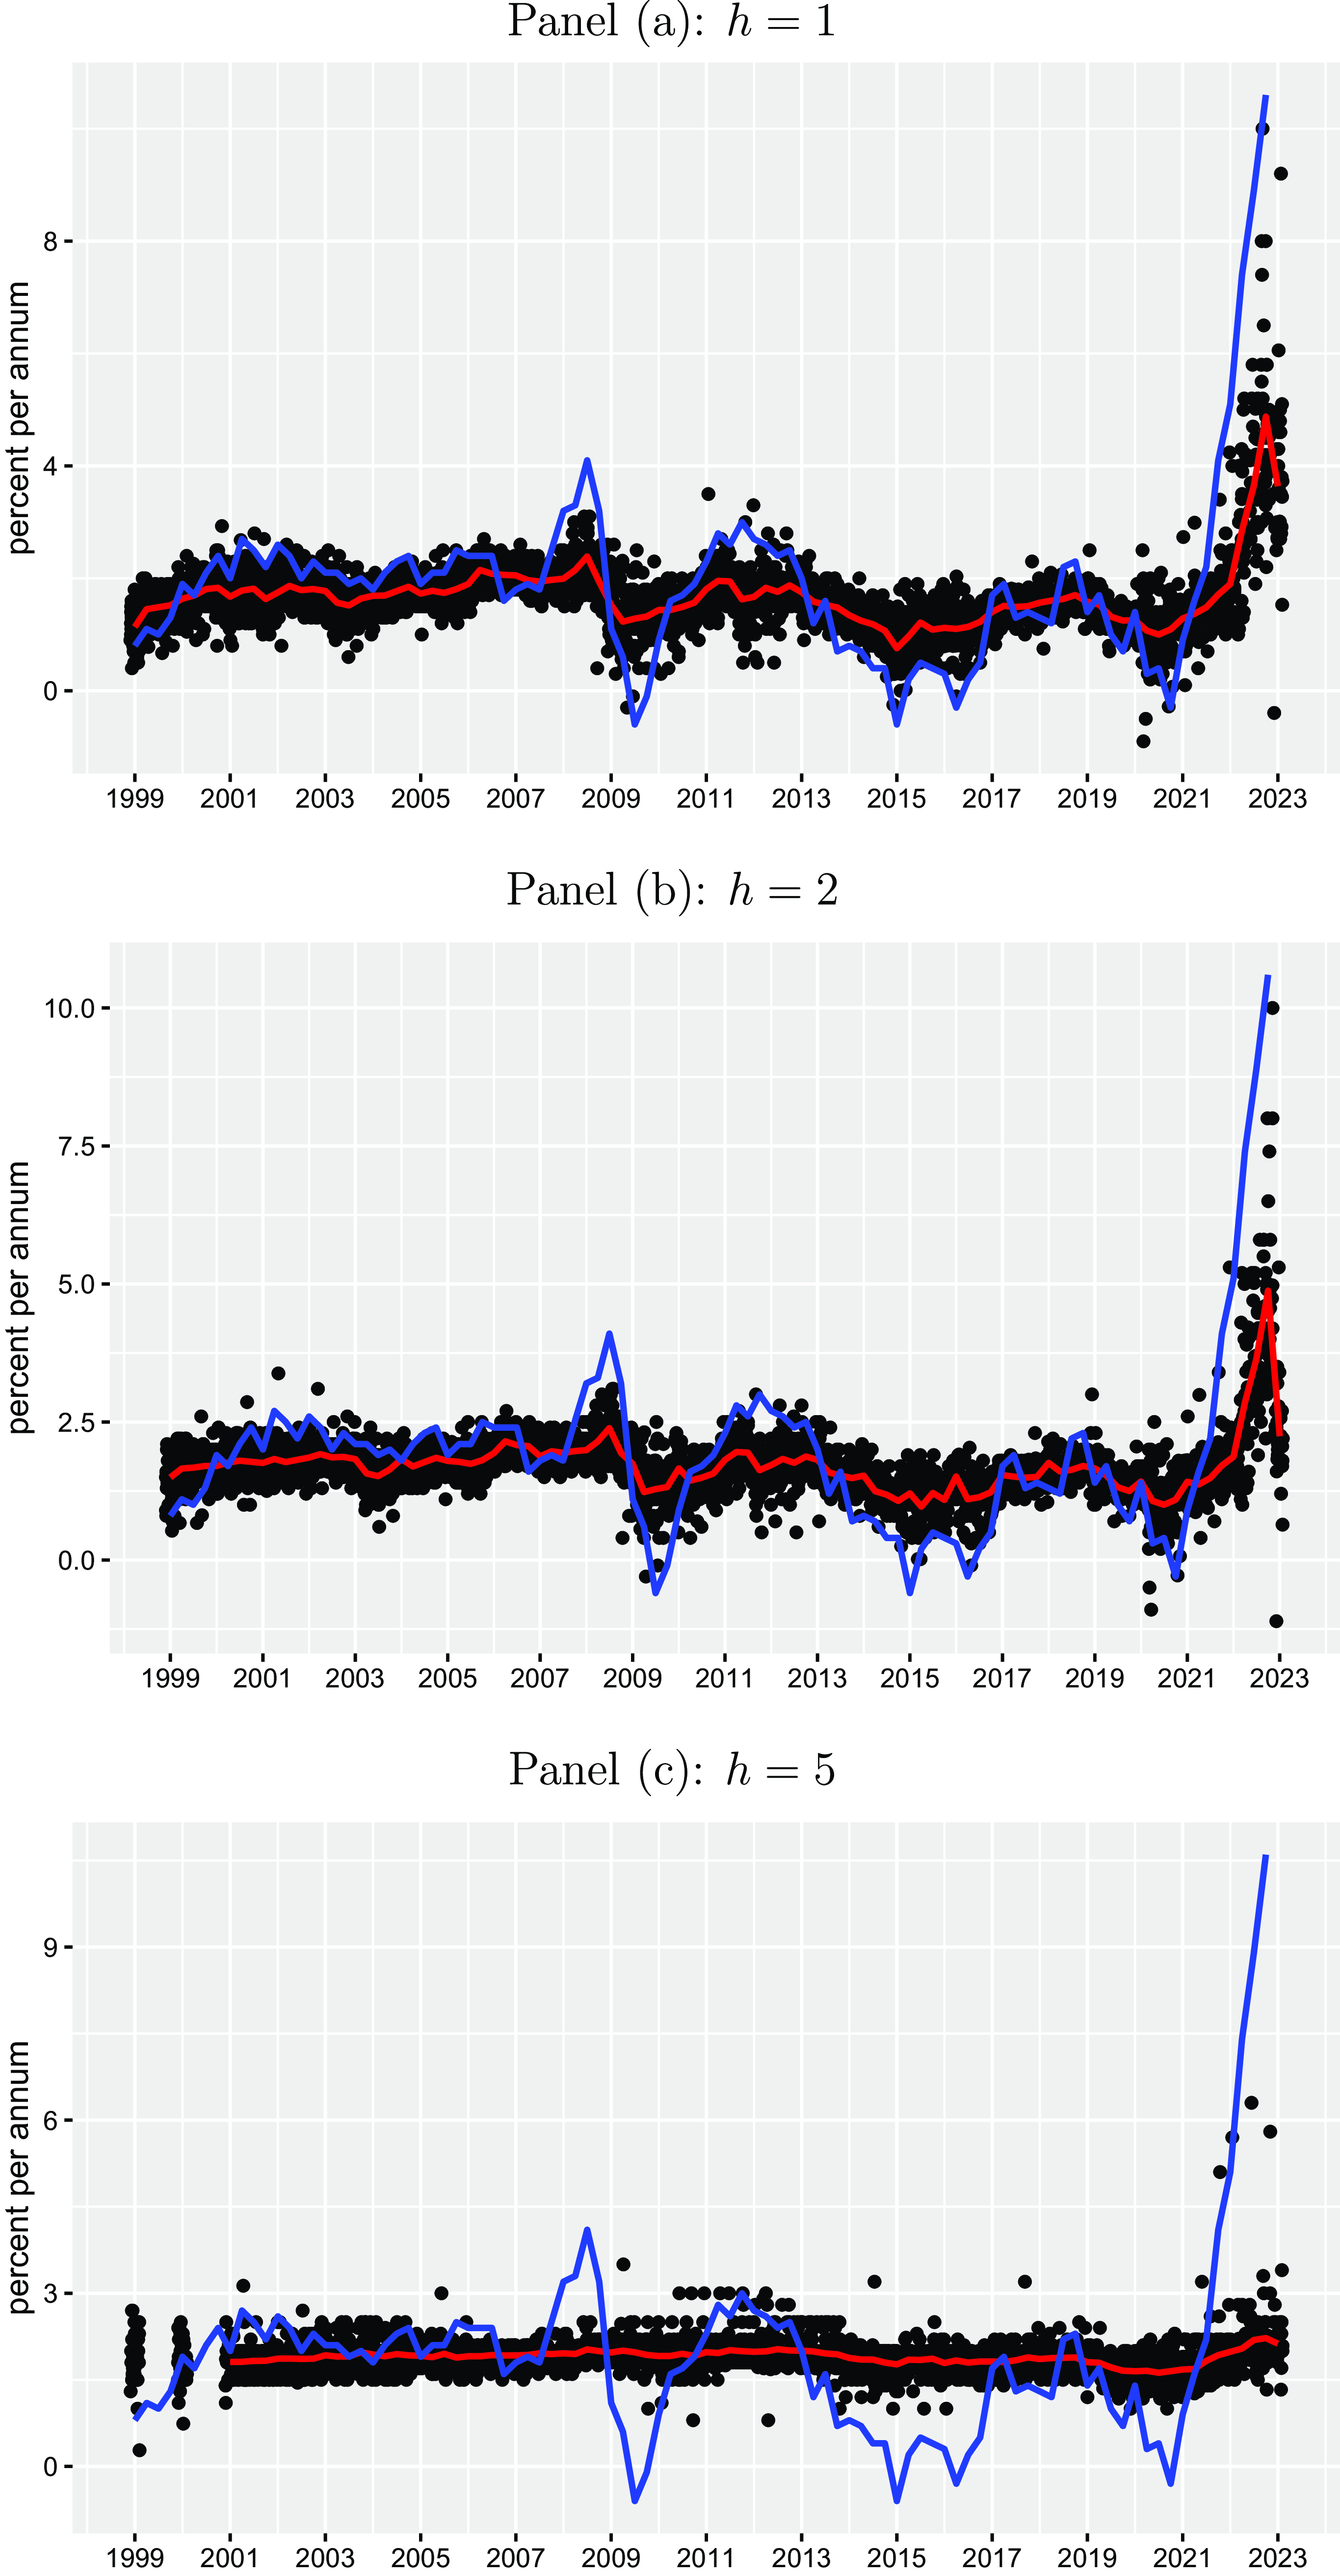
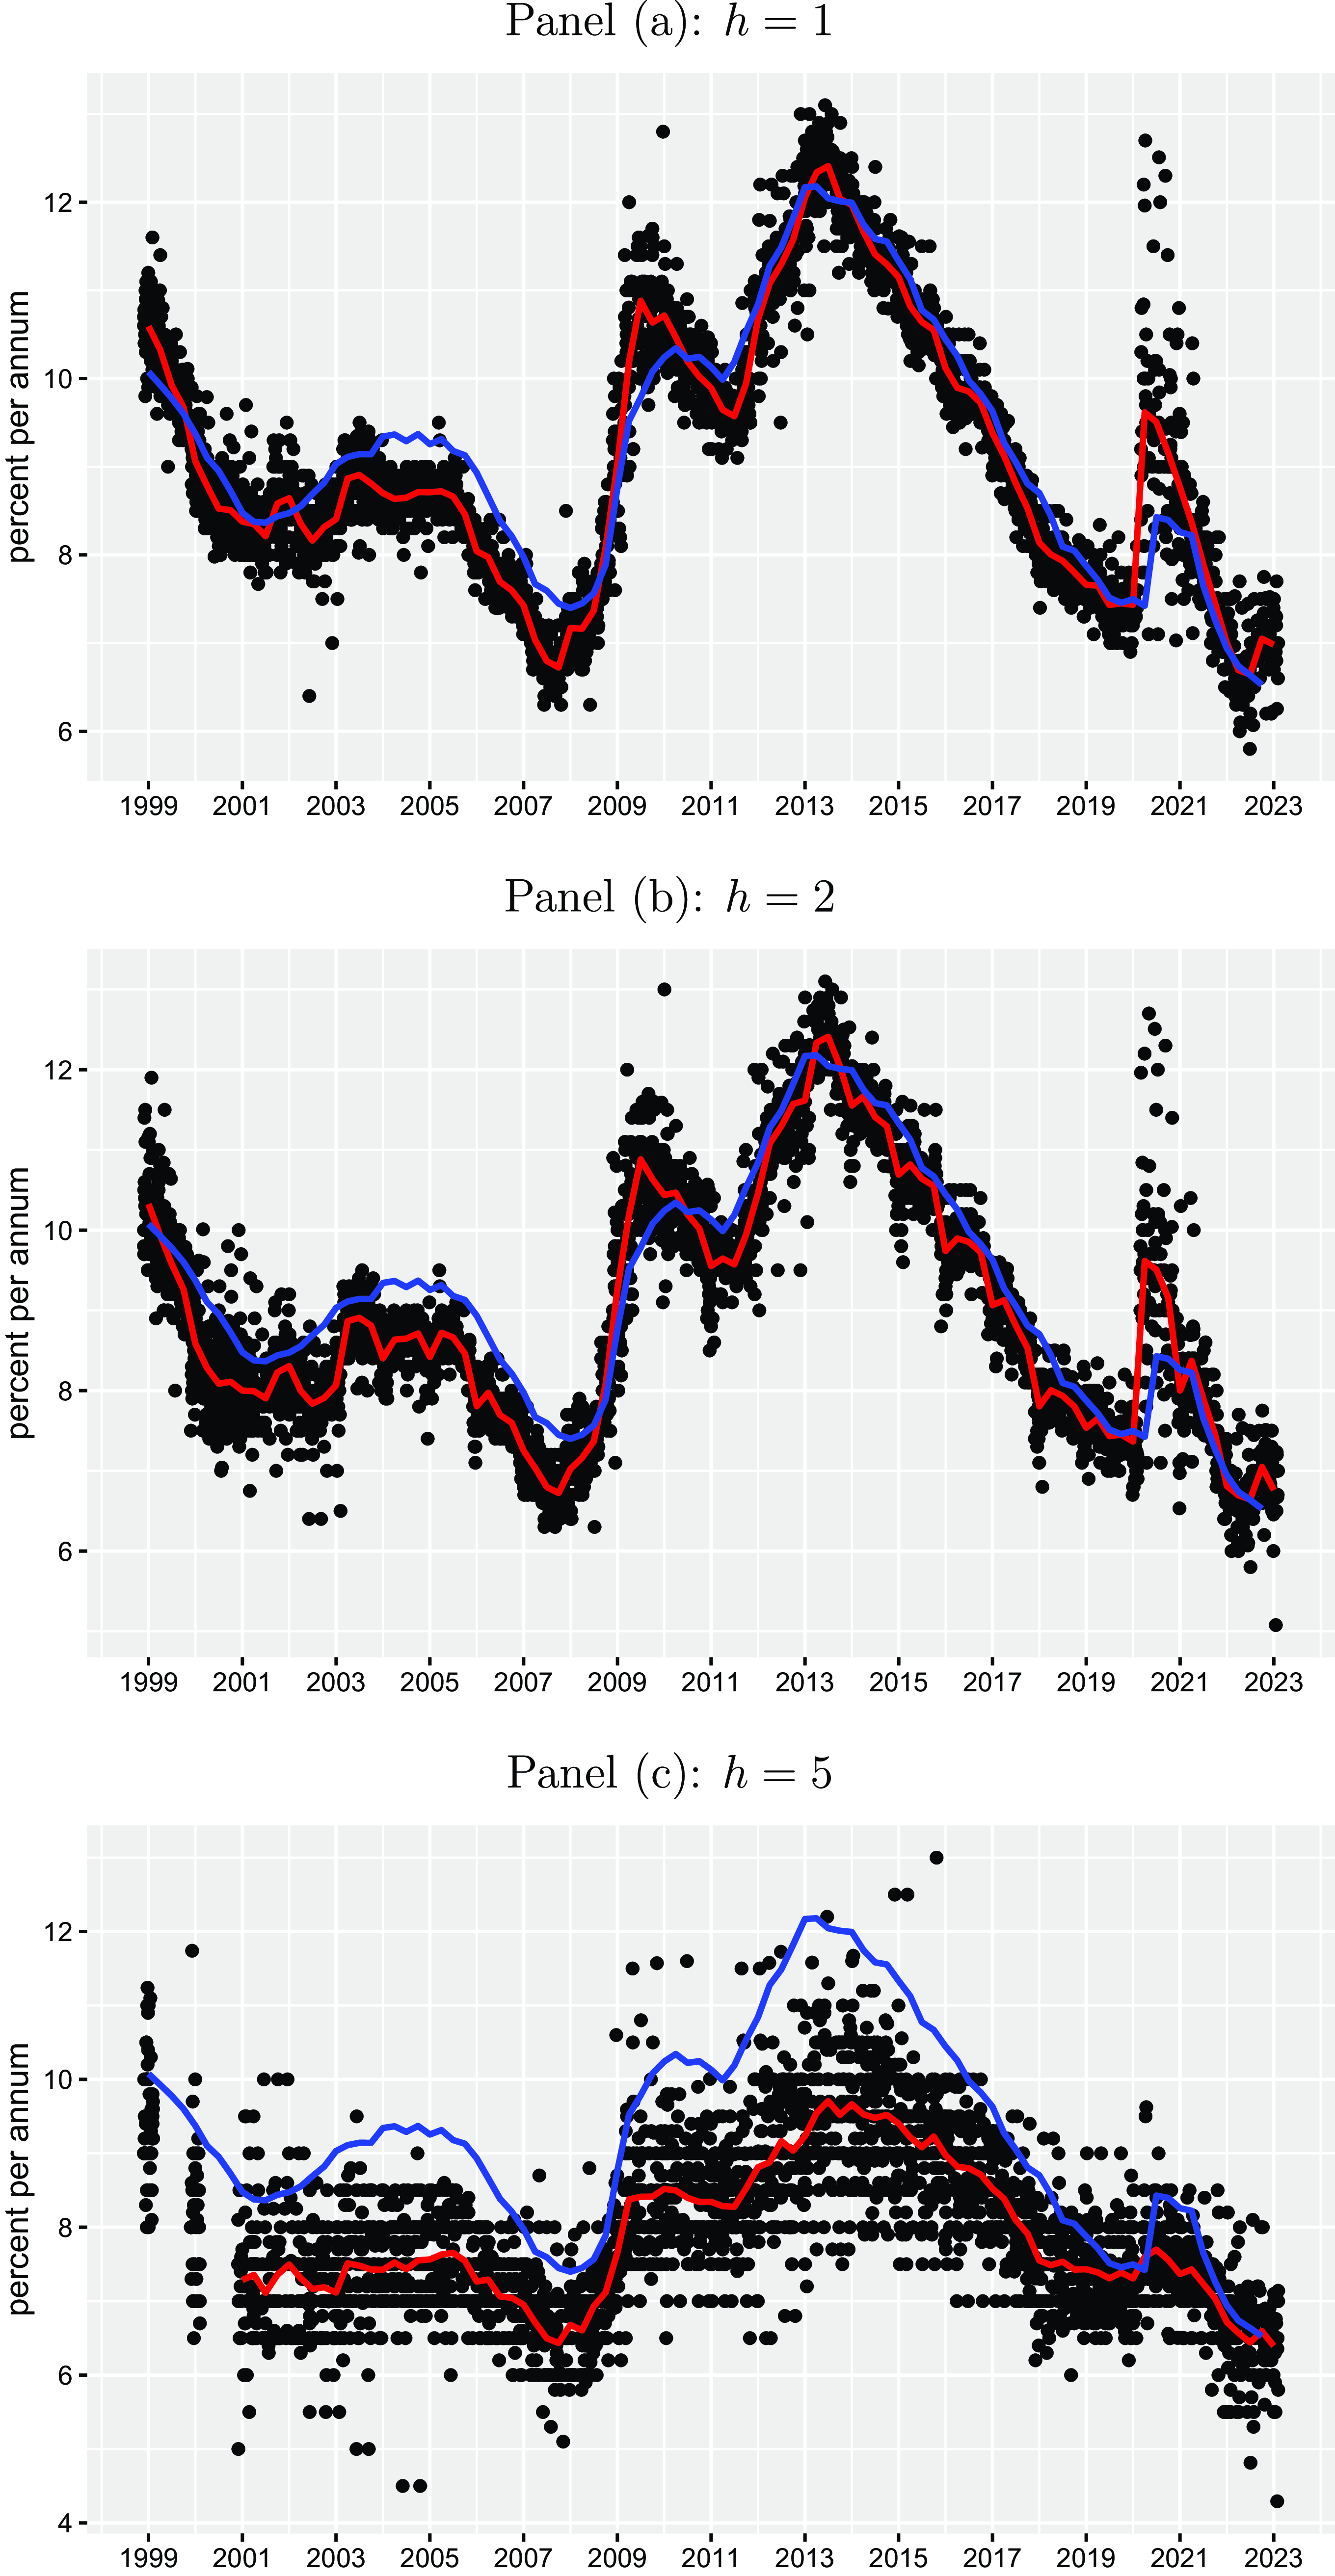
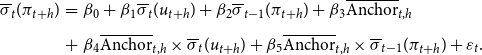
The black points in Figures 1 and 2 illustrate individual quarterly point forecasts for the inflation rate and the unemployment rate in the Euro Area (both in percent per annum) for the three horizons ( $h=1,2,5$
). The red lines provide the corresponding cross-sectional mean forecasts across forecasters for each point in time, and the blue lines illustrate realized inflation and unemployment rates (taken from ECB Statistical Data Warehouse) referring to the periods, at which the forecasts have been made. First of all, the graphs show that there is some degree of heterogeneity across the forecasters, which tends to increase in “crises periods” usually characterized by severe uncertainty. For inflation, the largest dispersion across forecasters is observed in the current high inflation period. For unemployment, the strongest disagreement among forecasters becomes evident in the first year of the COVID-19 pandemic between 2020 and 2021, where many forecasters have expected a much larger unemployment rate in the Euro Area than has actually been materialized. Second, we also see a clear difference between short-run horizon (
$h=1,2,5$
). The red lines provide the corresponding cross-sectional mean forecasts across forecasters for each point in time, and the blue lines illustrate realized inflation and unemployment rates (taken from ECB Statistical Data Warehouse) referring to the periods, at which the forecasts have been made. First of all, the graphs show that there is some degree of heterogeneity across the forecasters, which tends to increase in “crises periods” usually characterized by severe uncertainty. For inflation, the largest dispersion across forecasters is observed in the current high inflation period. For unemployment, the strongest disagreement among forecasters becomes evident in the first year of the COVID-19 pandemic between 2020 and 2021, where many forecasters have expected a much larger unemployment rate in the Euro Area than has actually been materialized. Second, we also see a clear difference between short-run horizon ( $h=1,2$
) and medium-run horizon (
$h=1,2$
) and medium-run horizon ( $h=5$
) forecasts. We basically see for both macro variables that short-run forecasts are usually closely related to current realizations but medium-run forecasts are not. Five-years-ahead inflation forecasts are very constant over the sample period lying on average pretty close to the inflation target of the ECB of 2%. This illustrates that inflation expectations were strongly anchored over the sample period, although we also see a mild drift in the most recent high inflation period. Except for this recent period, unemployment expectations for
$h=5$
) forecasts. We basically see for both macro variables that short-run forecasts are usually closely related to current realizations but medium-run forecasts are not. Five-years-ahead inflation forecasts are very constant over the sample period lying on average pretty close to the inflation target of the ECB of 2%. This illustrates that inflation expectations were strongly anchored over the sample period, although we also see a mild drift in the most recent high inflation period. Except for this recent period, unemployment expectations for $h=5$
were on average much lower than realized unemployment. When assuming that professionals build their medium-run unemployment expectations based on their view about the “natural rate of unemployment,” this would imply that they have considered a negative output gap over the entire sample period resulting in a too low inflation rate according to the Phillips curve relationship.
$h=5$
were on average much lower than realized unemployment. When assuming that professionals build their medium-run unemployment expectations based on their view about the “natural rate of unemployment,” this would imply that they have considered a negative output gap over the entire sample period resulting in a too low inflation rate according to the Phillips curve relationship.
Inflation point forecasts. The black points represent individual quarterly point forecasts for the inflation rate in the Euro Area (in percent per annum) for different horizons $h$
(one-year-ahead, two-years-ahead, and five-years-ahead) for the period from 1999Q1 to 2023Q1 taken from the ECB Survey of Professional Forecasters. The red lines provide the corresponding cross-sectional mean forecasts across forecasters for each point in time and the blue lines illustrate realized inflation rates (taken from ECB Statistical Data Warehouse) referring to the periods, at which the forecasts have been made.
$h$
(one-year-ahead, two-years-ahead, and five-years-ahead) for the period from 1999Q1 to 2023Q1 taken from the ECB Survey of Professional Forecasters. The red lines provide the corresponding cross-sectional mean forecasts across forecasters for each point in time and the blue lines illustrate realized inflation rates (taken from ECB Statistical Data Warehouse) referring to the periods, at which the forecasts have been made.
Unemployment point forecasts. The black points represent individual quarterly point forecasts for the unemployment rate in the Euro Area (in percent per annum) for different horizons $h$
(one-year-ahead, two-years-ahead, and five-years-ahead) for the period from 1999Q1 to 2023Q1 taken from the ECB Survey of Professional Forecasters. The red lines provide the corresponding cross-sectional mean forecasts across forecasters for each point in time, and the blue lines illustrate realized inflation rates (taken from ECB Statistical Data Warehouse) referring to the periods, at which the forecasts have been made.
$h$
(one-year-ahead, two-years-ahead, and five-years-ahead) for the period from 1999Q1 to 2023Q1 taken from the ECB Survey of Professional Forecasters. The red lines provide the corresponding cross-sectional mean forecasts across forecasters for each point in time, and the blue lines illustrate realized inflation rates (taken from ECB Statistical Data Warehouse) referring to the periods, at which the forecasts have been made.
While several existing studies on the expectation formation mechanism rely on the point forecasts taken from this data set (see e.g., Andrade and Le Bihan, Reference Andrade and Le Bihan2013; Dovern, Reference Dovern2015; Czudaj, Reference Czudaj2022, Reference Czudaj2023b), the information inherent in the density forecasts have rarely been exploited (see e.g. Abel et al. Reference Abel, Rich, Song and Tracy2016). Therefore, in the next subsection, we also consider density forecasts for our analysis.
3.1.2 Distributional forecasts
The participants are also asked to assign subjective probabilities ( $p_{i,k,t,h}$
) to predefined intervals, into which the inflation rate and the unemployment rate might fall. These probability distributions provide individual forecasts for the entire distribution, which also include information about the uncertainty surrounding the point forecasts as well as the skewness and kurtosis. Nowadays, tail probabilities are also considered being relevant to assess the likelihood of “inflation disasters” (Hilscher et al. Reference Hilscher, Raviv and Reis2022).
$p_{i,k,t,h}$
) to predefined intervals, into which the inflation rate and the unemployment rate might fall. These probability distributions provide individual forecasts for the entire distribution, which also include information about the uncertainty surrounding the point forecasts as well as the skewness and kurtosis. Nowadays, tail probabilities are also considered being relevant to assess the likelihood of “inflation disasters” (Hilscher et al. Reference Hilscher, Raviv and Reis2022).
Therefore, to foster our understanding on the expectation formation mechanism, we extract individual information from distributional forecasts by following Abel et al. (Reference Abel, Rich, Song and Tracy2016) and Glas and Hartmann (Reference Glas and Hartmann2022). In doing so, we rely on the “mass-at-midpoint” approach and compute the following measures:
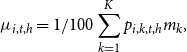 \begin{equation} \mu _{i,t,h} = 1/100\sum _{k=1}^Kp_{i,k,t,h}m_k, \end{equation}
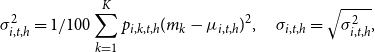 \begin{equation} \sigma ^2_{i,t,h} = 1/100\sum _{k=1}^Kp_{i,k,t,h}(m_k-\mu _{i,t,h})^2,\quad \sigma _{i,t,h}=\sqrt{\sigma ^2_{i,t,h}}, \end{equation}
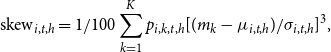 \begin{equation} \text{skew}_{i,t,h} = 1/100\sum _{k=1}^Kp_{i,k,t,h}[(m_k-\mu _{i,t,h})/\sigma _{i,t,h}]^3, \end{equation}
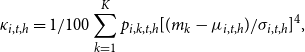 \begin{equation} \kappa _{i,t,h} = 1/100\sum _{k=1}^Kp_{i,k,t,h}[(m_k-\mu _{i,t,h})/\sigma _{i,t,h}]^4, \end{equation}
where $\mu _{i,t,h}$
,
$\mu _{i,t,h}$
, $\sigma ^2_{i,t,h}$
,
$\sigma ^2_{i,t,h}$
, $\sigma _{i,t,h}$
,
$\sigma _{i,t,h}$
, $\text{skew}_{i,t,h}$
, and
$\text{skew}_{i,t,h}$
, and $\kappa _{i,t,h}$
denote individual forecasters’ mean, variance, standard deviation, skewness, and kurtosis, respectively. Moreover,
$\kappa _{i,t,h}$
denote individual forecasters’ mean, variance, standard deviation, skewness, and kurtosis, respectively. Moreover, $m_k$
represents the middle of each interval. and
$m_k$
represents the middle of each interval. and $K$
is the number of intervals.
$K$
is the number of intervals. $p_{i,k,t,h}$
stand for the individual probabilities assigned by forecasters, and
$p_{i,k,t,h}$
stand for the individual probabilities assigned by forecasters, and $i$
,
$i$
, $t$
,
$t$
, $h$
, and
$h$
, and $k$
are indexes for individual forecaster, period (i.e., quarter of a year), forecast horizon, and interval, respectively. In this context, it is also worth noting that the interior intervals in the ECB SPF have gaps of 0.1 percentage points between each other. These have been closed by extending the lower and upper bound of each interval by 0.05 following a convention in the existing literature (Abel et al. Reference Abel, Rich, Song and Tracy2016; Glas and Hartmann, Reference Glas and Hartmann2022). To compute the midpoints
$k$
are indexes for individual forecaster, period (i.e., quarter of a year), forecast horizon, and interval, respectively. In this context, it is also worth noting that the interior intervals in the ECB SPF have gaps of 0.1 percentage points between each other. These have been closed by extending the lower and upper bound of each interval by 0.05 following a convention in the existing literature (Abel et al. Reference Abel, Rich, Song and Tracy2016; Glas and Hartmann, Reference Glas and Hartmann2022). To compute the midpoints $m_k$
, the intervals in both tails of the distribution have been assumed to have a width that is double as wide as the width of the interior intervals.
$m_k$
, the intervals in both tails of the distribution have been assumed to have a width that is double as wide as the width of the interior intervals.
The means of the individual density forecasts $\mu _{i,t,h}$
are usually very close to the point forecasts provided by the forecasters for most of the forecasters, which shows that the distributional forecasts are largely consistent with the point forecasts. In the following, we especially rely on the individual standard deviations
$\mu _{i,t,h}$
are usually very close to the point forecasts provided by the forecasters for most of the forecasters, which shows that the distributional forecasts are largely consistent with the point forecasts. In the following, we especially rely on the individual standard deviations $\sigma _{i,t,h}$
as a proxy for forecasters’ ex ante uncertainty regarding their inflation and unemployment forecasts. The individual standard deviations
$\sigma _{i,t,h}$
as a proxy for forecasters’ ex ante uncertainty regarding their inflation and unemployment forecasts. The individual standard deviations $\sigma _{i,t,h}$
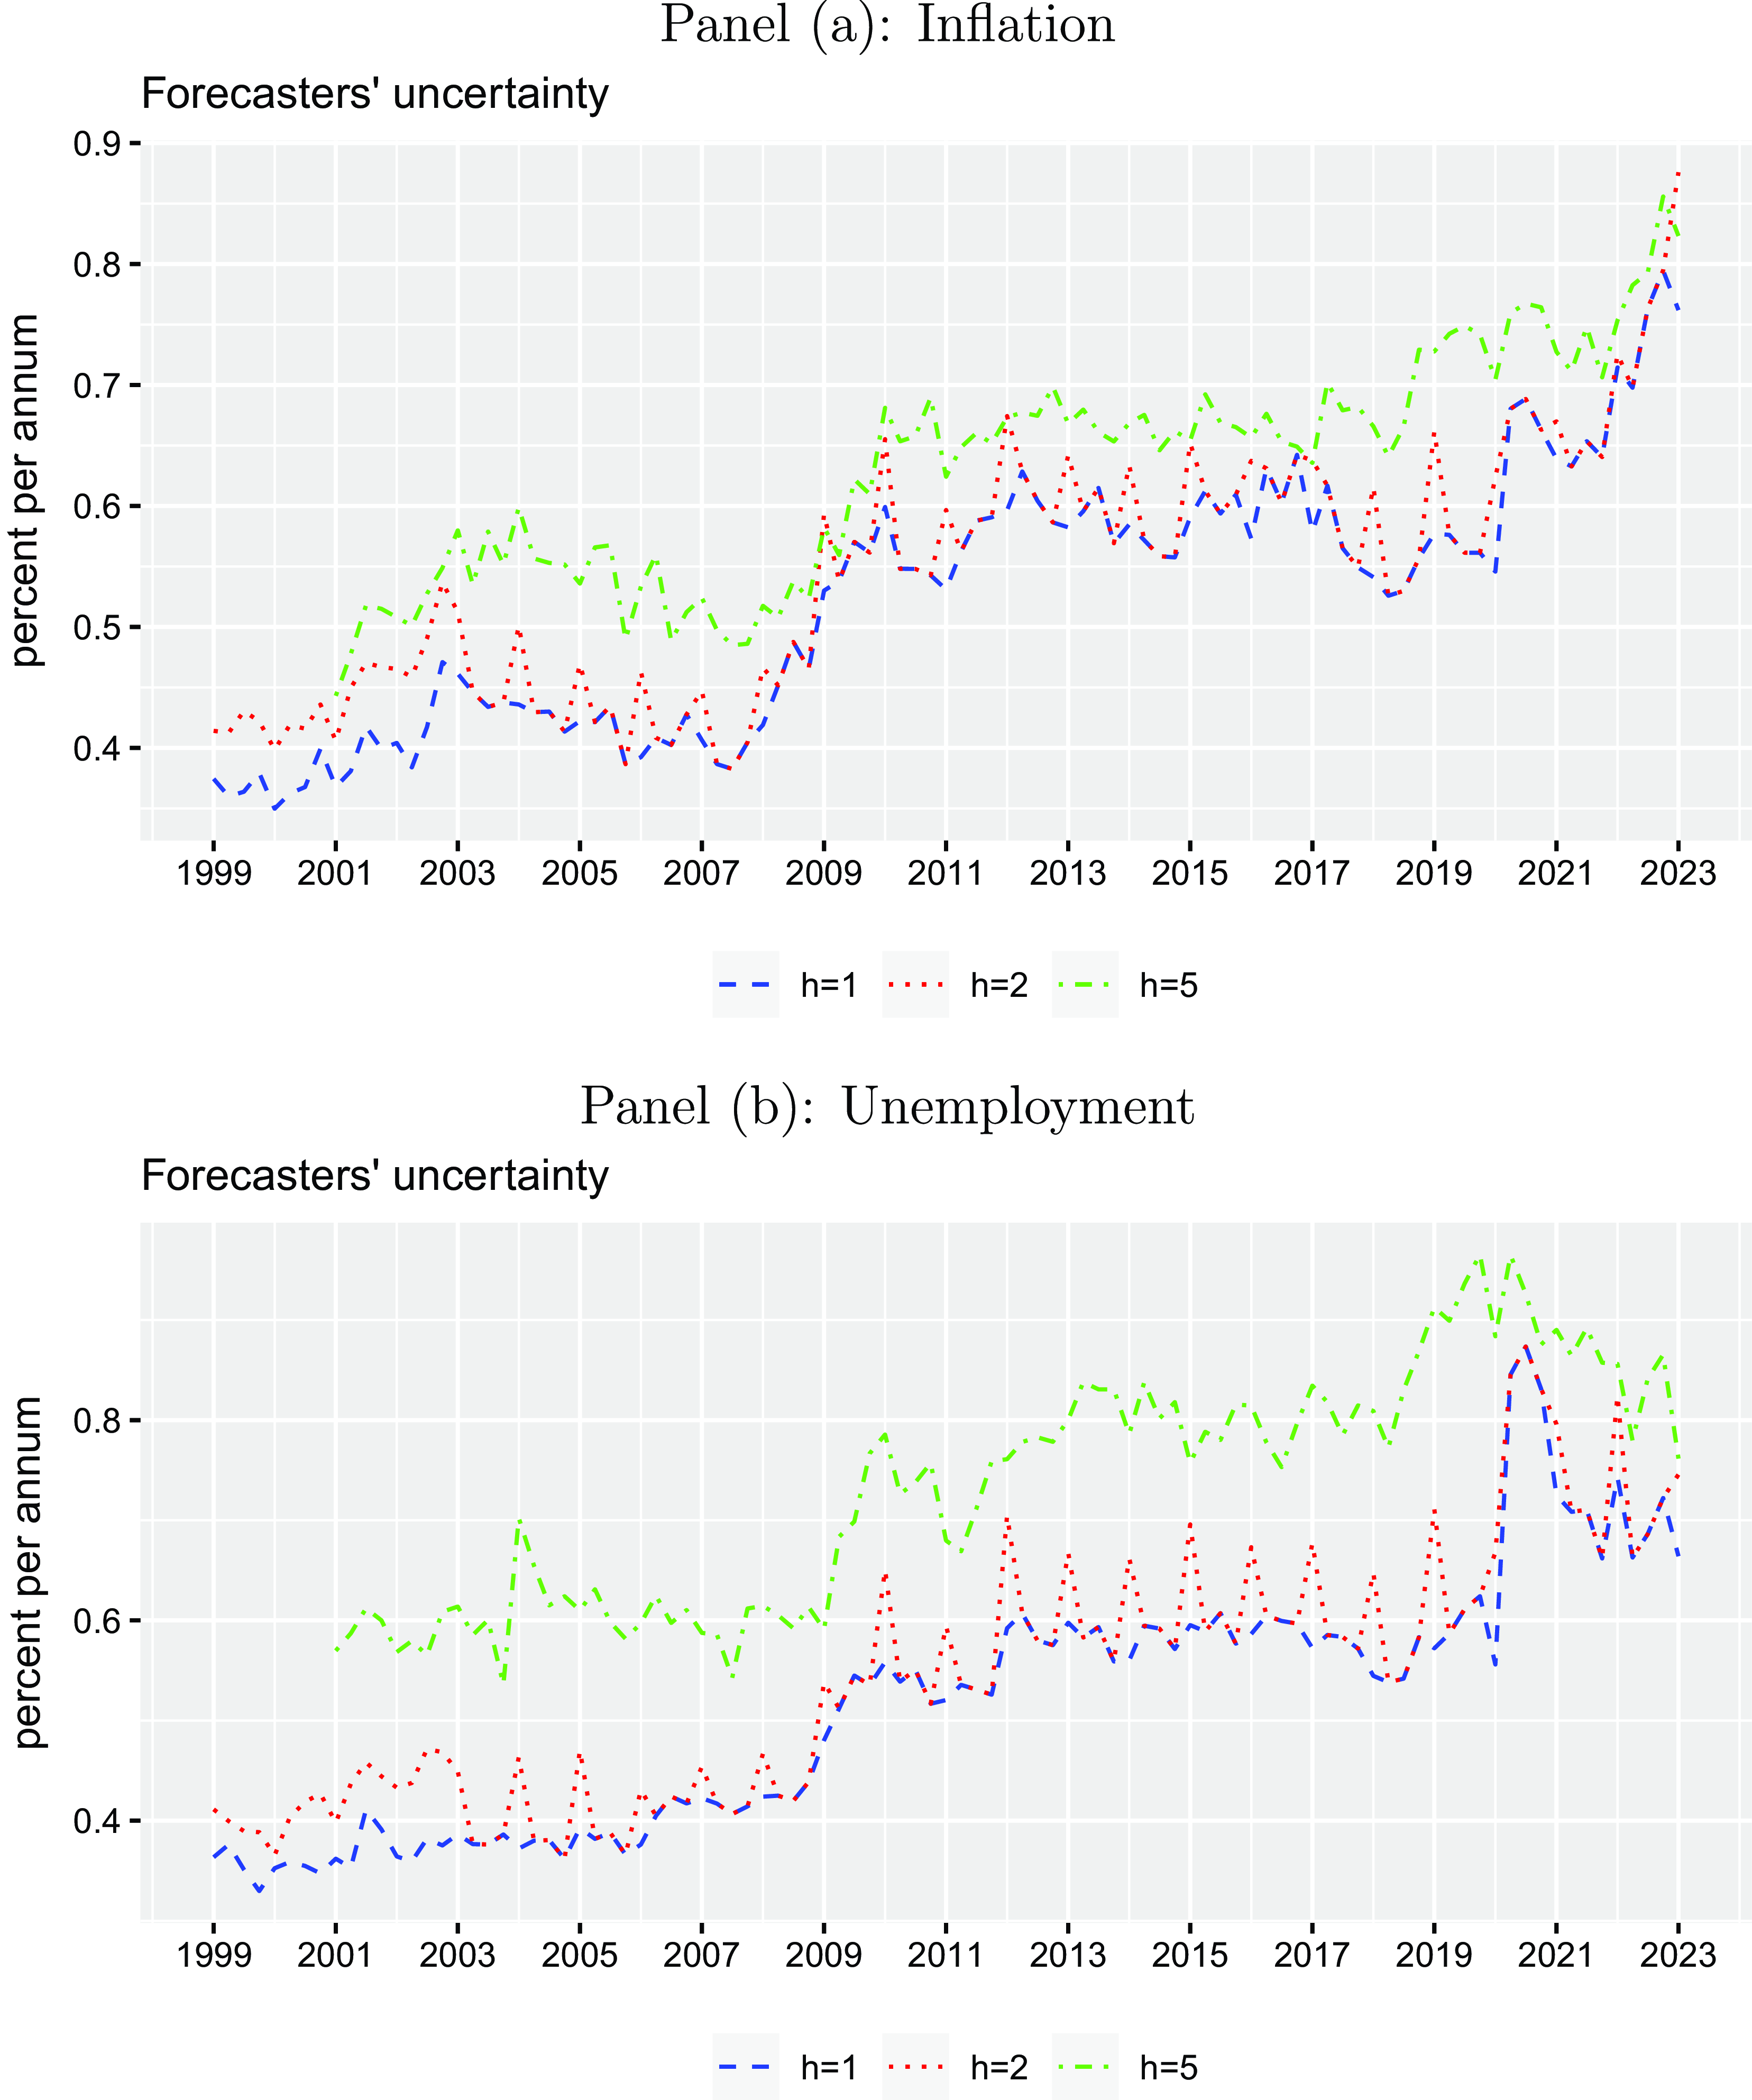
for inflation and unemployment forecasts are plotted over time in Figures A2 and A3 in the Appendix. Figure 3 shows the cross-sectional means across forecasters at each point in time for the three forecast horizons (
$\sigma _{i,t,h}$
for inflation and unemployment forecasts are plotted over time in Figures A2 and A3 in the Appendix. Figure 3 shows the cross-sectional means across forecasters at each point in time for the three forecast horizons ( $h=1,2,5$
). First of all, it becomes clear that uncertainty generally increases with the horizon
$h=1,2,5$
). First of all, it becomes clear that uncertainty generally increases with the horizon $h$
. Second, it also becomes evident that forecast uncertainty has substantially increased during the global financial crisis between 2008 and 2009 and has not returned to pre-crisis levels since then. Third, another severe rise in forecast uncertainty is observed in 2020—the first year of the COVID-19 pandemic. Unemployment forecast uncertainty has dropped since then while inflation forecast uncertainty has accelerated even further.
$h$
. Second, it also becomes evident that forecast uncertainty has substantially increased during the global financial crisis between 2008 and 2009 and has not returned to pre-crisis levels since then. Third, another severe rise in forecast uncertainty is observed in 2020—the first year of the COVID-19 pandemic. Unemployment forecast uncertainty has dropped since then while inflation forecast uncertainty has accelerated even further.
Forecasters’ uncertainty of density forecasts. The plots illustrate means of standard deviations across forecasters derived from individual quarterly density forecasts for the inflation rate and the unemployment rate in the Euro Area (in percent per annum) for different horizons $h$
(one-year-ahead, two-years-ahead, and five-years-ahead) for the period from 1999Q1 to 2023Q1 taken from the ECB Survey of Professional Forecasters.
$h$
(one-year-ahead, two-years-ahead, and five-years-ahead) for the period from 1999Q1 to 2023Q1 taken from the ECB Survey of Professional Forecasters.
3.1.3 Anchoring measure
We also use the information derived from distributional forecasts, to construct an individual forecasters’ proxy for the degree of anchoring of inflation expectations following Czudaj (Reference Czudaj2023a) and referring to Bems et al. (Reference Bems, Caselli, Grigoli and Gruss2021), who construct an anchoring measure on an aggregated level for several economies based on survey data provided by Consensus Economics.
Similar to Bems et al. (Reference Bems, Caselli, Grigoli and Gruss2021), our anchoring measure is based on six subindexes, which are computed for each individual forecaster (Czudaj, Reference Czudaj2023a):Footnote 6 First, we compute the absolute deviation of individual inflation expectations from the ECB’s inflation target of 2%:
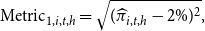 \begin{equation} \text{Metric}_{1,i,t,h}=\sqrt{(\widehat{\pi }_{i,t,h}-2\%)^2}, \end{equation}
where $\widehat{\pi }_{i,t,h}$
denotes inflation expectations of forecaster
$\widehat{\pi }_{i,t,h}$
denotes inflation expectations of forecaster $i$
made in period
$i$
made in period $t$
for horizon
$t$
for horizon $h$
with
$h$
with $h=1,2,5$
years. This metric is rooted in the idea that well-anchored inflation expectations should be very close to the inflation target. Hence, any deviation from the ECB’s target indicates a lower degree of anchoring.
$h=1,2,5$
years. This metric is rooted in the idea that well-anchored inflation expectations should be very close to the inflation target. Hence, any deviation from the ECB’s target indicates a lower degree of anchoring.
Second, we also take the absolute variation of inflation expectations from the forecaster-specific time-series mean:
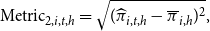 \begin{equation} \text{Metric}_{2,i,t,h}=\sqrt{(\widehat{\pi }_{i,t,h}-\overline{\pi }_{i,h})^2}, \end{equation}
where $\overline{\pi }_{i,h}$
is the time-series mean of inflation expectations for each forecaster
$\overline{\pi }_{i,h}$
is the time-series mean of inflation expectations for each forecaster $i$
. The idea behind
$i$
. The idea behind $\text{Metric}_{2,i,t,h}$
is that well- anchored inflation expectations rarely need to be revised by professionals.
$\text{Metric}_{2,i,t,h}$
is that well- anchored inflation expectations rarely need to be revised by professionals.
Third, we also calculate the dispersion of inflation expectations, i.e., the absolute difference of individual inflation expectations to the cross-sectional mean across forecasters:
 \begin{equation} \text{Metric}_{3,i,t,h}=\sqrt{(\widehat{\pi }_{i,t,h}-\overline{\pi }_{t,h})^2}, \end{equation}
where $\overline{\pi }_{t,h}$
represents the cross-sectional mean forecast across forecasters at each point in time. The rationale behind this metric is that professional forecasters should not strongly disagree regarding future inflation, if inflation expectations are well anchored. Therefore, a stronger disagreement indicates a lower degree of anchoring.
$\overline{\pi }_{t,h}$
represents the cross-sectional mean forecast across forecasters at each point in time. The rationale behind this metric is that professional forecasters should not strongly disagree regarding future inflation, if inflation expectations are well anchored. Therefore, a stronger disagreement indicates a lower degree of anchoring.
As further three metrics, following the idea of Czudaj (Reference Czudaj2023a), we take the uncertainty, skewness, and kurtosis derived from density forecasts as outlined in Section 3.1.2:
 \begin{equation} \text{Metric}_{4,i,t,h}=\sigma _{i,t,h},\quad \text{Metric}_{5,i,t,h}=\text{skew}_{i,t,h},\quad \text{Metric}_{6,i,t,h}=\kappa _{i,t,h}. \end{equation}
Finally, we aggregate the six anchoring metrics outlined above into one measure since they exhibit complementary features describing the degree of anchoring. First, the individual metrics are standardized across forecasters and over time to have a mean of zero and a variance of unity:
 \begin{equation} \text{Standard Metric}_{n,i,t,h}=-\dfrac{\left (\text{Metric}_{n,i,t,h}-\overline{\text{Metric}}_{n,h}\right )}{\sigma (\text{Metric})_{n,h}},\quad n=1,\ldots,6, \end{equation}
where $\overline{\text{Metric}}_{n,h}$
and
$\overline{\text{Metric}}_{n,h}$
and $\sigma (\text{Metric})_{n,h}$
stand for the sample average and the sample standard deviation of the corresponding metric across forecasters
$\sigma (\text{Metric})_{n,h}$
stand for the sample average and the sample standard deviation of the corresponding metric across forecasters $i$
and time periods
$i$
and time periods $t$
. In addition, we change the sign of each metric in equation (9) as in this case an increase (a decrease) of the corresponding measure indicates a higher (lower) degree of anchoring. This results in a straightforward interpretation of our anchoring measure. Second, we compute the simple mean across the six standardized metrics to get our final anchoring measure:
$t$
. In addition, we change the sign of each metric in equation (9) as in this case an increase (a decrease) of the corresponding measure indicates a higher (lower) degree of anchoring. This results in a straightforward interpretation of our anchoring measure. Second, we compute the simple mean across the six standardized metrics to get our final anchoring measure:
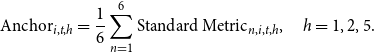 \begin{equation} \text{Anchor}_{i,t,h}=\dfrac{1}{6}\sum _{n=1}^6\text{Standard Metric}_{n,i,t,h},\quad h=1,2,5. \end{equation}
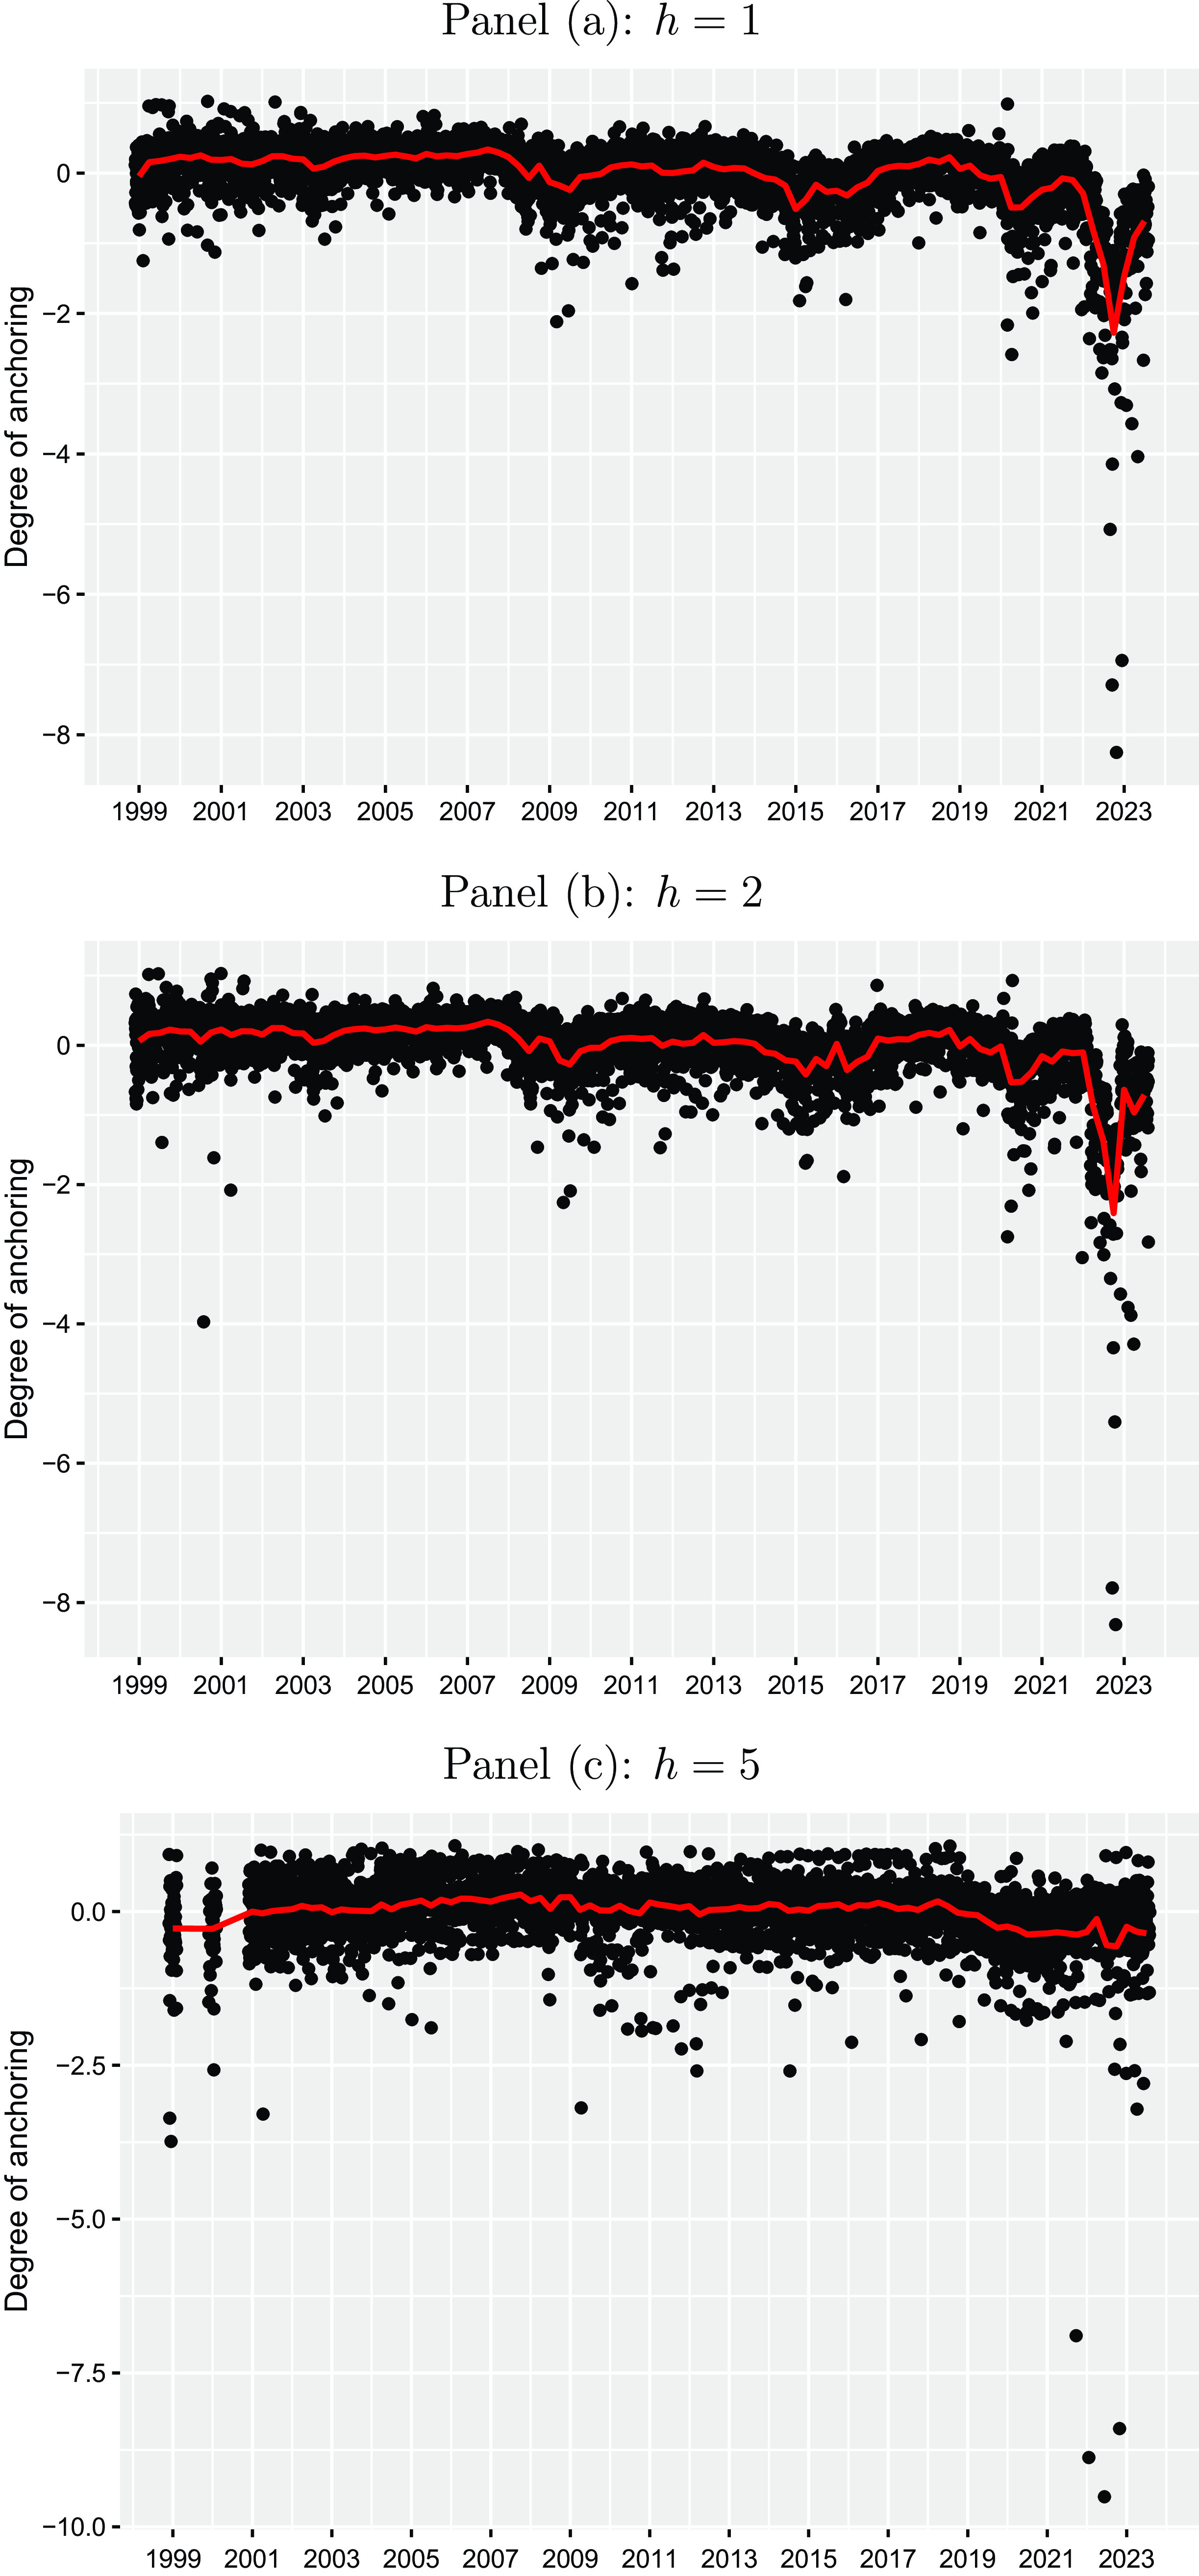
The resulting anchoring measure is illustrated in Figure 4 for each horizon ( $h=1,2,5$
), and each individual forecaster represented by the black dots and on an aggregated level visualized by the red line showing the cross-sectional mean. On average, it seems that inflation expectations have been widely anchored within the Euro Area for nearly the entire sample period. However, as discussed by Czudaj (Reference Czudaj2023a), we also see periods, in which some forecasters have believed in a de-anchoring of inflation expectations. For the short-run horizons (
$h=1,2,5$
), and each individual forecaster represented by the black dots and on an aggregated level visualized by the red line showing the cross-sectional mean. On average, it seems that inflation expectations have been widely anchored within the Euro Area for nearly the entire sample period. However, as discussed by Czudaj (Reference Czudaj2023a), we also see periods, in which some forecasters have believed in a de-anchoring of inflation expectations. For the short-run horizons ( $h=1,2$
), we also see mild evidence for a de-anchoring of inflation expectations for the period around the global financial crisis (2008–2009) and the beginning of the period of ultralow policy rates (2014–2016) on an aggregated level, where the cross-sectional means turn into negative. However, in the most recent high inflation period, we observe a clear de-anchoring, especially when focusing on the short-run horizon (
$h=1,2$
), we also see mild evidence for a de-anchoring of inflation expectations for the period around the global financial crisis (2008–2009) and the beginning of the period of ultralow policy rates (2014–2016) on an aggregated level, where the cross-sectional means turn into negative. However, in the most recent high inflation period, we observe a clear de-anchoring, especially when focusing on the short-run horizon ( $h=1,2$
). This evidence of a de-anchoring in some periods is roughly in line with previous studies for the Euro Area (Strohsal and Winkelmann, Reference Strohsal and Winkelmann2015; Łyziak and Paloviita, Reference Łyziak and Paloviita2017; Natoli and Sigalotti, Reference Natoli and Sigalotti2018; Buono and Formai, Reference Buono and Formai2018; Grishchenko et al. Reference Grishchenko, Mouabbi and Renne2019).Footnote
7
Again, when referring to the medium-run horizon (
$h=1,2$
). This evidence of a de-anchoring in some periods is roughly in line with previous studies for the Euro Area (Strohsal and Winkelmann, Reference Strohsal and Winkelmann2015; Łyziak and Paloviita, Reference Łyziak and Paloviita2017; Natoli and Sigalotti, Reference Natoli and Sigalotti2018; Buono and Formai, Reference Buono and Formai2018; Grishchenko et al. Reference Grishchenko, Mouabbi and Renne2019).Footnote
7
Again, when referring to the medium-run horizon ( $h=5$
), we do not see much indication of de-anchoring over most of the sample period on an aggregated level, although we also see a mild de-anchoring in the most recent period.
$h=5$
), we do not see much indication of de-anchoring over most of the sample period on an aggregated level, although we also see a mild de-anchoring in the most recent period.
Anchoring measures. The black points represent individual quarterly anchoring measures derived from information inherent in inflation point and density forecasts for different horizons $h$
(one-year-ahead, two-years-ahead, and five-years-ahead) for the period from 1999Q1 to 2023Q1 taken from the ECB Survey of Professional Forecasters. The red lines provide the corresponding cross-sectional means across forecasters for each point in time.
$h$
(one-year-ahead, two-years-ahead, and five-years-ahead) for the period from 1999Q1 to 2023Q1 taken from the ECB Survey of Professional Forecasters. The red lines provide the corresponding cross-sectional means across forecasters for each point in time.
3.2 Empirical methodology
We have constructed a large panel data set, which is used to estimate an expectation-based Phillips curve relationship to check whether professional forecasters build their forecasts in line with the concept of the Phillips curve. In doing so, we consider different versions of the following general regression model:
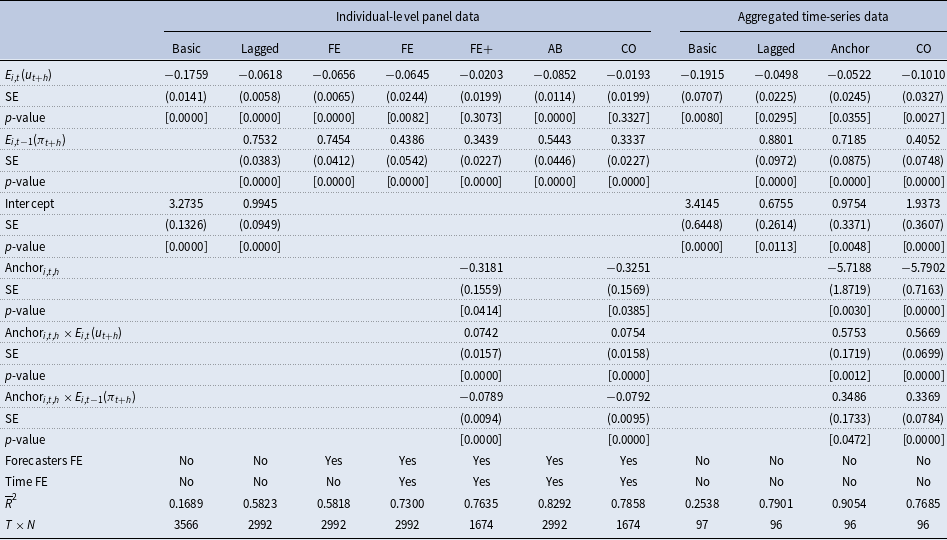
 \begin{eqnarray} E_{i,t}(\pi _{t+h})&=&\beta _1E_{i,t}(u_{t+h})+\beta _2E_{i,t-1}(\pi _{t+h})+\beta _3\text{Anchor}_{i,t,h}+\beta _4\text{Anchor}_{i,t,h}\times E_{i,t}(u_{t+h})\nonumber \\[5pt] &+& \beta _5\text{Anchor}_{i,t,h}\times E_{i,t-1}(\pi _{t+h})+\mu _i+\gamma _t+\varepsilon _{i,t} \end{eqnarray}
where $E_{i,t}(\pi _{t+h})$
represents inflation expectations made in period
$E_{i,t}(\pi _{t+h})$
represents inflation expectations made in period $t$
by forecaster
$t$
by forecaster $i$
for a horizon of
$i$
for a horizon of $h$
-years-ahead,
$h$
-years-ahead, $E_{i,t}(u_{t+h})$
denotes the corresponding unemployment expectations,
$E_{i,t}(u_{t+h})$
denotes the corresponding unemployment expectations, $E_{i,t-1}(\pi _{t+h})$
gives inflation expectations made in the previous quarter, and
$E_{i,t-1}(\pi _{t+h})$
gives inflation expectations made in the previous quarter, and $\text{Anchor}_{i,t,h}$
is a proxy measuring the individual degree of anchoring of inflation expectations derived in Section 3.1.3. The inclusion of lagged inflation expectations is necessary for three reasons: first, it allows for the presence of serial correlation due to an overlapping sample in the measurement of inflation.Footnote
8
Second, it also controls for the possibility of a lower degree of anchoring for individual forecasters, in which case they might build their expectations based on the recent past.Footnote
9
Third, it also accounts for a delay in updating the information set by forecasters, which has been found in the previous literature (Coibion and Gorodnichenko, Reference Coibion and Gorodnichenko2015a).
$\text{Anchor}_{i,t,h}$
is a proxy measuring the individual degree of anchoring of inflation expectations derived in Section 3.1.3. The inclusion of lagged inflation expectations is necessary for three reasons: first, it allows for the presence of serial correlation due to an overlapping sample in the measurement of inflation.Footnote
8
Second, it also controls for the possibility of a lower degree of anchoring for individual forecasters, in which case they might build their expectations based on the recent past.Footnote
9
Third, it also accounts for a delay in updating the information set by forecasters, which has been found in the previous literature (Coibion and Gorodnichenko, Reference Coibion and Gorodnichenko2015a). $\mu _i$
,
$\mu _i$
, $\gamma _t$
, and
$\gamma _t$
, and $\varepsilon _{i,t}$
characterize time-invariant forecaster-specific fixed effects, time-fixed effects, and idiosyncratic errors, respectively.
$\varepsilon _{i,t}$
characterize time-invariant forecaster-specific fixed effects, time-fixed effects, and idiosyncratic errors, respectively. $\mu _i$
captures a potential heterogeneity across forecasters in forecasting inflation, and
$\mu _i$
captures a potential heterogeneity across forecasters in forecasting inflation, and $\gamma _t$
allows for any information that is available to each forecaster. The latter controls for all realized macroeconomic variables, which are observed by all forecasters.Footnote
10
$\gamma _t$
allows for any information that is available to each forecaster. The latter controls for all realized macroeconomic variables, which are observed by all forecasters.Footnote
10
The anchoring measure is included into the model as the Phillips curve relationship is known to depend on the anchoring of inflation expectations: If inflation expectations are anchored, there is a relationship between inflation and unemployment. However, if inflation expectations are de-anchored, then the relationship exists between the unemployment rate and the change in inflation. The latter version of the Phillips curve is known as the accelerationist Phillips curve (Blanchard, Reference Blanchard2016; Hazell et al. Reference Hazell, Herreño, Nakamura and Steinsson2022). Therefore, we examine whether there is a nonlinear relationship between inflation expectations and unemployment expectations depending on the degree of anchoring. In doing so, we have included the anchoring measure and two interaction terms between the anchoring measure and the other two variables into equation (11).
To check for robustness the general regression model provided in equation (11) has been used in different variants by restricting it to a pooled regression model with and without lagged inflation expectations as well as to a fixed-effects model with and without time-fixed effects. In addition, we have also estimated the model applying the Arellano and Bond (Reference Arellano and Bond1991) GMM estimator to account for the so-called Nickell (Reference Nickell1981) bias and an iterative Cochrane and Orcutt (Reference Cochrane and Orcutt1949) estimator to additionally control for serial correlation.
The same model has also been estimated for aggregated time-series data using cross-sectional means across forecasters:
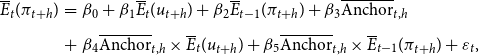 \begin{eqnarray} \overline{E}_{t}(\pi _{t+h})&=&\beta _0+\beta _1\overline{E}_t(u_{t+h})+\beta _2\overline{E}_{t-1}(\pi _{t+h})+\beta _3\overline{\text{Anchor}}_{t,h}\nonumber \\[5pt] &+& \beta _4\overline{\text{Anchor}}_{t,h}\times \overline{E}_t(u_{t+h})+\beta _5\overline{\text{Anchor}}_{t,h}\times \overline{E}_{t-1}(\pi _{t+h})+\varepsilon _{t}, \end{eqnarray}
where $\overline{E}_{t}(\pi _{t+h})$
,
$\overline{E}_{t}(\pi _{t+h})$
, $\overline{E}_t(u_{t+h})$
, and
$\overline{E}_t(u_{t+h})$
, and $\overline{\text{Anchor}}_{t,h}$
are the corresponding cross-sectional means across forecasters for each variable.
$\overline{\text{Anchor}}_{t,h}$
are the corresponding cross-sectional means across forecasters for each variable.
The existence of a negative expectation-based Phillips curve relationship between inflation and unemployment as given in parsimonious form by
 \begin{equation} E_{i,t}(\pi _{t+h})=\beta _0+\beta _1E_{i,t}(u_{t+h})+\varepsilon _{i,t}\quad \text{with $\beta _1\lt 0$} \end{equation}
would result in a positive relationship between the variances of inflation and unemployment:
 \begin{equation} \sigma _{i,t}^2(\pi _{t+h})=\beta _1^2\sigma _{i,t}^2(u_{t+h})+\sigma _{i,t}^2(\varepsilon _{i,t})\quad \text{if $Cov(E_{i,t}(u_{t+h}),\varepsilon _{i,t})=0$}. \end{equation}
Therefore, we also study the relationship between the standard deviations of the variables derived from individual distributional forecasts as proxies for ex ante uncertainty (see Section 3.1.2) while again relying on different versions of the following general regression model:
 \begin{eqnarray} \sigma _{i,t}(\pi _{t+h})&=&\beta _1\sigma _{i,t}(u_{t+h})+\beta _2\sigma _{i,t-1}(\pi _{t+h})+\beta _3\text{Anchor}_{i,t,h}+\beta _4\text{Anchor}_{i,t,h}\times \sigma _{i,t}(u_{t+h})\nonumber \\[5pt] &+& \beta _5\text{Anchor}_{i,t,h}\times \sigma _{i,t-1}(\pi _{t+h})+\mu _i+\gamma _t+\varepsilon _{i,t} \end{eqnarray}
where $\sigma _{i,t}(\pi _{t+h})$
represents inflation uncertainty proxied by the standard deviation of density forecasts made in period
$\sigma _{i,t}(\pi _{t+h})$
represents inflation uncertainty proxied by the standard deviation of density forecasts made in period $t$
by forecaster
$t$
by forecaster $i$
for a horizon of
$i$
for a horizon of $h$
-years-ahead,
$h$
-years-ahead, $\sigma _{i,t}(u_{t+h})$
denotes the correspondingly computed unemployment uncertainty,
$\sigma _{i,t}(u_{t+h})$
denotes the correspondingly computed unemployment uncertainty, $\sigma _{i,t-1}(\pi _{t+h})$
gives inflation uncertainty based on the previous quarters density forecasts, and all other variables are defined as in equation (11). Analogously, we have also considered the same model for aggregated time- series data again using cross-sectional means across forecasters:
$\sigma _{i,t-1}(\pi _{t+h})$
gives inflation uncertainty based on the previous quarters density forecasts, and all other variables are defined as in equation (11). Analogously, we have also considered the same model for aggregated time- series data again using cross-sectional means across forecasters:
 \begin{eqnarray} \overline{\sigma }_{t}(\pi _{t+h})&=&\beta _0+\beta _1\overline{\sigma }_t(u_{t+h})+\beta _2\overline{\sigma }_{t-1}(\pi _{t+h})+\beta _3\overline{\text{Anchor}}_{t,h}\nonumber \\[5pt] &+& \beta _4\overline{\text{Anchor}}_{t,h}\times \overline{\sigma }_t(u_{t+h})+\beta _5\overline{\text{Anchor}}_{t,h}\times \overline{\sigma }_{t-1}(\pi _{t+h})+\varepsilon _{t}. \end{eqnarray}
The presumed negative relationship between expectations of professional forecasters regarding inflation and unemployment is shown in Figure 5 for each forecast horizon, where each point color refers to a different forecaster. Overall, we see that higher levels of inflation expectations tend to correspond to lower unemployment expectations and vice versa. However, the plots also visualize that unemployment expectations have varied stronger compared to inflation expectations over most parts of the sample period, for which inflation expectations have been relatively stable. This observation motivates us to also study the heterogeneity in the Phillips curve relationship across forecasters and over time, which is done at a later stage of the analysis (see Section 4.3). In addition, we see that the relationship tends to lessen with the forecast horizon $h$
. See also Figure A4 in the Appendix for the corresponding relationship on an aggregated level.
$h$
. See also Figure A4 in the Appendix for the corresponding relationship on an aggregated level.
Phillips curve expectations relationship. The plots illustrate the relationship between inflation expectations and unemployment expectations for the Euro Area on an individual forecaster level for different horizons $h$
(one-year-ahead, two-years-ahead, and five-years-ahead) for the period from 1999Q1 to 2023Q1 taken from the ECB Survey of Professional Forecasters. Each point color refers to a different forecaster.
$h$
(one-year-ahead, two-years-ahead, and five-years-ahead) for the period from 1999Q1 to 2023Q1 taken from the ECB Survey of Professional Forecasters. Each point color refers to a different forecaster.
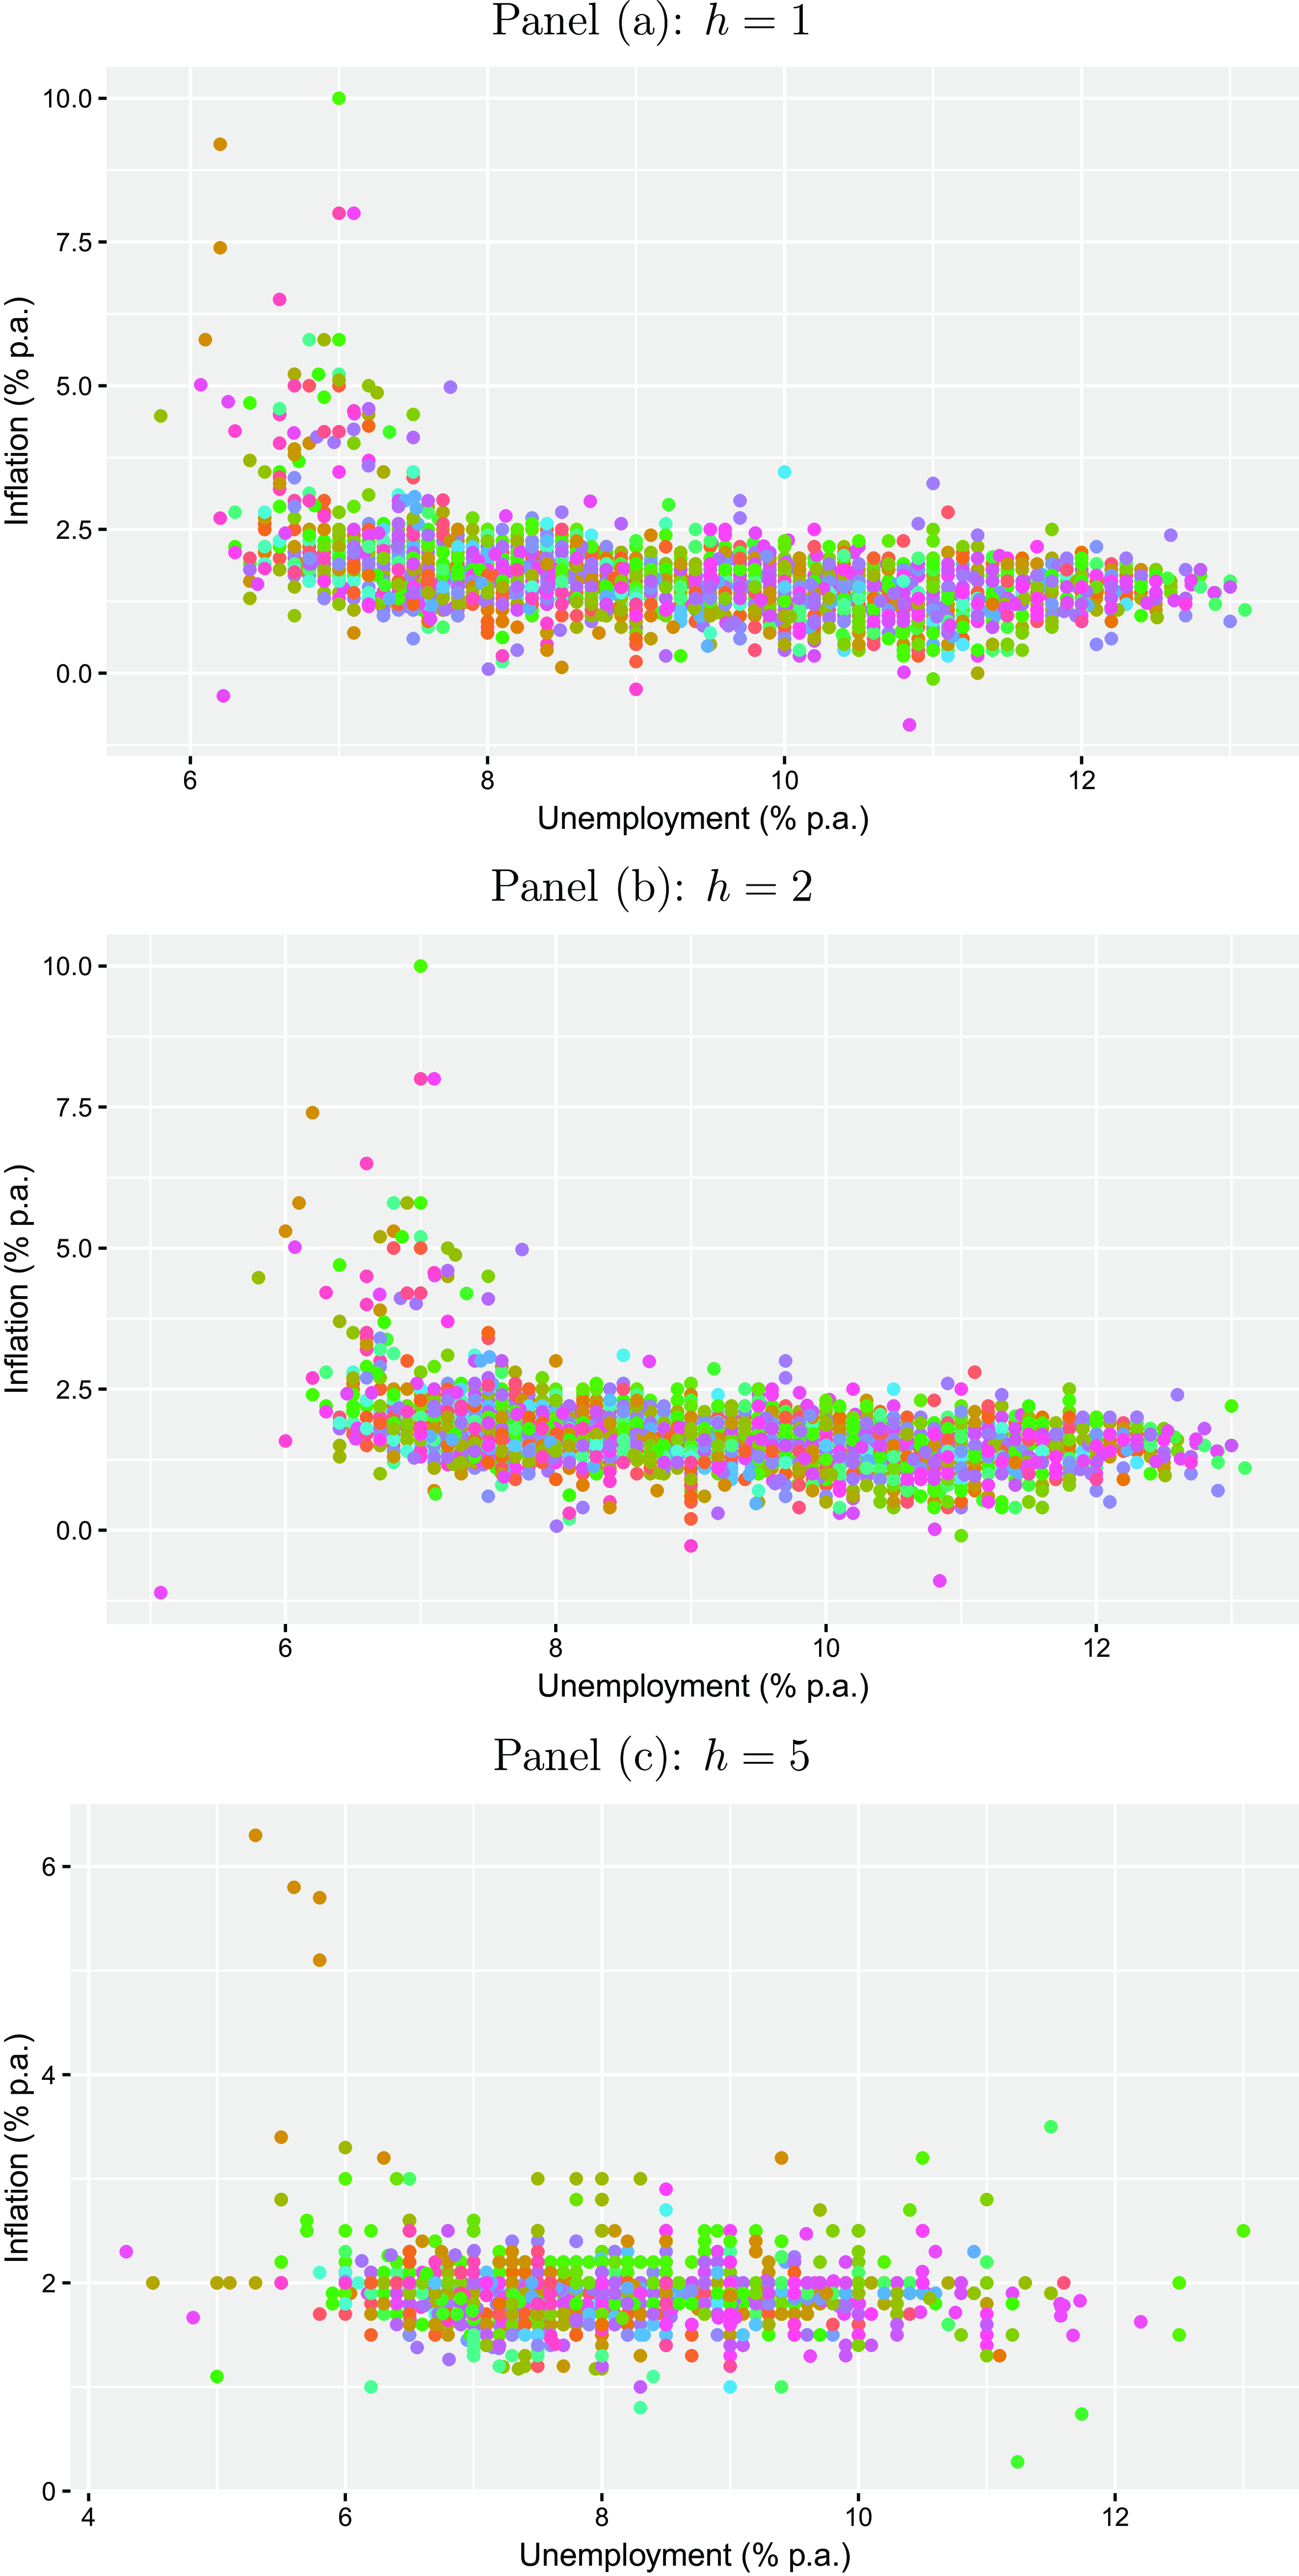
In line with our presumption (see equations (13) and (14)), the negative relationship between expectations regarding inflation and unemployment results in a positive relationship between the corresponding standard deviations as illustrated in Figure 6. Figure A5 in the Appendix visualizes the corresponding relationship on an aggregated level.
Phillips curve uncertainty relationship. The plots illustrate the relationship between inflation uncertainty and unemployment uncertainty for the Euro Area on an individual forecaster level for different horizons $h$
(one-year-ahead, two-years-ahead, and five-years-ahead) for the period from 1999Q1 to 2023Q1 taken from the ECB Survey of Professional Forecasters. Each point color refers to a different forecaster. Uncertainty is proxied by the standard deviation of each forecasters density forecast.
$h$
(one-year-ahead, two-years-ahead, and five-years-ahead) for the period from 1999Q1 to 2023Q1 taken from the ECB Survey of Professional Forecasters. Each point color refers to a different forecaster. Uncertainty is proxied by the standard deviation of each forecasters density forecast.
4. Empirical findings
The empirical findings for the estimated regression models mentioned in Section 3.2 are discussed in the next subsections.
4.1 Expectations-based Phillips Curve
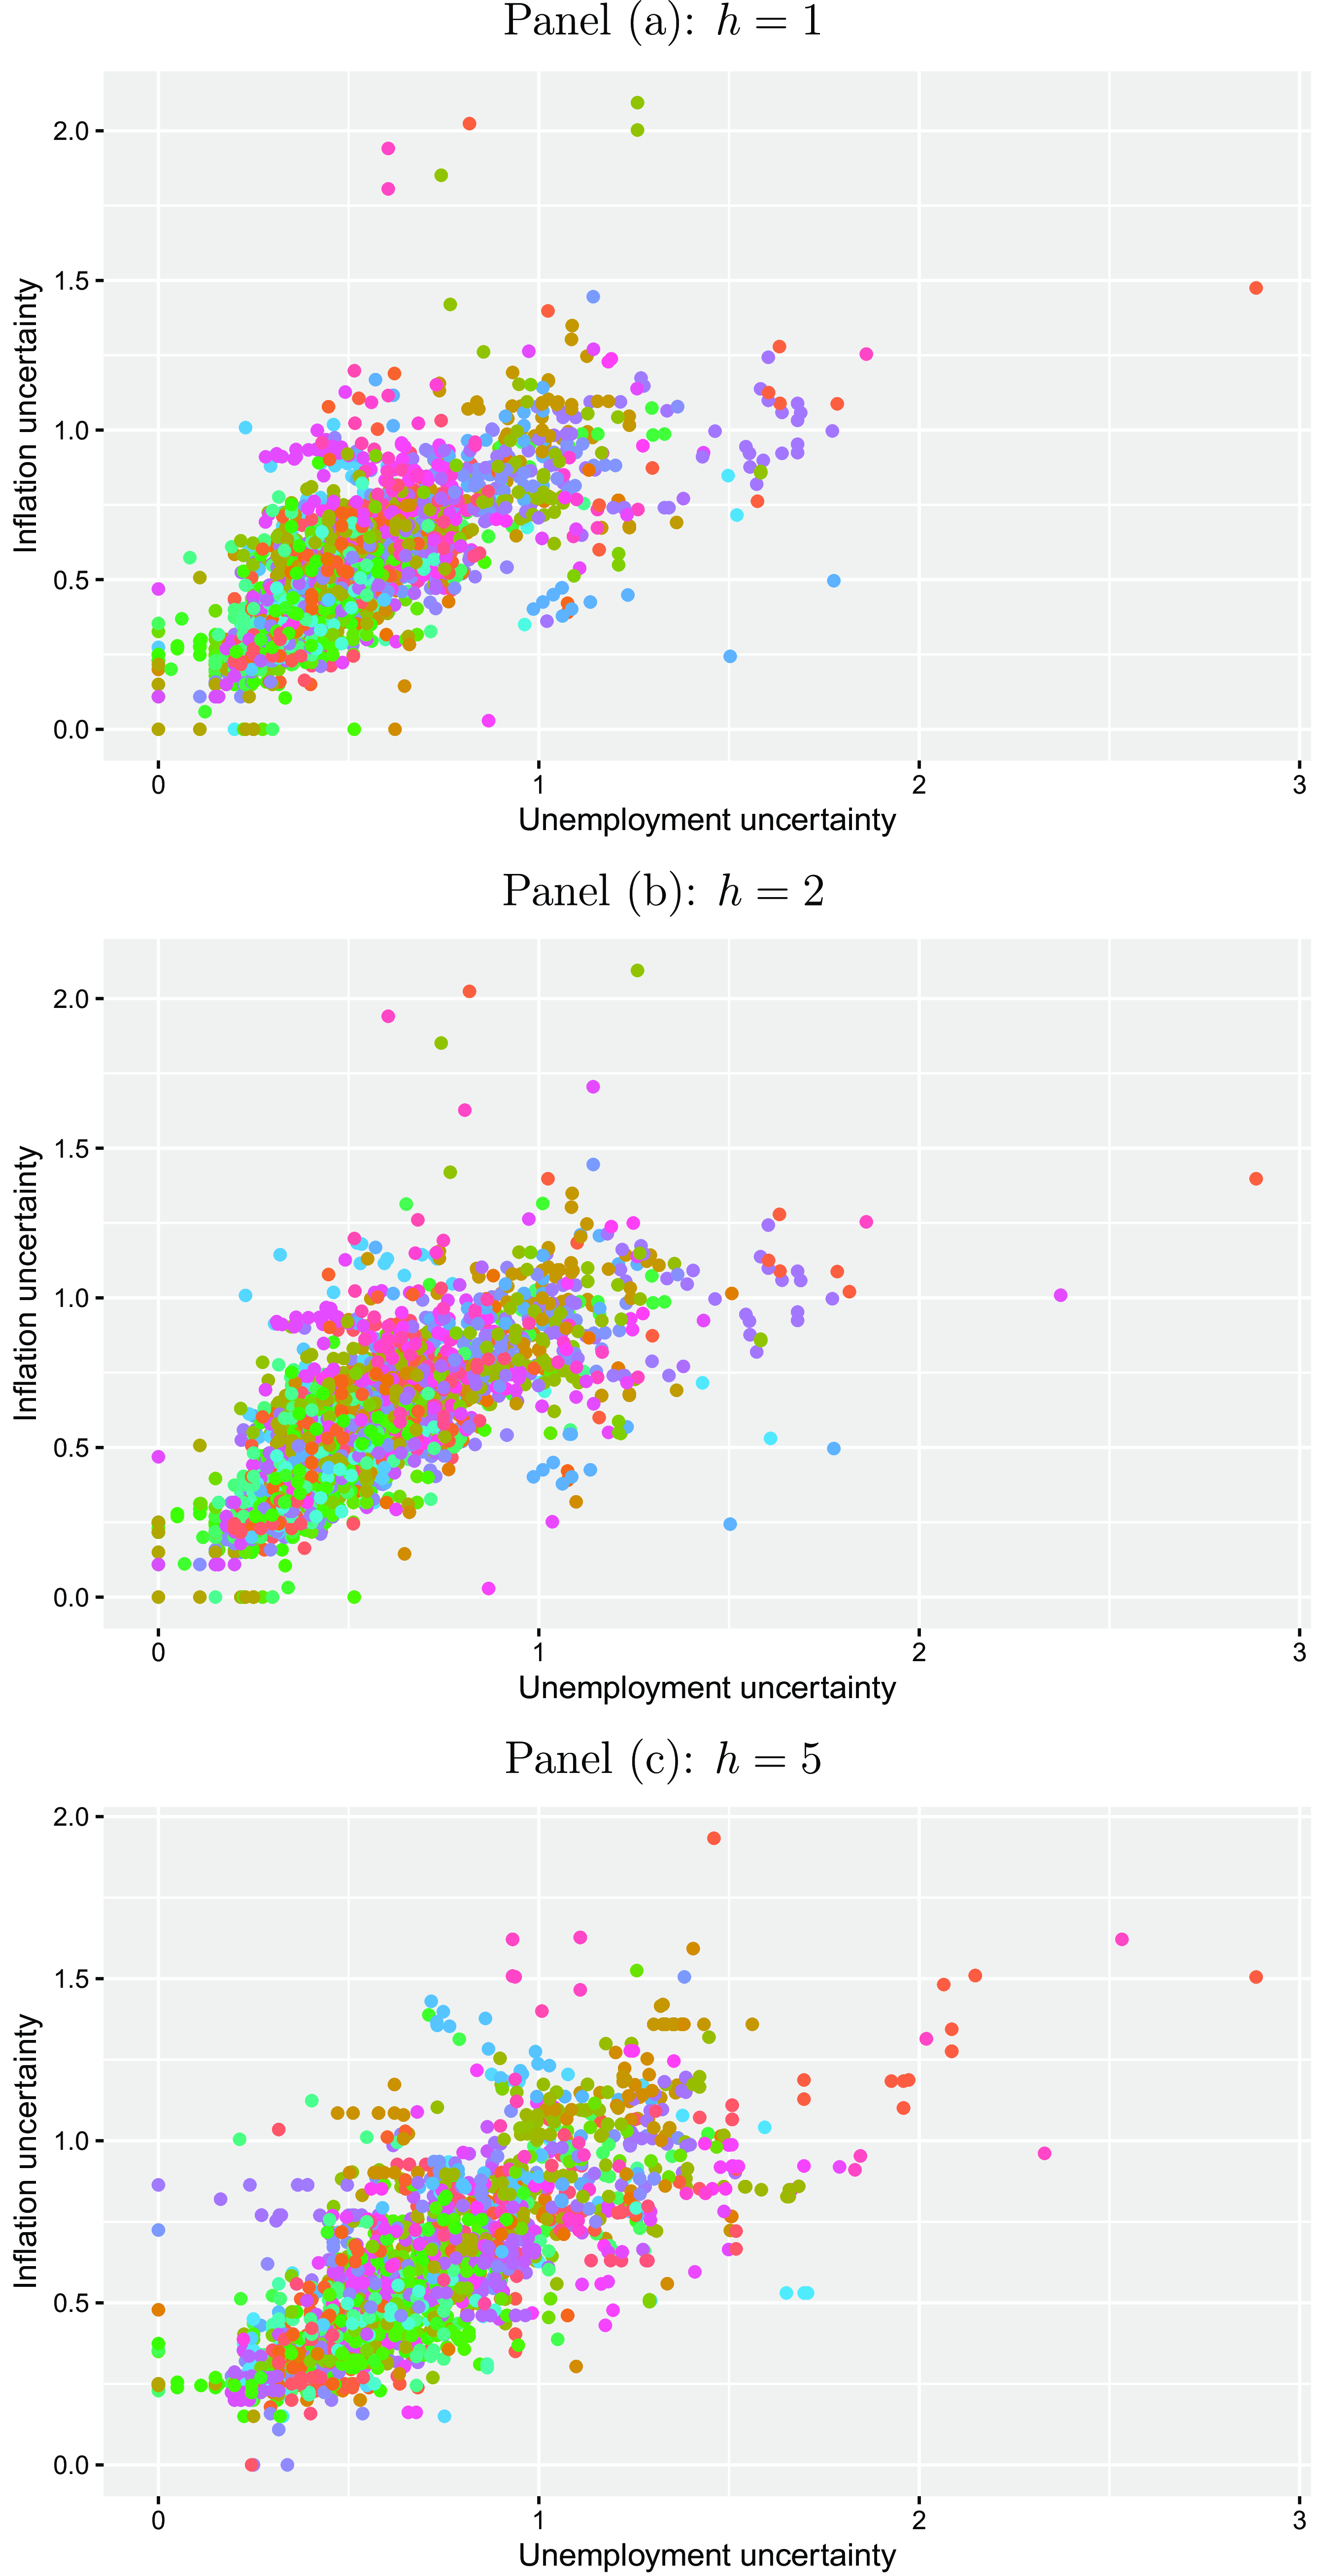
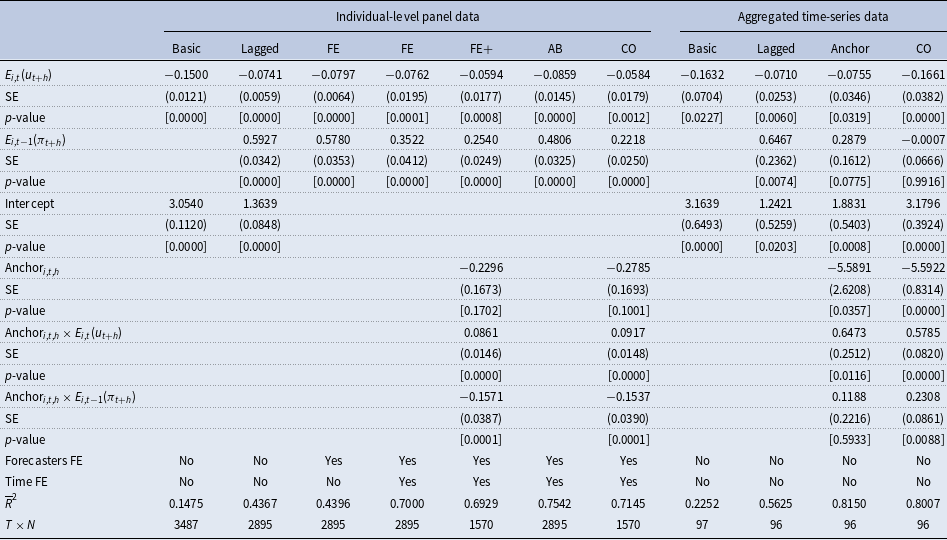
Tables 1 to 3 report the estimated coefficients for the regression models given by equations (11) and (12) for $h=1,2,5$
, respectively. Starting with the results for
$h=1,2,5$
, respectively. Starting with the results for $h=1$
provided in Table 1 and relying on the very basic pooled regression model, we find a significantly negative Phillips curve relationship between inflation expectations and unemployment expectations of around -0.18. The inclusion of lagged inflation expectations substantially increases the explanatory power of the model (the adjusted
$h=1$
provided in Table 1 and relying on the very basic pooled regression model, we find a significantly negative Phillips curve relationship between inflation expectations and unemployment expectations of around -0.18. The inclusion of lagged inflation expectations substantially increases the explanatory power of the model (the adjusted $R^2$
increases from 0.17 to 0.58). The coefficient of lagged inflation expectations lies around 0.75, and the Phillips curve coefficient drops in magnitude to just -0.06 but is still significantly different from zero. The consideration of forecaster-specific effects does not add much to the explanatory power and does not change anything. The inclusion of time-fixed effects is much more important: it raises the model’s explanatory power to 0.73. This is not surprising when considering the sample period running from 1999 to 2023, which includes severe crises and the corresponding policy responses to them. The Phillips curve coefficient stays relatively robust to this change, only the coefficient of lagged inflation expectations is lowered substantially. The results also remain relatively robust when using the Arellano and Bond (Reference Arellano and Bond1991) GMM estimator.
$R^2$
increases from 0.17 to 0.58). The coefficient of lagged inflation expectations lies around 0.75, and the Phillips curve coefficient drops in magnitude to just -0.06 but is still significantly different from zero. The consideration of forecaster-specific effects does not add much to the explanatory power and does not change anything. The inclusion of time-fixed effects is much more important: it raises the model’s explanatory power to 0.73. This is not surprising when considering the sample period running from 1999 to 2023, which includes severe crises and the corresponding policy responses to them. The Phillips curve coefficient stays relatively robust to this change, only the coefficient of lagged inflation expectations is lowered substantially. The results also remain relatively robust when using the Arellano and Bond (Reference Arellano and Bond1991) GMM estimator.
Phillips curve expectations regression results for $h=1$
$h=1$
Note: The table reports coefficient estimates, heteroskedasticity and autocorrelation robust (HAC) standard errors (SE) according to Arellano (Reference Arellano1987), $p$
-values, the adjusted
$p$
-values, the adjusted $R^2$
(
$R^2$
( $\overline{R}^2$
) and the number of observations (
$\overline{R}^2$
) and the number of observations ( $T\times N$
) for different versions of the following general regression model:
$T\times N$
) for different versions of the following general regression model:
 \begin{equation*} E_{i,t}(\pi _{t+h})=\beta _1E_{i,t}(u_{t+h})+\beta _2E_{i,t-1}(\pi _{t+h})+\beta _3\text {Anchor}_{i,t,h}+\beta _4\text {Anchor}_{i,t,h}\times E_{i,t}(u_{t+h})+\beta _5\text {Anchor}_{i,t,h}\times E_{i,t-1}(\pi _{t+h})+\mu _i+\gamma _t+\varepsilon _{i,t} \end{equation*}
where $E_{i,t}(\pi _{t+h})$
represents inflation expectations made in period
$E_{i,t}(\pi _{t+h})$
represents inflation expectations made in period $t$
by forecaster
$t$
by forecaster $i$
for a horizon of
$i$
for a horizon of $h$
-years-ahead,
$h$
-years-ahead, $E_{i,t}(u_{t+h})$
denotes the corresponding unemployment expectations,
$E_{i,t}(u_{t+h})$
denotes the corresponding unemployment expectations, $E_{i,t-1}(\pi _{t+h})$
gives inflation expectations made in the previous quarter, and
$E_{i,t-1}(\pi _{t+h})$
gives inflation expectations made in the previous quarter, and $\text{Anchor}_{i,t,h}$
is a proxy measuring the individual degree of anchoring of inflation expectations.
$\text{Anchor}_{i,t,h}$
is a proxy measuring the individual degree of anchoring of inflation expectations. $\mu _i$
,
$\mu _i$
, $\gamma _t$
, and
$\gamma _t$
, and $\varepsilon _{i,t}$
characterize time-invariant forecaster-specific fixed effects, time-fixed effects, and idiosyncratic errors, respectively. This general regression model has been restricted to a pooled regression model with (Lagged) and without lagged inflation expectations (Basic), to a fixed-effects (FE) model with and without time-fixed effects and the anchoring measure (FE+). In addition, we have also estimated the model applying the Arellano and Bond (Reference Arellano and Bond1991) GMM estimator (AB) and an iterative Cochrane and Orcutt (Reference Cochrane and Orcutt1949) estimator (CO). The same model has also been estimated for aggregated time-series data using cross-sectional means across forecasters:
$\varepsilon _{i,t}$
characterize time-invariant forecaster-specific fixed effects, time-fixed effects, and idiosyncratic errors, respectively. This general regression model has been restricted to a pooled regression model with (Lagged) and without lagged inflation expectations (Basic), to a fixed-effects (FE) model with and without time-fixed effects and the anchoring measure (FE+). In addition, we have also estimated the model applying the Arellano and Bond (Reference Arellano and Bond1991) GMM estimator (AB) and an iterative Cochrane and Orcutt (Reference Cochrane and Orcutt1949) estimator (CO). The same model has also been estimated for aggregated time-series data using cross-sectional means across forecasters:
 \begin{equation*} \overline {E}_{t}(\pi _{t+h})=\beta _0+\beta _1\overline {E}_t(u_{t+h})+\beta _2\overline {E}_{t-1}(\pi _{t+h})+\beta _3\overline {\text {Anchor}}_{t,h}+\beta _4\overline {\text {Anchor}}_{t,h}\times \overline {E}_t(u_{t+h})+\beta _5\overline {\text {Anchor}}_{t,h}\times \overline {E}_{t-1}(\pi _{t+h})+\varepsilon _{t}. \end{equation*}
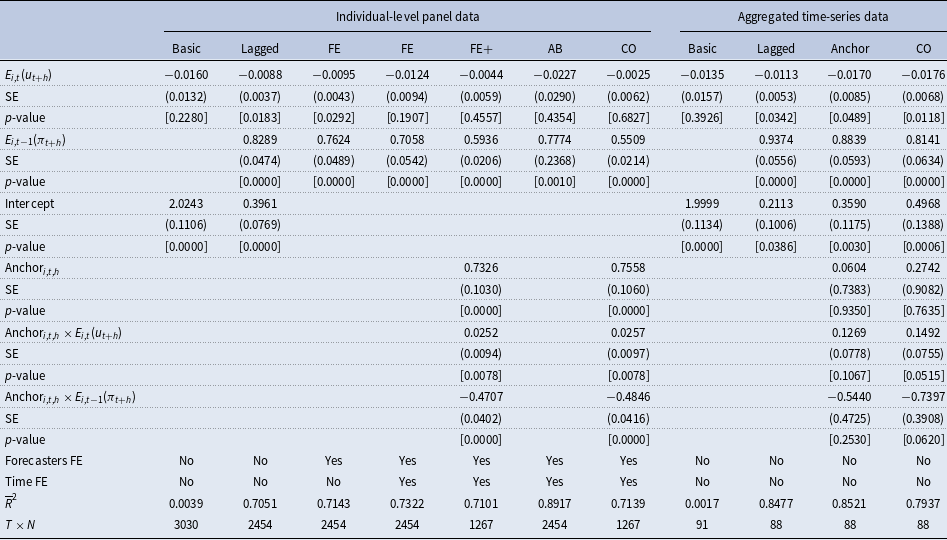
Phillips curve expectations regression results for $h=2$
$h=2$
Note: The table reports coefficient estimates, heteroskedasticity and autocorrelation robust (HAC) standard errors (SE) according to Arellano (Reference Arellano1987), $p$
-values, the adjusted
$p$
-values, the adjusted $R^2$
(
$R^2$
( $\overline{R}^2$
) and the number of observations (
$\overline{R}^2$
) and the number of observations ( $T\times N$
) for different versions of the following general regression model:
$T\times N$
) for different versions of the following general regression model:
 \begin{equation*} E_{i,t}(\pi _{t+h})=\beta _1E_{i,t}(u_{t+h})+\beta _2E_{i,t-1}(\pi _{t+h})+\beta _3\text {Anchor}_{i,t,h}+\beta _4\text {Anchor}_{i,t,h}\times E_{i,t}(u_{t+h})+\beta _5\text {Anchor}_{i,t,h}\times E_{i,t-1}(\pi _{t+h})+\mu _i+\gamma _t+\varepsilon _{i,t} \end{equation*}
where $E_{i,t}(\pi _{t+h})$
represents inflation expectations made in period
$E_{i,t}(\pi _{t+h})$
represents inflation expectations made in period $t$
by forecaster
$t$
by forecaster $i$
for a horizon of
$i$
for a horizon of $h$
-years-ahead,
$h$
-years-ahead, $E_{i,t}(u_{t+h})$
denotes the corresponding unemployment expectations,
$E_{i,t}(u_{t+h})$
denotes the corresponding unemployment expectations, $E_{i,t-1}(\pi _{t+h})$
gives inflation expectations made in the previous quarter, and
$E_{i,t-1}(\pi _{t+h})$
gives inflation expectations made in the previous quarter, and $\text{Anchor}_{i,t,h}$
is a proxy measuring the individual degree of anchoring of inflation expectations.
$\text{Anchor}_{i,t,h}$
is a proxy measuring the individual degree of anchoring of inflation expectations. $\mu _i$
,
$\mu _i$
, $\gamma _t$
, and
$\gamma _t$
, and $\varepsilon _{i,t}$
characterize time-invariant forecaster-specific fixed effects, time fixed effects, and idiosyncratic errors, respectively. This general regression model has been restricted to a pooled regression model with (Lagged) and without lagged inflation expectations (Basic), to a fixed-effects (FE) model with and without time fixed effects and the anchoring measure (FE+). In addition, we have also estimated the model applying the Arellano and Bond (Reference Arellano and Bond1991) GMM estimator (AB) and an iterative Cochrane and Orcutt (Reference Cochrane and Orcutt1949) estimator (CO). The same model has also been estimated for aggregated time-series data using cross-sectional means across forecasters:
$\varepsilon _{i,t}$
characterize time-invariant forecaster-specific fixed effects, time fixed effects, and idiosyncratic errors, respectively. This general regression model has been restricted to a pooled regression model with (Lagged) and without lagged inflation expectations (Basic), to a fixed-effects (FE) model with and without time fixed effects and the anchoring measure (FE+). In addition, we have also estimated the model applying the Arellano and Bond (Reference Arellano and Bond1991) GMM estimator (AB) and an iterative Cochrane and Orcutt (Reference Cochrane and Orcutt1949) estimator (CO). The same model has also been estimated for aggregated time-series data using cross-sectional means across forecasters:
 \begin{equation*} \overline {E}_{t}(\pi _{t+h})=\beta _0+\beta _1\overline {E}_t(u_{t+h})+\beta _2\overline {E}_{t-1}(\pi _{t+h})+\beta _3\overline {\text {Anchor}}_{t,h}+\beta _4\overline {\text {Anchor}}_{t,h}\times \overline {E}_t(u_{t+h})+\beta _5\overline {\text {Anchor}}_{t,h}\times \overline {E}_{t-1}(\pi _{t+h})+\varepsilon _{t}. \end{equation*}
Phillips curve expectations regression results for $h=5$
$h=5$
Note: The table reports coefficient estimates, heteroskedasticity and autocorrelation robust (HAC) standard errors (SE) according to Arellano (Reference Arellano1987), $p$
-values, the adjusted
$p$
-values, the adjusted $R^2$
(
$R^2$
( $\overline{R}^2$
) and the number of observations (
$\overline{R}^2$
) and the number of observations ( $T\times N$
) for different versions of the following general regression model:
$T\times N$
) for different versions of the following general regression model:
 \begin{equation*} E_{i,t}(\pi _{t+h})=\beta _1E_{i,t}(u_{t+h})+\beta _2E_{i,t-1}(\pi _{t+h})+\beta _3\text {Anchor}_{i,t,h}+\beta _4\text {Anchor}_{i,t,h}\times E_{i,t}(u_{t+h})+\beta _5\text {Anchor}_{i,t,h}\times E_{i,t-1}(\pi _{t+h})+\mu _i+\gamma _t+\varepsilon _{i,t} \end{equation*}
where $E_{i,t}(\pi _{t+h})$
represents inflation expectations made in period
$E_{i,t}(\pi _{t+h})$
represents inflation expectations made in period $t$
by forecaster
$t$
by forecaster $i$
for a horizon of
$i$
for a horizon of $h$
-years-ahead,
$h$
-years-ahead, $E_{i,t}(u_{t+h})$
denotes the corresponding unemployment expectations,
$E_{i,t}(u_{t+h})$
denotes the corresponding unemployment expectations, $E_{i,t-1}(\pi _{t+h})$
gives inflation expectations made in the previous quarter, and
$E_{i,t-1}(\pi _{t+h})$
gives inflation expectations made in the previous quarter, and $\text{Anchor}_{i,t,h}$
is a proxy measuring the individual degree of anchoring of inflation expectations.
$\text{Anchor}_{i,t,h}$
is a proxy measuring the individual degree of anchoring of inflation expectations. $\mu _i$
,
$\mu _i$
, $\gamma _t$
, and
$\gamma _t$
, and $\varepsilon _{i,t}$
characterize time-invariant forecaster-specific fixed effects, time-fixed effects, and idiosyncratic errors, respectively. This general regression model has been restricted to a pooled regression model with (Lagged) and without lagged inflation expectations (Basic), to a fixed effects (FE) model with and without time-fixed effects, and the anchoring measure (FE+). In addition, we have also estimated the model applying the Arellano and Bond (Reference Arellano and Bond1991) GMM estimator (AB) and an iterative Cochrane and Orcutt (Reference Cochrane and Orcutt1949) estimator (CO). The same model has also been estimated for aggregated time-series data using cross-sectional means across forecasters:
$\varepsilon _{i,t}$
characterize time-invariant forecaster-specific fixed effects, time-fixed effects, and idiosyncratic errors, respectively. This general regression model has been restricted to a pooled regression model with (Lagged) and without lagged inflation expectations (Basic), to a fixed effects (FE) model with and without time-fixed effects, and the anchoring measure (FE+). In addition, we have also estimated the model applying the Arellano and Bond (Reference Arellano and Bond1991) GMM estimator (AB) and an iterative Cochrane and Orcutt (Reference Cochrane and Orcutt1949) estimator (CO). The same model has also been estimated for aggregated time-series data using cross-sectional means across forecasters:
 \begin{equation*} \overline {E}_{t}(\pi _{t+h})=\beta _0+\beta _1\overline {E}_t(u_{t+h})+\beta _2\overline {E}_{t-1}(\pi _{t+h})+\beta _3\overline {\text {Anchor}}_{t,h}+\beta _4\overline {\text {Anchor}}_{t,h}\times \overline {E}_t(u_{t+h})+\beta _5\overline {\text {Anchor}}_{t,h}\times \overline {E}_{t-1}(\pi _{t+h})+\varepsilon _{t}. \end{equation*}
When also including the anchoring measure and the two interaction terms, we find, first of all, that the anchoring measure itself has a significantly negative association with inflation expectations (at the 5% level). This is fully plausible as a lower degree of anchoring usually corresponds to an increase in inflation expectations. In addition, we also see that the Phillips curve coefficient lowers in magnitude and becomes insignificant. For the corresponding interaction term, we also observe that it even switches the sign. The coefficient of lagged inflation expectations also decreases itself and decreases further when taken the corresponding interaction term into account. This is also plausible as a higher degree of anchoring stabilizes inflation expectations and therefore reduces its persistence. The results achieved from the iterative Cochrane and Orcutt (Reference Cochrane and Orcutt1949) estimation are nearly identical.
The time-series regression models on the aggregated level basically confirm the findings discussed above; however, in this case, the Phillips curve coefficient remains statistically significant at least at the 5% level even after controlling for the degree of anchoring. The coefficient ranges between −0.05 and −0.1. A similar conclusion is achieved when considering the findings for the forecast horizon $h=2$
provided in Table 2. The results basically confirm the findings discussed above for
$h=2$
provided in Table 2. The results basically confirm the findings discussed above for $h=1$
; however, the Phillips curve coefficient is statistically significant at least at the 5% level in all specifications ranging between −0.06 and −0.17. This clearly changes when considering the medium-run horizon (
$h=1$
; however, the Phillips curve coefficient is statistically significant at least at the 5% level in all specifications ranging between −0.06 and −0.17. This clearly changes when considering the medium-run horizon ( $h=5$
) provided in Table 3. In this case, the Phillips curve coefficient is quite low in magnitude and insignificant for most of the panel data specification. Only the time-series models provide some evidence for the existence of the expectation-based Phillips curve relationship over a longer forecast horizon.
$h=5$
) provided in Table 3. In this case, the Phillips curve coefficient is quite low in magnitude and insignificant for most of the panel data specification. Only the time-series models provide some evidence for the existence of the expectation-based Phillips curve relationship over a longer forecast horizon.
Overall, for lower forecast horizons (i.e., one- and two-years-ahead), we find evidence for a low but mostly significant Phillips curve coefficient confirming that professional forecasters make forecasts for inflation and unemployment, which are roughly in line with the traditional Phillips curve concept. We also observe that a large part of the variation is explained by past inflation expectations and time-fixed effects while forecaster-specific fixed effects do not add much explanatory power. The consideration of the anchoring measure indicates some nonlinearity in the relationship. For an average degree of anchoring (i.e., $\text{Anchor}_{i,t,h}=0$
), there is a small but negative Phillips curve relationship between expectations for inflation and unemployment. This association is also statistically significant at a 1% level for
$\text{Anchor}_{i,t,h}=0$
), there is a small but negative Phillips curve relationship between expectations for inflation and unemployment. This association is also statistically significant at a 1% level for $h=2$
. For a lower degree of anchoring (i.e.,
$h=2$
. For a lower degree of anchoring (i.e., $\text{Anchor}_{i,t,h}\lt 0$
). this negative connection becomes much stronger while it disappears for a higher degree of anchoring (i.e.,
$\text{Anchor}_{i,t,h}\lt 0$
). this negative connection becomes much stronger while it disappears for a higher degree of anchoring (i.e., $\text{Anchor}_{i,t,h}\gt 0$
). The latter might be explained by fact that a high degree of anchoring results in stable inflation expectations close to the inflation target of the ECB of 2%, which are detached from unemployment expectations. This argument is also in line with our observation that unemployment expectations show a much stronger variation compared to inflation expectations within the sample period (see Figure 5). This might also explain why the Phillips curve relationship mostly disappears for medium-run forecasts (i.e., for five-years-ahead forecasts).
$\text{Anchor}_{i,t,h}\gt 0$
). The latter might be explained by fact that a high degree of anchoring results in stable inflation expectations close to the inflation target of the ECB of 2%, which are detached from unemployment expectations. This argument is also in line with our observation that unemployment expectations show a much stronger variation compared to inflation expectations within the sample period (see Figure 5). This might also explain why the Phillips curve relationship mostly disappears for medium-run forecasts (i.e., for five-years-ahead forecasts).
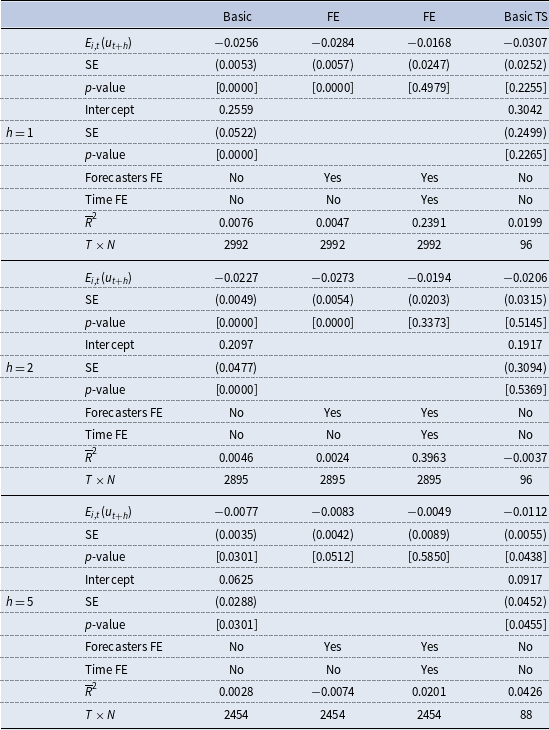
Accelerationist Phillips curve expectations regression results
Note: The table reports coefficient estimates, heteroskedasticity and autocorrelation robust (HAC) standard errors (SE) according to Arellano (Reference Arellano1987), $p$
-values, the adjusted
$p$
-values, the adjusted $R^2$
(
$R^2$
( $\overline{R}^2$
) and the number of observations (
$\overline{R}^2$
) and the number of observations ( $T\times N$
) for different versions of the following general regression model:
$T\times N$
) for different versions of the following general regression model:
 \begin{equation*} E_{i,t}(\pi _{t+h})-E_{i,t-1}(\pi _{t+h})=\beta _1E_{i,t}(u_{t+h})+\mu _i+\gamma _t+\varepsilon _{i,t} \end{equation*}
where $E_{i,t}(\pi _{t+h})-E_{i,t-1}(\pi _{t+h})$
represents the change in inflation expectations between
$E_{i,t}(\pi _{t+h})-E_{i,t-1}(\pi _{t+h})$
represents the change in inflation expectations between $t-1$
and
$t-1$
and $t$
by forecaster
$t$
by forecaster $i$
for a horizon of
$i$
for a horizon of $h$
-years-ahead, and
$h$
-years-ahead, and $E_{i,t}(u_{t+h})$
denotes the corresponding unemployment expectations.
$E_{i,t}(u_{t+h})$
denotes the corresponding unemployment expectations. $\mu _i$
,
$\mu _i$
, $\gamma _t$
, and
$\gamma _t$
, and $\varepsilon _{i,t}$
characterize time-invariant forecaster-specific fixed effects, time-fixed effects, and idiosyncratic errors, respectively. This general regression model has also been restricted to a pooled regression model (Basic) and to a fixed effects (FE) model with and without time fixed effects. The same model has also been estimated for aggregated time-series data (Basic TS) using cross-sectional means across forecasters:
$\varepsilon _{i,t}$
characterize time-invariant forecaster-specific fixed effects, time-fixed effects, and idiosyncratic errors, respectively. This general regression model has also been restricted to a pooled regression model (Basic) and to a fixed effects (FE) model with and without time fixed effects. The same model has also been estimated for aggregated time-series data (Basic TS) using cross-sectional means across forecasters:
 \begin{equation*} \overline {E}_{t}(\pi _{t+h})-\overline {E}_{t-1}(\pi _{t+h})=\beta _0+\beta _1\overline {E}_t(u_{t+h})+\varepsilon _{t}. \end{equation*}
4.2 Expectation-based accelerationist Phillips Curve
As an additional robustness check, in Table 4, we have also considered the case of an expectations-based accelerationist Phillips curve version (Blanchard, Reference Blanchard2016; Hazell et al. Reference Hazell, Herreño, Nakamura and Steinsson2022). Compared to equation (11), we basically assume a high persistence of inflation expectations and therefore set the $\beta _2$
coefficient equal to unity:
$\beta _2$
coefficient equal to unity:
 \begin{equation} E_{i,t}(\pi _{t+h})-E_{i,t-1}(\pi _{t+h})=\beta _1E_{i,t}(u_{t+h})+\mu _i+\gamma _t+\varepsilon _{i,t}. \end{equation}
However, either the adjusted $R^2$
s are extremely low or the Phillips curve coefficient is insignificant. The latter is especially true after controlling for time-fixed effects, which explain most of the variation in the change of inflation expectations. We see this as evidence against the expectations-based accelerationist Phillips curve version.
$R^2$
s are extremely low or the Phillips curve coefficient is insignificant. The latter is especially true after controlling for time-fixed effects, which explain most of the variation in the change of inflation expectations. We see this as evidence against the expectations-based accelerationist Phillips curve version.
4.3 Heterogeneity across forecasters and over time
We also study the heterogeneity of the Phillips curve relationship across individual forecasters by using time-series regressions of inflation expectations on their lag and unemployment expectations. Figure 7 displays the corresponding Phillips curve coefficients together with their robust standard errors for each of the three forecast horizons ( $h=1,2,5$
). It can be seen that the degree of heterogeneity of the individual forecasters’ coefficient estimates is relatively low. This is in line with our previous finding in the fixed effects regression framework that forecaster-specific effects do not add much to the explanatory power. Most of the coefficients are low but negative corresponding to the concept of the Phillips curve. For the expectations over short-run horizons (
$h=1,2,5$
). It can be seen that the degree of heterogeneity of the individual forecasters’ coefficient estimates is relatively low. This is in line with our previous finding in the fixed effects regression framework that forecaster-specific effects do not add much to the explanatory power. Most of the coefficients are low but negative corresponding to the concept of the Phillips curve. For the expectations over short-run horizons ( $h=1,2$
) the corresponding coefficient is negative for more than 90% of forecasters. Over the longer forecast horizon it is still negative for more than 70% of forecasters. The red colored points represent coefficients that are significantly different from zero at a 5% level. This is the case for more than 30% of forecasters for
$h=1,2$
) the corresponding coefficient is negative for more than 90% of forecasters. Over the longer forecast horizon it is still negative for more than 70% of forecasters. The red colored points represent coefficients that are significantly different from zero at a 5% level. This is the case for more than 30% of forecasters for $h=1,2$
and for around 12% for
$h=1,2$
and for around 12% for $h=5$
.Footnote
11
Overall, we also find evidence in favor of the Phillips curve relationship between expectations considered on an individual level but again the association becomes smaller for a higher forecast horizon.
$h=5$
.Footnote
11
Overall, we also find evidence in favor of the Phillips curve relationship between expectations considered on an individual level but again the association becomes smaller for a higher forecast horizon.
Individual Phillips curve expectations coefficients. The plots illustrate the estimated Phillips curve expectations coefficients and their standard errors from a regression of inflation expectations on unemployment expectations and lagged inflation expectations for the Euro Area on an individual forecaster level for different horizons $h$
(one-year-ahead, two-years-ahead, and five-years-ahead) for the period from 1999Q1 to 2023Q1 taken from the ECB Survey of Professional Forecasters. The red colored points refer to coefficients, which are significantly different from zero at a 5% level.
$h$
(one-year-ahead, two-years-ahead, and five-years-ahead) for the period from 1999Q1 to 2023Q1 taken from the ECB Survey of Professional Forecasters. The red colored points refer to coefficients, which are significantly different from zero at a 5% level.
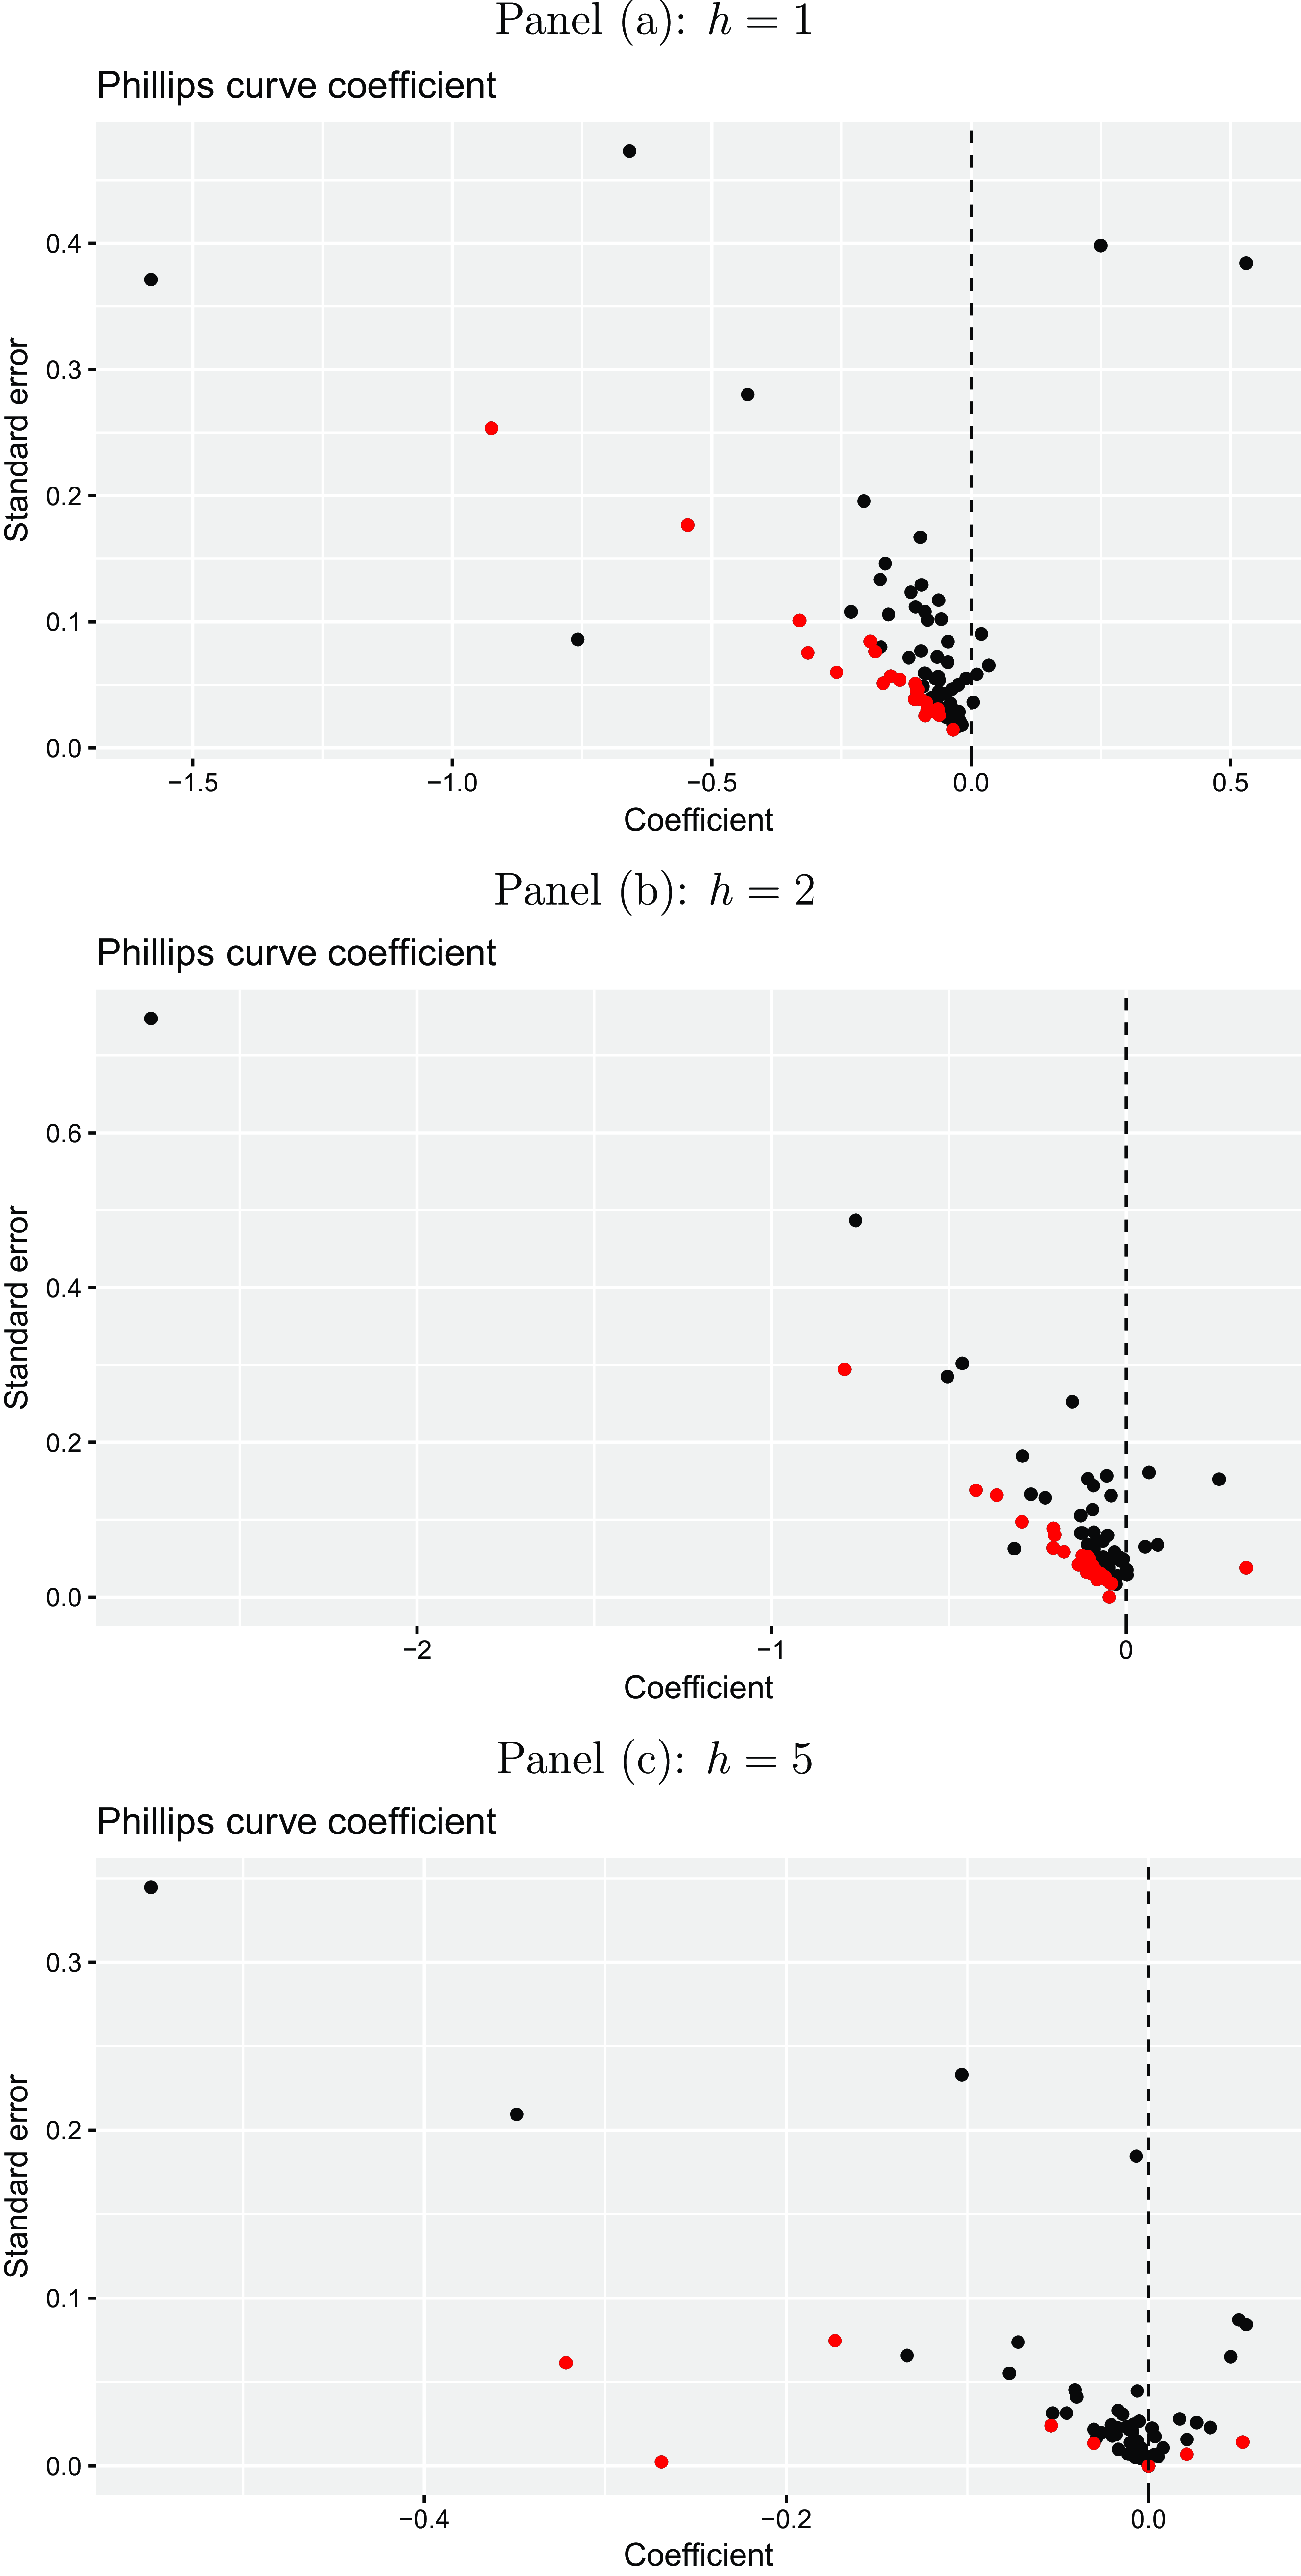
Time-varying Phillips curve expectations coefficients. The plots illustrate the Phillips curve expectations coefficients and corresponding adjusted $R^2$
s estimated by rolling-window fixed effects regressions of inflation expectations on unemployment expectations and lagged inflation expectations for the Euro Area using panel data for different horizons
$R^2$
s estimated by rolling-window fixed effects regressions of inflation expectations on unemployment expectations and lagged inflation expectations for the Euro Area using panel data for different horizons $h$
(one-year-ahead, two-years-ahead, and five-years-ahead) for the period from 1999Q1 to 2023Q1 taken from the ECB Survey of Professional Forecasters. The red colored points refer to coefficients, which are significantly different from zero at a 5% level. The window size is 20 quarters (= five years).
$h$
(one-year-ahead, two-years-ahead, and five-years-ahead) for the period from 1999Q1 to 2023Q1 taken from the ECB Survey of Professional Forecasters. The red colored points refer to coefficients, which are significantly different from zero at a 5% level. The window size is 20 quarters (= five years).
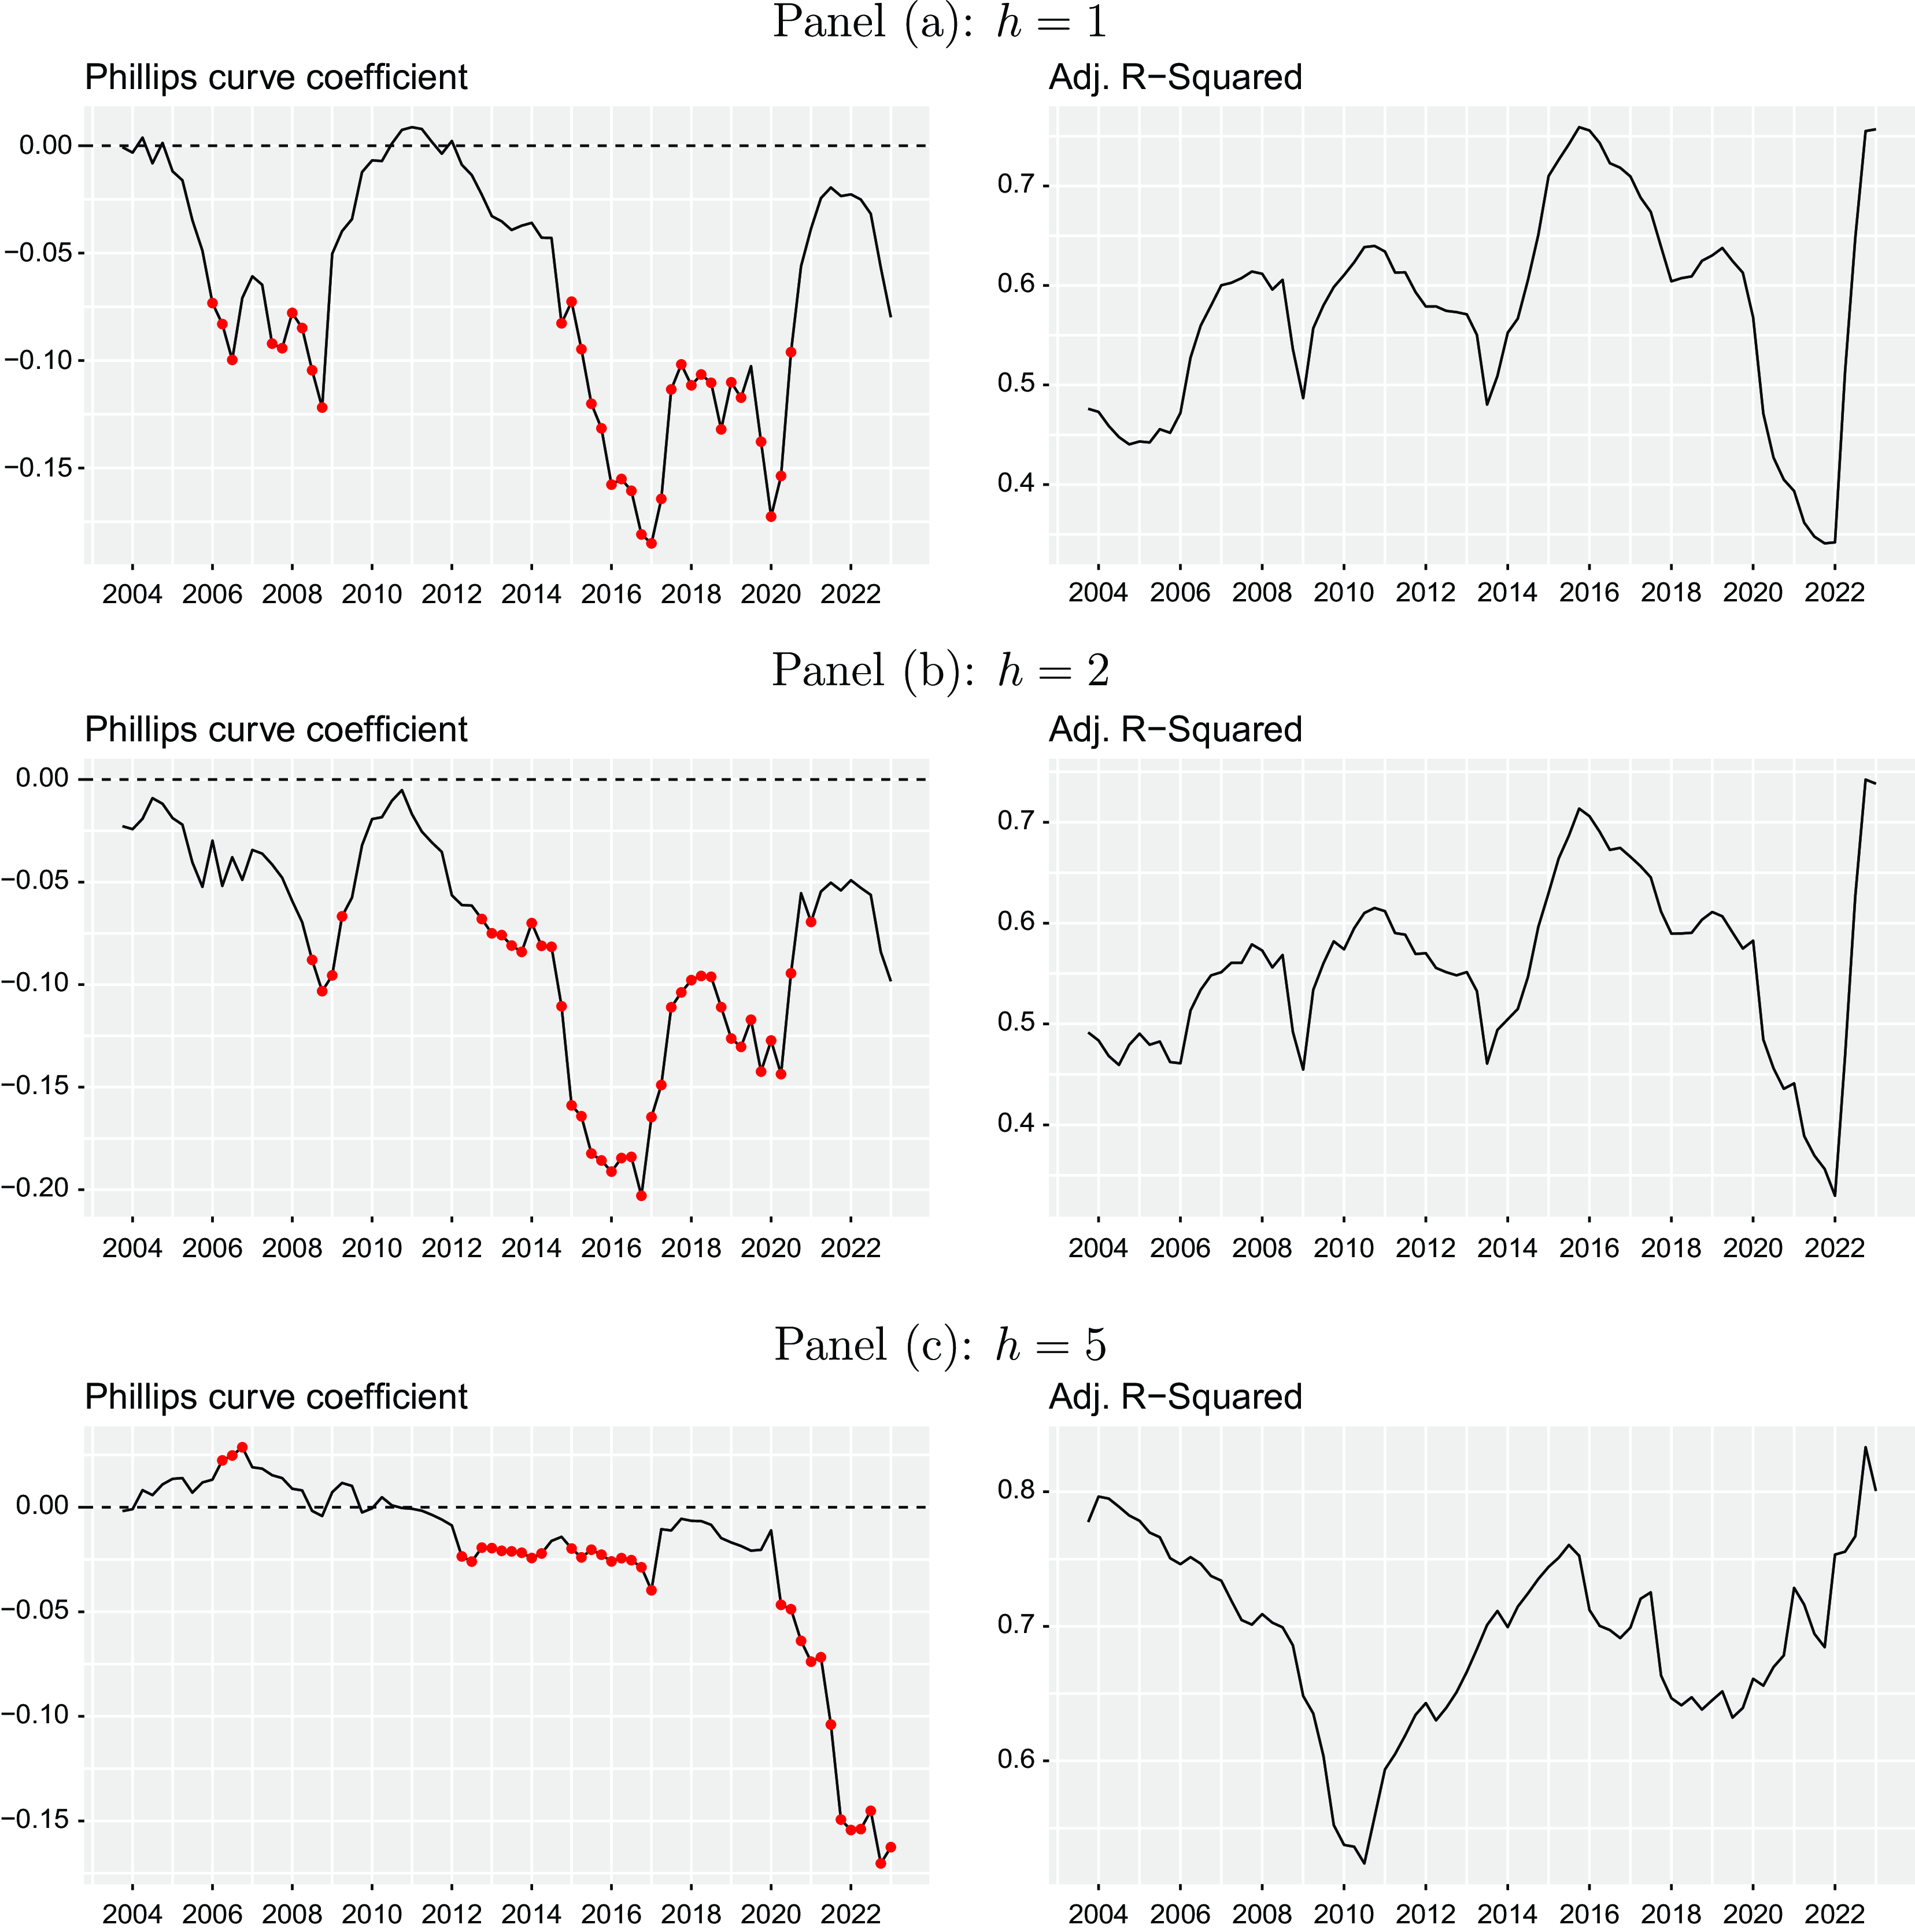
The world economy has been hit by several major shocks over the recent decades, which results in the necessity to allow for time-variation in the expectation building mechanism and the relationship between inflation and unemployment. Figure 8 also plots a time-varying Phillips curve coefficient together with the corresponding adjusted $R^2$
relying on a rolling-window fixed effects regression using a window size of 20 quarters, which corresponds to five years. Again the red colored dots refer to periods, in which the coefficient is significantly different from zero. Overall, we see a large variation in the relationship over time when referring to both the Phillips curve coefficient or the explanatory power of the variation in inflation expectations measured by the adjusted
$R^2$
relying on a rolling-window fixed effects regression using a window size of 20 quarters, which corresponds to five years. Again the red colored dots refer to periods, in which the coefficient is significantly different from zero. Overall, we see a large variation in the relationship over time when referring to both the Phillips curve coefficient or the explanatory power of the variation in inflation expectations measured by the adjusted $R^2$
. This finding is in line with the importance of time-fixed effects already discussed above (see Section 4.1). For shorter forecast horizons (
$R^2$
. This finding is in line with the importance of time-fixed effects already discussed above (see Section 4.1). For shorter forecast horizons ( $h=1,2$
) the most significant Phillips curve association is observed around the global financial crisis (i.e., between 2006 and 2009) and the period characterized by ultra-low interest rates (i.e., between 2014 and 2020). For the longer forecast horizon (
$h=1,2$
) the most significant Phillips curve association is observed around the global financial crisis (i.e., between 2006 and 2009) and the period characterized by ultra-low interest rates (i.e., between 2014 and 2020). For the longer forecast horizon ( $h=5$
), we find a long period of a pretty stable and significant Phillips curve relationship between 2012 and 2017. However, the association is the highest for the most recent high inflation period. This is also indicated by a substantial increase of the adjusted
$h=5$
), we find a long period of a pretty stable and significant Phillips curve relationship between 2012 and 2017. However, the association is the highest for the most recent high inflation period. This is also indicated by a substantial increase of the adjusted $R^2$
to a level around 0.8 observed for each forecast horizon. This seems plausible as in this period the degree of anchoring of inflation expectations has started to deteriorate as seen in Figures 1 and 4.
$R^2$
to a level around 0.8 observed for each forecast horizon. This seems plausible as in this period the degree of anchoring of inflation expectations has started to deteriorate as seen in Figures 1 and 4.
4.4 Phillips Curve-based uncertainty relationship
In the following, we also discuss estimation results carried out for the relationship between the forecasters’ uncertainties regarding inflation and unemployment based on the Phillips curve concept. We are focusing on the co-movement between two different categories of uncertainty while the previous literature often focuses on cross-country spillovers of different uncertainty measures (Klößner and Sekkel, Reference Klößner and Sekkel2014; Caggiano et al. Reference Caggiano, Castelnuovo and Figueres2020; Thiem, Reference Thiem2020; Beckmann et al. Reference Beckmann, Davidson, Koop and Schüssler2023). The corresponding findings are summarized in Tables 5 to 7 for the three forecast horizons ( $h=1,2,5$
). Across all different specifications, there is a positive connection between inflation and unemployment uncertainty, which is highly significant and robust across the forecast horizons. Accounting for the anchoring measure even strengthens the relationship between uncertainties regarding the two macro variables. More than 50% of the variation in inflation uncertainty is explained by unemployment uncertainty when referring to the adjusted
$h=1,2,5$
). Across all different specifications, there is a positive connection between inflation and unemployment uncertainty, which is highly significant and robust across the forecast horizons. Accounting for the anchoring measure even strengthens the relationship between uncertainties regarding the two macro variables. More than 50% of the variation in inflation uncertainty is explained by unemployment uncertainty when referring to the adjusted $R^2$
.
$R^2$
.
This shows that the uncertainties regarding both macro variables move together in line with the Phillips curve framework. This is particular relevant in the most recent high inflation period. On the one hand, uncertainty regarding the length and strength of the high inflation period also raises uncertainty regarding future unemployment. On the other hand, uncertainty regarding unemployment due to a potential recession forced by higher energy prices or by a tightening of monetary policy also favors a higher uncertainty regarding future inflation.
The finding of a significantly positive relationship between uncertainty regarding inflation and unemployment is also confirmed on an individual forecaster level (see Figure 9) and when allowing the coefficient to change over time (see Figure 10). Especially, the latter underlines the robustness of this finding even further.
Phillips curve uncertainty regression results for $h=1$
$h=1$
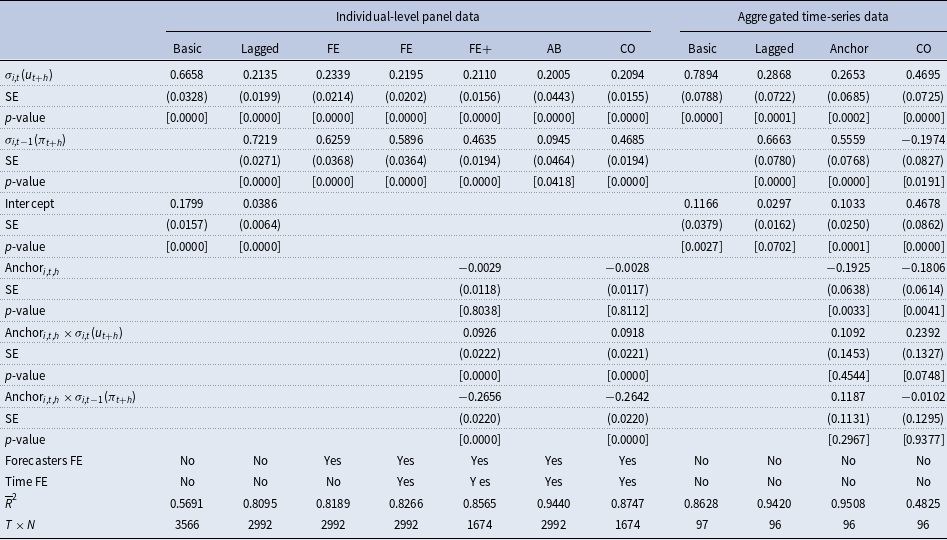
Note: The table reports coefficient estimates, heteroskedasticity and autocorrelation robust (HAC), standard errors (SE) according to Arellano (Reference Arellano1987), $p$
-values, the adjusted
$p$
-values, the adjusted $R^2$
(
$R^2$
( $\overline{R}^2$
), and the number of observations (
$\overline{R}^2$
), and the number of observations ( $T\times N$
) for different versions of the following general regression model:
$T\times N$
) for different versions of the following general regression model:
 \begin{equation*} \sigma _{i,t}(\pi _{t+h})=\beta _1\sigma _{i,t}(u_{t+h})+\beta _2\sigma _{i,t-1}(\pi _{t+h})+\beta _3\text {Anchor}_{i,t,h}+\beta _4\text {Anchor}_{i,t,h}\times \sigma _{i,t}(u_{t+h})+\beta _5\text {Anchor}_{i,t,h}\times \sigma _{i,t-1}(\pi _{t+h})+\mu _i+\gamma _t+\varepsilon _{i,t} \end{equation*}
where $\sigma _{i,t}(\pi _{t+h})$
represents inflation uncertainty proxied by the standard deviation of density forecasts made in period
$\sigma _{i,t}(\pi _{t+h})$
represents inflation uncertainty proxied by the standard deviation of density forecasts made in period $t$
by forecaster
$t$
by forecaster $i$
for a horizon of
$i$
for a horizon of $h$
-years-ahead,
$h$
-years-ahead, $\sigma _{i,t}(u_{t+h})$
denotes the correspondingly computed unemployment uncertainty,
$\sigma _{i,t}(u_{t+h})$
denotes the correspondingly computed unemployment uncertainty, $\sigma _{i,t-1}(\pi _{t+h})$
gives inflation uncertainty based on the previous quarters density forecast, and
$\sigma _{i,t-1}(\pi _{t+h})$
gives inflation uncertainty based on the previous quarters density forecast, and $\text{Anchor}_{i,t,h}$
is a proxy measuring the individual degree of anchoring of inflation expectations.
$\text{Anchor}_{i,t,h}$
is a proxy measuring the individual degree of anchoring of inflation expectations. $\mu _i$
,
$\mu _i$
, $\gamma _t$
, and
$\gamma _t$
, and $\varepsilon _{i,t}$
characterize time-invariant forecaster-specific fixed effects, time fixed effects, and idiosyncratic errors, respectively. This general regression model has been restricted to a pooled regression model with (Lagged) and without lagged inflation expectations (Basic), to a fixed effects (FE) model with and without time fixed effects and the anchoring measure (FE+). In addition, we have also estimated the model applying the Arellano and Bond (Reference Arellano and Bond1991) GMM estimator (AB) and an iterative Cochrane and Orcutt (Reference Cochrane and Orcutt1949) estimator (CO). The same model has also been estimated for aggregated time-series data using cross-sectional means across forecasters:
$\varepsilon _{i,t}$
characterize time-invariant forecaster-specific fixed effects, time fixed effects, and idiosyncratic errors, respectively. This general regression model has been restricted to a pooled regression model with (Lagged) and without lagged inflation expectations (Basic), to a fixed effects (FE) model with and without time fixed effects and the anchoring measure (FE+). In addition, we have also estimated the model applying the Arellano and Bond (Reference Arellano and Bond1991) GMM estimator (AB) and an iterative Cochrane and Orcutt (Reference Cochrane and Orcutt1949) estimator (CO). The same model has also been estimated for aggregated time-series data using cross-sectional means across forecasters:
 \begin{equation*} \overline {\sigma }_{t}(\pi _{t+h})=\beta _0+\beta _1\overline {\sigma }_t(u_{t+h})+\beta _2\overline {\sigma }_{t-1}(\pi _{t+h})+\beta _3\overline {\text {Anchor}}_{t,h}+\beta _4\overline {\text {Anchor}}_{t,h}\times \overline {\sigma }_t(u_{t+h})+\beta _5\overline {\text {Anchor}}_{t,h}\times \overline {\sigma }_{t-1}(\pi _{t+h})+\varepsilon _{t}. \end{equation*}
Phillips curve uncertainty regression results for $h=2$
$h=2$
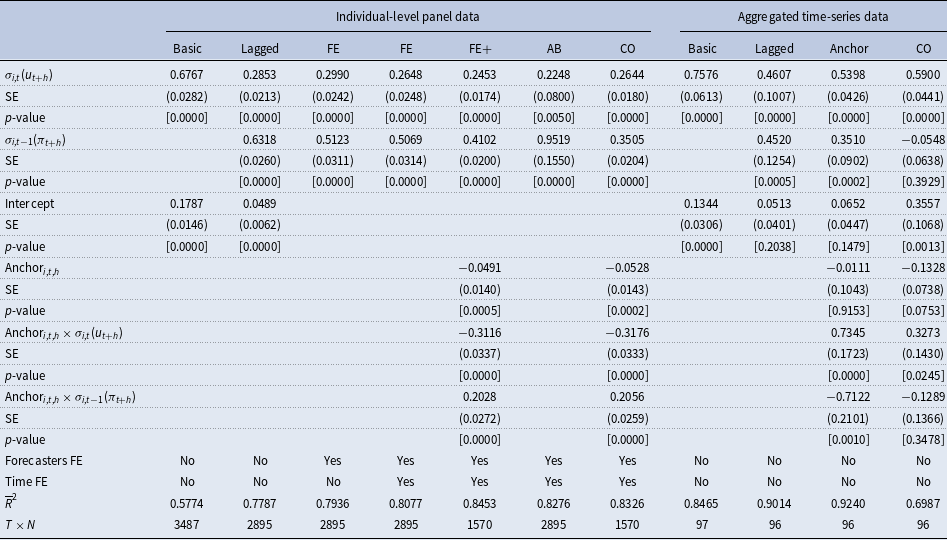
Note: The table reports coefficient estimates, heteroskedasticity and autocorrelation robust (HAC) standard errors (SE) according to Arellano (Reference Arellano1987), $p$
-values, the adjusted
$p$
-values, the adjusted $R^2$
(
$R^2$
( $\overline{R}^2$
), and the number of observations (
$\overline{R}^2$
), and the number of observations ( $T\times N$
) for different versions of the following general regression model:
$T\times N$
) for different versions of the following general regression model:
 \begin{equation*} \sigma _{i,t}(\pi _{t+h})=\beta _1\sigma _{i,t}(u_{t+h})+\beta _2\sigma _{i,t-1}(\pi _{t+h})+\beta _3\text {Anchor}_{i,t,h}+\beta _4\text {Anchor}_{i,t,h}\times \sigma _{i,t}(u_{t+h})+\beta _5\text {Anchor}_{i,t,h}\times \sigma _{i,t-1}(\pi _{t+h})+\mu _i+\gamma _t+\varepsilon _{i,t} \end{equation*}
where $\sigma _{i,t}(\pi _{t+h})$
represents inflation uncertainty proxied by the standard deviation of density forecasts made in period
$\sigma _{i,t}(\pi _{t+h})$
represents inflation uncertainty proxied by the standard deviation of density forecasts made in period $t$
by forecaster
$t$
by forecaster $i$
for a horizon of
$i$
for a horizon of $h$
-years-ahead,
$h$
-years-ahead, $\sigma _{i,t}(u_{t+h})$
denotes the correspondingly computed unemployment uncertainty,
$\sigma _{i,t}(u_{t+h})$
denotes the correspondingly computed unemployment uncertainty, $\sigma _{i,t-1}(\pi _{t+h})$
gives inflation uncertainty based on the previous quarters density forecast, and
$\sigma _{i,t-1}(\pi _{t+h})$
gives inflation uncertainty based on the previous quarters density forecast, and $\text{Anchor}_{i,t,h}$
is a proxy measuring the individual degree of anchoring of inflation expectations.
$\text{Anchor}_{i,t,h}$
is a proxy measuring the individual degree of anchoring of inflation expectations. $\mu _i$
,
$\mu _i$
, $\gamma _t$
, and
$\gamma _t$
, and $\varepsilon _{i,t}$
characterize time-invariant forecaster-specific fixed effects, time fixed effects, and idiosyncratic errors, respectively. This general regression model has been restricted to a pooled regression model with (Lagged) and without lagged inflation expectations (Basic), to a fixed-effects (FE) model with and without time fixed effects and the anchoring measure (FE+). In addition, we have also estimated the model applying the Arellano and Bond (Reference Arellano and Bond1991) GMM estimator (AB) and an iterative Cochrane and Orcutt (Reference Cochrane and Orcutt1949) estimator (CO). The same model has also been estimated for aggregated time-series data using cross-sectional means across forecasters:
$\varepsilon _{i,t}$
characterize time-invariant forecaster-specific fixed effects, time fixed effects, and idiosyncratic errors, respectively. This general regression model has been restricted to a pooled regression model with (Lagged) and without lagged inflation expectations (Basic), to a fixed-effects (FE) model with and without time fixed effects and the anchoring measure (FE+). In addition, we have also estimated the model applying the Arellano and Bond (Reference Arellano and Bond1991) GMM estimator (AB) and an iterative Cochrane and Orcutt (Reference Cochrane and Orcutt1949) estimator (CO). The same model has also been estimated for aggregated time-series data using cross-sectional means across forecasters:
 \begin{equation*} \overline {\sigma }_{t}(\pi _{t+h})=\beta _0+\beta _1\overline {\sigma }_t(u_{t+h})+\beta _2\overline {\sigma }_{t-1}(\pi _{t+h})+\beta _3\overline {\text {Anchor}}_{t,h}+\beta _4\overline {\text {Anchor}}_{t,h}\times \overline {\sigma }_t(u_{t+h})+\beta _5\overline {\text {Anchor}}_{t,h}\times \overline {\sigma }_{t-1}(\pi _{t+h})+\varepsilon _{t}. \end{equation*}
Phillips curve uncertainty regression results for $h=5$
$h=5$
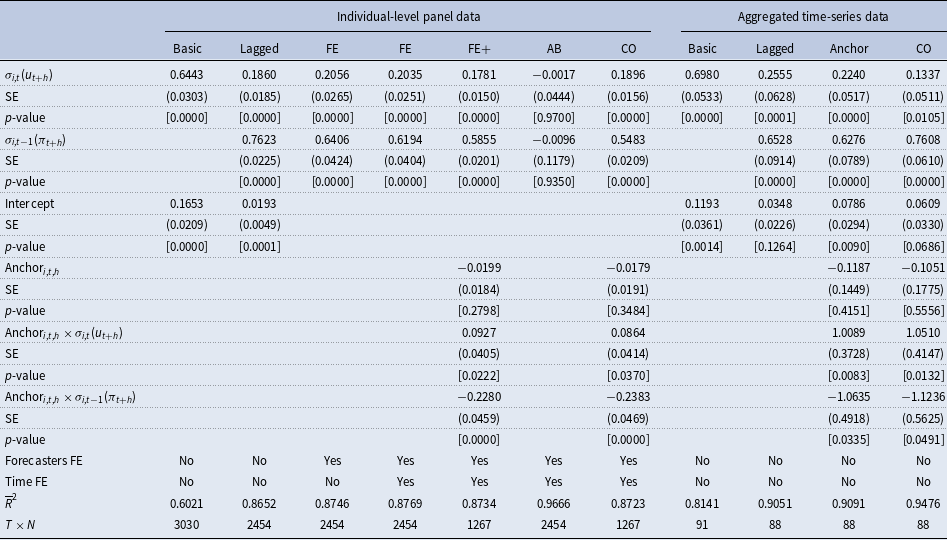
Note: The table reports coefficient estimates, heteroskedasticity and autocorrelation robust (HAC) standard errors (SE) according to Arellano (Reference Arellano1987), $p$
-values, the adjusted
$p$
-values, the adjusted $R^2$
(
$R^2$
( $\overline{R}^2$
), and the number of observations (
$\overline{R}^2$
), and the number of observations ( $T\times N$
) for different versions of the following general regression model:
$T\times N$
) for different versions of the following general regression model:
 \begin{equation*} \sigma _{i,t}(\pi _{t+h})=\beta _1\sigma _{i,t}(u_{t+h})+\beta _2\sigma _{i,t-1}(\pi _{t+h})+\beta _3\text {Anchor}_{i,t,h}+\beta _4\text {Anchor}_{i,t,h}\times \sigma _{i,t}(u_{t+h})+\beta _5\text {Anchor}_{i,t,h}\times \sigma _{i,t-1}(\pi _{t+h})+\mu _i+\gamma _t+\varepsilon _{i,t} \end{equation*}
where $\sigma _{i,t}(\pi _{t+h})$
represents inflation uncertainty proxied by the standard deviation of density forecasts made in period
$\sigma _{i,t}(\pi _{t+h})$
represents inflation uncertainty proxied by the standard deviation of density forecasts made in period $t$
by forecaster
$t$
by forecaster $i$
for a horizon of
$i$
for a horizon of $h$
-years-ahead,
$h$
-years-ahead, $\sigma _{i,t}(u_{t+h})$
denotes the correspondingly computed unemployment uncertainty,
$\sigma _{i,t}(u_{t+h})$
denotes the correspondingly computed unemployment uncertainty, $\sigma _{i,t-1}(\pi _{t+h})$
gives inflation uncertainty based on the previous quarters density forecast, and
$\sigma _{i,t-1}(\pi _{t+h})$
gives inflation uncertainty based on the previous quarters density forecast, and $\text{Anchor}_{i,t,h}$
is a proxy measuring the individual degree of anchoring of inflation expectations.
$\text{Anchor}_{i,t,h}$
is a proxy measuring the individual degree of anchoring of inflation expectations. $\mu _i$
,
$\mu _i$
, $\gamma _t$
, and
$\gamma _t$
, and $\varepsilon _{i,t}$
characterize time-invariant forecaster-specific fixed effects, time-fixed effects, and idiosyncratic errors, respectively. This general regression model has been restricted to a pooled regression model with (Lagged) and without lagged inflation expectations (Basic), to a fixed-effects (FE) model with and without time-fixed effects and the anchoring measure (FE+). In addition, we have also estimated the model applying the Arellano and Bond (Reference Arellano and Bond1991) GMM estimator (AB) and an iterative Cochrane and Orcutt (Reference Cochrane and Orcutt1949) estimator (CO). The same model has also been estimated for aggregated time-series data using cross-sectional means across forecasters:
$\varepsilon _{i,t}$
characterize time-invariant forecaster-specific fixed effects, time-fixed effects, and idiosyncratic errors, respectively. This general regression model has been restricted to a pooled regression model with (Lagged) and without lagged inflation expectations (Basic), to a fixed-effects (FE) model with and without time-fixed effects and the anchoring measure (FE+). In addition, we have also estimated the model applying the Arellano and Bond (Reference Arellano and Bond1991) GMM estimator (AB) and an iterative Cochrane and Orcutt (Reference Cochrane and Orcutt1949) estimator (CO). The same model has also been estimated for aggregated time-series data using cross-sectional means across forecasters:
 \begin{equation*} \overline {\sigma }_{t}(\pi _{t+h})=\beta _0+\beta _1\overline {\sigma }_t(u_{t+h})+\beta _2\overline {\sigma }_{t-1}(\pi _{t+h})+\beta _3\overline {\text {Anchor}}_{t,h}+\beta _4\overline {\text {Anchor}}_{t,h}\times \overline {\sigma }_t(u_{t+h})+\beta _5\overline {\text {Anchor}}_{t,h}\times \overline {\sigma }_{t-1}(\pi _{t+h})+\varepsilon _{t}. \end{equation*}
Individual Phillips curve uncertainty coefficients. The plots illustrate the estimated Phillips curve uncertainty coefficients and their standard errors from a regression of inflation uncertainty on unemployment uncertainty and lagged inflation uncertainty for the Euro Area on an individual forecaster level for different horizons $h$
(one-year-ahead, two-years-ahead, and five-years-ahead) for the period from 1999Q1 to 2023Q1 taken from the ECB Survey of Professional Forecasters. The red colored points refer to coefficients, which are significantly different from zero at a 5% level.
$h$
(one-year-ahead, two-years-ahead, and five-years-ahead) for the period from 1999Q1 to 2023Q1 taken from the ECB Survey of Professional Forecasters. The red colored points refer to coefficients, which are significantly different from zero at a 5% level.
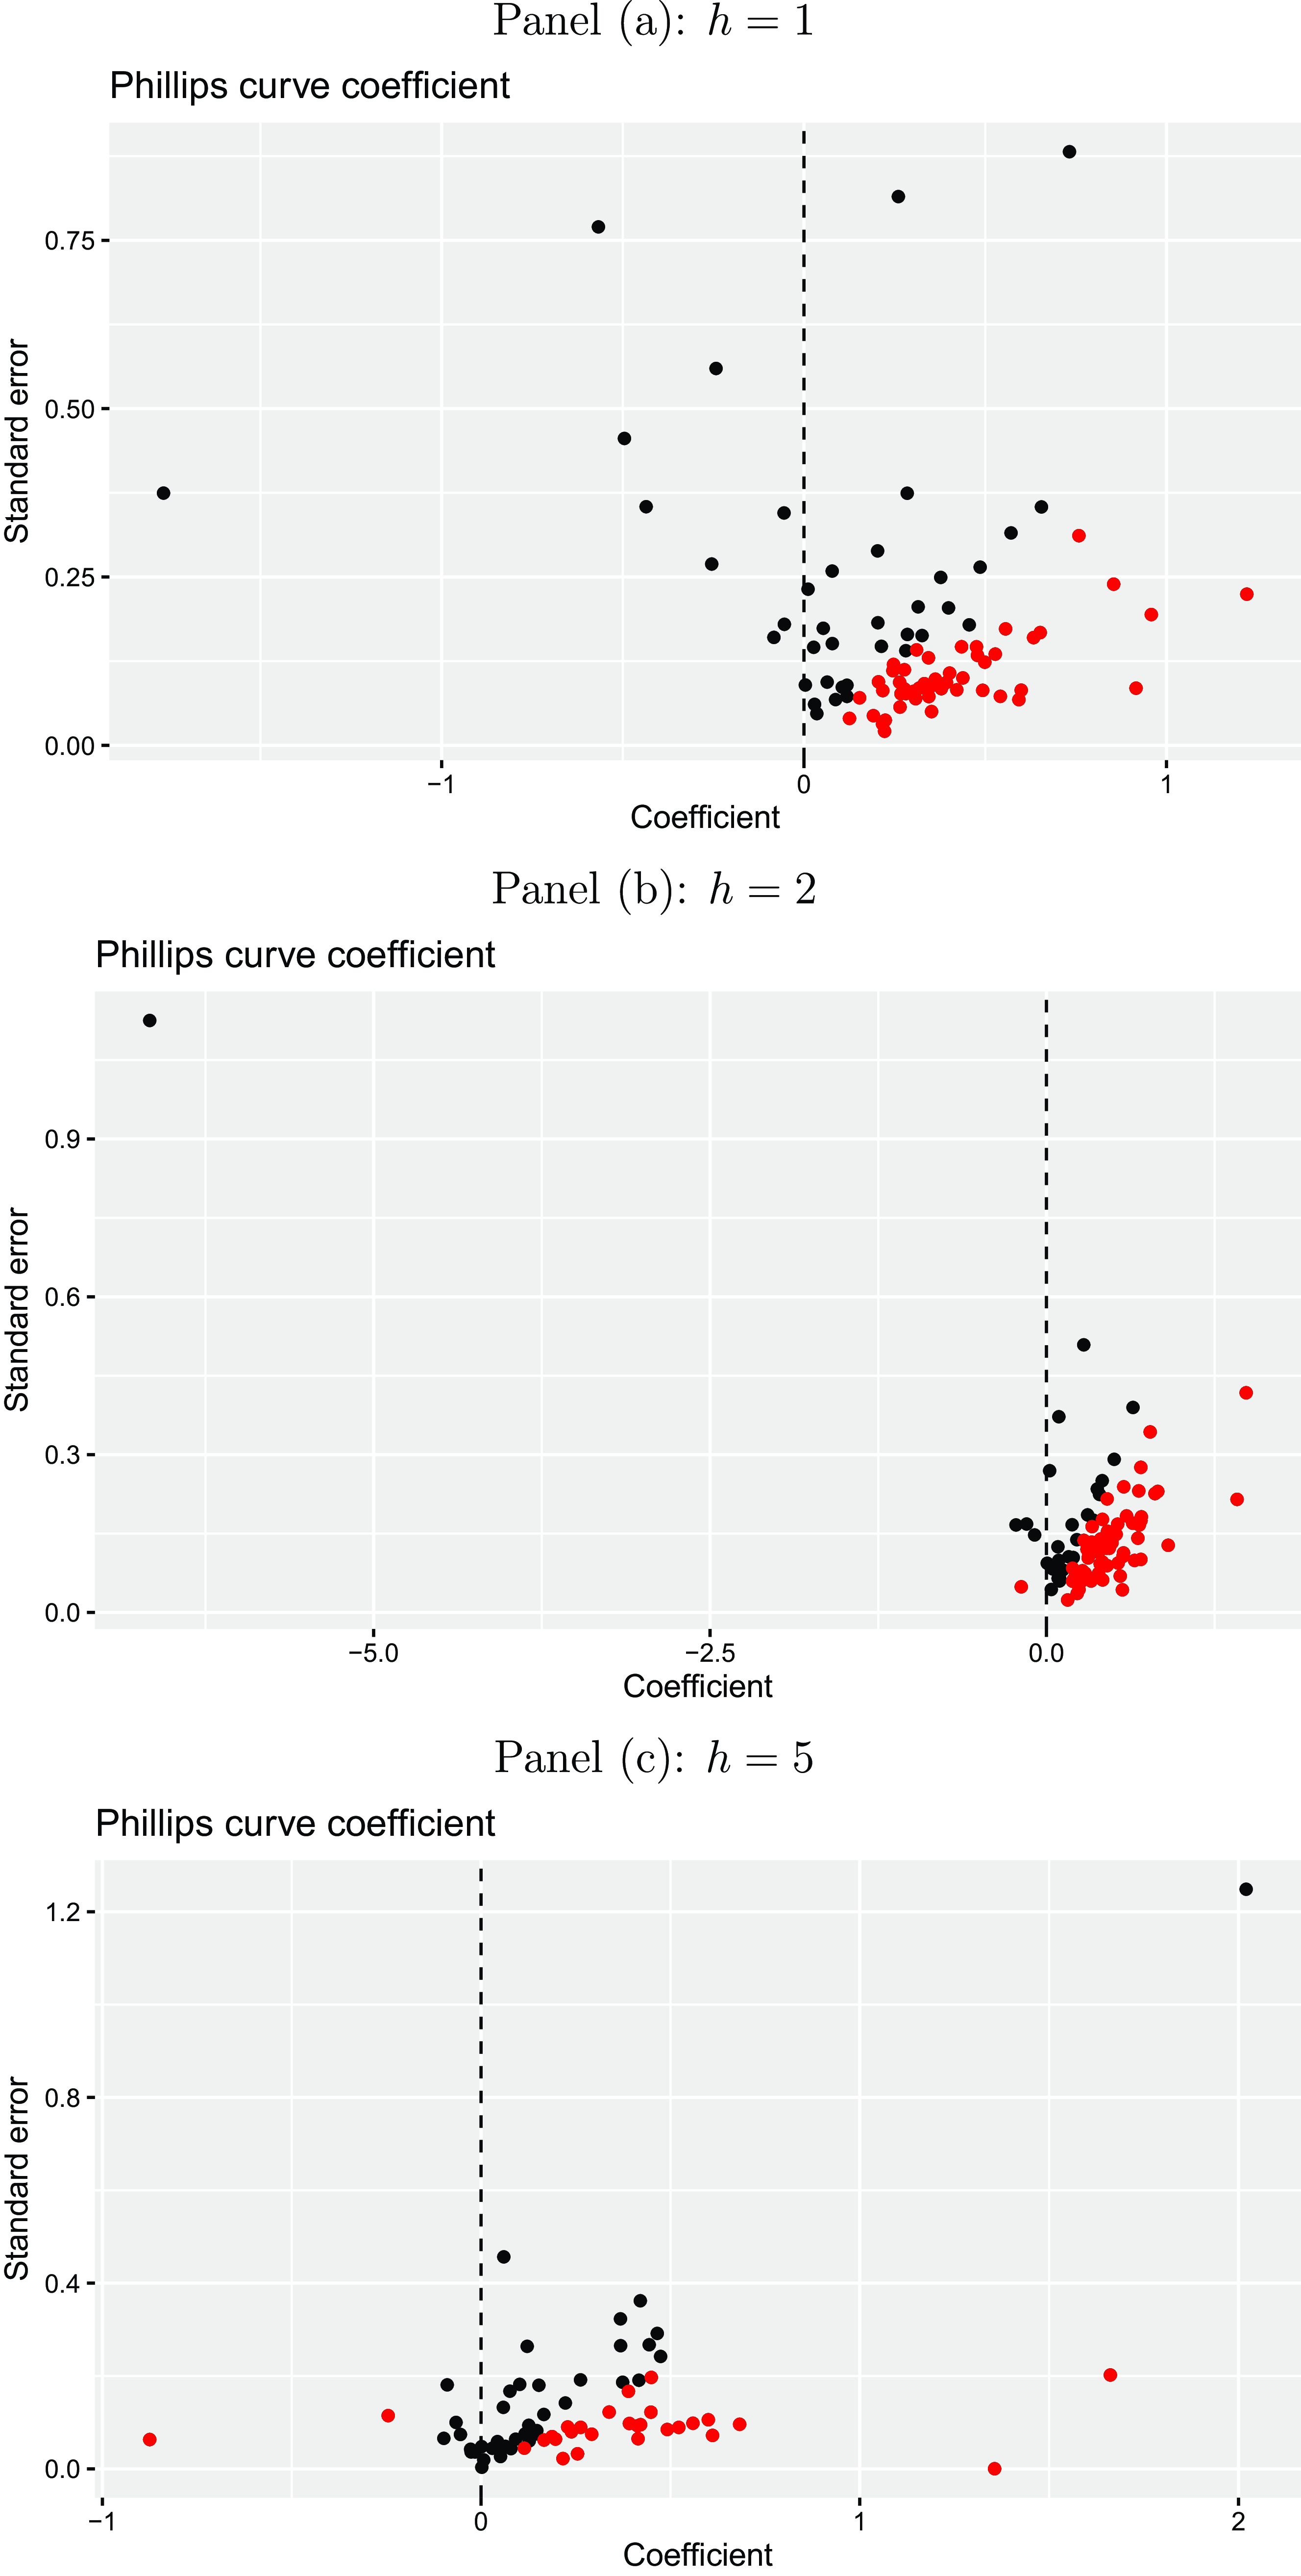
Time-varying Phillips curve uncertainty coefficients. The plots illustrate the Phillips curve uncertainty coefficients and corresponding adjusted $R^2$
s estimated by rolling-window fixed-effects regressions of inflation uncertainty on unemployment uncertainty and lagged inflation uncertainty for the Euro Area using panel data for different horizons
$R^2$
s estimated by rolling-window fixed-effects regressions of inflation uncertainty on unemployment uncertainty and lagged inflation uncertainty for the Euro Area using panel data for different horizons $h$
(one-year-ahead, two-years-ahead, and five-years-ahead) for the period from 1999Q1 to 2023Q1 taken from the ECB Survey of Professional Forecasters. The red colored points refer to coefficients, which are significantly different from zero at a 5% level. The window size is 20 quarters (= five years).
$h$
(one-year-ahead, two-years-ahead, and five-years-ahead) for the period from 1999Q1 to 2023Q1 taken from the ECB Survey of Professional Forecasters. The red colored points refer to coefficients, which are significantly different from zero at a 5% level. The window size is 20 quarters (= five years).

5. Summary and concluding remarks
The present study contributes to the existing literature by studying the expectation formation mechanism of professional forecasters. In doing so, we reassess whether forecasters form their expectations regarding future inflation and unemployment consistent with the concept of the Phillips curve. The contribution of our study to this specific strand of the literature is threefold. First, we do not solely focus on point forecasts but also take into account information of individual forecasts for the entire distribution. Second, we explicitly address the role of anchoring of inflation expectations for the estimation of an expectations-based Phillips curve relationship while using a novel anchoring measure. Third, we assess a Phillips curve-based link between uncertainty regarding inflation and unemployment.
Our main empirical findings are also threefold. First, our results indicate that professional forecasters generally rely on the concept of the Phillips curve for lower forecast horizons (i.e., one- and two-years-ahead). However, this relationship mostly disappears for medium-run forecasts (i.e., for five-years-ahead forecasts). Second, the consideration of the anchoring measure indicates some nonlinearity in the relationship. For an average degree of anchoring, there is a small but negative Phillips curve relationship between expectations for future inflation and unemployment. For a low degree of anchoring this negative connection becomes much stronger while it disappears for a high degree of anchoring. The latter might be explained by fact that a high degree of anchoring results in stable inflation expectations close to the inflation target of the ECB of 2%, which are detached from unemployment expectations. Third, we also find that the uncertainties regarding future inflation and unemployment move together in line with the Phillips curve framework. This is particular relevant in the most recent high inflation period. On the one hand, uncertainty regarding the length and strength of the high inflation period also raises uncertainty regarding future unemployment. On the other hand, uncertainty regarding unemployment due to a potential recession forced by higher energy prices or by a tightening of monetary policy also favors a higher uncertainty regarding future inflation.
The connection between uncertainties regarding future inflation and unemployment offers further insights for policymakers and contributes to the literature concerning uncertainty spillovers across countries and across different macro variables. In this context, the consideration of ex ante measures of uncertainty derived from density forecasts for different other macro variables offers an avenue for future research. In addition, the nonlinearity in the Phillips curve could also be studied even further by taking into account whether a de-anchoring of inflation expectations refers to inflation expectations lying above or below the inflation target of the central bank.
Acknowledgments
Thanks for valuable comments are due to two anonymous reviewers and the participants of the 7th International Workshop on Financial Markets and Nonlinear Dynamics (FMND) in Paris, especially the discussant Daniel Parra-Amado.
Competing interest
The author declares that he has no known competing financial interests or personal relationships that could have appeared to influence the work reported in this paper.
Appendix A
Coverage of forecasters. The plot shows the coverage of each individual forecaster across the different waves in the ECB Survey of Professional Forecasters (Panel (a)) and the number of participating forecasters per wave (Panel (b)) for the period from 1999Q1 to 2023Q1.
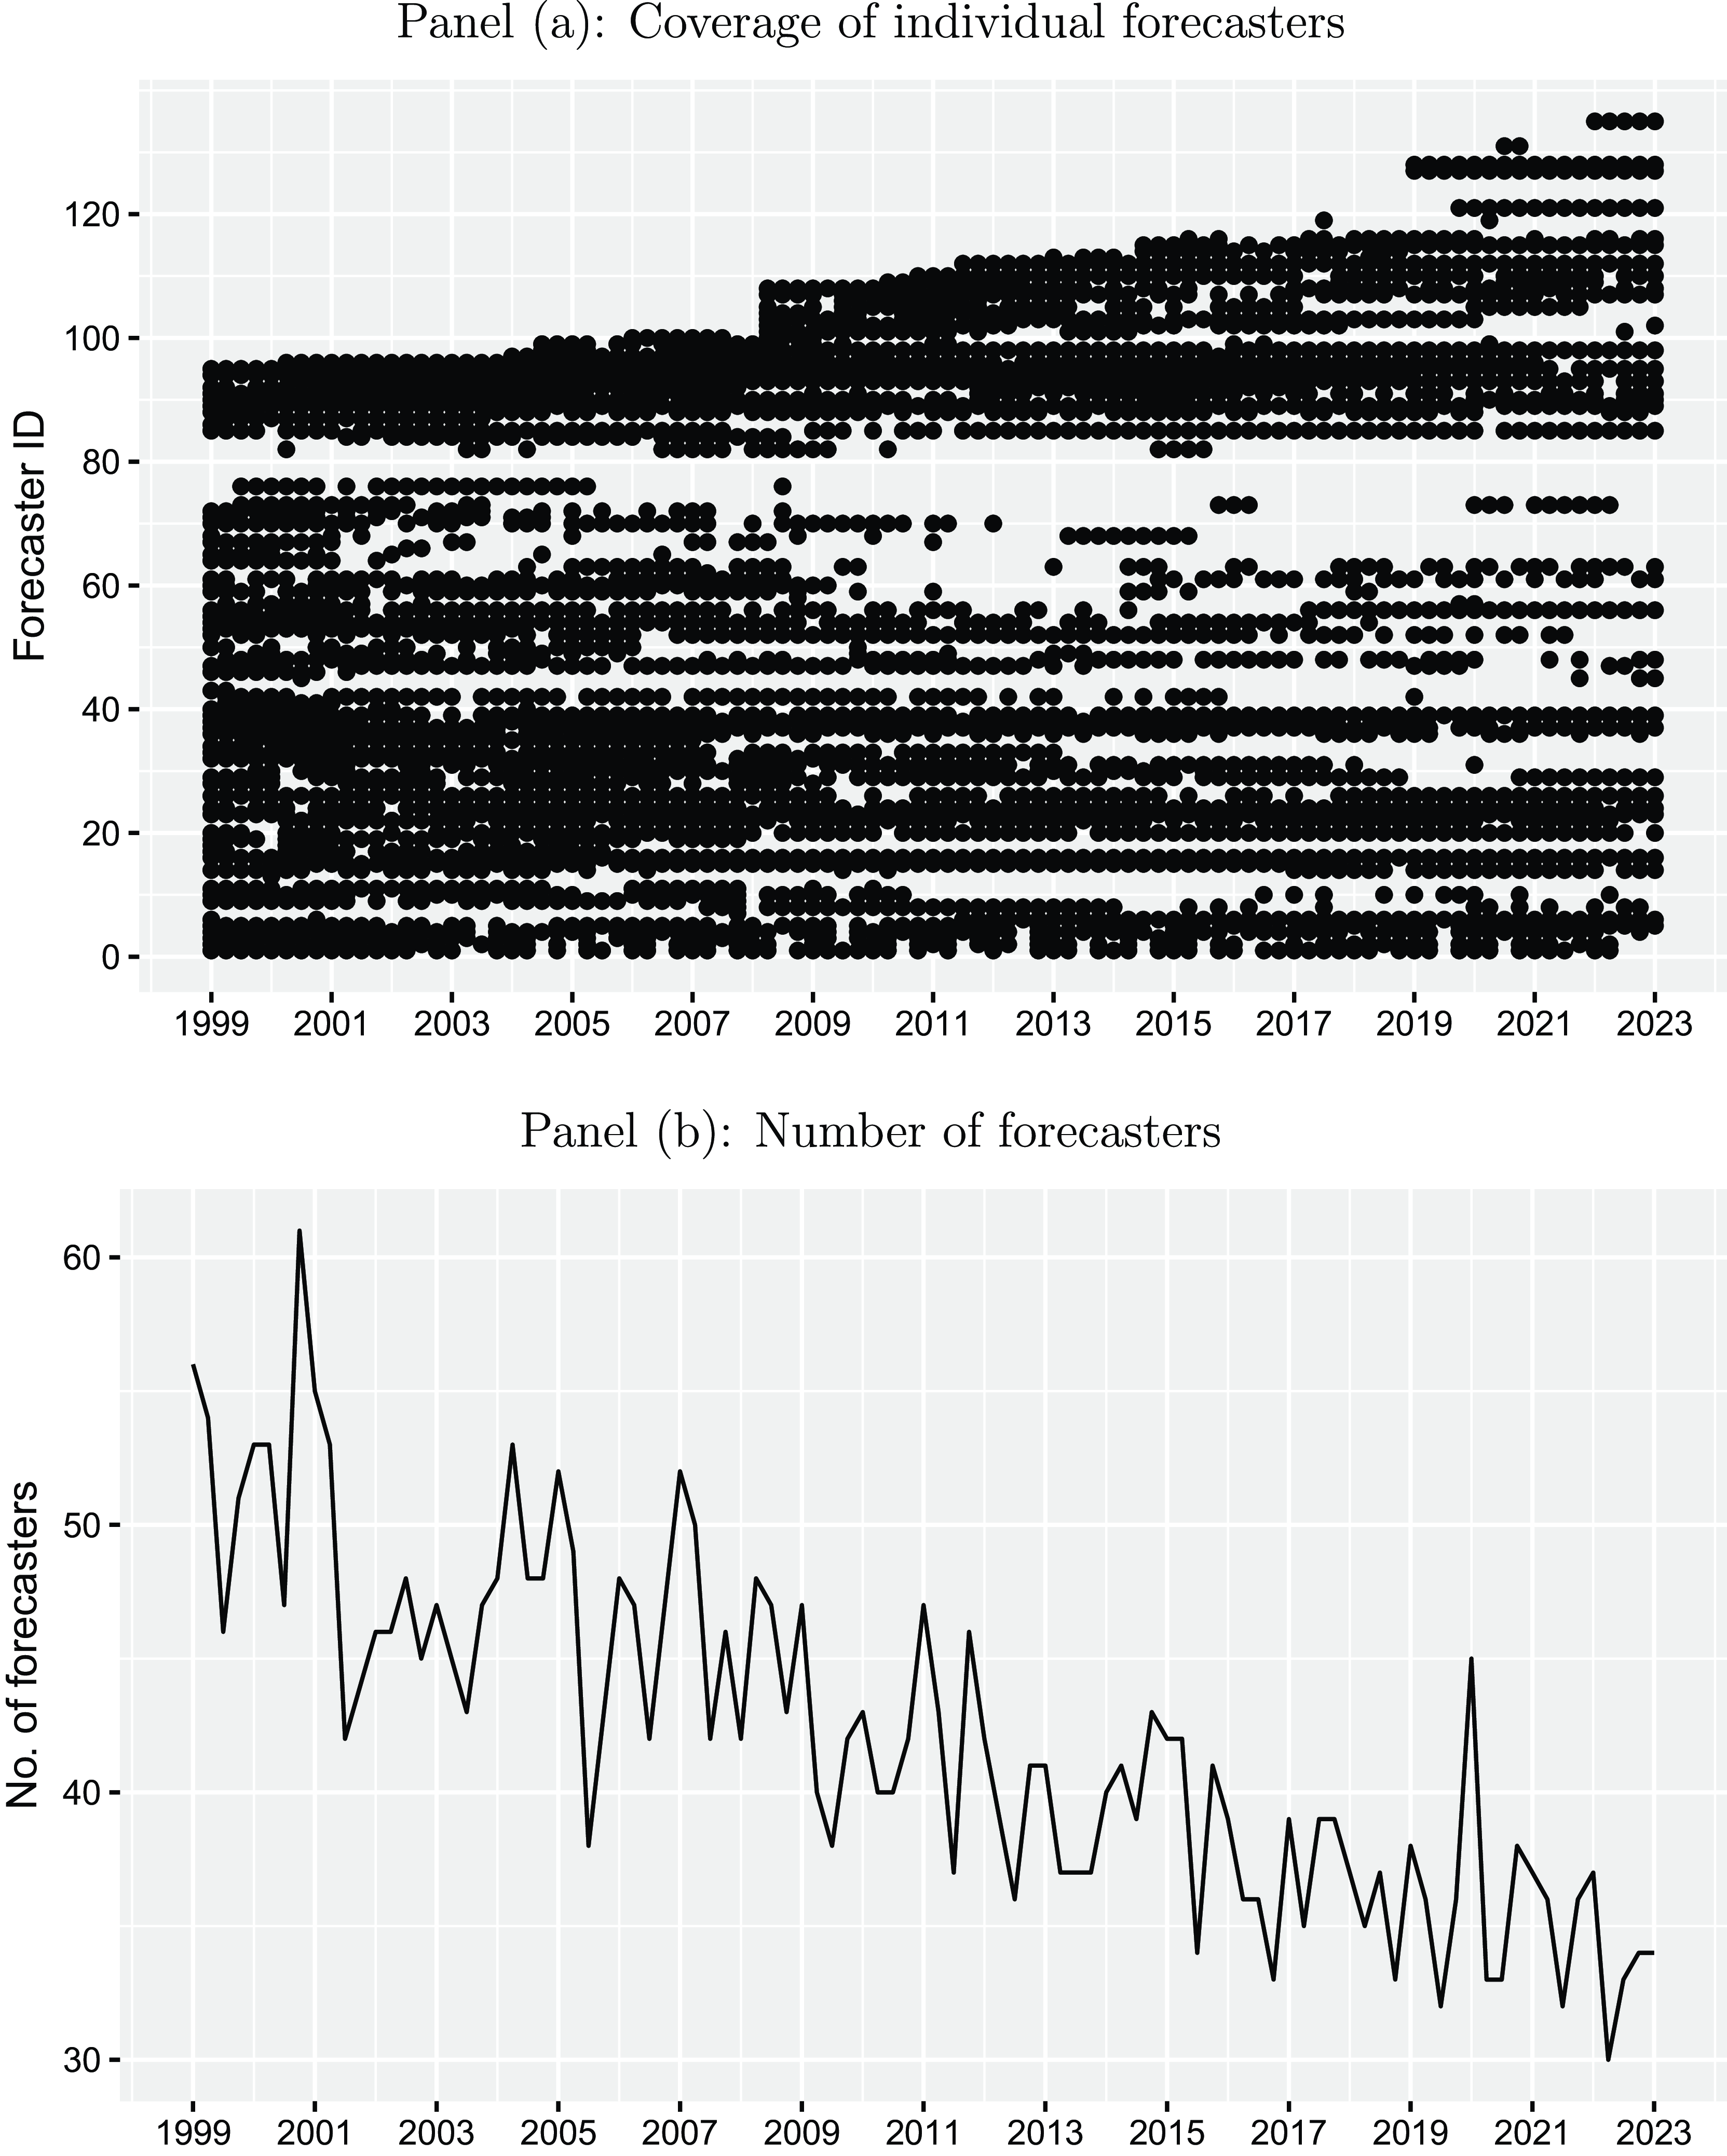
Forecasters’ uncertainty for inflation forecasts. The black points represent standard deviations derived from individual quarterly density forecasts for the inflation rate in the Euro Area (in percent per annum) for different horizons $h$
(one-year-ahead, two-years-ahead, and five-years-ahead) for the period from 1999Q1 to 2023Q1 taken from the ECB Survey of Professional Forecasters. The red lines provide the corresponding cross-sectional means of standard deviations across forecasters for each point in time.
$h$
(one-year-ahead, two-years-ahead, and five-years-ahead) for the period from 1999Q1 to 2023Q1 taken from the ECB Survey of Professional Forecasters. The red lines provide the corresponding cross-sectional means of standard deviations across forecasters for each point in time.
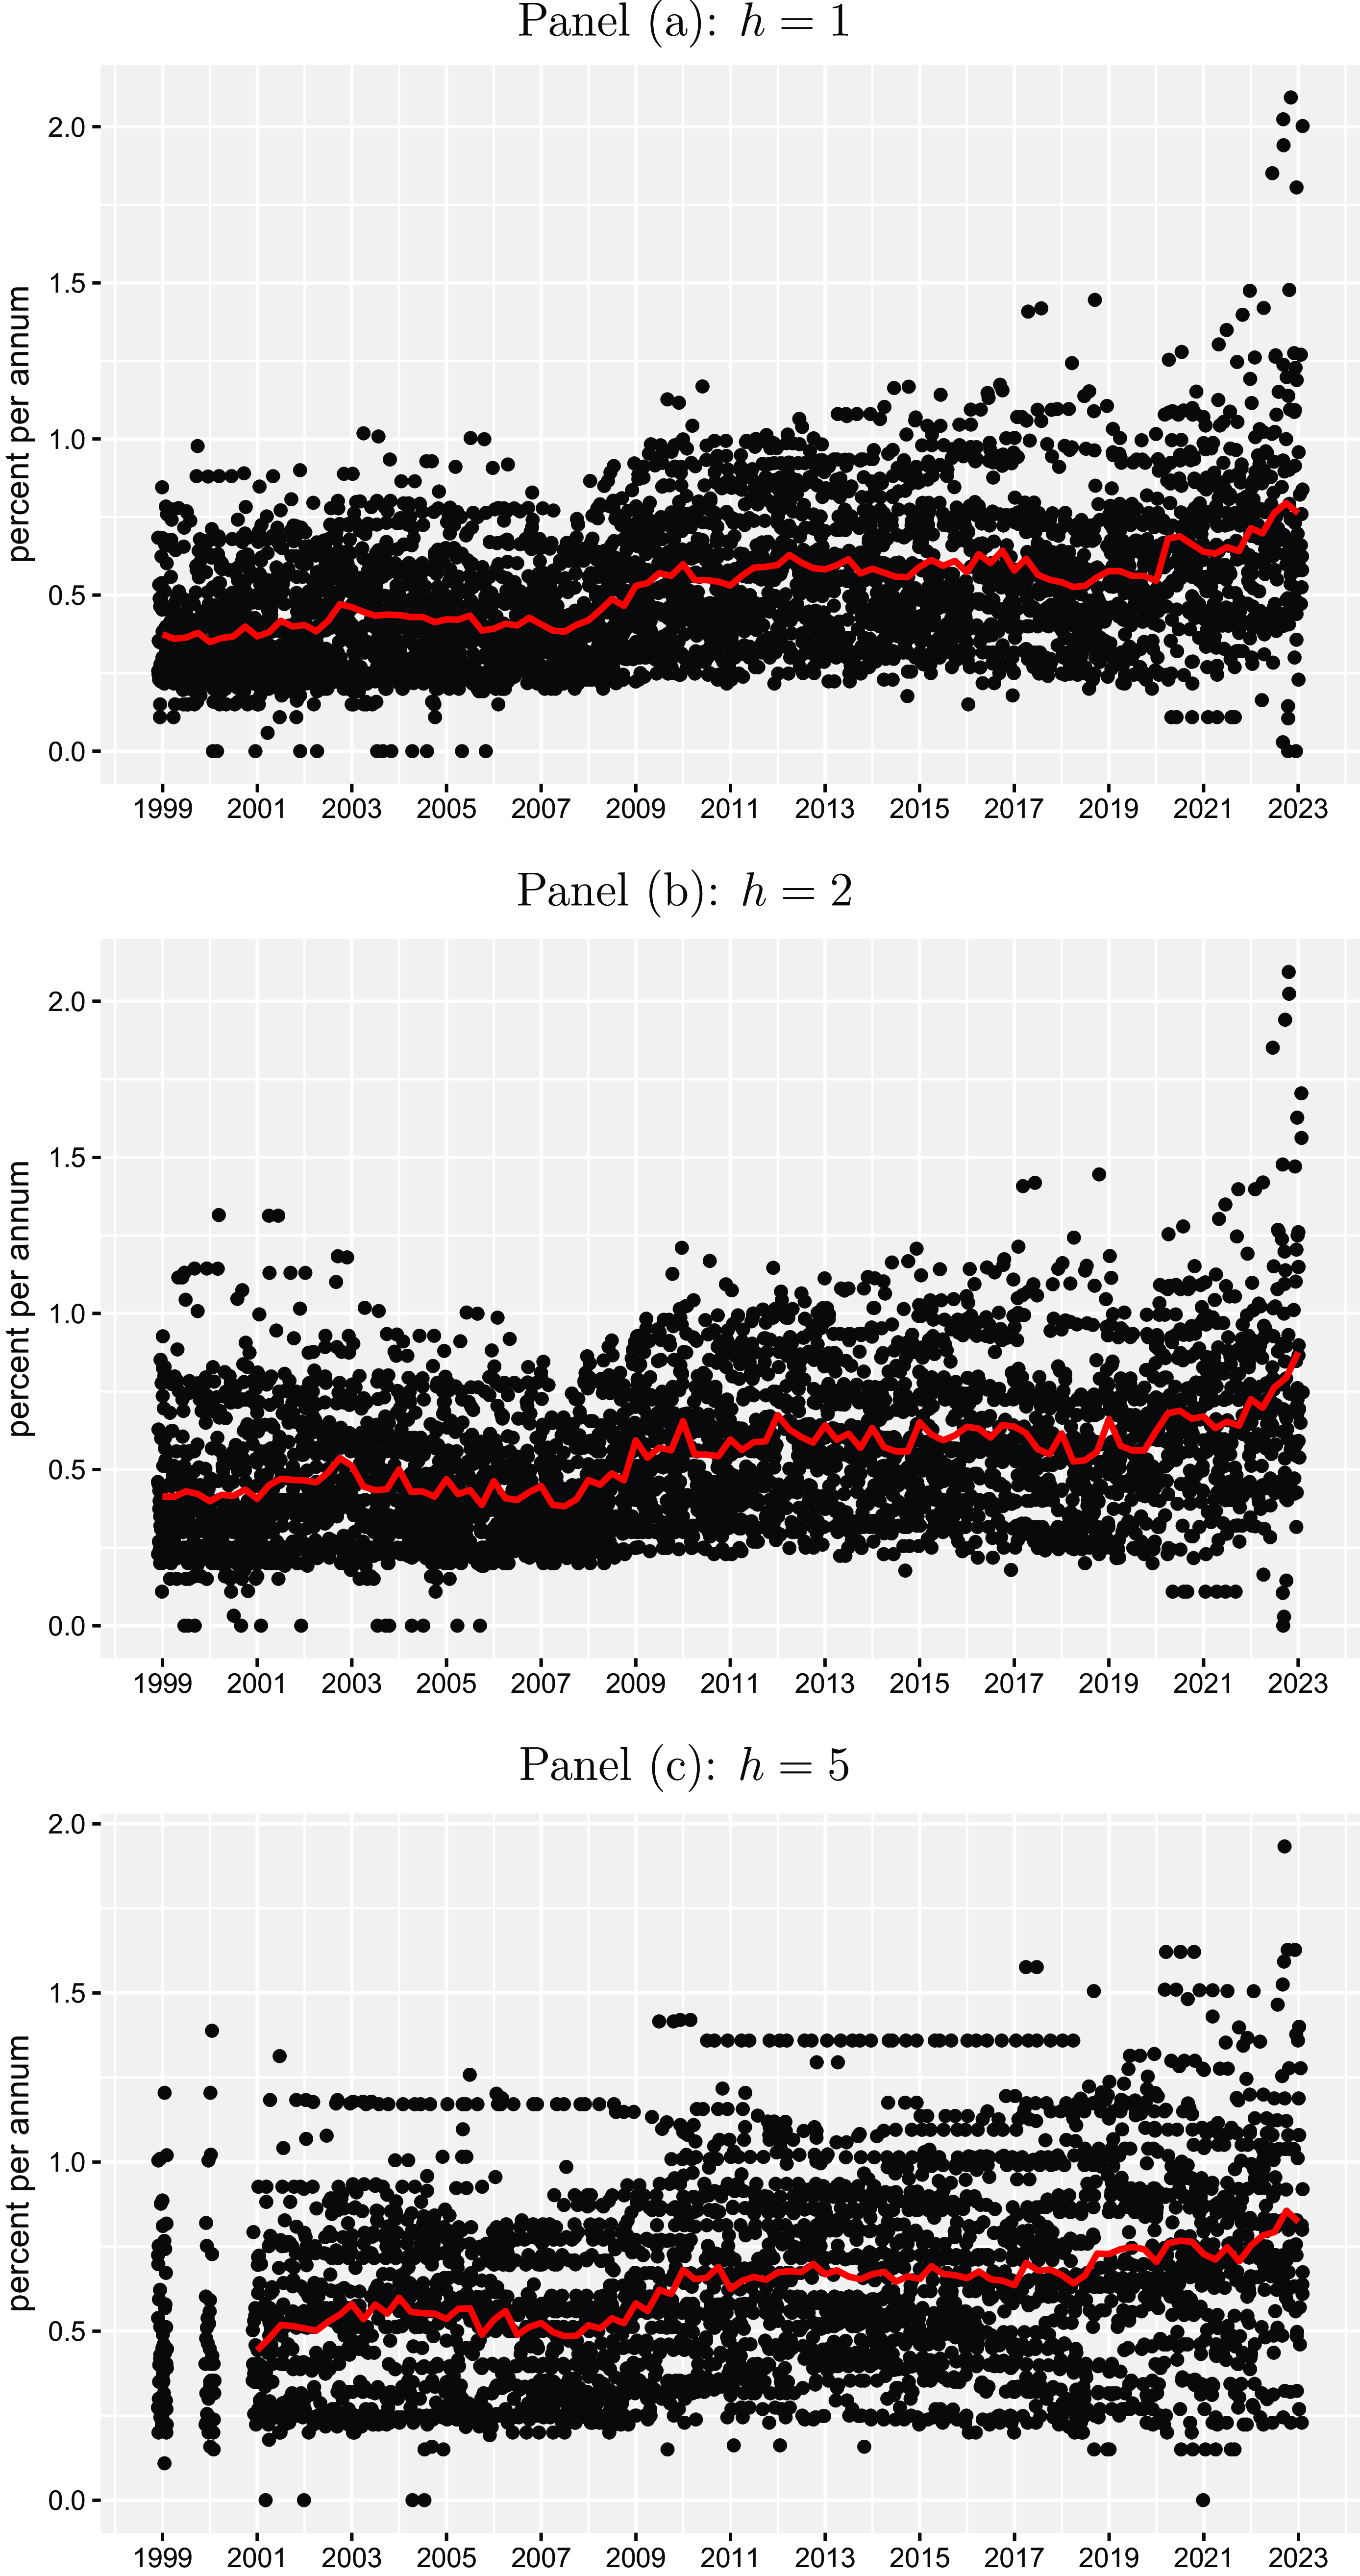
Forecasters’ uncertainty for unemployment forecasts. The black points represent standard deviations derived from individual quarterly density forecasts for the unemployment rate in the Euro Area (in percent per annum) for different horizons $h$
(one-year-ahead, two-years-ahead, and five-years-ahead) for the period from 1999Q1 to 2023Q1 taken from the ECB Survey of Professional Forecasters. The red lines provide the corresponding cross-sectional means of standard deviations across forecasters for each point in time.
$h$
(one-year-ahead, two-years-ahead, and five-years-ahead) for the period from 1999Q1 to 2023Q1 taken from the ECB Survey of Professional Forecasters. The red lines provide the corresponding cross-sectional means of standard deviations across forecasters for each point in time.
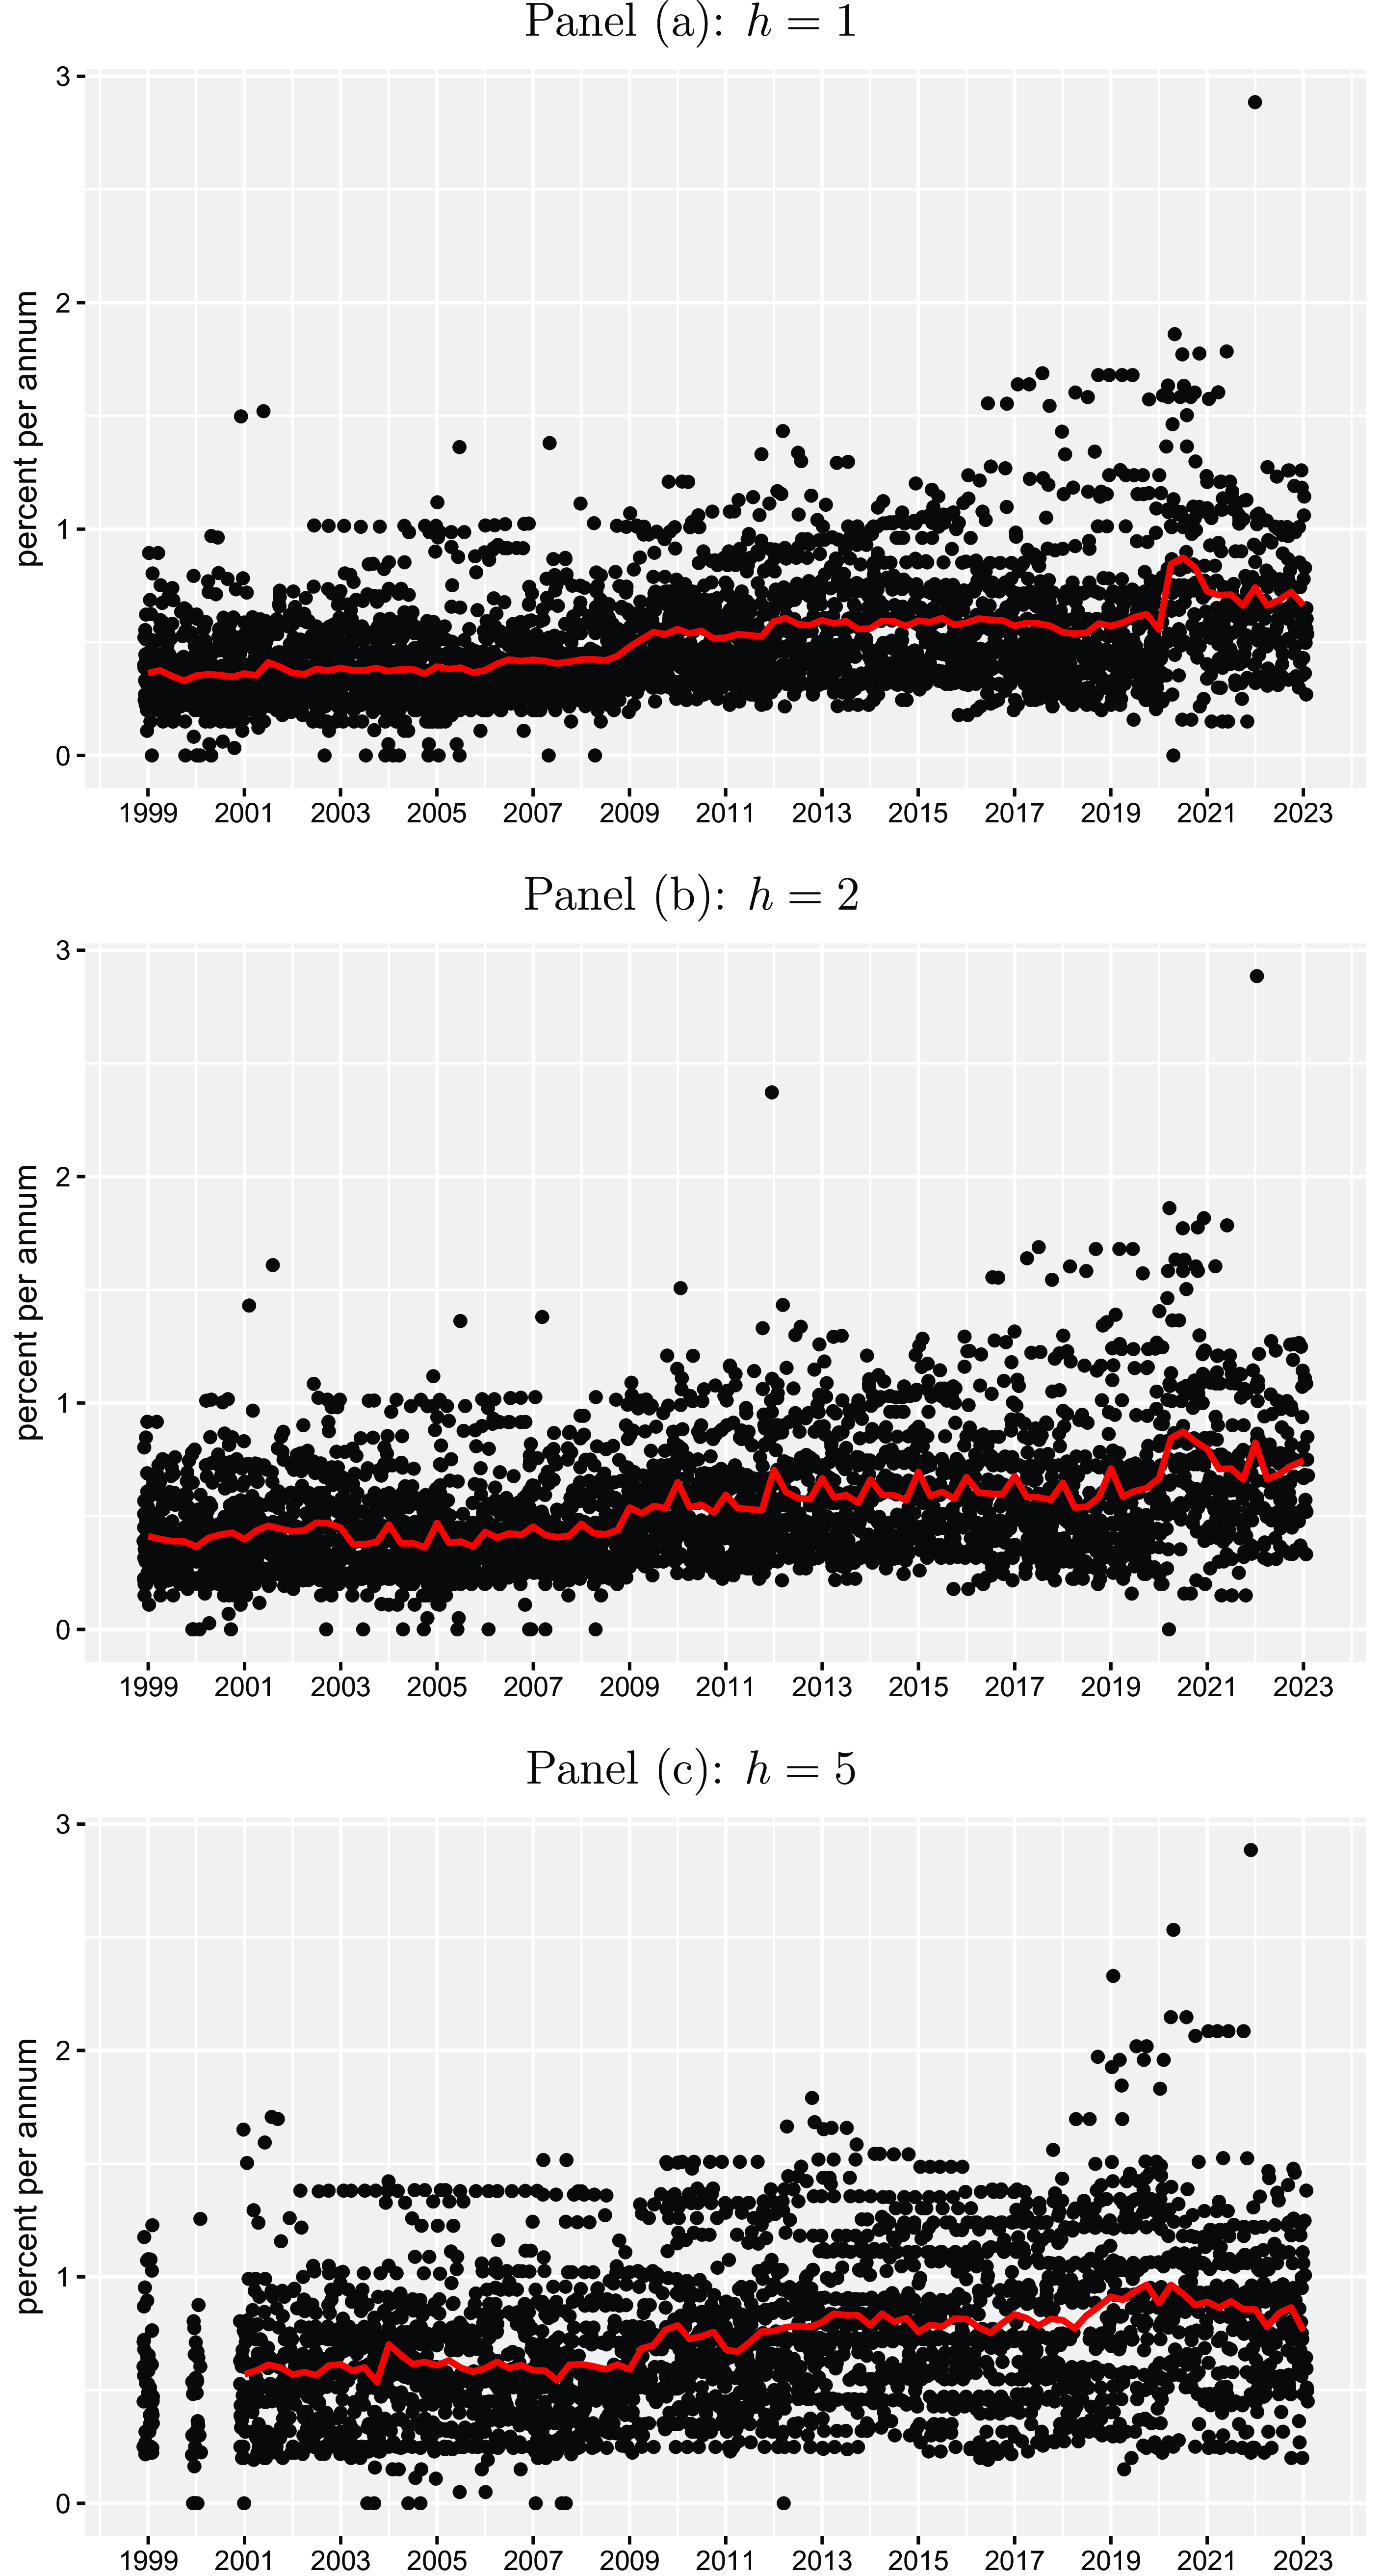
Phillips curve expectations relationship. The plots illustrate the relationship between inflation expectations and unemployment expectations for the Euro Area on an aggregated level for different horizons $h$
(one-year-ahead, two-years-ahead, and five-years-ahead) for the period from 1999Q1 to 2023Q1 taken from the ECB Survey of Professional Forecasters. Each point refers to the cross-sectional mean across forecasters at each period.
$h$
(one-year-ahead, two-years-ahead, and five-years-ahead) for the period from 1999Q1 to 2023Q1 taken from the ECB Survey of Professional Forecasters. Each point refers to the cross-sectional mean across forecasters at each period.
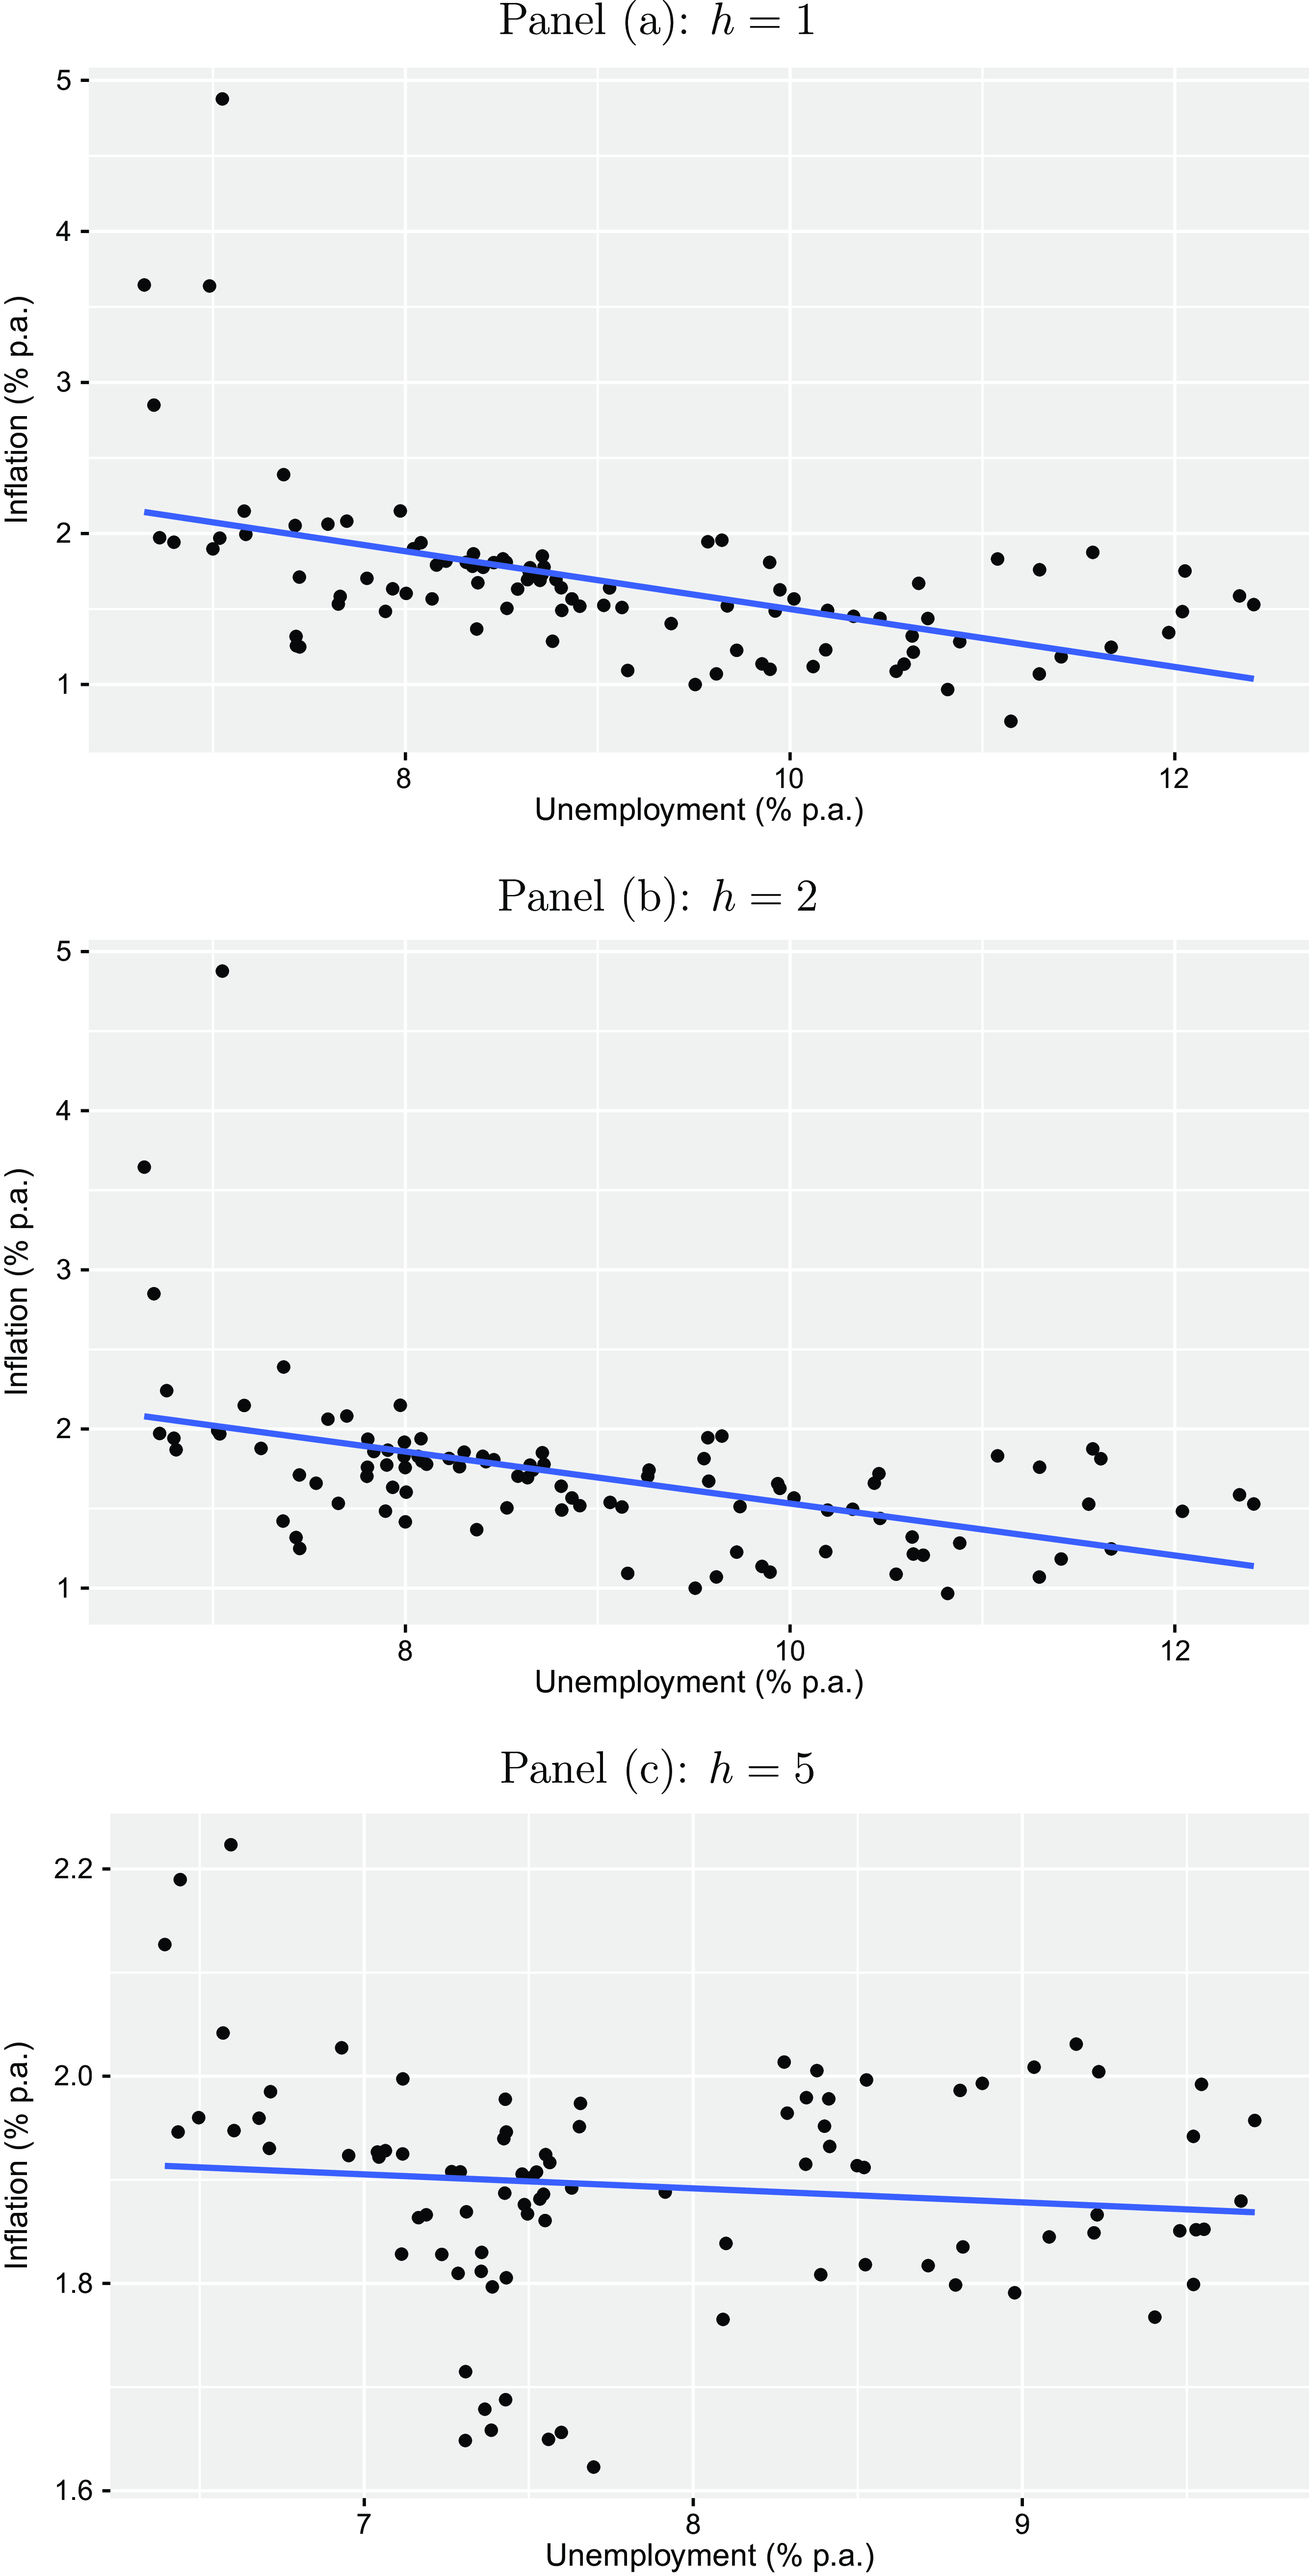
Phillips curve uncertainty relationship. The plots illustrate the relationship between inflation uncertainty and unemployment uncertainty for the Euro Area on an aggregated level for different horizons $h$
(one-year-ahead, two-years-ahead, and five-years-ahead) for the period from 1999Q1 to 2023Q1 taken from the ECB Survey of Professional Forecasters. Uncertainty is proxied by the standard deviation of each forecasters density forecast. Each point refers to the cross-sectional mean across forecasters at each period.
$h$
(one-year-ahead, two-years-ahead, and five-years-ahead) for the period from 1999Q1 to 2023Q1 taken from the ECB Survey of Professional Forecasters. Uncertainty is proxied by the standard deviation of each forecasters density forecast. Each point refers to the cross-sectional mean across forecasters at each period.
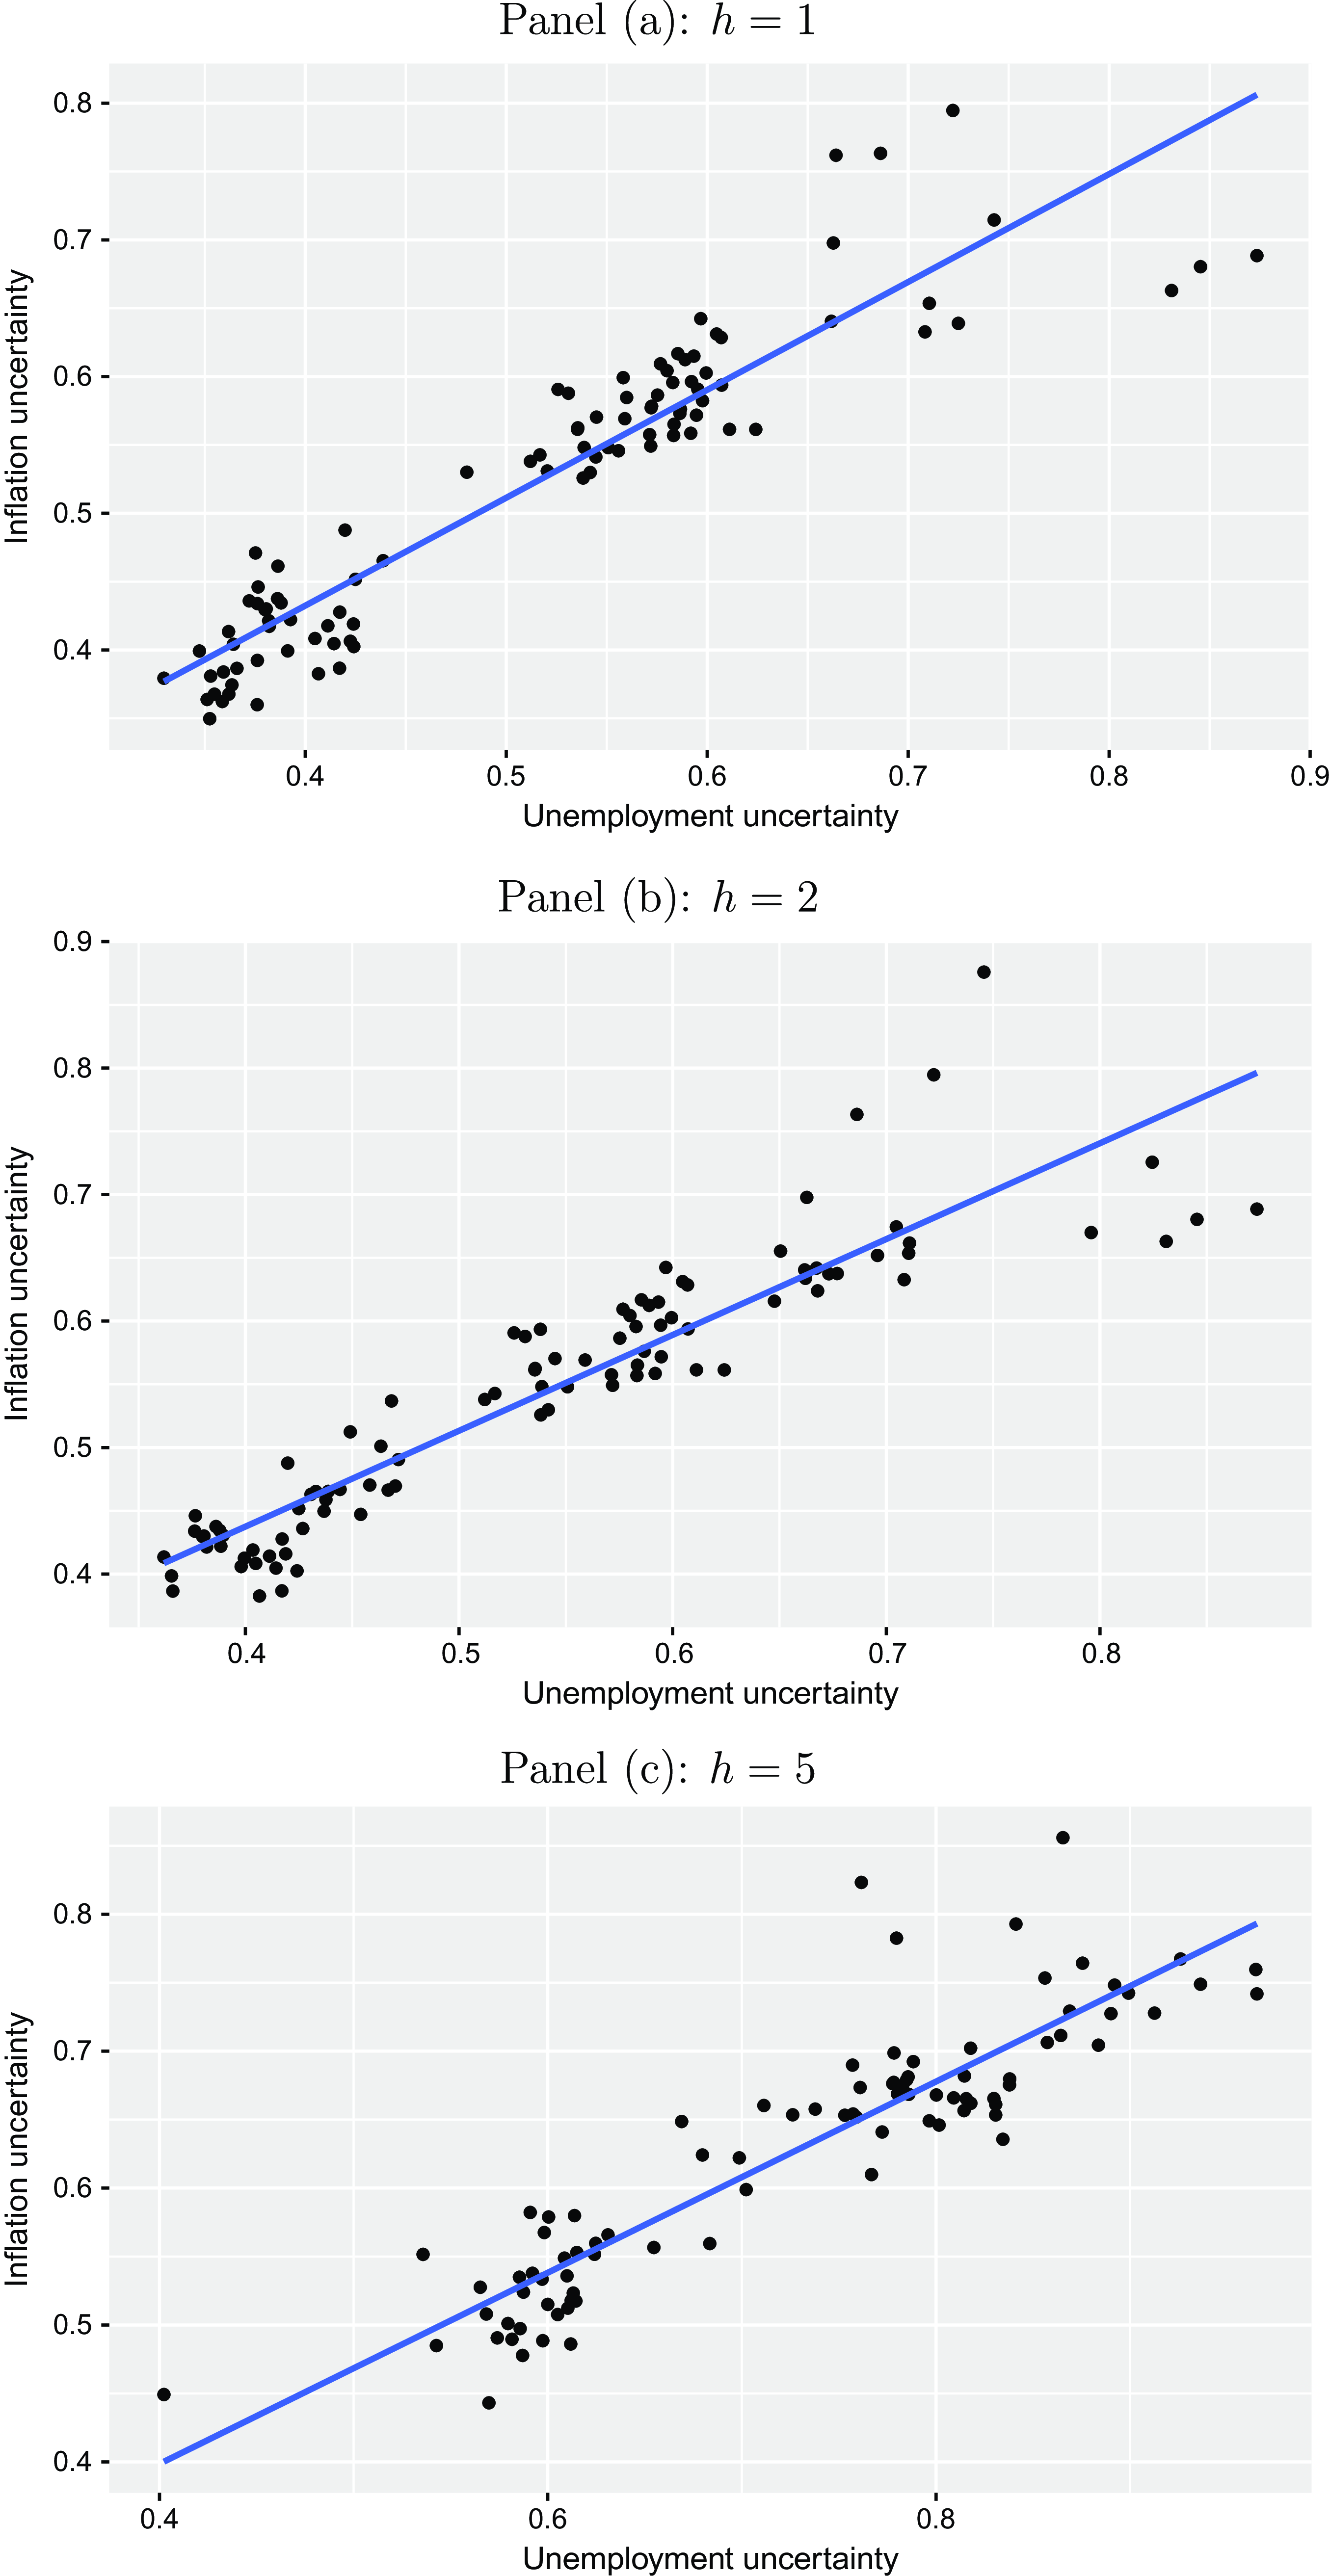
Individual autoregressive expectations coefficients. The plots illustrate the estimated autoregressive expectations coefficients and their standard errors from a regression of inflation expectations on unemployment expectations and lagged inflation expectations for the Euro Area on an individual forecaster level for different horizons $h$
(one-year-ahead, two-years-ahead, and five-years-ahead) for the period from 1999Q1 to 2023Q1 taken from the ECB Survey of Professional Forecasters. The blue colored points refer to coefficients, which are not significantly different from unity at a 5% level.
$h$
(one-year-ahead, two-years-ahead, and five-years-ahead) for the period from 1999Q1 to 2023Q1 taken from the ECB Survey of Professional Forecasters. The blue colored points refer to coefficients, which are not significantly different from unity at a 5% level.
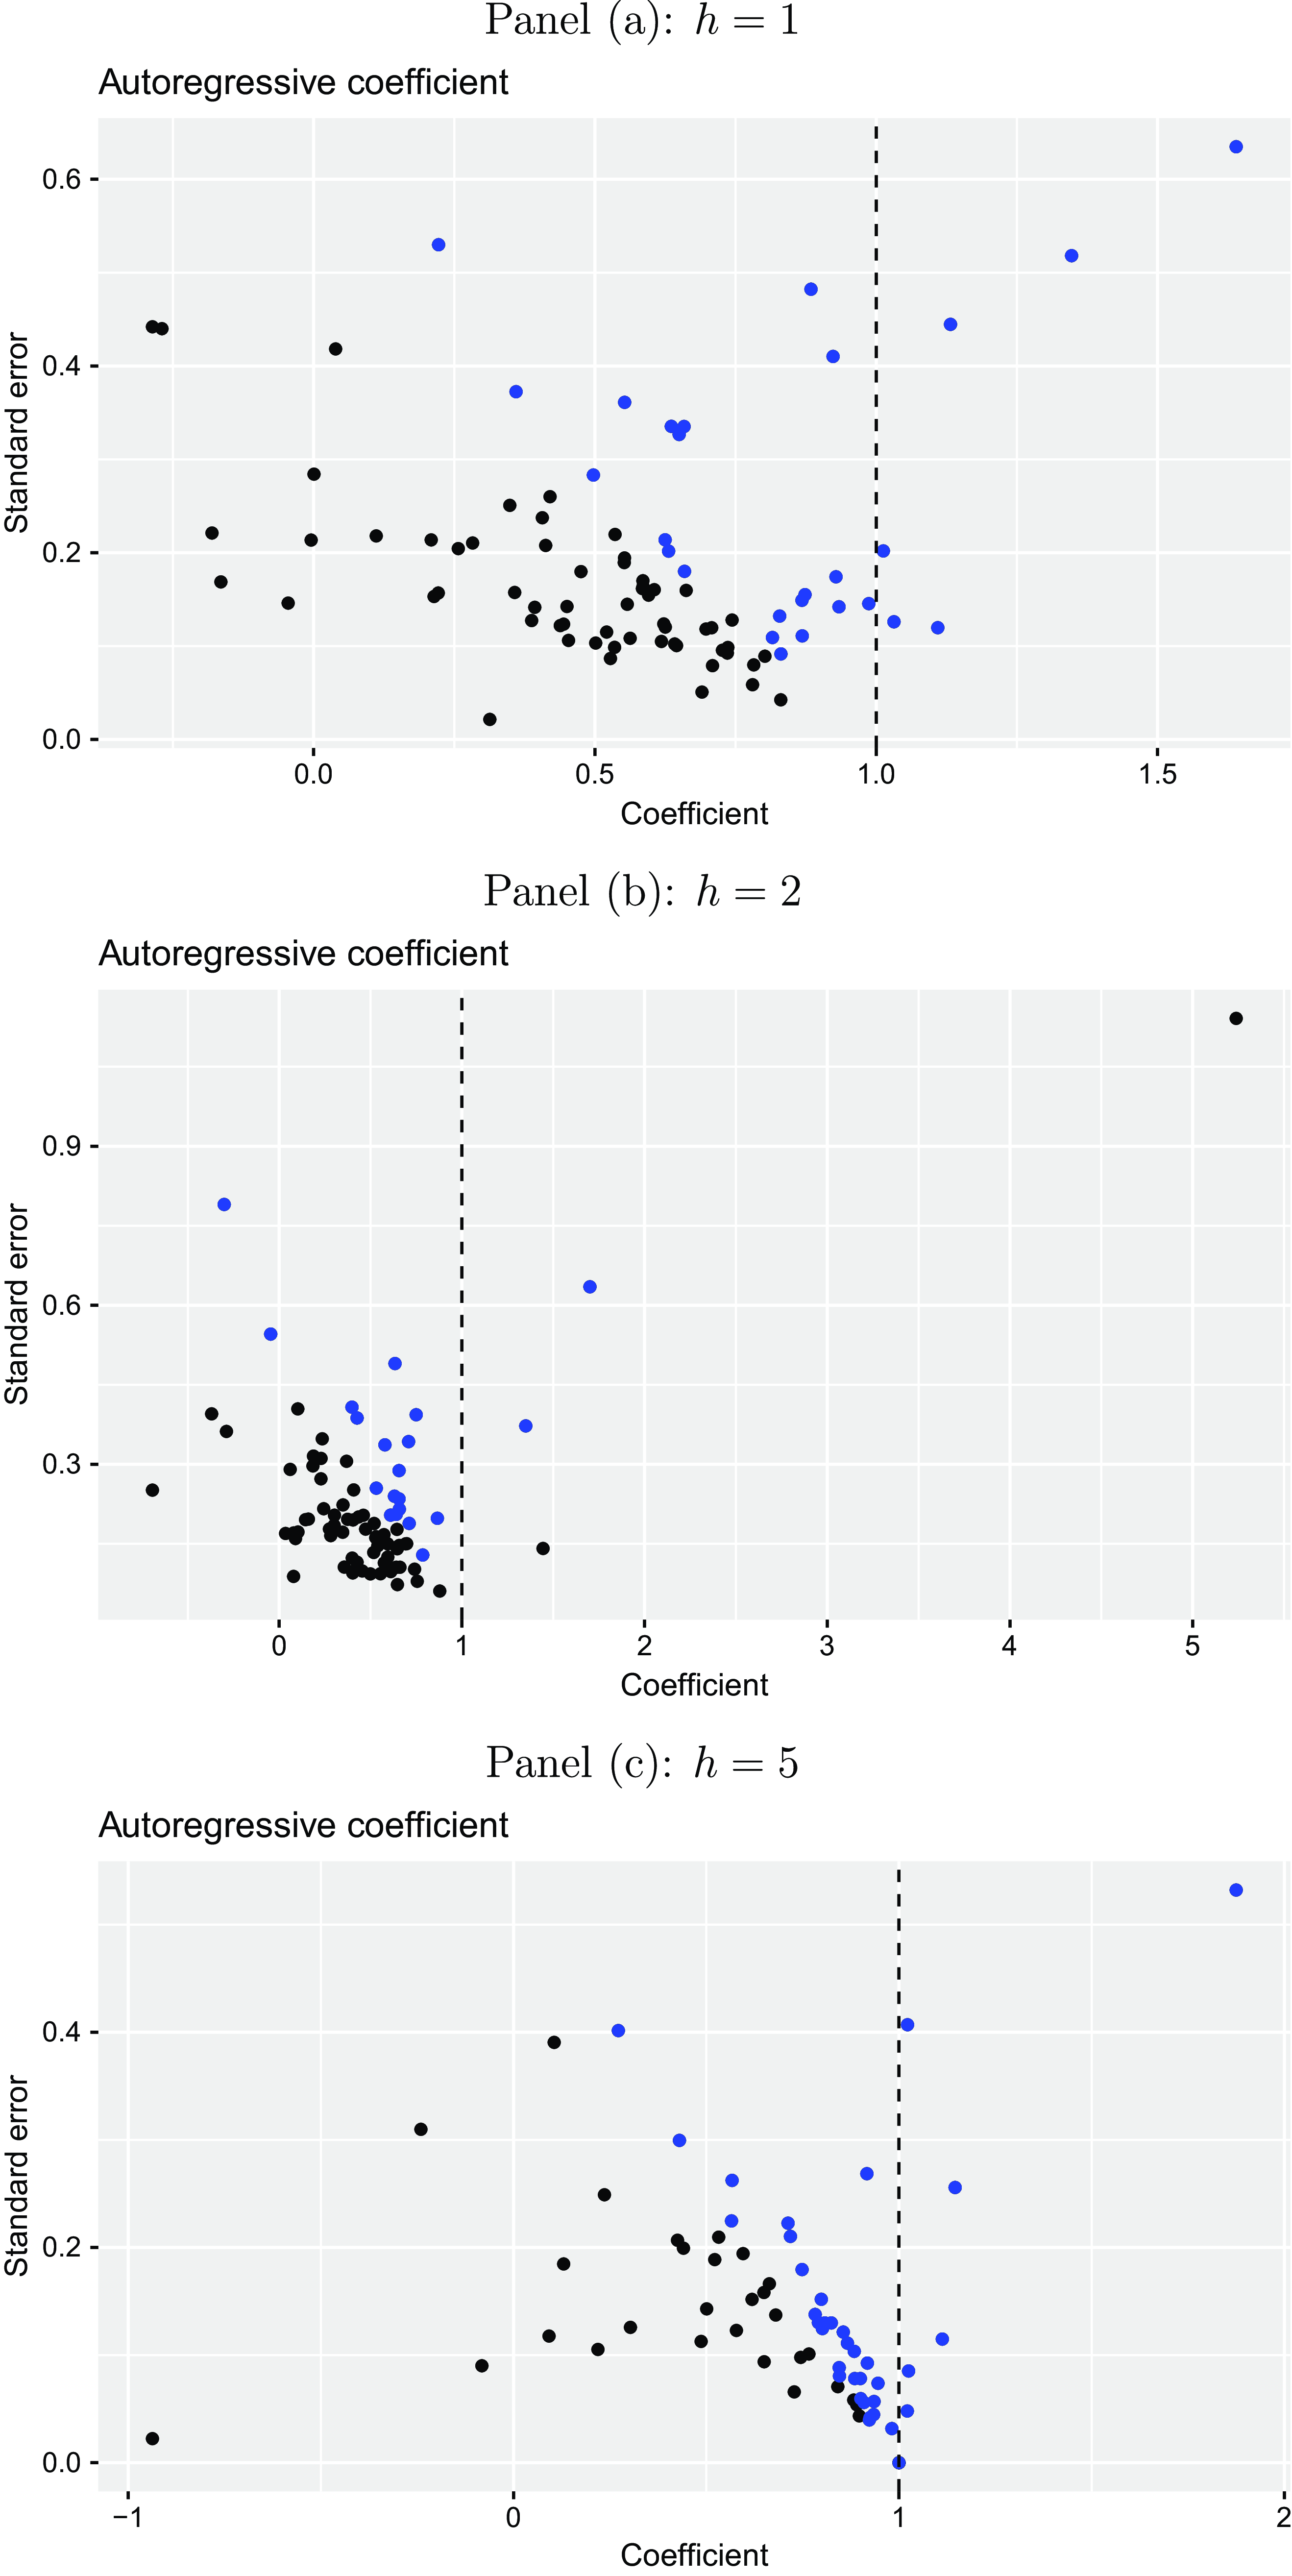
Individual autoregressive uncertainty coefficients. The plots illustrate the estimated autoregressive uncertainty coefficients and their standard errors from a regression of inflation uncertainty on unemployment uncertainty and lagged inflation uncertainty for the Euro Area on an individual forecaster level for different horizons $h$
(one-year-ahead, two-years-ahead, and five-years-ahead) for the period from 1999Q1 to 2023Q1 taken from the ECB Survey of Professional Forecasters. The blue colored points refer to coefficients, which are not significantly different from unity at a 5% level.
$h$
(one-year-ahead, two-years-ahead, and five-years-ahead) for the period from 1999Q1 to 2023Q1 taken from the ECB Survey of Professional Forecasters. The blue colored points refer to coefficients, which are not significantly different from unity at a 5% level.
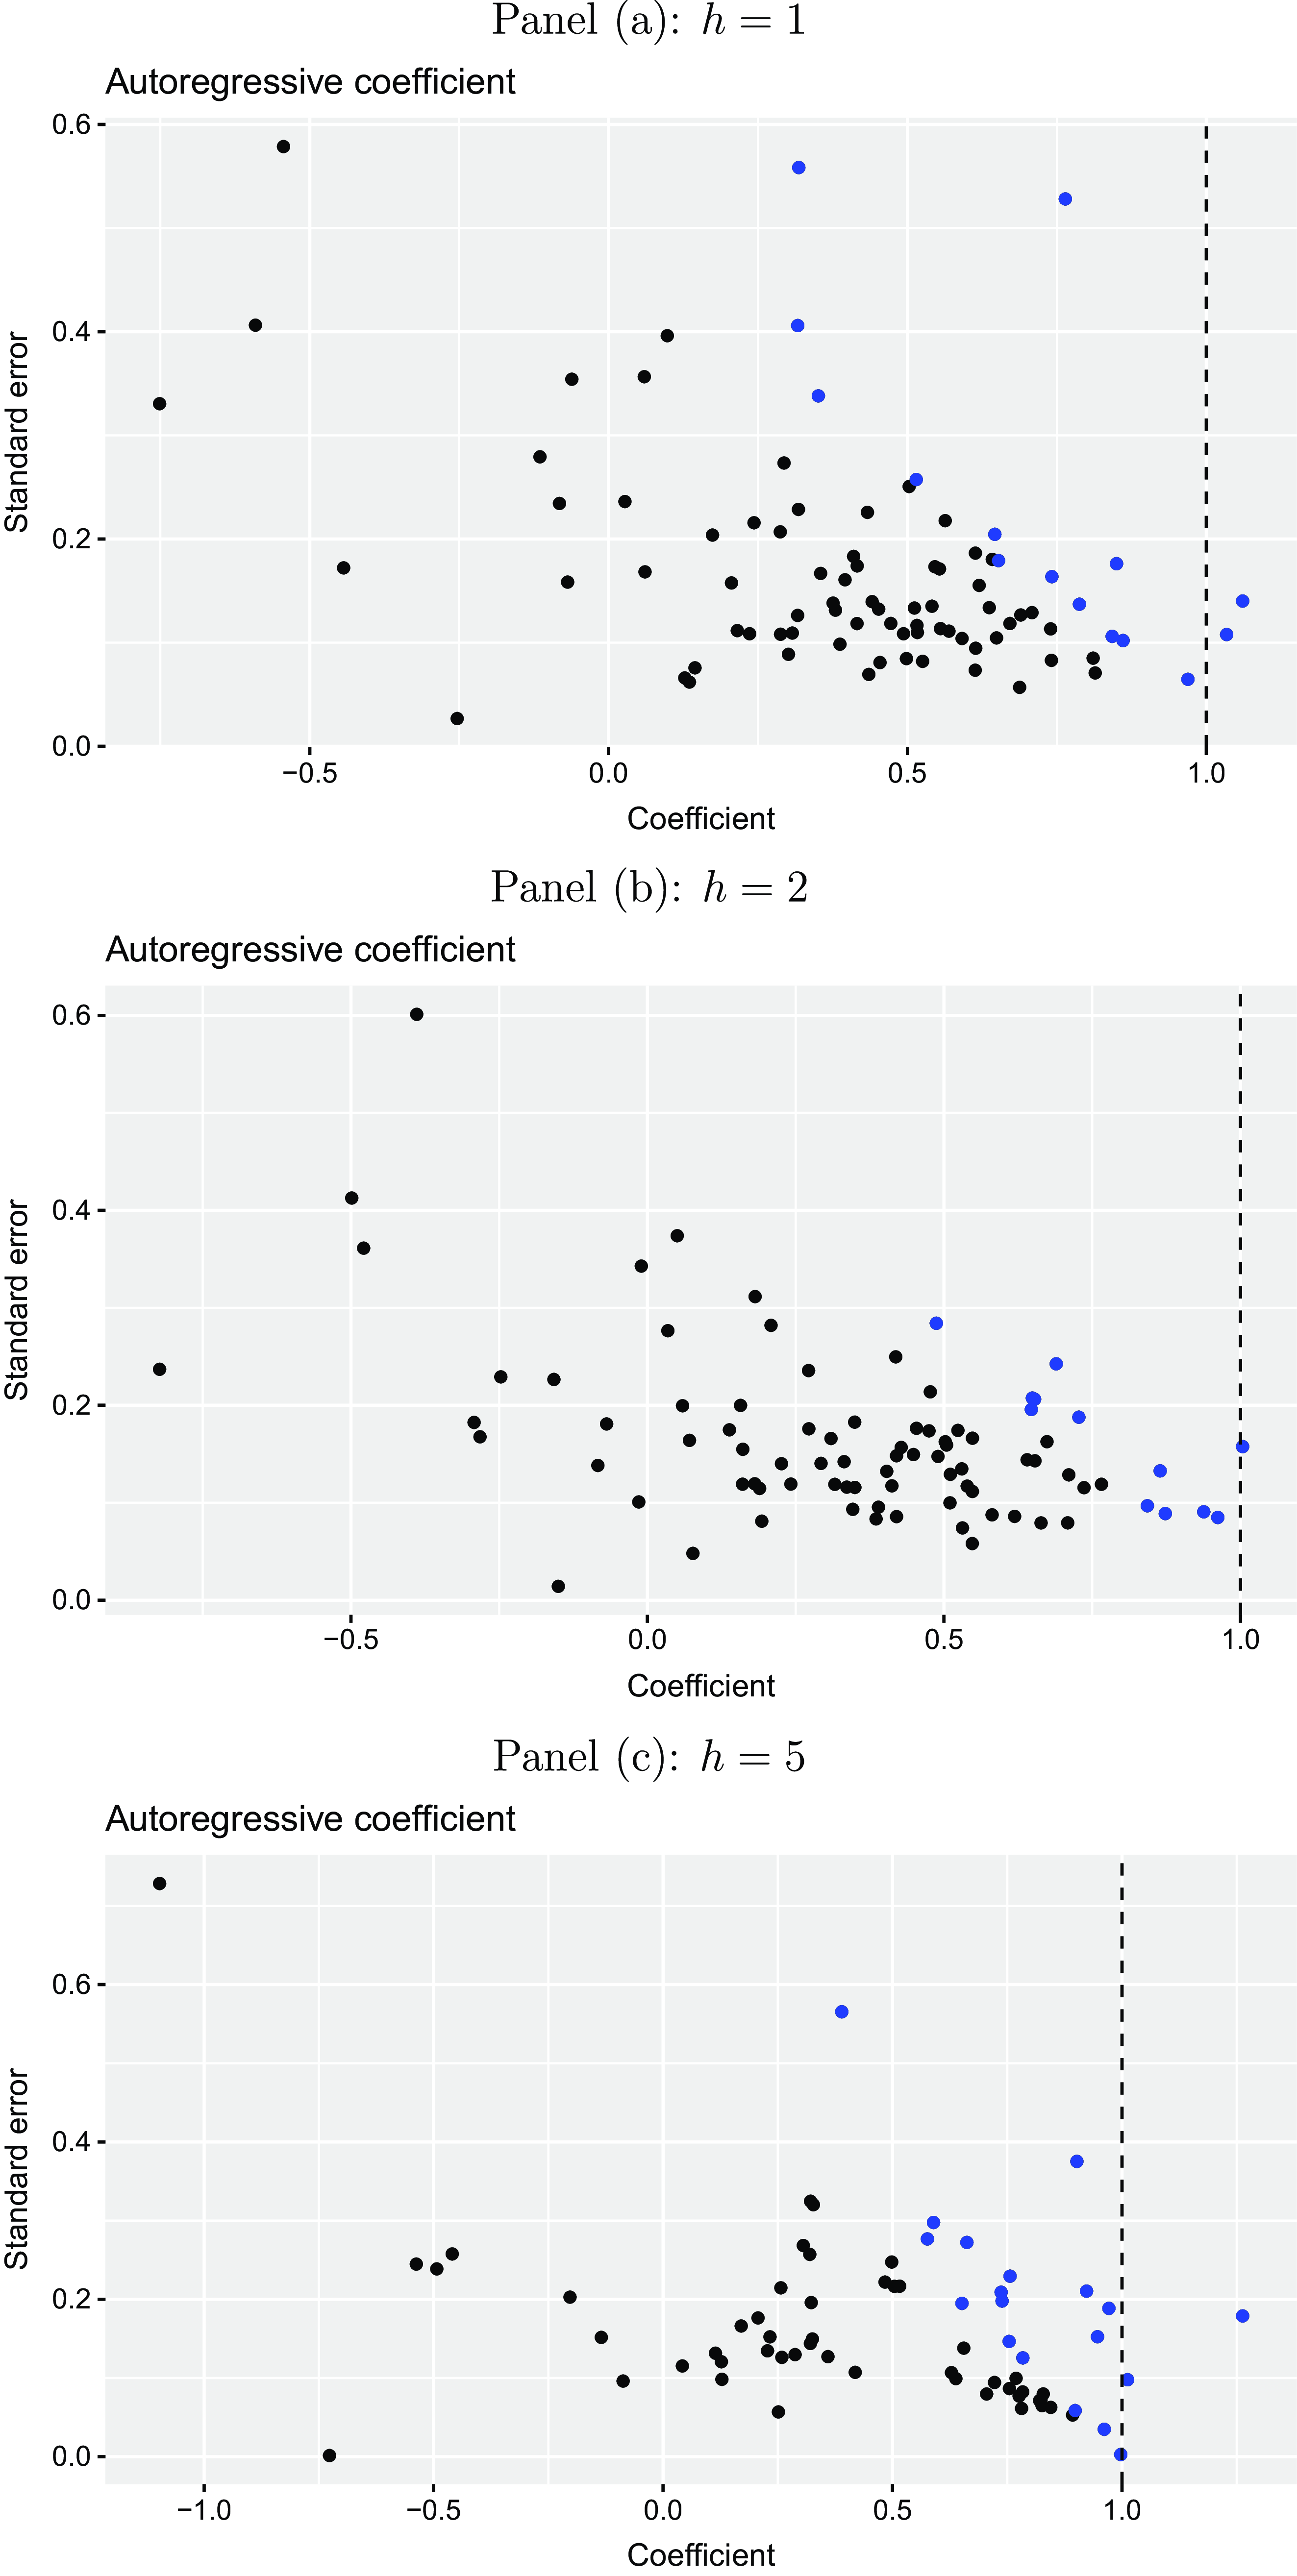
Time-varying autoregressive expectations coefficients. The plots illustrate the autoregressive expectations coefficients estimated by rolling-window fixed-effects regressions of inflation expectations on unemployment expectations and lagged inflation expectations for the Euro Area using panel data for different horizons $h$
(one-year-ahead, two-years-ahead, and five-years-ahead) for the period from 1999Q1 to 2023Q1 taken from the ECB Survey of Professional Forecasters. The red colored points refer to coefficients, which are significantly different from zero at a 5% level. The window size is 20 quarters (= five years).
$h$
(one-year-ahead, two-years-ahead, and five-years-ahead) for the period from 1999Q1 to 2023Q1 taken from the ECB Survey of Professional Forecasters. The red colored points refer to coefficients, which are significantly different from zero at a 5% level. The window size is 20 quarters (= five years).

Time-varying autoregressive uncertainty coefficients. The plots illustrate the autoregressive uncertainty coefficients estimated by rolling-window fixed effects regressions of inflation uncertainty on unemployment uncertainty and lagged inflation uncertainty for the Euro Area using panel data for different horizons $h$
(one-year-ahead, two-years-ahead, and five-years-ahead) for the period from 1999Q1 to 2023Q1 taken from the ECB Survey of Professional Forecasters. The red colored points refer to coefficients, which are significantly different from zero at a 5% level. The window size is 20 quarters (= five years).
$h$
(one-year-ahead, two-years-ahead, and five-years-ahead) for the period from 1999Q1 to 2023Q1 taken from the ECB Survey of Professional Forecasters. The red colored points refer to coefficients, which are significantly different from zero at a 5% level. The window size is 20 quarters (= five years).
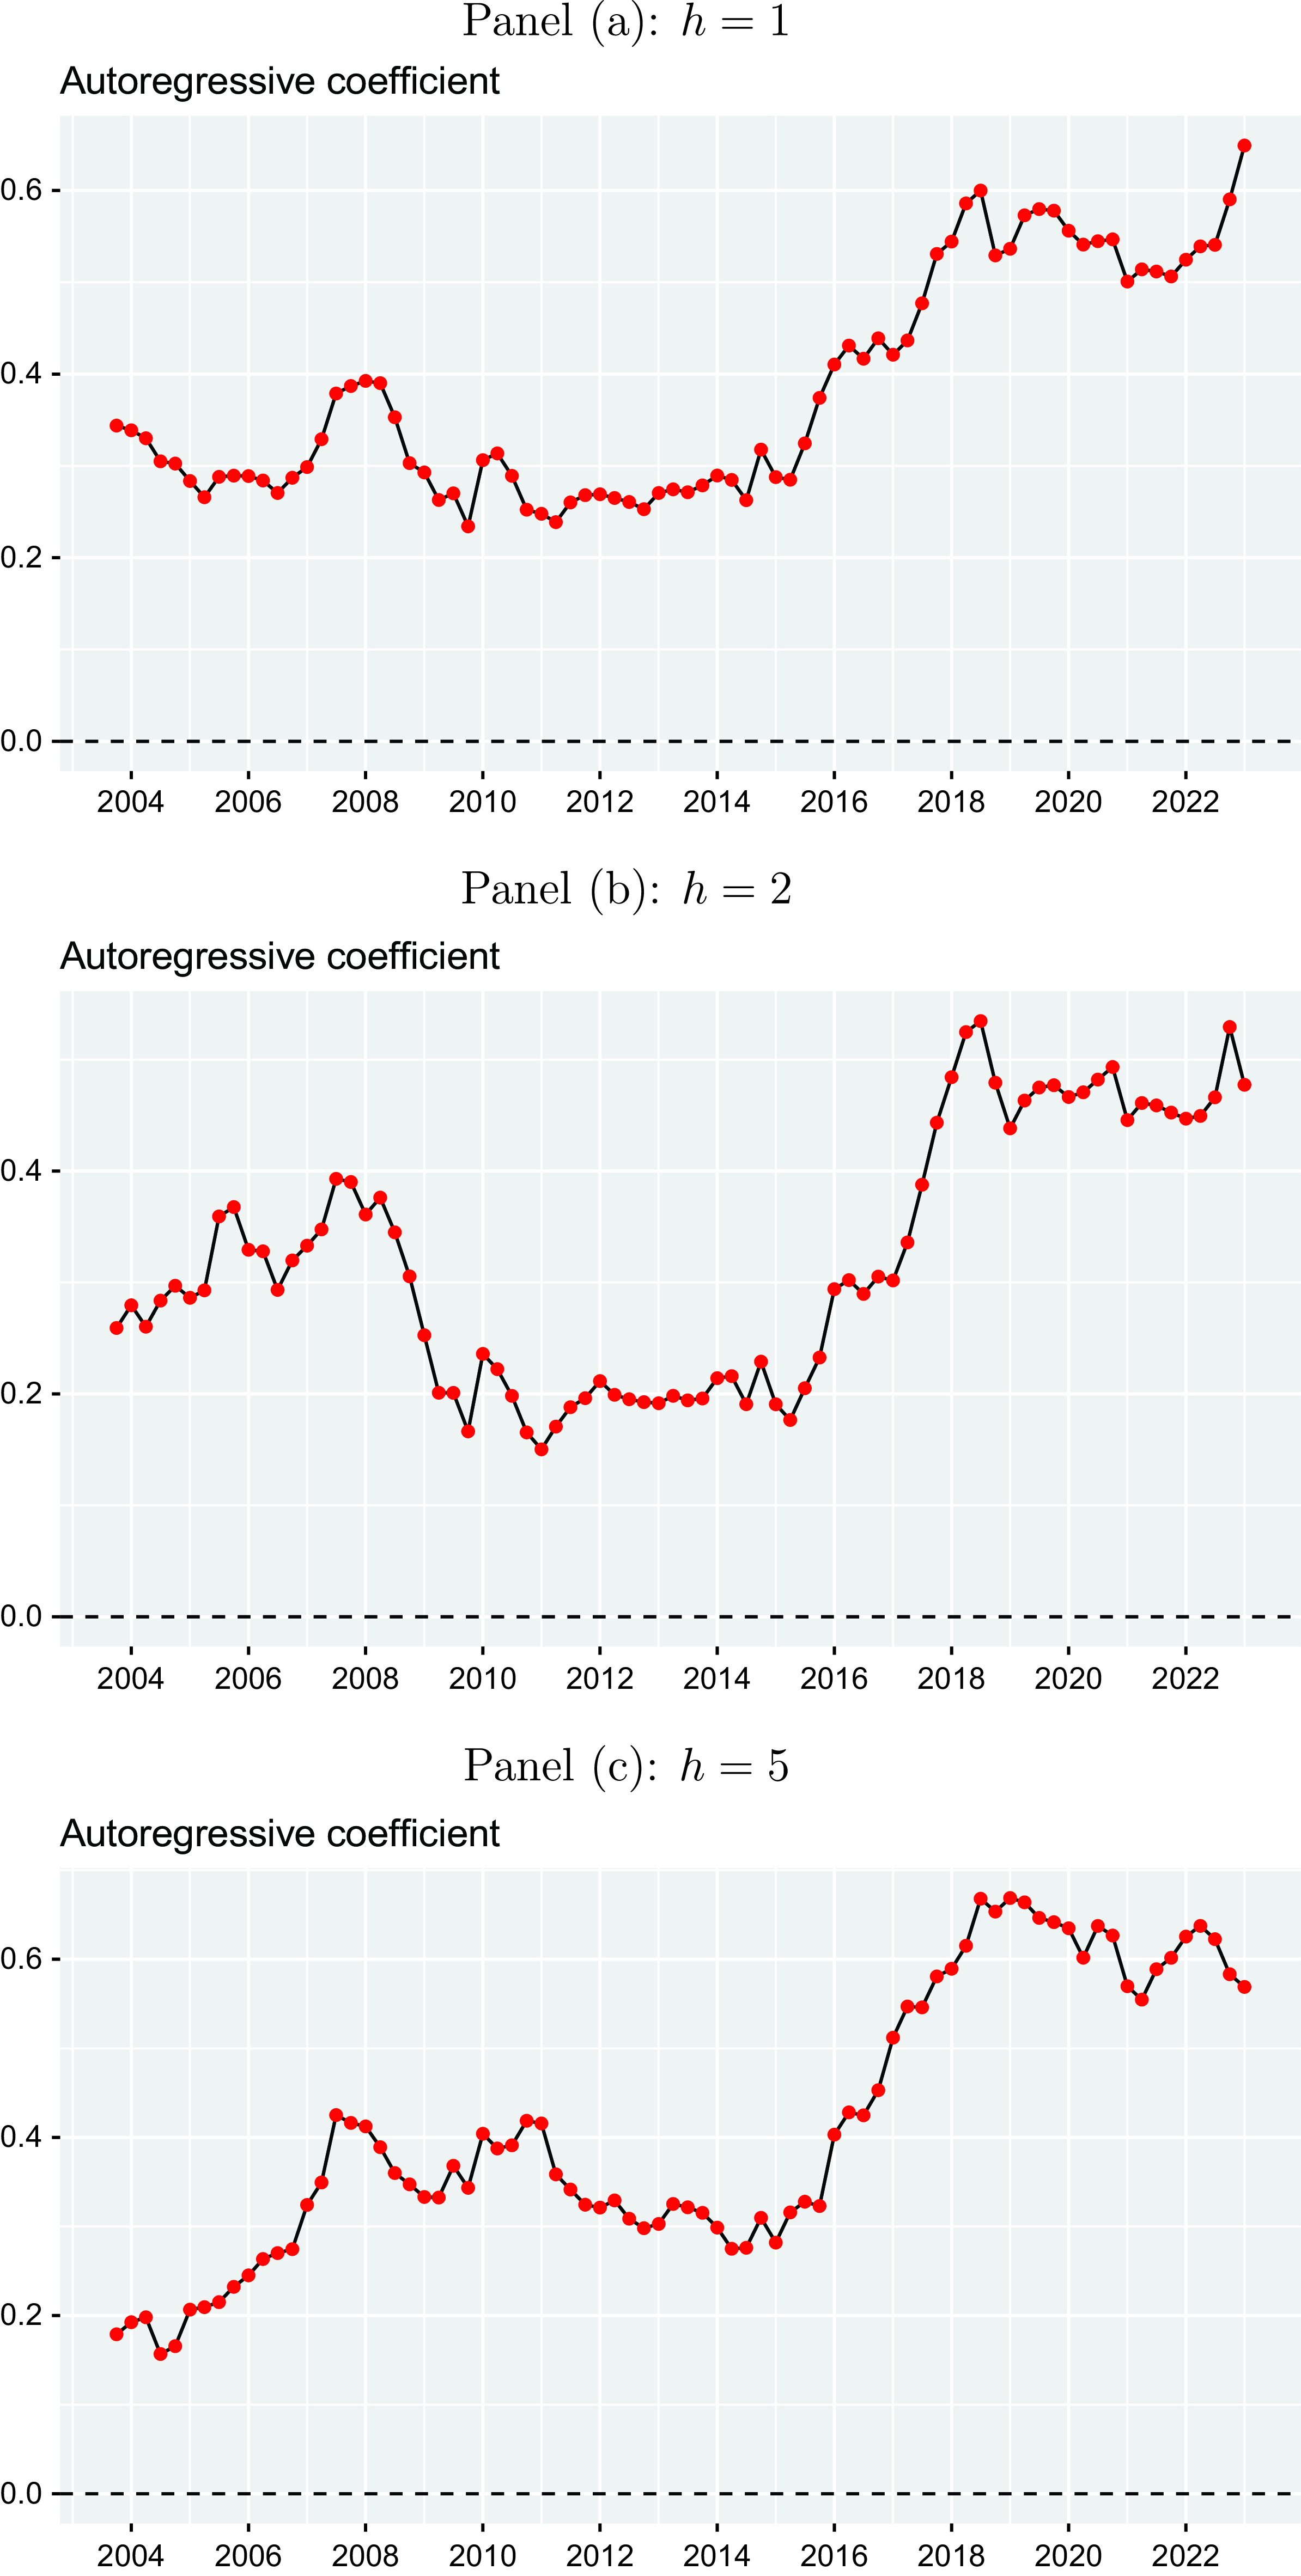


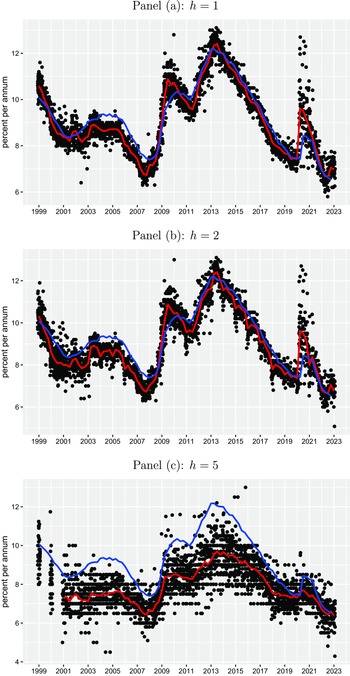


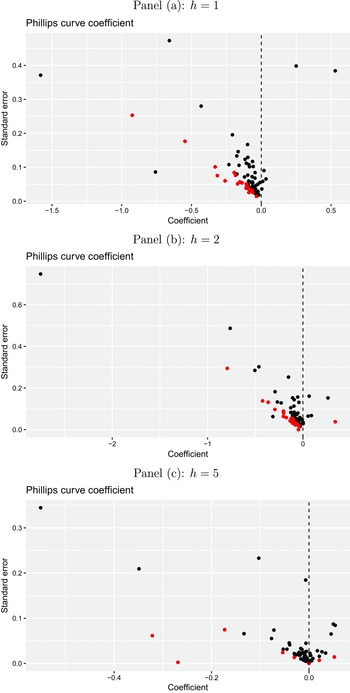


 Open access